
Submitted:
11 August 2026
Posted:
12 August 2026
You are already at the latest version
Abstract
This research focuses on the development of a robotic cell test bench for manufacturing variable-geometry tubular parts with minimal human intervention. The system integrates dual arm manipulation with cutting, welding, and coating stations, and was validated in collaboration with an industrial partner with strict requirements on weld strength, surface quality, and air leak rate. Stable and repeatable operation of the robotic cell was achieved through the characterization and optimization of key welding process parameters, particularly the robot end-effector travel speed (mm/s) and laser power (W). In addition, preliminary sealing evaluations demonstrated that the welded components could withstand internal pressures. These results highlight the influence of mechanical components, geometries, and material behavior, as well as the need for advanced digital tools. A preliminary automated path generation methodology is introduced to support adaptable robot trajectories. This research aims to advance composite manufacturing using industrial robotics and dedicated tooling for complex processes, while inspiring engineers and researchers to further automate repetitive and labour-intensive tasks that remain challenging to robotize.
Keywords:
dual-arm robotics
; thermoplastic composites
; laser welding
; automated trajectory generation
; aerospace manufacturing
1. Introduction
In recent years, research and industry have increasingly focused on the forming and processing of thermoplastic composite parts, driven in particular by the growing demand for lightweight, high-performance materials in sectors such as aerospace and automotive [1]. Compared with thermoset composites, thermoplastic composites offer several advantages, including shorter forming and consolidation times, chemical stability, recyclability, and weldability [2,3]. Despite these advantages, their industrial adoption, particularly in the aerospace sector, remains constrained by challenges related to manufacturing automation.
The manufacturing of thermoplastic composite parts in the aerospace industry remains largely dependent on manual operations. This is primarily due to the complexity of the manufacturing processes, the diversity of component geometries, and the relatively low production volumes characteristic of the sector [4,5]. While conventional industrial robotic systems are well suited to high-volume and highly repetitive operations, they often lack the flexibility required for small production batches and frequent changes in part geometry [6]. Introducing a new component may require substantial engineering effort, including the reprogramming of tool paths, adaptation of end-effectors, cell reconfiguration, process-speed calibration, and generation of new simulations and robot instructions. In addition, the design and fabrication of specialized tooling for individual part geometries can further reduce the economic viability of robotic automation. These constraints become increasingly significant as robots are expected to accommodate a wider range of parts, tasks, and trajectories.
This study addresses two key aspects toward advancing the automation of thermoplastic composite part manufacturing. First, it investigates the influence of process parameters, including operating speed, welding power, and material configuration, on the quality of components produced using robotic manufacturing techniques. Sample parts are manufactured and mechanically tested to assess and validate their performance. Second, the study presents the development of a numerical tool for automated robot trajectory generation, intended as a step toward a more comprehensive digital workflow for robotic composite manufacturing.
The remainder of this paper is organized as follows. First, relevant literature on thermoplastic composite manufacturing is reviewed, with emphasis on considerations informing the design of the robotic manufacturing cell. Current strategies for automating robot programming are then examined to establish the basis for the proposed trajectory-generation approach. The paper subsequently presents the research objectives, the methodology used to develop the trajectory-generation tool, the robotic cell and experimental setup, and the experimental validation. Finally, the main findings are summarized and directions for future work are discussed.
2. Literature Review
2.1. Welding of Thermoplastic Composite Materials
Thermoplastic composites are increasingly used in aerospace applications because of their high specific strength, low weight, and potential for automated manufacturing. The robotic cell developed in this work targets key manufacturing operations, including thermoforming, cutting, and welding. Although these processes are well established, their operating parameters must be adapted and optimized to meet the requirements of the targeted industrial application. Important thermoforming parameters include heating temperature, applied pressure, and consolidation time, whereas welding performance is primarily influenced by parameters such as applied power, pressure, and travel speed. Understanding the effects and interactions of these parameters requires consideration of both the manufacturing process and the underlying material behavior.
The use of composite materials in aerospace applications requires specialized manufacturing and qualification procedures [7]. Polymer matrix composites (PMCs) consist primarily of a reinforcing phase, which provides strength and stiffness, and a polymer matrix, which binds the reinforcement and transfers loads between reinforcing elements. Thermosetting matrices undergo irreversible curing, whereas thermoplastic matrices can be softened upon heating and subsequently reshaped, providing greater flexibility for manufacturing and assembly. Figure 1 illustrates a composite plate and its main constituent elements.
In the targeted application, the manufacturing of thermoplastic composite fluid-transfer ducts remains largely dependent on manual operations and lacks a standardized automated production process. Operations such as cutting, welding, thermoforming, and hot stamping must therefore be investigated and adapted for robotic manufacturing. Previous developments of the robotic cell and associated tooling have been reported in [8] and by Sauvain [9]. The present work builds upon these developments by further investigating process parameters and automated manufacturing strategies. Because aerospace ducts must satisfy stringent functional requirements, their qualification typically includes mechanical-strength and sealing tests.
Among the available joining methods, laser welding represents a promising solution for automating the assembly of thermoplastic composite structures, particularly for joining and sealing half-shell components. Successful laser welding requires precise control of process parameters, notably welding speed (mm/s) and laser power (W), to achieve joints that satisfy mechanical requirements. Suitable operating conditions may be identified through experiments or numerical modeling; however, experimental characterization remains necessary to validate the resulting joint quality. Because welding behavior depends strongly on material properties, joint configuration, heat transfer, and process conditions, no universal set of parameters can guarantee defect-free joints across all thermoplastic composite applications.
Several joining strategies can be considered for thermoplastic composites, as illustrated in Figure 2. Mechanical fastening is widely used in aerospace because it provides reliable structural connections; however, bolts, screws, and rivets add weight, require additional manufacturing operations, and may introduce local stress concentrations. Adhesive bonding can provide a favorable strength-to-weight ratio while simplifying joint geometry [3]. Nevertheless, adhesive processes require careful control of factors such as curing or drying conditions, humidity, temperature, and surface preparation, which may complicate their integration into a fully automated manufacturing process. Welding is therefore particularly attractive for robotic processing of thermoplastic composites because it can rapidly create joints without requiring additional fastening material. Most thermoplastic welding techniques rely on locally heating the polymer matrix above its melting temperature while applying pressure to promote intimate contact and consolidation at the interface [2].
Mechanical characterization of welded samples is essential for validating the manufacturing process. The appropriate evaluation method depends on the geometry, function, and expected loading conditions of the component. Bonded and welded interfaces can generally be subjected to three fundamental fracture-loading modes: opening (Mode I), in-plane shear (Mode II), and out-of-plane shear (Mode III) [13]. For the type of lap joint considered in this work, tensile loading can be used to characterize the mechanical resistance of the welded interface and quantify its apparent shear strength. Tensile tests are used to quantify the shear strength of welded joints, typically expressed in terms of stress and strain .
2.2. Generation of Robot Tool Paths
The development of a flexible robotic cell for cutting and laser welding reinforced thermoplastic components requires programming methods capable of reducing the engineering effort associated with conventional manual robot programming, particularly for low-volume production involving frequent variations in part geometry. CAD-to-Path (C2P) approaches address this challenge by extracting geometric information from CAD models and using it to generate tool trajectories and robot instructions through numerical processing and simulation. Such approaches constitute an important component of Automatic Offline Programming (AOLP).
In conventional Offline Programming (OLP), robot trajectories are generally defined within a simulation environment by manually selecting geometric features and specifying process-related waypoints. Wu et al. [14], for example, demonstrated such an approach for robotic welding applications. More recent developments combine OLP environments with Application Programming Interfaces (APIs), allowing portions of the programming workflow to be automated and facilitating the implementation of trajectory-generation and optimization algorithms.
Several methods have been proposed for automated trajectory generation in welding and surface-processing applications. For example, [15] introduced a waypoint-generation strategy based on two- and three-dimensional interpolation of meshed CAD geometries. Although this approach contributes toward automated CAM development, its implementation remains dependent on commercial CAD software and MATLAB. Similarly, IRoSim [16], developed using the SolidWorks API and displayed on Figure 3, integrates mechanical design and robotic simulation within a unified CAD environment. While this framework facilitates robot programming, it remains dependent on proprietary software and requires trajectory information to be redefined when the geometry of the manufactured component changes. Other CAD-based approaches, such as [17], reduce the required user input by defining a limited set of waypoints and registering the CAD model with the physical robotic setup. However, such methods are not specifically designed to automatically generate the complex curved trajectories encountered in thermoplastic composite duct manufacturing.
These limitations highlight the need for lightweight, open-source numerical tools capable of generating complete robotic trajectories from CAD geometry and a limited number of high-level process parameters. Reducing the amount of application-specific manual programming constitutes an important step toward more automated offline programming workflows.
An additional consideration arises from the configuration of the robotic cell investigated in this work. Most conventional trajectory-planning approaches assume that the workpiece remains fixed while a robot-mounted tool follows the desired processing path. In the proposed setup, however, the thermoplastic component is mounted on the robot end-effector and manipulated relative to a stationary processing tool. Consequently, the desired manufacturing trajectory must be expressed in terms of the motion of the workpiece rather than that of the tool. This configuration introduces additional considerations related to coordinate transformations, robot kinematics, and velocity control, particularly because the relative velocity between the workpiece and the processing tool must remain consistent with the prescribed process parameters.
Standardized CAD representations provide a useful basis for addressing these challenges. STEP files, for example, can represent complex geometries, including Non-Uniform Rational B-Spline (NURBS) surfaces, within the ISO 10303 framework [18]. Geometry-processing libraries such as Open Cascade Technology (OCCT) can then be used to access and manipulate this CAD information programmatically. Bedaka and Lin [19] demonstrated the use of such tools for automated processing of CAD geometry without requiring direct manipulation of the underlying STEP file representation. This type of approach is particularly attractive for developing software-independent trajectory-generation tools for robotic thermoplastic composite manufacturing.
More broadly, AOLP research increasingly focuses on extracting geometric and semantic information directly from CAD models to minimize user intervention and automatically generate executable robot trajectories. Representative applications include automated spray-painting trajectories over complex surfaces [20], adaptive tool-path generation for machining complex geometries [21], and semi-automated inspection-path planning for aerospace non-destructive testing [22]. These studies demonstrate the potential of CAD-driven robot programming across a variety of manufacturing processes.
Despite these advances, no generalized or standardized AOLP methodology has emerged across robotic manufacturing applications. Although the literature exhibits broad similarities in the principal stages of an automated programming workflow, the methods used to extract geometry, identify relevant features, generate process trajectories, and convert these trajectories into executable robot commands remain highly application dependent. This motivates the development of the trajectory-generation approach presented in this work, which targets the specific requirements of robotic cutting and laser welding of thermoplastic composite components.
The following sections present the research objectives, the development of the proposed trajectory-generation tool, the robotic cell and experimental setup, and the resulting experimental validation.
3. OBJECTIVES
The primary objective of this research is to demonstrate the feasibility of automating the manufacturing of thermoplastic composite fluid-transfer ducts while accommodating the substantial geometric variability encountered in aerospace applications. To achieve this objective, the robotic manufacturing cell must be capable of adapting to different duct geometries while satisfying the process and mechanical requirements of the targeted application. Figure 4 illustrates a typical aircraft ducting system and highlights the geometric diversity of the components required for cabin air distribution.
This general objective is addressed through two complementary aspects. First, a numerical trajectory-generation approach is developed to reduce the programming effort required when adapting the robotic cell to different part geometries. The objective is to automatically derive suitable robot trajectories from the geometry of the component while accounting for the process parameters required for cutting and welding operations. Second, the manufacturing process is experimentally characterized to determine the influence of key operating parameters, particularly welding power and travel speed, on the mechanical performance of the resulting joints.
The robotic cell, its associated tooling, and the proposed programming approach are then evaluated through the manufacturing and mechanical characterization of representative thermoplastic composite samples and components. In particular, the mechanical resistance of welded joints is assessed to identify suitable processing conditions and evaluate the repeatability of the manufacturing process. Together, these developments aim to demonstrate the potential of the proposed robotic cell as a flexible manufacturing platform for thermoplastic composite ducts with varying geometries.
4. Robotic Cell Development
This section presents the development of the robotic manufacturing cell and the two complementary research activities investigated in this work. The first concerns the initial development of a numerical pipeline for automated trajectory generation, intended to reduce the programming effort required when adapting the cell to different duct geometries. The second focuses on the development and experimental validation of the cutting and welding processes through the fabrication and mechanical characterization of representative thermoplastic composite components.
4.1. Research Equipment
The robotic cell consists of two industrial six-degree-of-freedom (6-DOF) manipulators, two composite cutting stations, one dedicated to each robot, and a laser welding station positioned between the two manipulators. Robot trajectories and control programs are currently developed using RoboDK and its Python API, enabling offline simulation, trajectory validation, and generation of executable robot programs. For mechanical characterization, two primary test benches were employed. Figure 5 illustrates the experimental setup used for tensile testing of the welded specimens. The weld seam shear strength (N) was evaluated for both 2D and 3D duct samples. Parameter combinations yielding the highest shear resistance were selected for further investigation. Shear tests were performed on 2D duct specimens, with four samples tested for each welding parameter set using an INSTRON 5980 Series universal testing machine. Tensile loading was applied in accordance with the ASTM D3039 standard for polymer matrix composite materials, using a crosshead displacement rate of 0.08 inches per minute. This standard defines the complete testing procedure, including specimen geometry, loading rate, surface preparation, gauge length positioning, and pre-load conditions, and is particularly appropriate for thin composite laminates reinforced with high-modulus fibers.
The leak-test setup shown in Figure 6 enables the ducts to be pressurized under controlled conditions and provides a means of assessing their sealing performance and mechanical integrity. Both qualitative leak detection and pressure-decay measurements are used as preliminary indicators of the ability of the manufactured ducts to satisfy the functional requirements of the targeted application.
4.2. Initial Trajectory-Generation Pipeline
Automated robot trajectory generation is an important component of a flexible manufacturing cell intended for low-volume production involving substantial part variability. In this work, a numerical pipeline is developed to generate manufacturing trajectories directly from the CAD geometry of fluid-transfer ducts, thereby reducing the amount of manual robot programming required for each new component. The approach processes a three-dimensional CAD model and generates a discrete sequence of robot poses describing both the position and local orientation (Yaw, Pitch, Roll) required along the manufacturing trajectory. The resulting trajectory is subsequently transferred to RoboDK for simulation, validation, and robot-code generation. The proposed trajectory-generation pipeline consists of the following main steps:
- 1.
- Importing the three-dimensional model from a STEP file;
- 2.
- Extracting the relevant geometric primitives from the model;
- 3.
- Computing an Oriented Bounding Box (OBB) based on the part geometry;
- 4.
- Generating the welding plane and its associated normal vector;
- 5.
- Redefining the global reference frame according to the part geometry;
- 6.
- Discretizing the central trajectory of the part;
- 7.
- Defining the local orientation at each trajectory point;
- 8.
- Adapting the generated trajectory for Robot 1 and Robot 2; and
- 9.
- Exporting the resulting trajectory to the offline programming environment for validation, simulation, and robot-code post-processing.
Figure 7 highlights the three key steps of the path generation algorithm. It is important to note that the main components of a discrete path can be defined using the Frenet frame formulation. Each discrete point along the trajectory is represented by a 3D position coordinate (x,y,z) and an orientation defined by three orthogonal unit vectors (tangent, normal, and binormal), forming a local coordinate system at each point along the robot path. This discretization can be expressed using the following 4×4 transformation matrix :
where represents the position of the kth trajectory point, while , , and are three-dimensional unit vectors defining the tangent, normal, and binormal directions, respectively. These vectors form the rotation matrix and therefore define the local orientation associated with each trajectory point. The resulting sequence of homogeneous transformations provides the pose information required for subsequent trajectory adaptation, simulation, and robot-program generation.
4.3. Development and Validation of the Cutting and Welding Processes
The second component of this work concerns the fabrication and experimental validation of parts produced using the robotic cell. Four part configurations were considered, encompassing both straight (2D) and curved (3D) reinforced thermoplastic ducts, as well as foam-based duct components. Figure 8 presents the three-dimensional model of a representative reinforced thermoplastic duct. Each duct consists primarily of two half-shells, denoted R1 and R2, which are handled by Robots R1 and R2, respectively.
Dual-arm manipulation is used to cooperatively position and assemble the two half-shells within the multi-station robotic cell. Accurate control of the relative pose between the two manipulators is particularly important during laser welding and during the associated approach, positioning, and repositioning motions. As illustrated in Figure 9, a Master–Follower control strategy is used, with Robot R1 acting as the guiding robot and Robot R2 following the coordinated motion. Each manipulator holds one half-shell while the two components are positioned to form the complete duct and expose the interfaces required for welding.
Additional manufacturing processes, including cutting, ultrasonic welding, and thermal coating, are coordinated within the robotic cell, although the two robots do not necessarily execute identical tasks or sequences. Using nominal welding parameters of 100 W and 12 mm/s, testing was extended to 3D ducts. After minor adjustments to robot speed and tooling clearance, successful fabrication of 3D geometries was achieved. To validate the automated workflow, a 3D Polyetherimide (PEI) duct with SPUD and three reinforced thermoplastic ducts were repeatedly produced in fully automatic mode without human intervention or process-related downtime. These results confirm the feasibility of the approach for both 2D and 3D reinforced thermoplastic duct manufacturing.
The robotic cell uses laser transmission welding (LTW) with a near-infrared (NIR) laser to locally heat the joint interface. As illustrated in Figure 10, the laser radiation passes through the semi-transparent layer and is absorbed by the underlying absorbing (black) layer. The resulting localized heating raises the temperature at the interface and enables fusion of the thermoplastic material under applied contact pressure.
The influence of welding parameters was initially investigated using 2D duct specimens. Laser power and robot travel speed were varied to determine operating conditions providing adequate mechanical resistance of the welded joint. Four specimens were tested for each parameter combination using an INSTRON 5980 Series universal testing machine at a crosshead displacement rate of 0.08 in/min. Tensile loading was applied to the welded specimens, and the breaking load of the joint was used as the primary metric for comparing welding conditions.
The results are typically expressed in terms of stress and strain . Equations 2 and 3 provide these values. Stress () is calculated by dividing the applied force (F) by the original cross-sectional area perpendicular to the load direction (), while strain () is the ratio of the elongation (l - ) to the initial length ().
Figure 11 summarizes the experimental workflow. First, the dual-arm robotic cell manufactures the duct specimens using selected combinations of robot travel speed and NIR laser power. The resulting parts are then visually inspected to identify apparent welding defects. Finally, the ducts are sectioned into specimens for mechanical testing, and the resulting breaking loads are recorded for analysis.
Figure 12 displays the average breaking strength (in KN) of the tested samples under various operating parameters. Each curve corresponds to a different laser power. Among the tested conditions, a laser power of 100 W combined with a travel speed of 12 mm/s produced the highest average breaking load, approximately 1.5 kN. These parameters were therefore selected as the nominal welding conditions for subsequent experiments.
Increasing laser power beyond this point likely leads to excessive heating and thermal degradation of the polymer matrix, resulting in reduced weld shear strength. These results indicate that thermal degradation dominates at higher power levels, emphasizing the importance of maintaining a delicate balance between sufficient fusion and overheating. This highlights the narrow processing window of thermoplastic laser welding and the need for precise control of both power and travel speed. In the air leak test procedure, the duct is installed on the test bench and gradually pressurized in 2.5 psi steps, starting at 2.5 psi and increasing up to a maximum of 15 psi. At each step, the duct is inspected by spraying a soap-water solution on its surface to detect leaks, indicated by the formation of air bubbles as shown in Figure 13. This stepwise method helps assess how leakage evolves under increasing pressure and ensures the welded joints remain structurally sound.
The tests demonstrate that 2D ducts withstand the maximum pressure of 15 psi without showing significant degradation. However, as pressure increases, some leakage is observed. While the setup in Figure 13 does not allow precise measurement of leakage rates at constant pressure, it provides an initial qualitative indication of the parts ability to maintain initial pressure. In the aerospace industry, performance requirements, particularly those related to the leakage rate of polymer ducts, can vary considerably. These thresholds depend on the specific function of the duct within the aircraft, as well as the technical specifications set by each manufacturer. Leakage rates are typically expressed in cubic feet per minute per square foot (cfm/ft²), following an air leakage standard provided by the industrial partner. This standard is derived from a proprietary, application-specific context that remains undisclosed.
Leakage evaluation tests are conducted using the same test bench, starting with an initial internal pressure of 2.5 psi. The air supply is then shut off, and the pressure decay over time is recorded. This data is used in the ideal gas law to estimate the volume of air lost. Figure 14 shows a graph of the internal pressure drop over time. Due to minor inconsistencies during setup, the initial pressure could not be fixed precisely at 2.5 psi; instead, a starting average pressure of 2.8 psi was recorded at time zero.
Figure 15 shows the final outcome of a reinforced thermoplastic 3D fluid transfer duct produced using the selected welding parameters.The foam cutting station also presented challenges due to material behavior during the cutting process. The force generated by the interaction between the oscillating blade and the foam caused deformation and tearing in the cutting area, rather than producing a clean cut. Figure 16 a) shows the foam half-shell preform before cutting, while Figure 16 b) illustrates the desired final sections for both Robot R1 and Robot R2. Despite multiple trials involving adjustments of cutting parameters such as speed, tooling design, and robot offset clean cuts could not be achieved in the robot cell. Figure 17 highlights the effects of cutting forces on 3D-shaped foam. Due to its softness and flexibility, the foam cannot withstand the localized pressure from the blade, which exceeds its minimal elastic deformation threshold, resulting in tearing rather than clean separation.
Several potential causes of the cutting failure were investigated. The oscillating blade was replaced to exclude blade wear as the primary cause, and the cutting tool was redesigned to improve guidance and support of the foam during the operation. Adjustments to robot speed and tool offset were also evaluated. Despite these modifications, sufficiently clean and repeatable cuts could not be achieved using the oscillating-blade configuration.
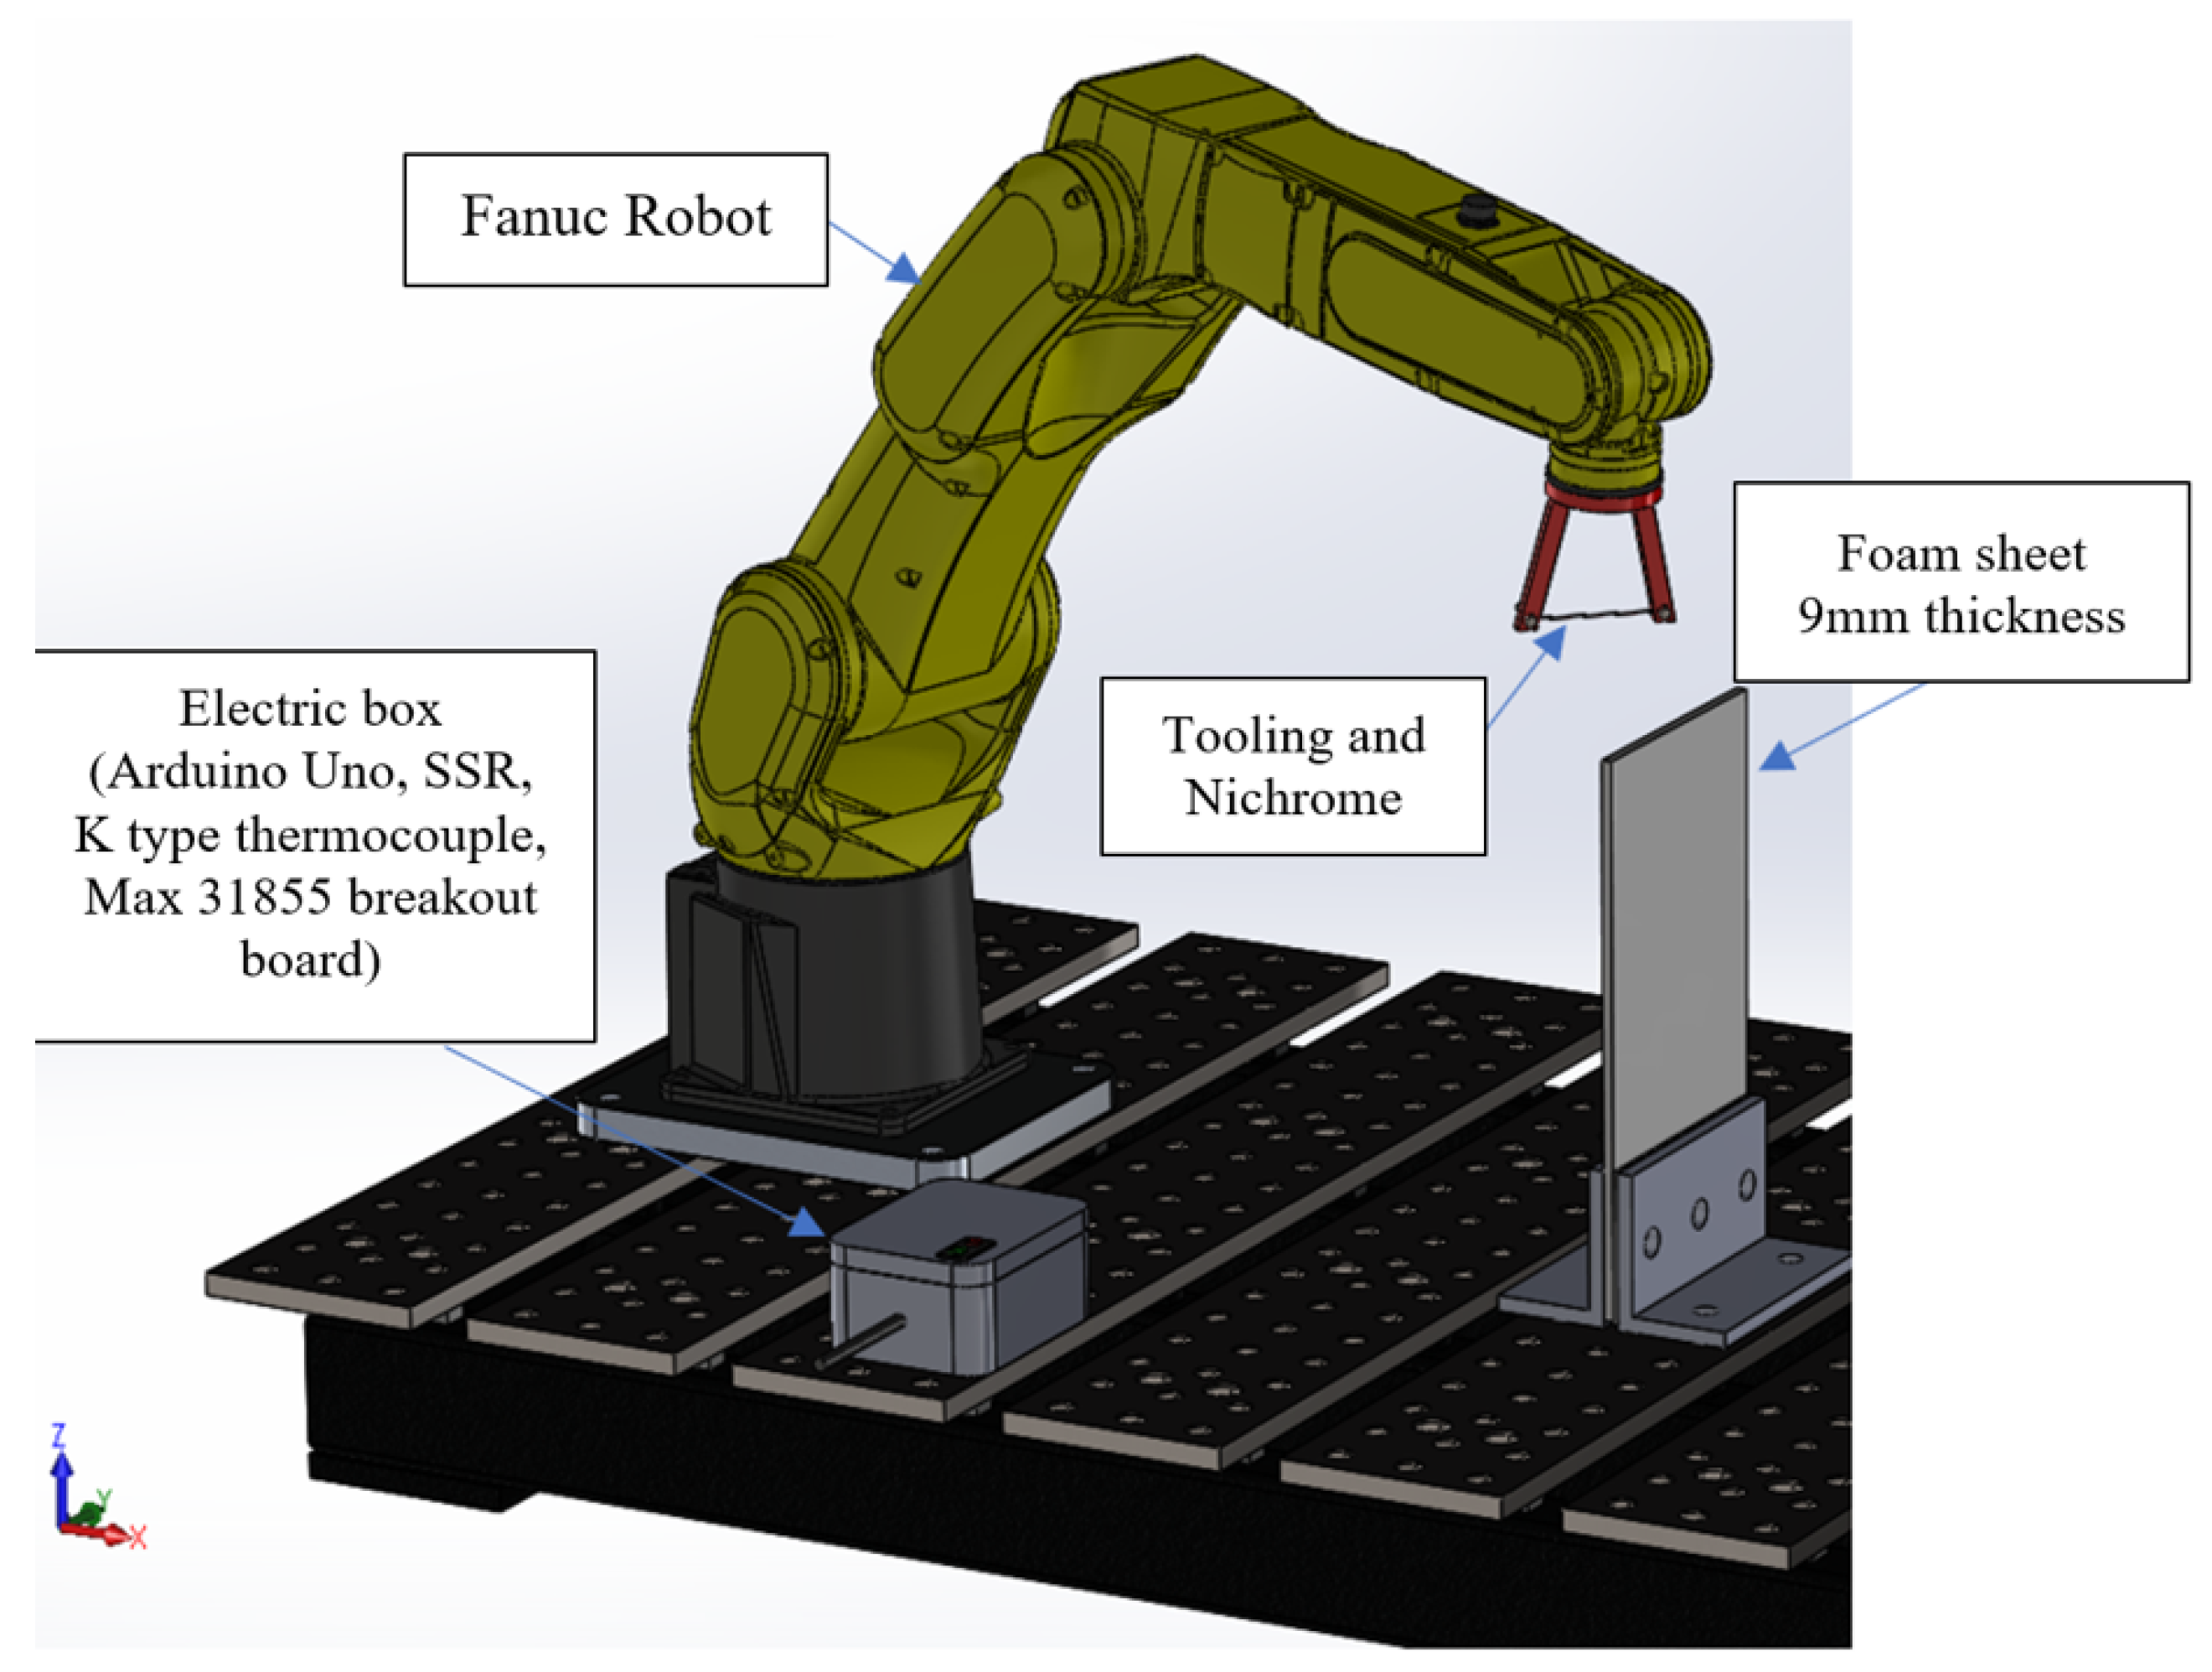
An alternative cutting method based on a heated Nichrome wire was therefore investigated. Figure 18 presents the corresponding experimental setup. Joule heating of the wire enables the foam to be separated with substantially lower mechanical cutting forces, thereby reducing deformation of the compliant workpiece.
Preliminary manual experiments produced cleaner and more consistent cuts than those obtained with the oscillating blade. The proposed setup includes a thermocouple for temperature monitoring, while the main controllable process parameters include electrical current, applied voltage, wire tension, and robot travel speed. Maintaining sufficient and stable wire tension is particularly important to limit wire deformation and reduce the risk of breakage during cutting.
Different Nichrome wire diameters were evaluated, with a 36-gauge wire (0.19 mm diameter) providing the most promising results among the tested configurations. Further investigation is required to determine the appropriate compromise between wire mechanical strength, thermal response, and cutting resistance. The effect of the resulting surface quality on subsequent assembly and welding performance also remains to be quantified. Future work will therefore focus on characterizing the effects of wire diameter, electrical current, and robot travel speed on cutting quality and on the mechanical performance of the resulting welded joints.
5. Conclusions
Aerospace manufacturing is characterized by low production volumes, substantial geometric variability, and stringent process requirements, making conventional robotic automation difficult to implement economically. In this context, the manufacturing of thermoplastic composite fluid-transfer ducts remains largely dependent on manual operations. This work investigated the feasibility of increasing the level of automation through the development of a dual-arm robotic manufacturing cell, with emphasis on process characterization, mechanical and functional validation, and the initial development of a numerical pipeline for automated trajectory generation.
Experimental characterization of the laser transmission welding process showed that, among the evaluated parameter combinations, a robot travel speed of 12 mm/s and a laser power of 100 W produced the highest average breaking load, approximately 1.5 kN. These conditions were subsequently used as nominal parameters for manufacturing three-dimensional duct geometries. Reinforced thermoplastic ducts were successfully produced in automatic operation, demonstrating the feasibility of extending the proposed robotic approach from straight to more complex curved components. Preliminary sealing experiments further showed that the manufactured ducts could withstand internal pressures of up to 15 psi without significant structural degradation, although localized leakage was observed and additional quantitative characterization remains necessary.
Alternative strategies for cutting compliant foam components were also investigated. Cutting with an oscillating blade resulted in substantial deformation and tearing of the material, even after modifications to the cutting parameters and tooling. A heated Nichrome wire was therefore evaluated as an alternative. Preliminary experiments using a 36-gauge wire with a diameter of 0.19 mm produced cleaner and more consistent cuts, indicating that this approach is a promising candidate for future integration into the robotic manufacturing cell.
In parallel with the experimental development of the cell, an initial numerical pipeline was developed to automatically generate manufacturing trajectories from CAD geometry. The proposed approach extracts geometric information from STEP models, constructs local trajectory frames, and generates discrete robot poses that can subsequently be transferred to an offline programming environment for simulation and robot-code generation. Future work will focus on completing and validating this automated trajectory-generation framework for more complex duct geometries, further integrating it with the dual-arm robotic cell, and quantitatively characterizing the welding, sealing, and foam-cutting processes. These developments are intended to further reduce manual programming and process adaptation requirements toward flexible, automated manufacturing of thermoplastic composite ducts for aerospace applications.
Author Contributions
Conceptualization, A.C., A.J., S.J. and J.-P.R.; methodology, A.C., A.J. and J.-P.R.; software, A.C.; validation, A.C. and J.-P.R.; formal analysis, A.C.; investigation, A.C.; data curation, A.C.; writing and original draft preparation, A.C. and J.-P.R.; writing and review and editing, A.C., A.J., S.J. and J.-P.R.; visualization, A.C.; supervision, S.J. and J.-P.R.; project administration, J.-P.R. All authors have read and agreed to the published version of the manuscript.
Funding
This research was supported by the Mitacs Accelerate program, grant number IT17129.
Conflicts of Interest
The authors declare no conflicts of interest.
References
- Boisse, P.; Akkerman, R.; Carlone, P.; Kärger, L.; Lomov, S. V.; Sherwood, J. A. Advances in composite forming through 25 years of ESAFORM. Int. J. Mater. Form. 2022, vol. 15(no. 3), 39. [Google Scholar] [CrossRef]
- Doll, G. Thermoplastic composites technologies for future aircraft structures. In Vehicles of Tomorrow 2019; Liebl, J., Ed.; Springer: Wiesbaden, Germany, 2021; pp. 129–138. [Google Scholar] [CrossRef] [PubMed]
- Jaeschke, P.; Wippo, V.; Suttmann, O.; Overmeyer, L. Advanced laser welding of high-performance thermoplastic composites. J. Laser Appl. 2015, vol. 27(no. S2), S29004. [Google Scholar] [CrossRef]
- Bogue, R. The growing use of robots by the aerospace industry. Ind. Robot Int. J. 2018, vol. 45(no. 6), 705–709. [Google Scholar] [CrossRef]
- Boyer, R. R.; Cotton, J. D.; Mohaghegh, M.; Schafrik, R. E. Materials considerations for aerospace applications. MRS Bull. 2015, vol. 40(no. 12), 1055–1066. [Google Scholar] [CrossRef]
- Bolmsjo, G. Reconfigurable and flexible industrial robot systems. Adv. Robot. Autom. 2014, vol. 3(no. 1). [Google Scholar] [CrossRef]
- Szymański, R. Non-destructive testing of thermoplastic carbon composite structures. Trans. Aerosp. Res. 2020, vol. 2020(no. 1), 34–52. [Google Scholar] [CrossRef]
- Côté, N. Assemblage et programmation de la cellule PMPU dans RoboDK, Internal Report; ÉTS: Université du Québec, 2021. [Google Scholar]
- Sauvain, C. Conception d’une cellule robotisée avec génération de programmes automatisés. Master’s thesis, ÉTS, Université du Québec, 2023. [Google Scholar]
- Gürdal, Z.; Haftka, R. T.; Hajela, P. Design and Optimization of Laminated Composite Materials; Wiley: New York, NY, USA, 1999. [Google Scholar]
- Ozcakir, G. Carbon fiber and its composites: synthesis, properties, applications. 2024. [Google Scholar] [CrossRef]
- Li, H.; et al. Ultrasonic welding of fiber reinforced thermoplastic composites: A review. Int. J. Adv. Manuf. Technol. 2022, vol. 120(nos. 1–2), 29–57. [Google Scholar] [CrossRef]
- Reis, J. P.; De Moura, M.; Samborski, S. Thermoplastic composites and their promising applications. Materials 2020, vol. 13(no. 24), 5832. [Google Scholar] [CrossRef] [PubMed]
- Wu, H.; Deng, H.; Yang, C.; Guan, Y.; Zhang, H.; Li, H. Robotic off-line programming system based on SolidWorks. 2015 IEEE International Conference on Robotics and Biomimetics (ROBIO), Zhuhai, China, Dec. 2015; pp. 1711–1716. [Google Scholar] [CrossRef]
- Toledano-Garcia, A. A.; Pérez-Cabrera, H. R.; Ortega-Cabrera, D.; et al. Trajectory Generator System for a UR5 Collaborative Robot in 2D and 3D Surfaces. Machines 2023, vol. 11, 916. [Google Scholar] [CrossRef]
- Baizid, K.; Meddahi, A.; Yousnadj, A.; et al. Industrial robotics platform for simulation design, planning and optimization based on off-line CAD programming. In MATEC Web of Conferences; 2016. [Google Scholar] [CrossRef]
- Rodrigues, M.; et al. Robot trajectory planning using OLP and structured light 3D machine vision. In Lecture Notes in Computer Science; Springer, 2013; vol. 8034, pp. 244–253. [Google Scholar]
- Hunten, K. A.; Feeney, A. B.; Srinivasan, V. Recent advances in sharing standardized STEP composite structure information. Comput.-Aided Des. 2013, vol. 45(no. 10), 1215–1221. [Google Scholar] [CrossRef] [PubMed]
- Bedaka, A. K.; Lin, C.-Y. Autonomous path generation platform for robot simulation. Proc. ARIS. 2017, 63–68. [Google Scholar] [CrossRef]
- Chen, H.; et al. CAD-based automated robot trajectory planning for spray painting. Ind. Robot Int. J. 2002, vol. 29(no. 5), 426–433. [Google Scholar] [CrossRef]
- Lin, Y.-J.; Lee, T. S. An adaptive tool path generation algorithm. Comput.-Aided Des. 1999, vol. 31(no. 4), 237–247. [Google Scholar] [CrossRef]
- Mineo, C.; et al. Robotic path planning for non-destructive testing. Robot. Comput.-Integr. Manuf. 2016, vol. 37, 1–12. [Google Scholar] [CrossRef]
- Aircraft Systemstech, Cabin Environment Control System. Available online: https://www.aircraftsystemstech.com/2017/05/aircraft-heaters.html (accessed on Apr. 29 2025).
- Wippo, V.; et al. Laser transmission welding of semi-interpenetrating polymer networks-composites. J. Laser Appl. 2017, vol. 29(no. 2), 022407. [Google Scholar] [CrossRef]
Figure 1.
a) Example of a raw composite plate, reproduced from [10]; and b) distinction between the constituent elements of a composite material, reproduced from [11].
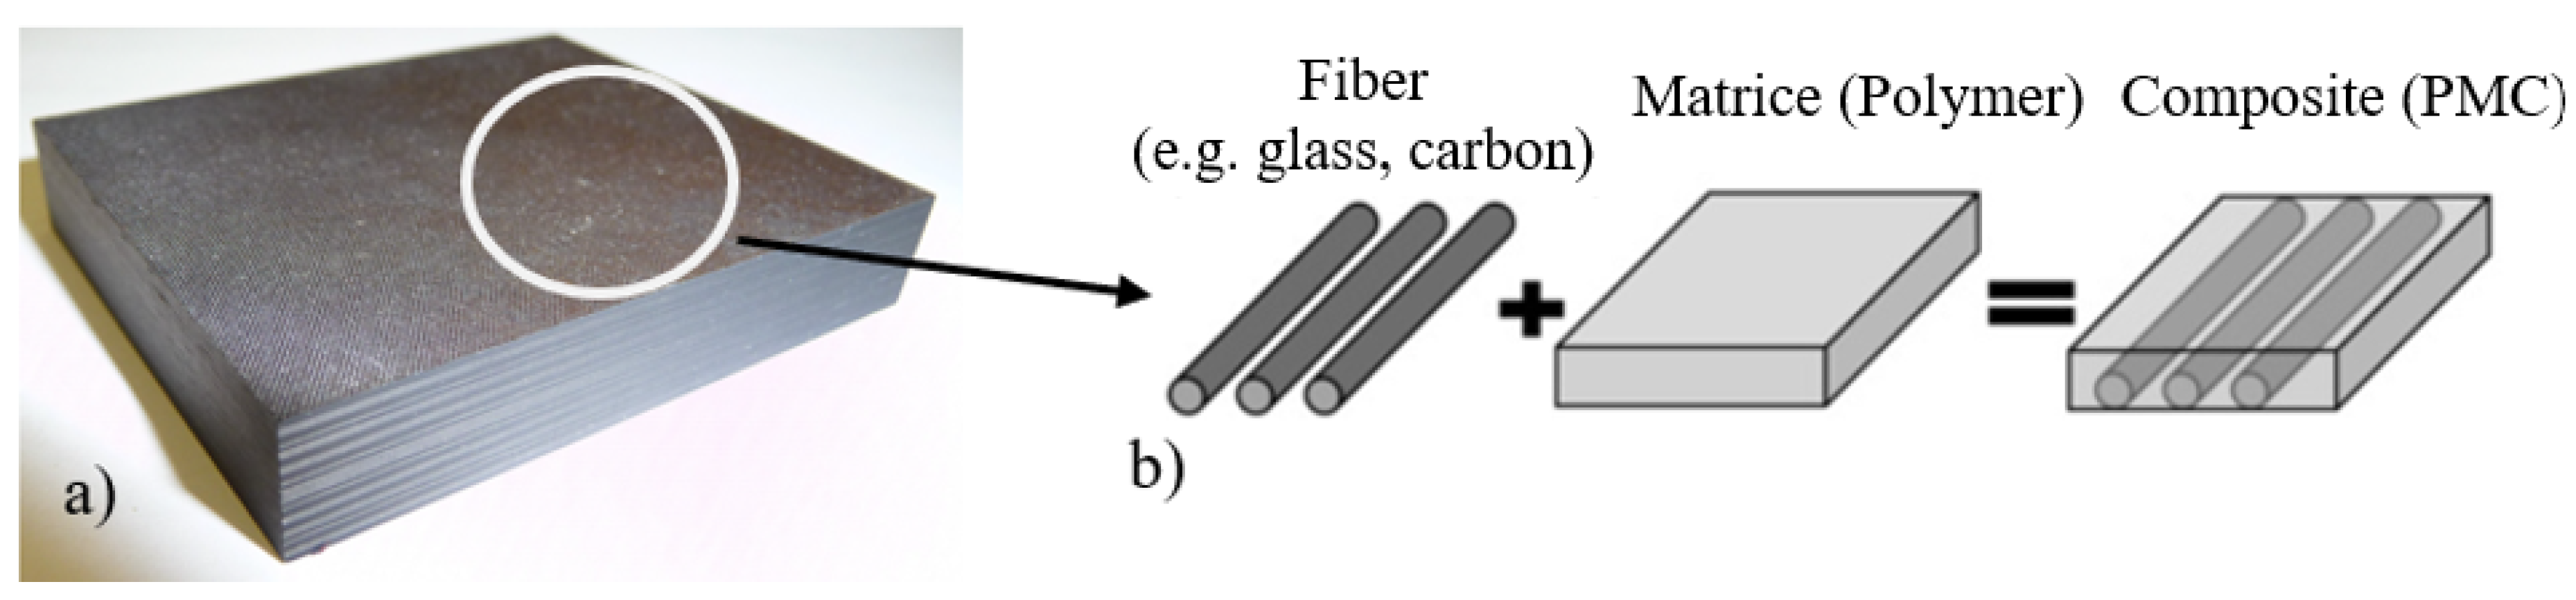
Figure 2.
Joining methods for thermoplastic materials, adapted from [12].
Figure 2.
Joining methods for thermoplastic materials, adapted from [12].
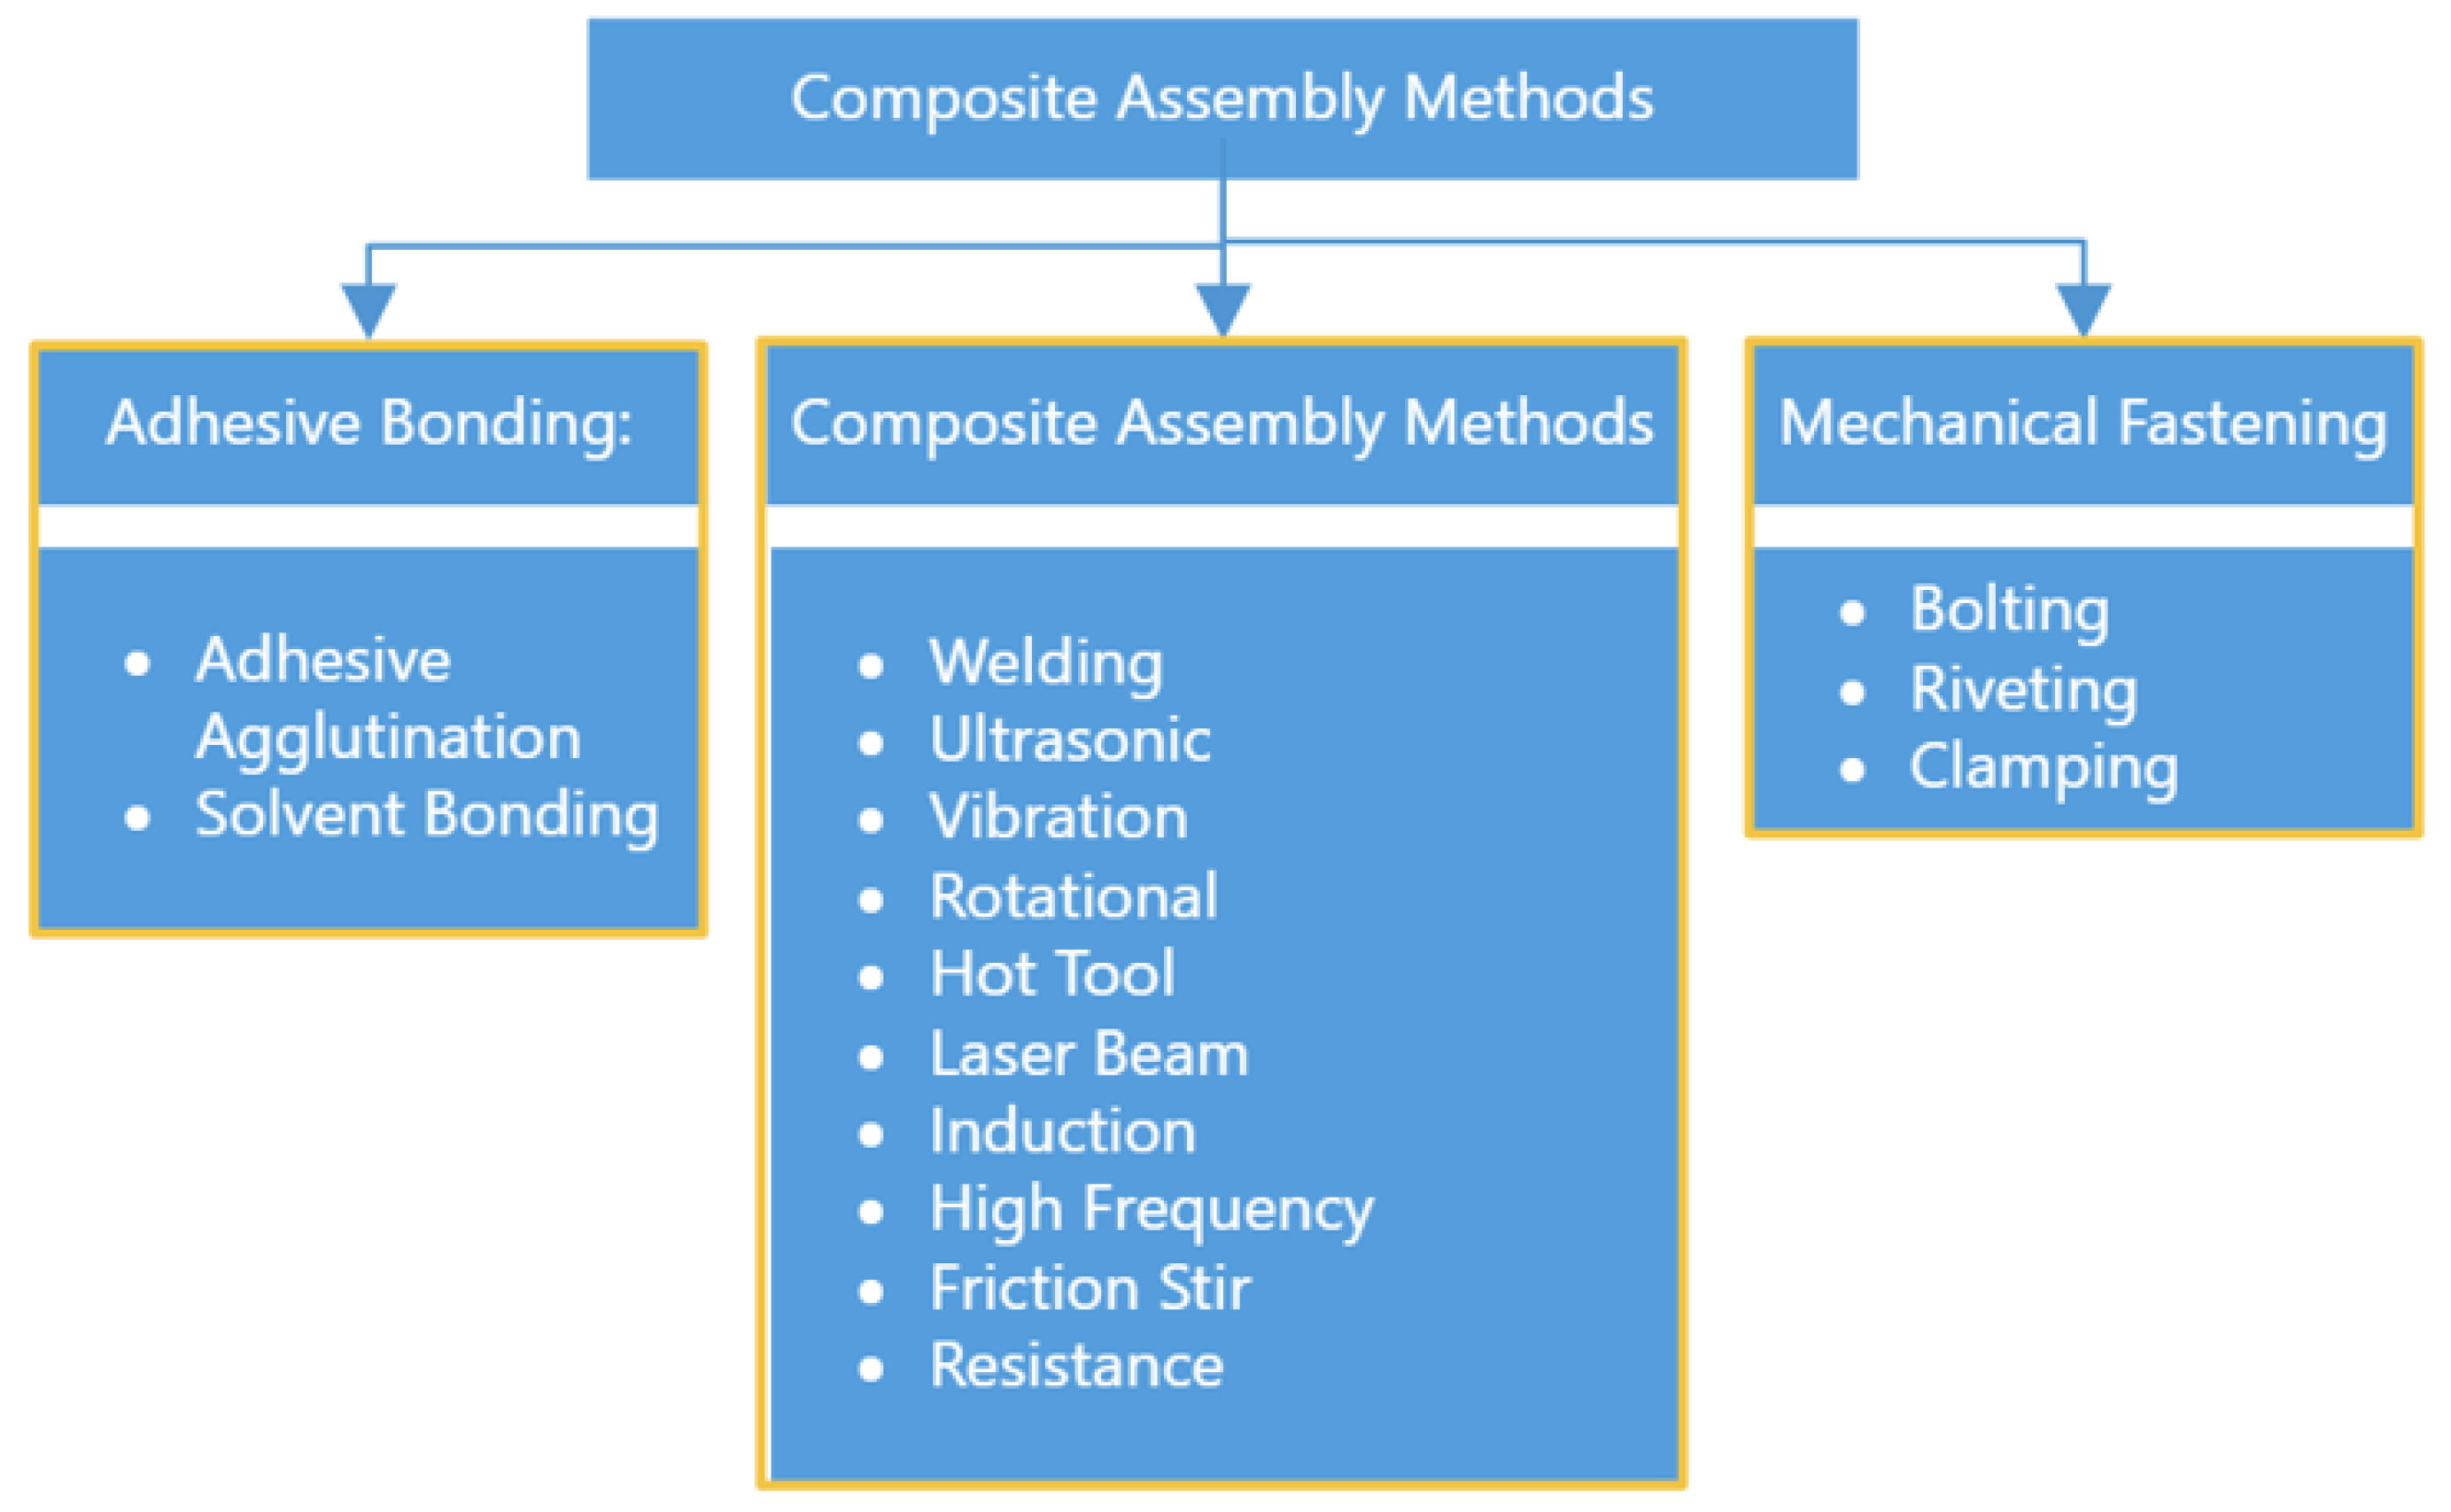
Figure 3.
IRoSim offline programming pipeline using SolidWorks, reproduced from [16].
Figure 3.
IRoSim offline programming pipeline using SolidWorks, reproduced from [16].
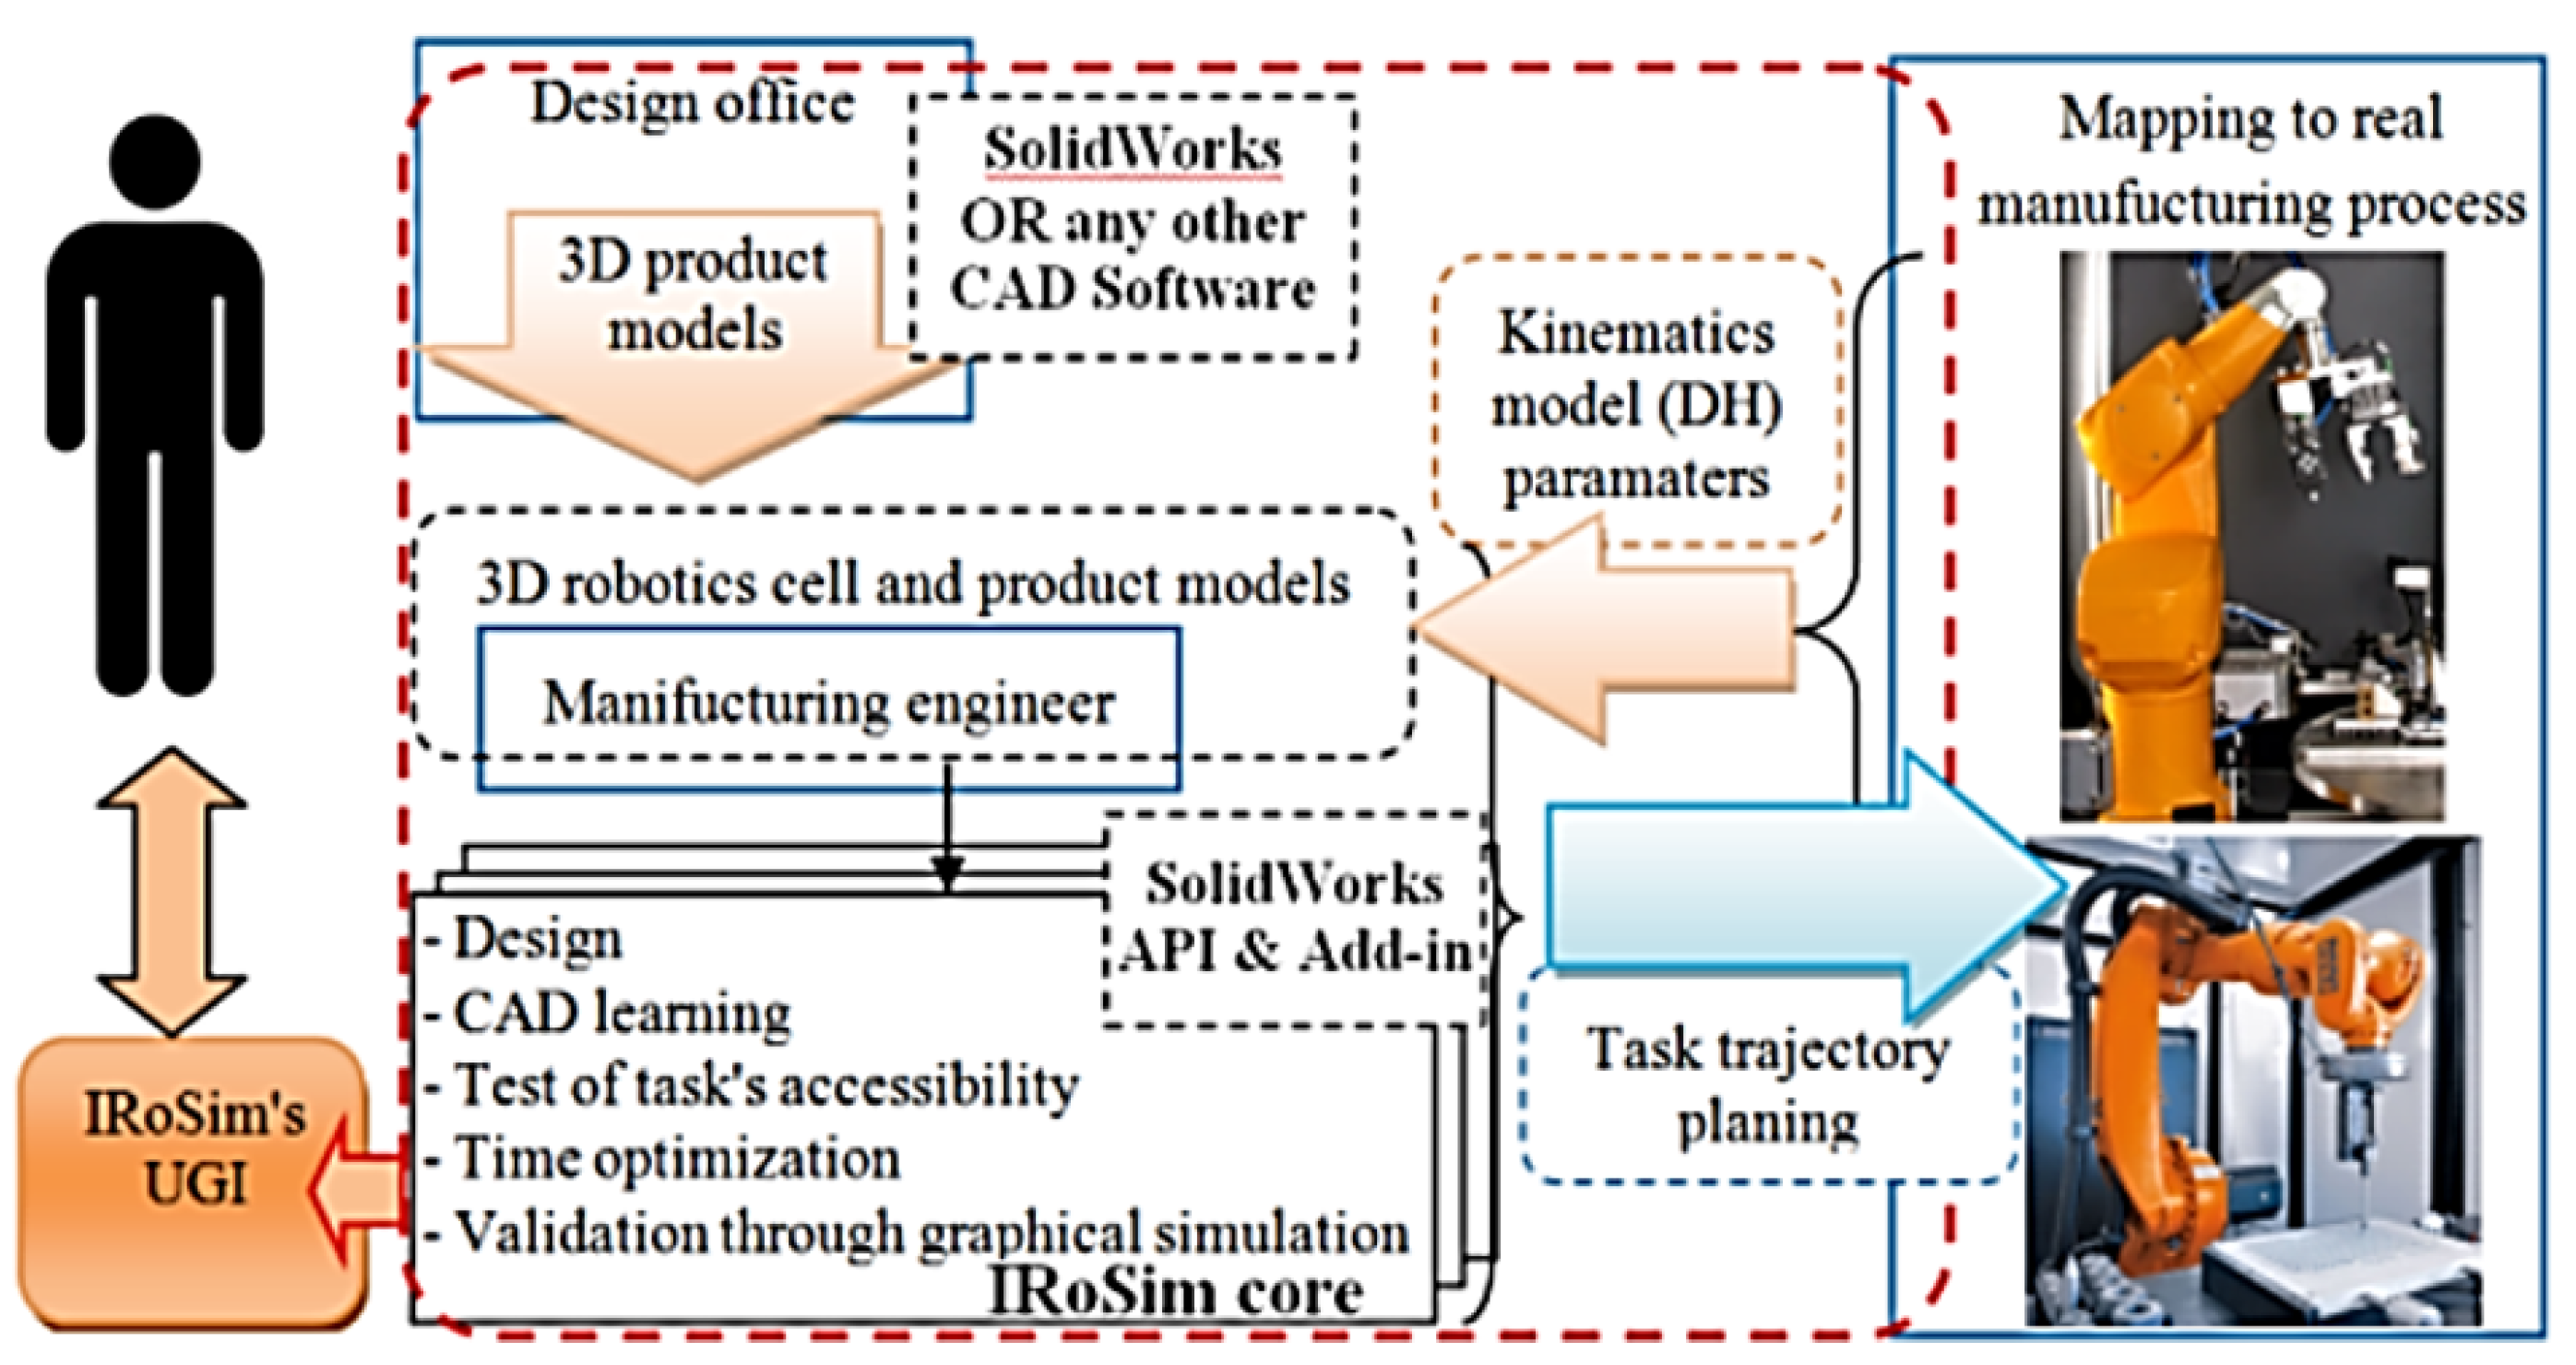
Figure 4.
Fluid-transfer duct system in an aircraft, adapted from [23].
Figure 4.
Fluid-transfer duct system in an aircraft, adapted from [23].
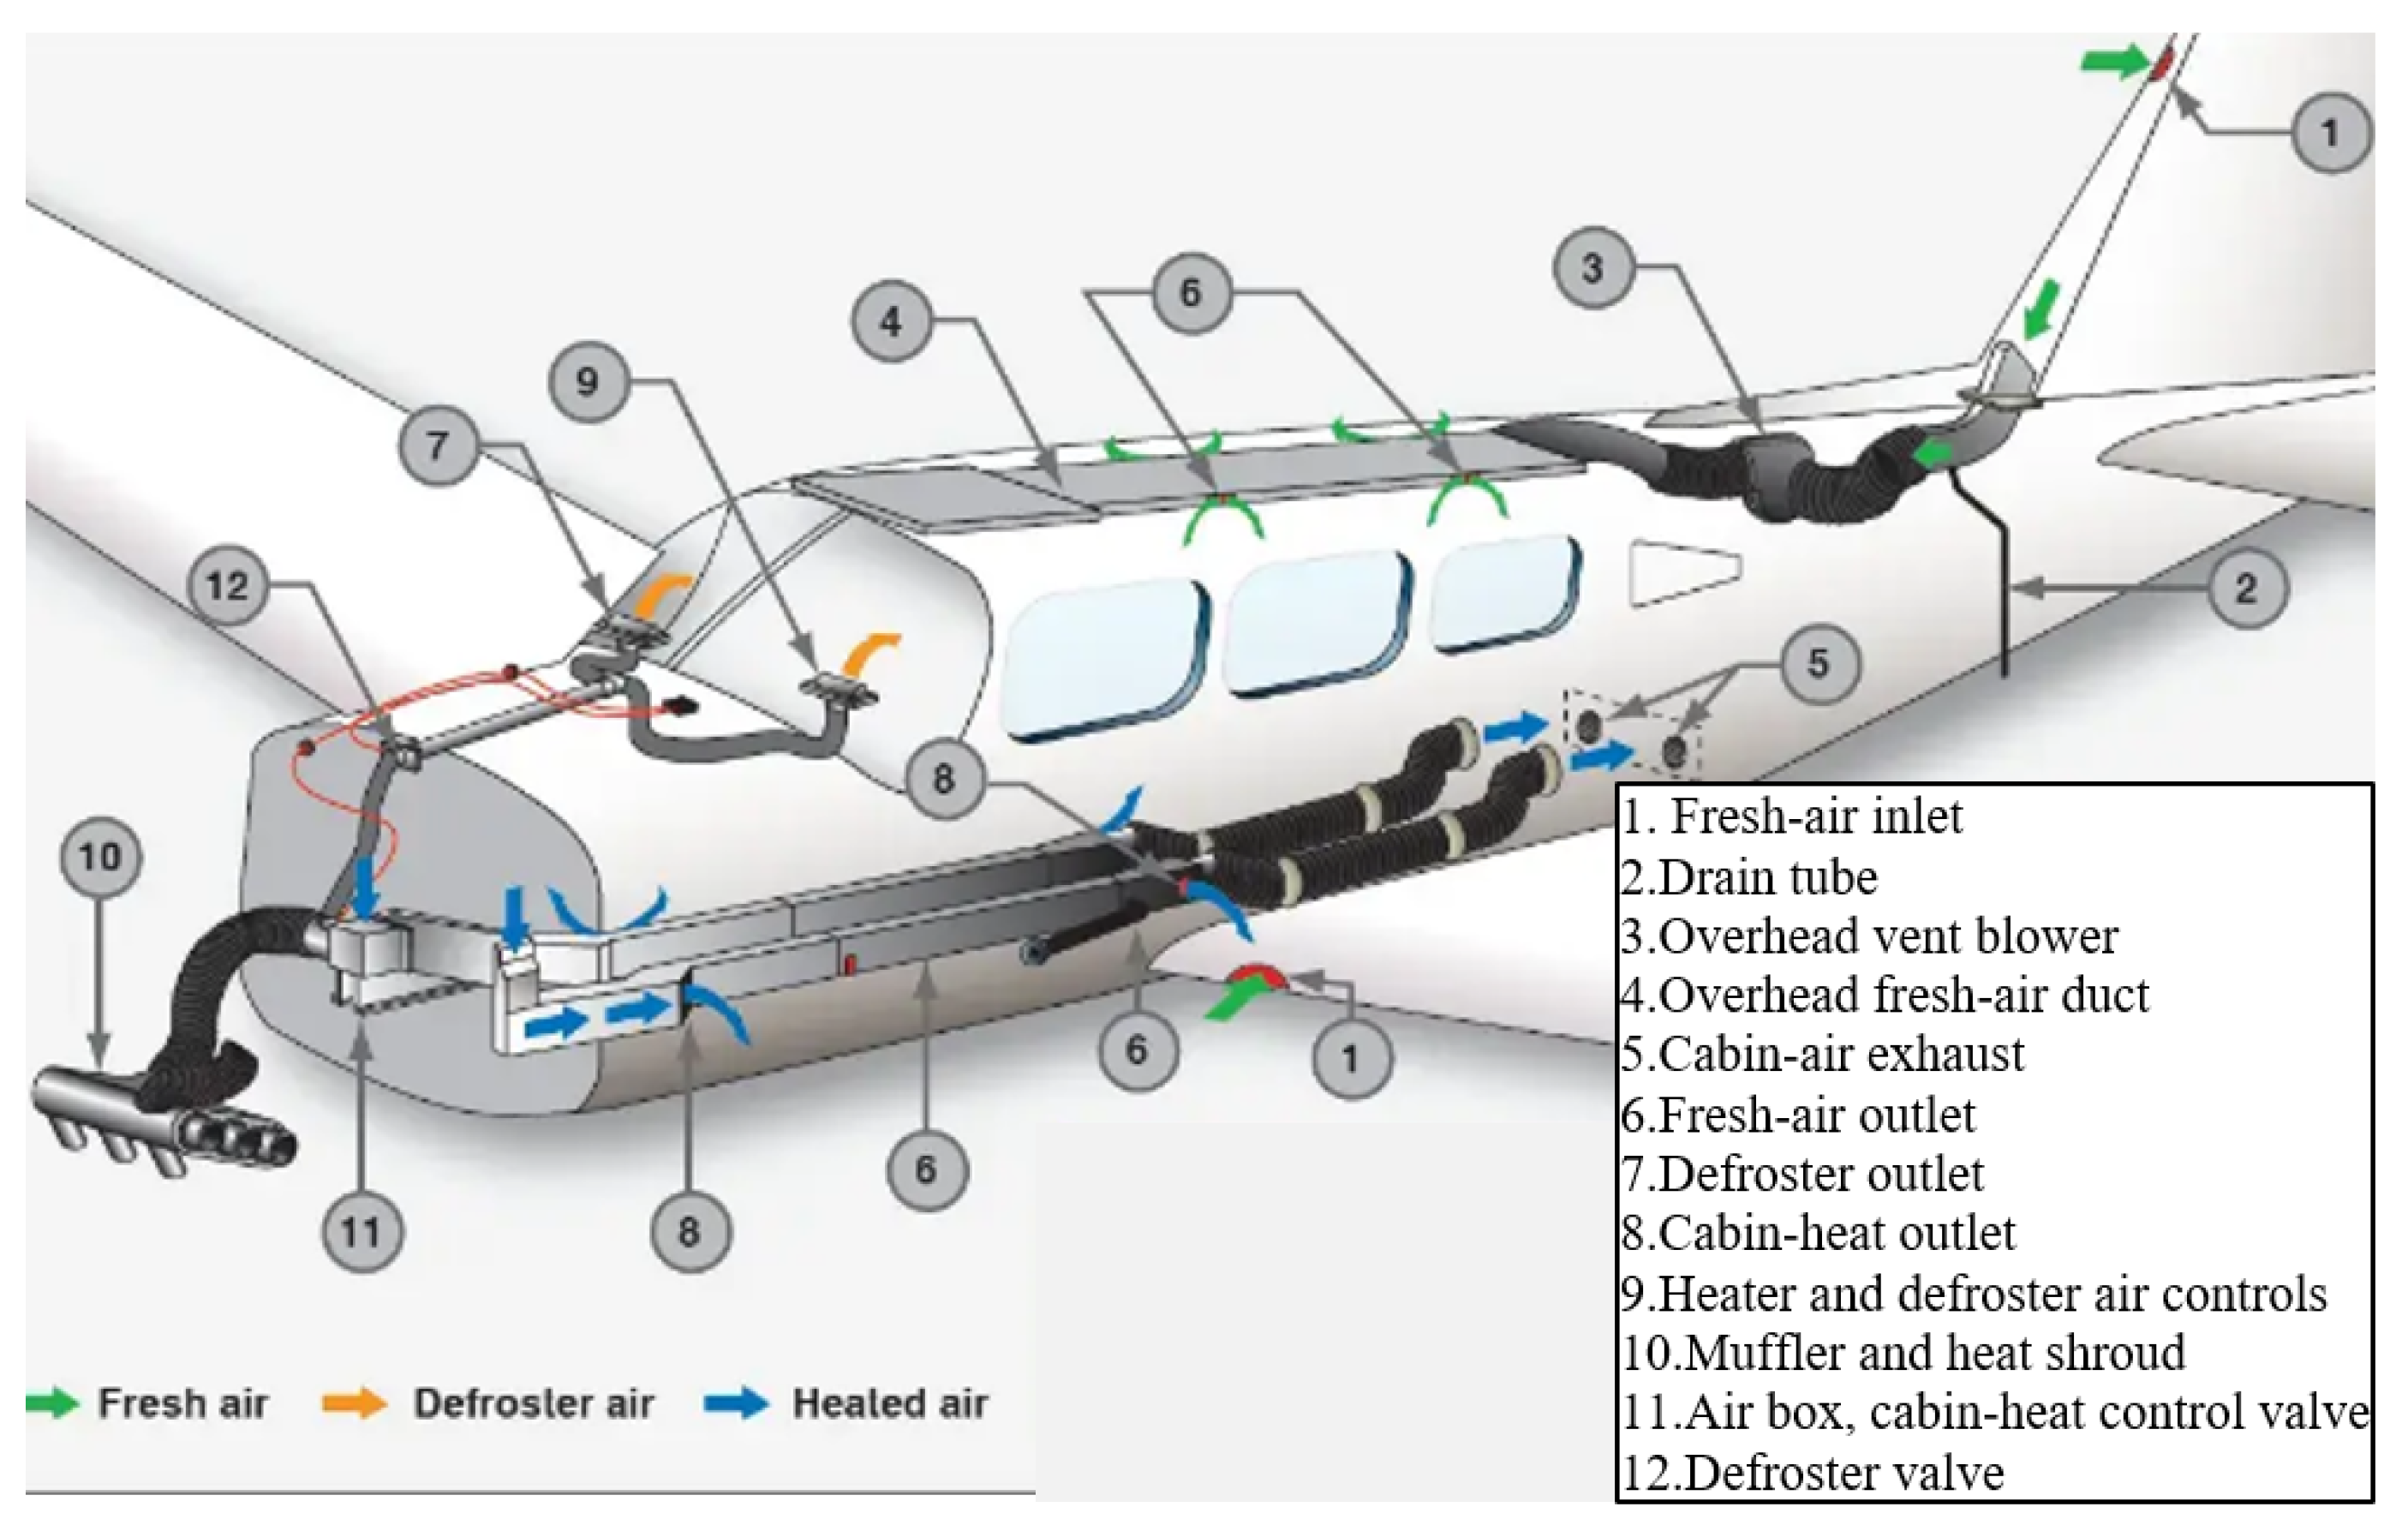
Figure 5.
Tensile testing test bench
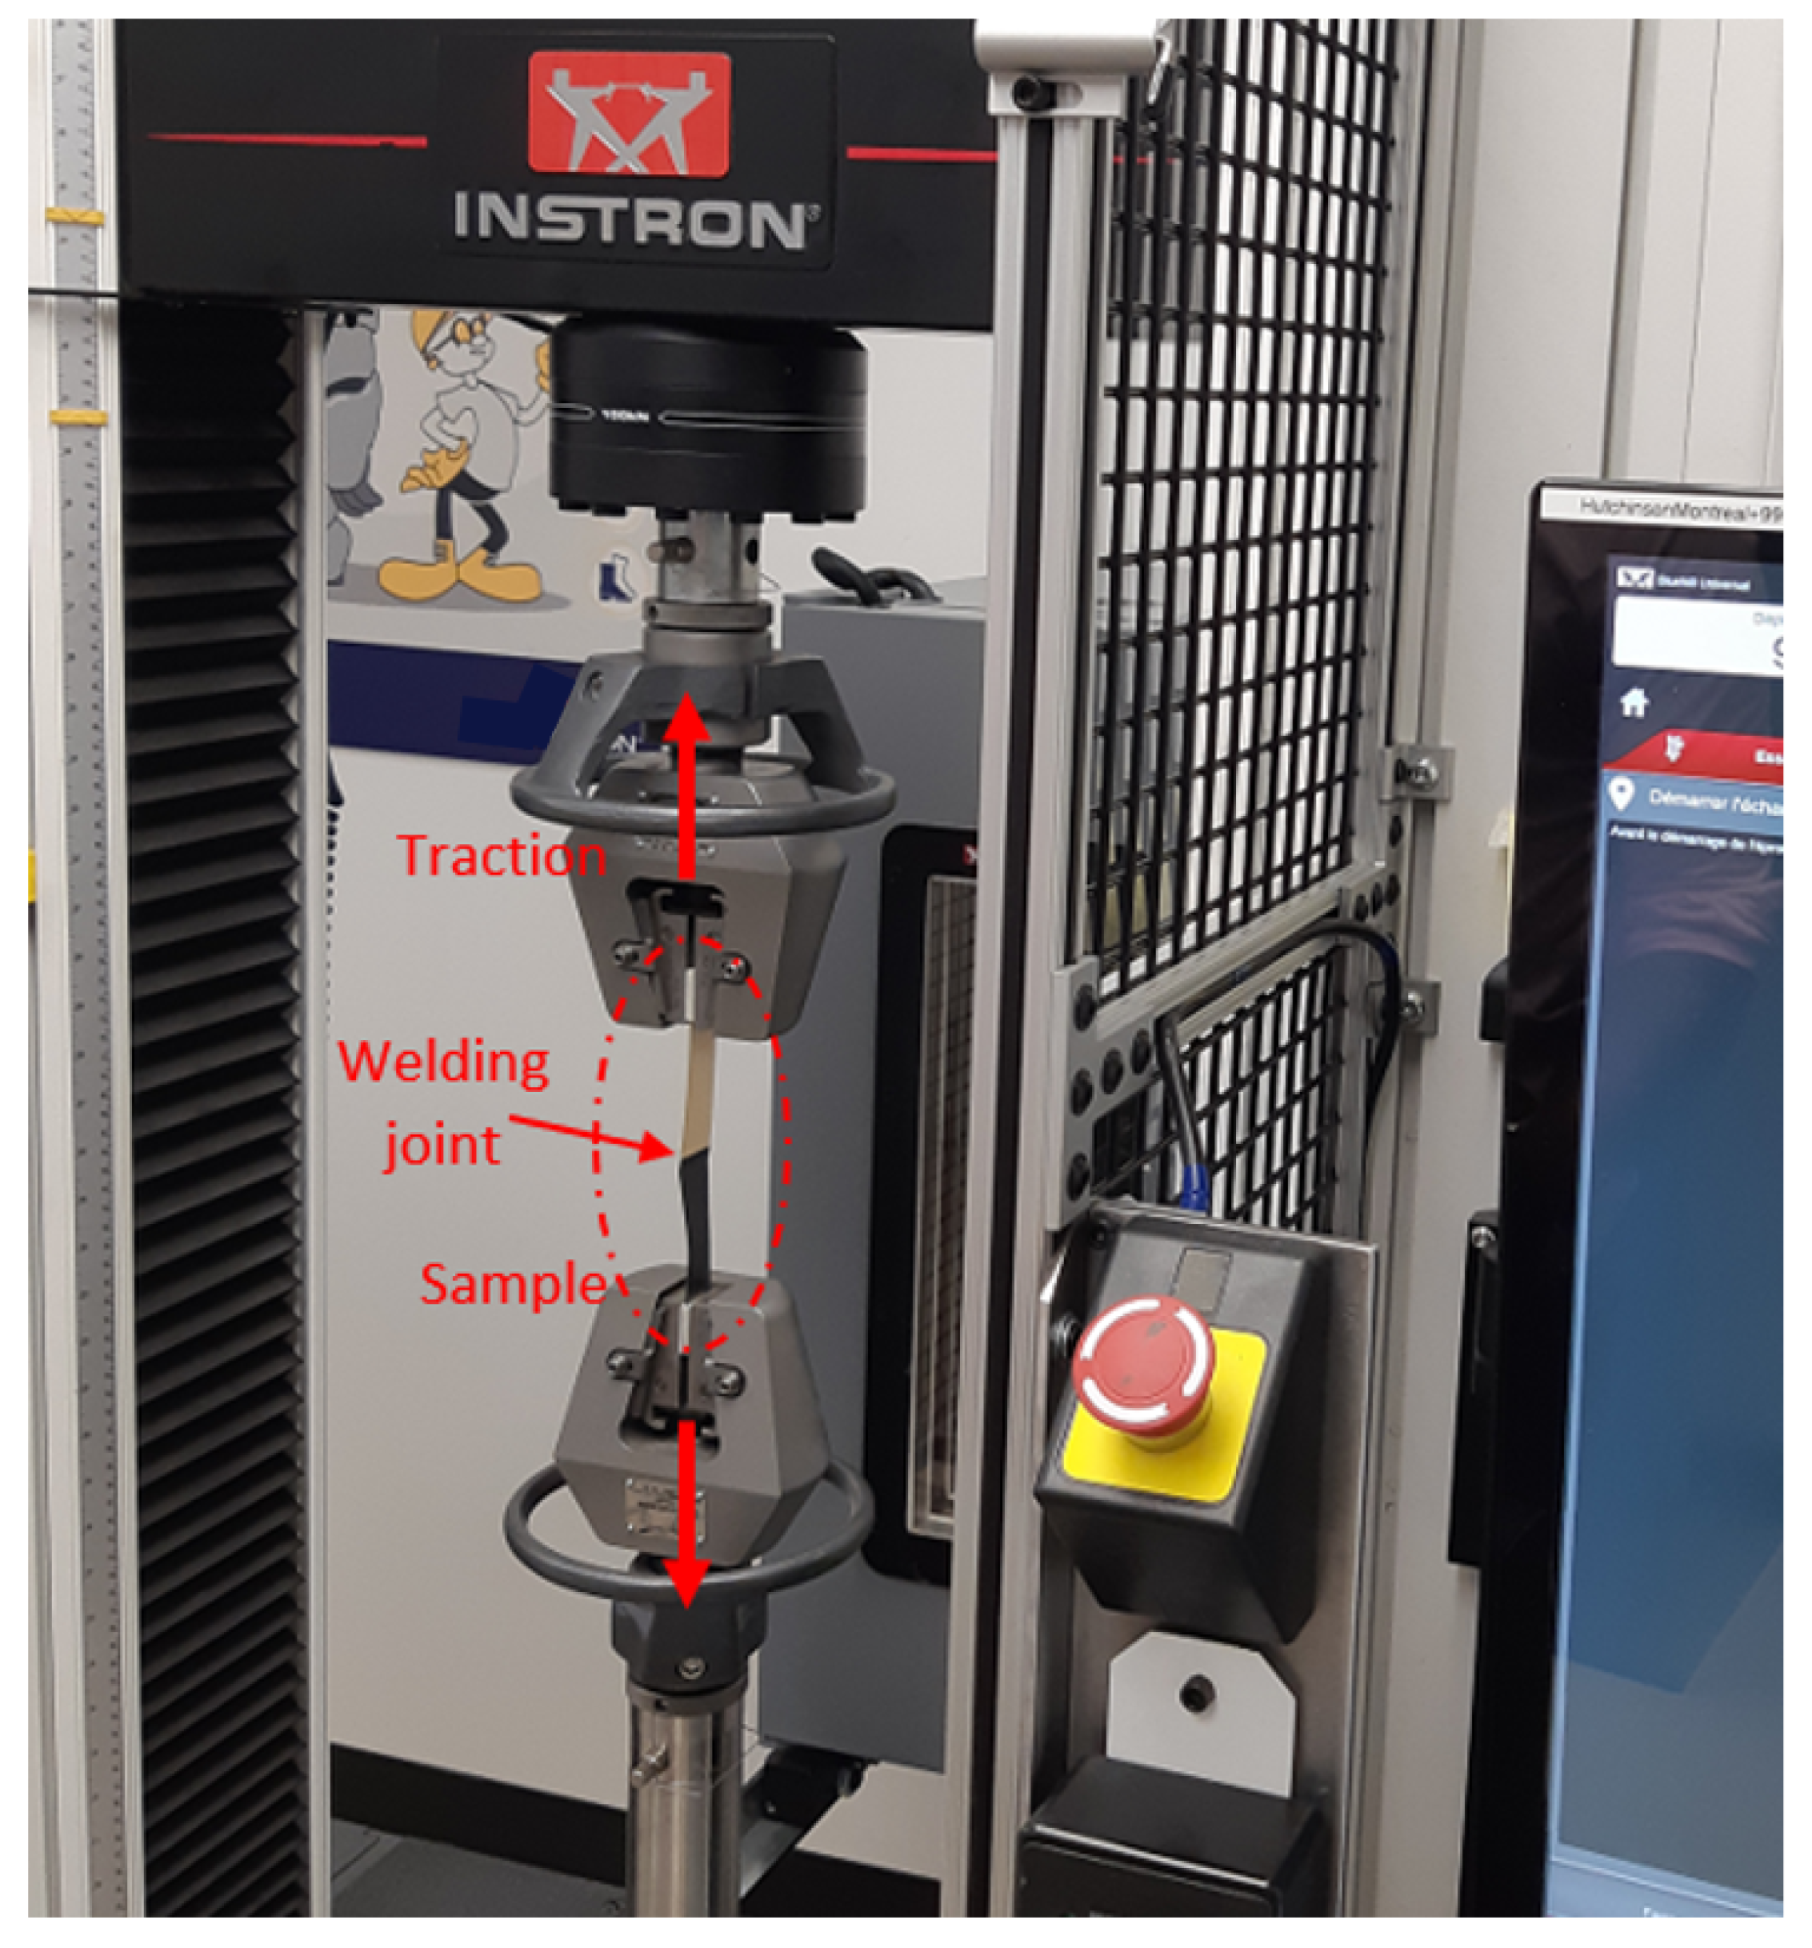
Figure 6.
Part leak test bench
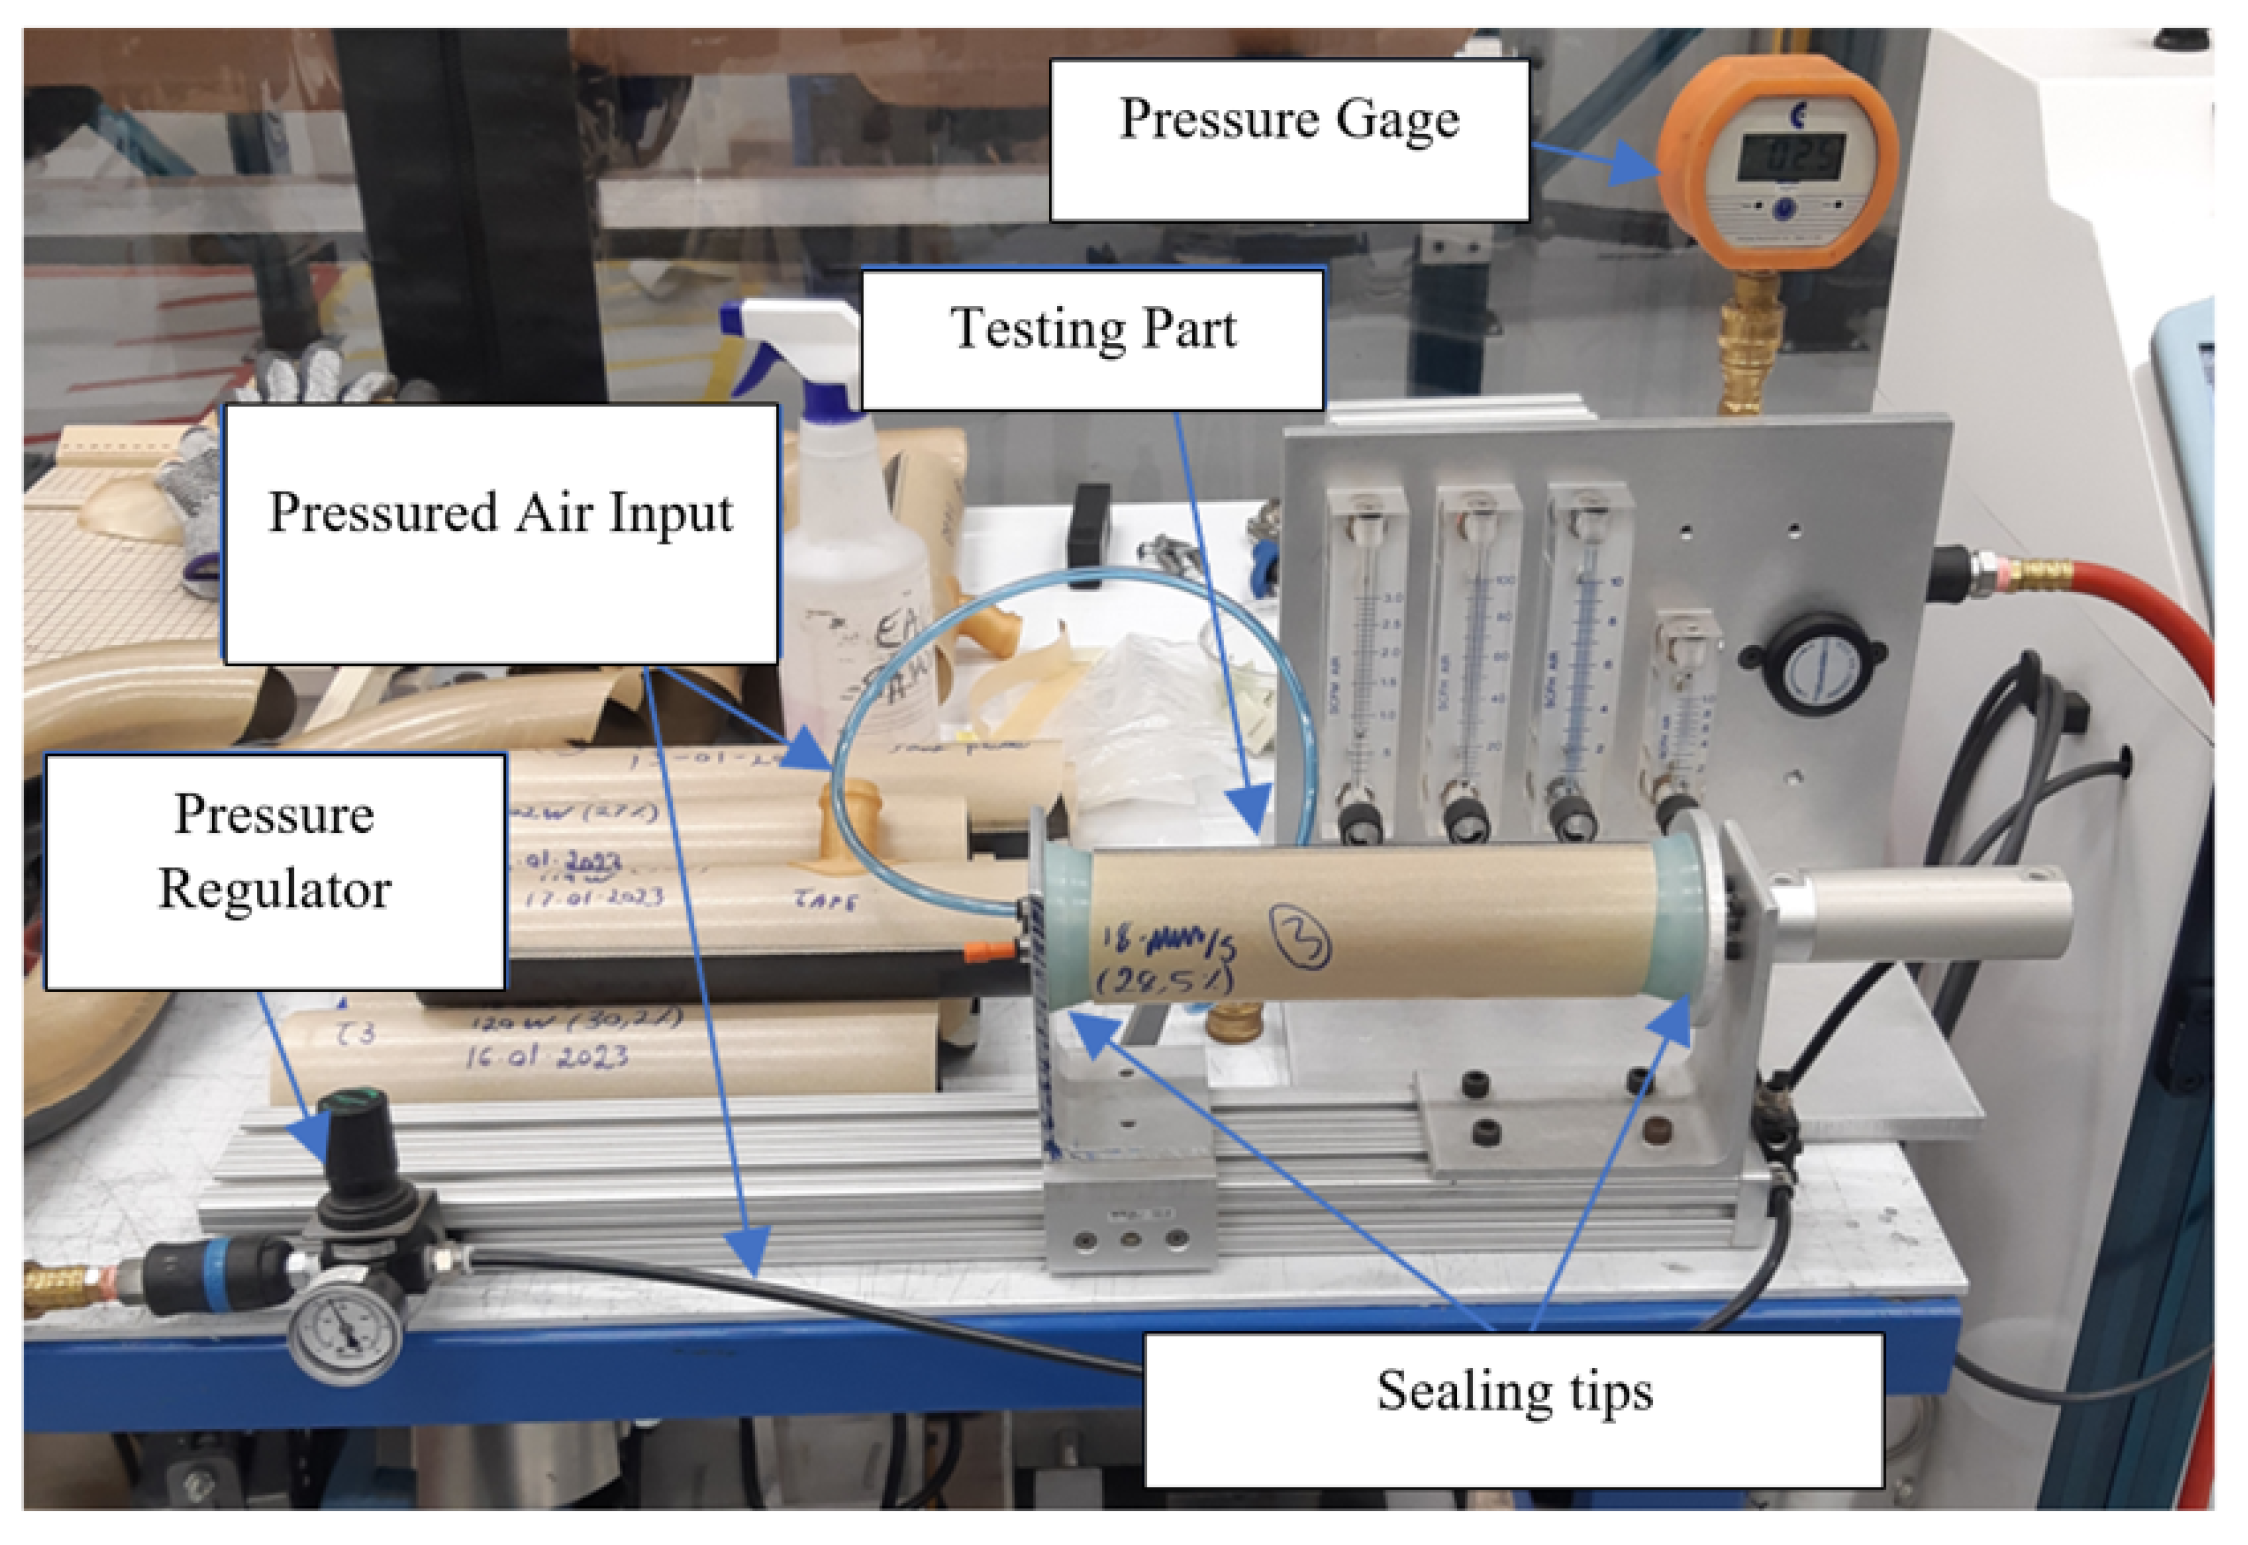
Figure 7.
Main Steps of the numerical tool for Automated path generation
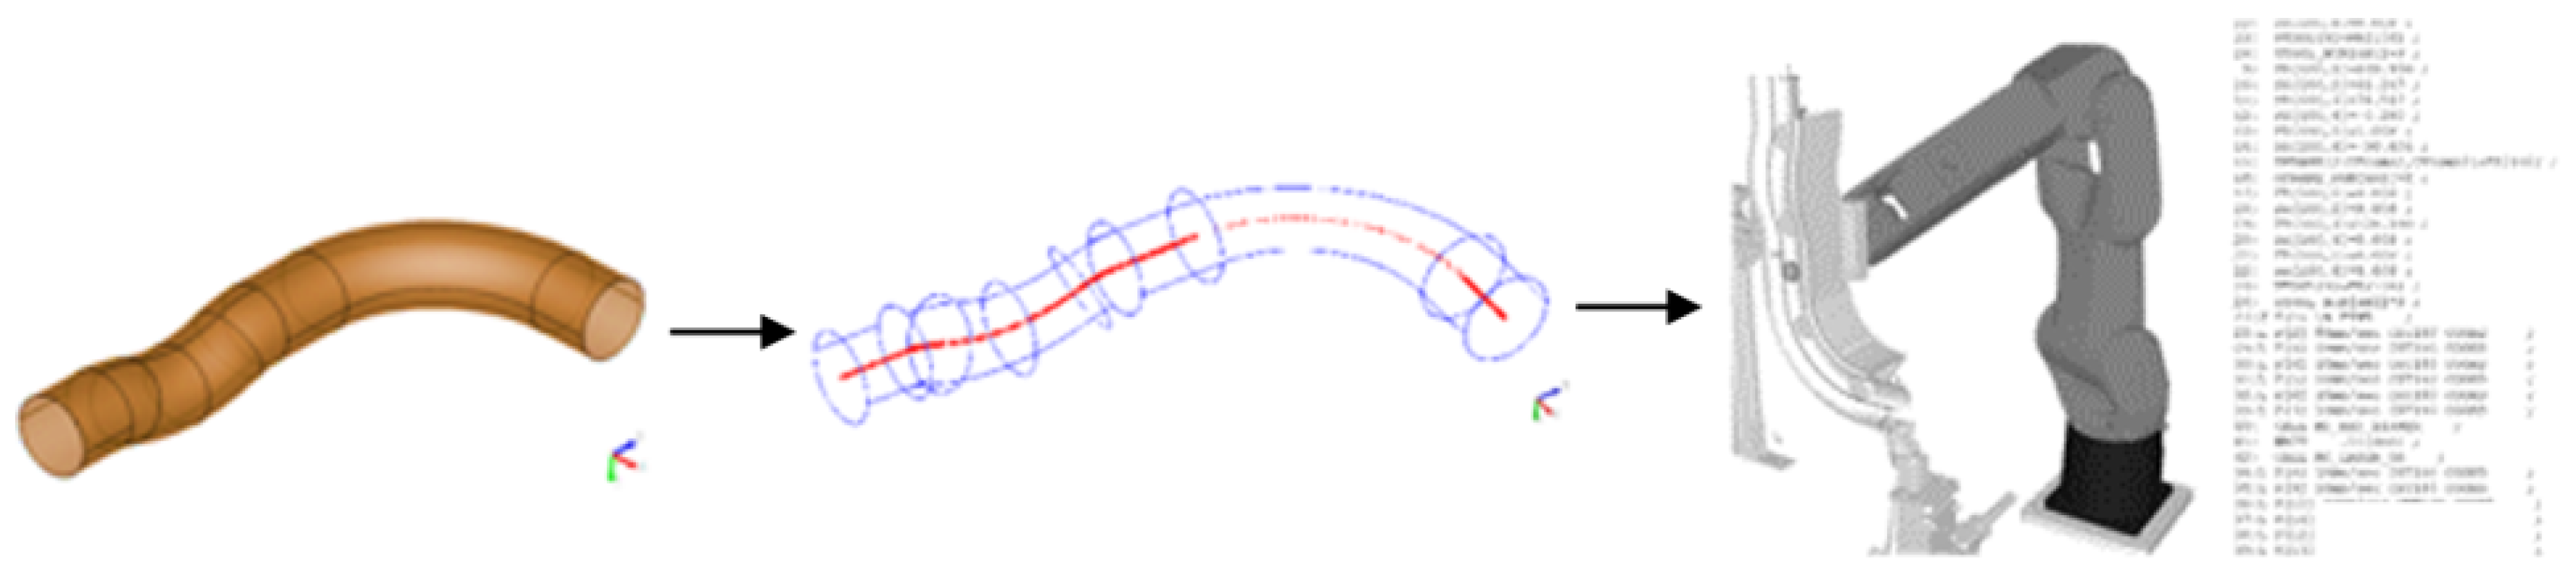
Figure 8.
Three-dimensional model of a reinforced thermoplastic duct: exploded view (left) and assembled configuration (right).
Figure 8.
Three-dimensional model of a reinforced thermoplastic duct: exploded view (left) and assembled configuration (right).
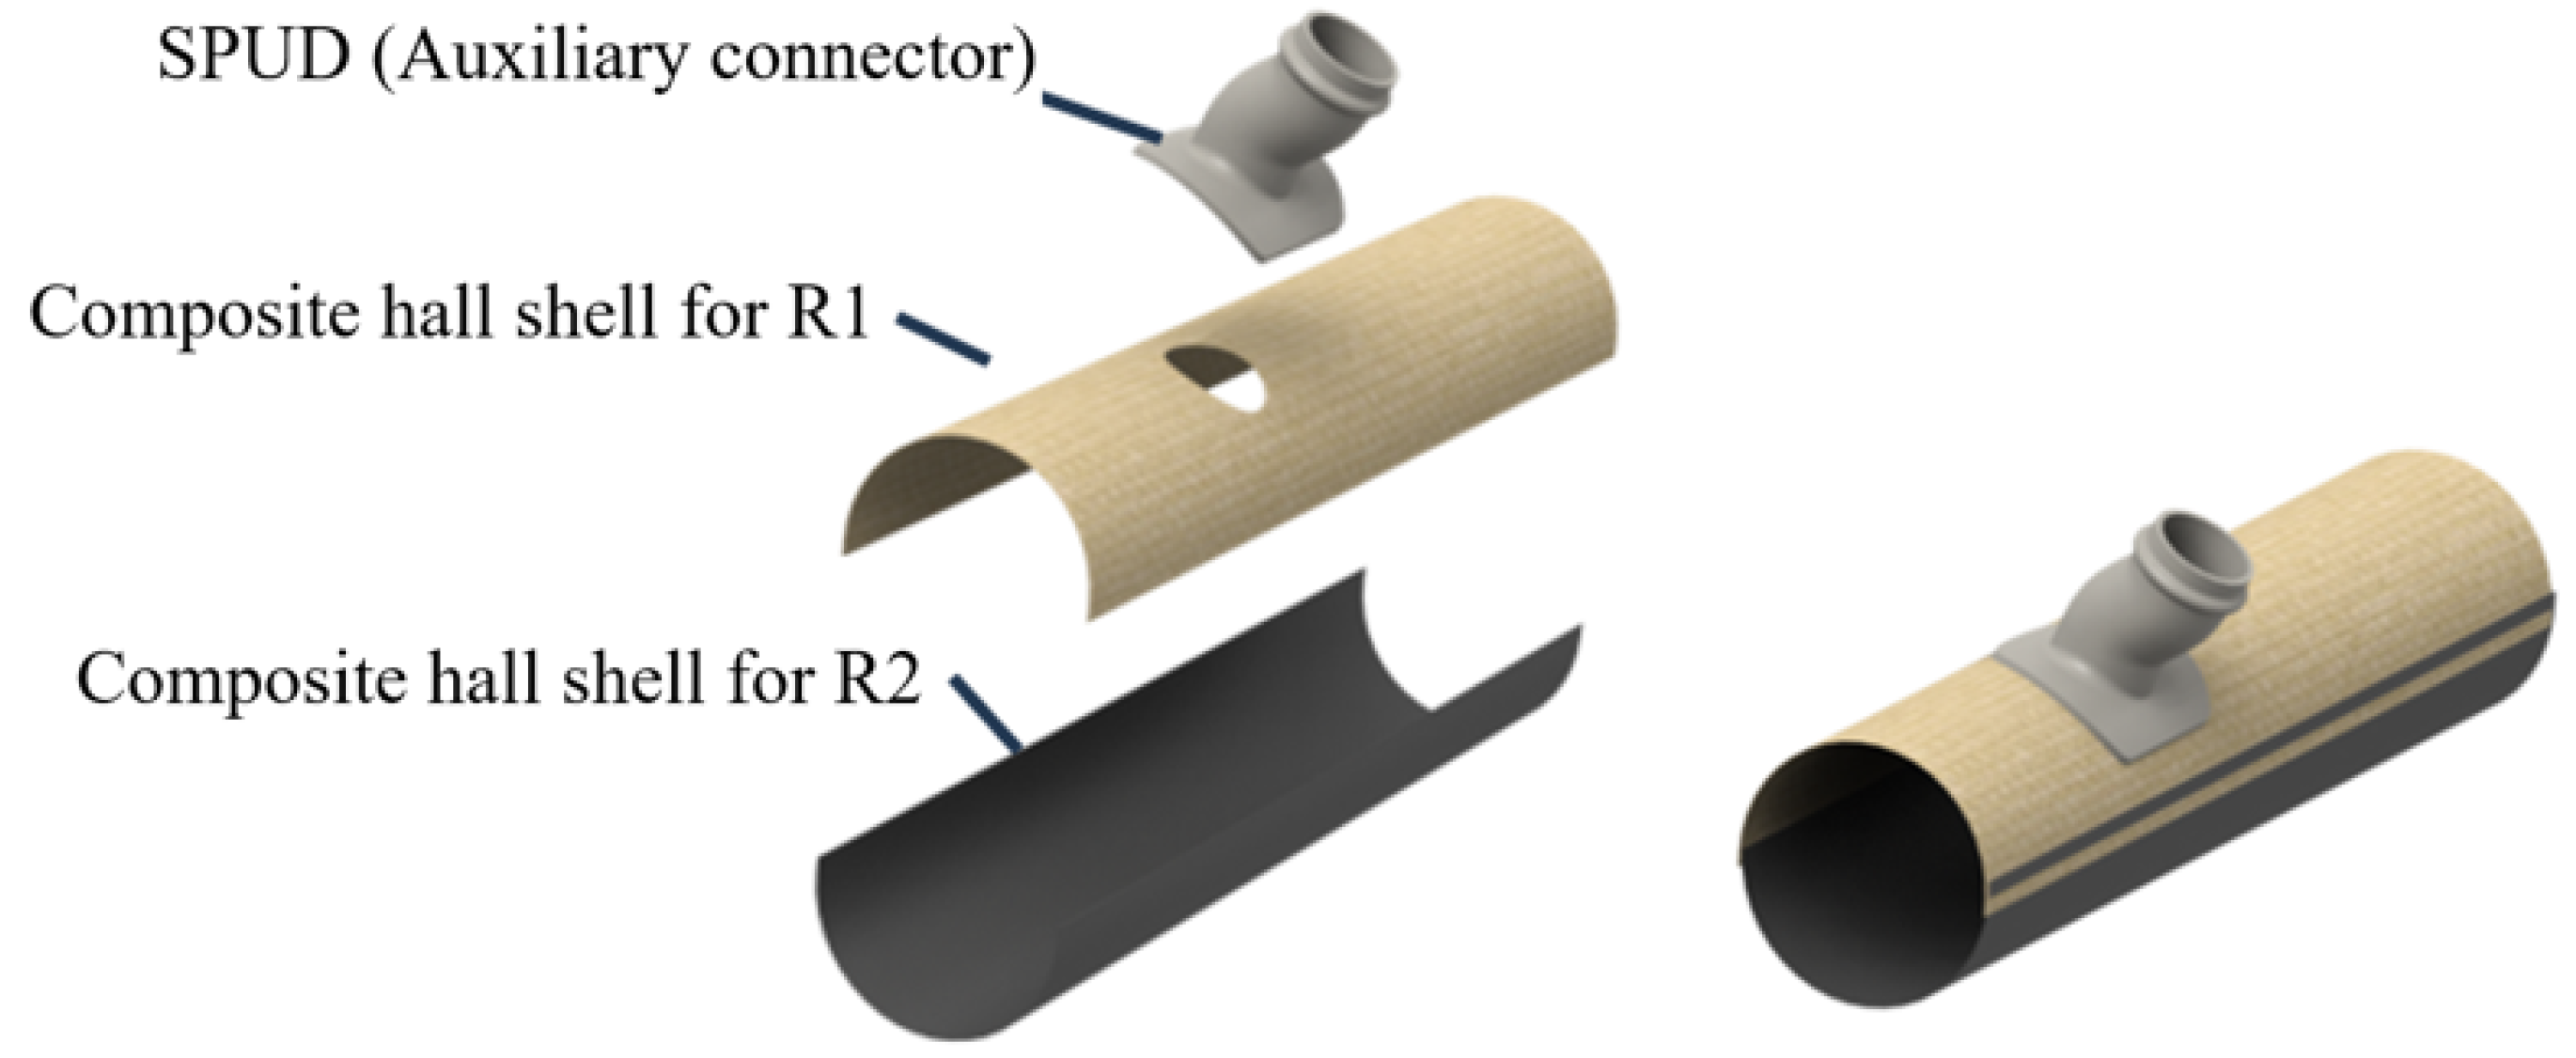
Figure 9.
Robots R2 (left) and R1 (right) during positioning and initiation of the laser welding process.
Figure 9.
Robots R2 (left) and R1 (right) during positioning and initiation of the laser welding process.
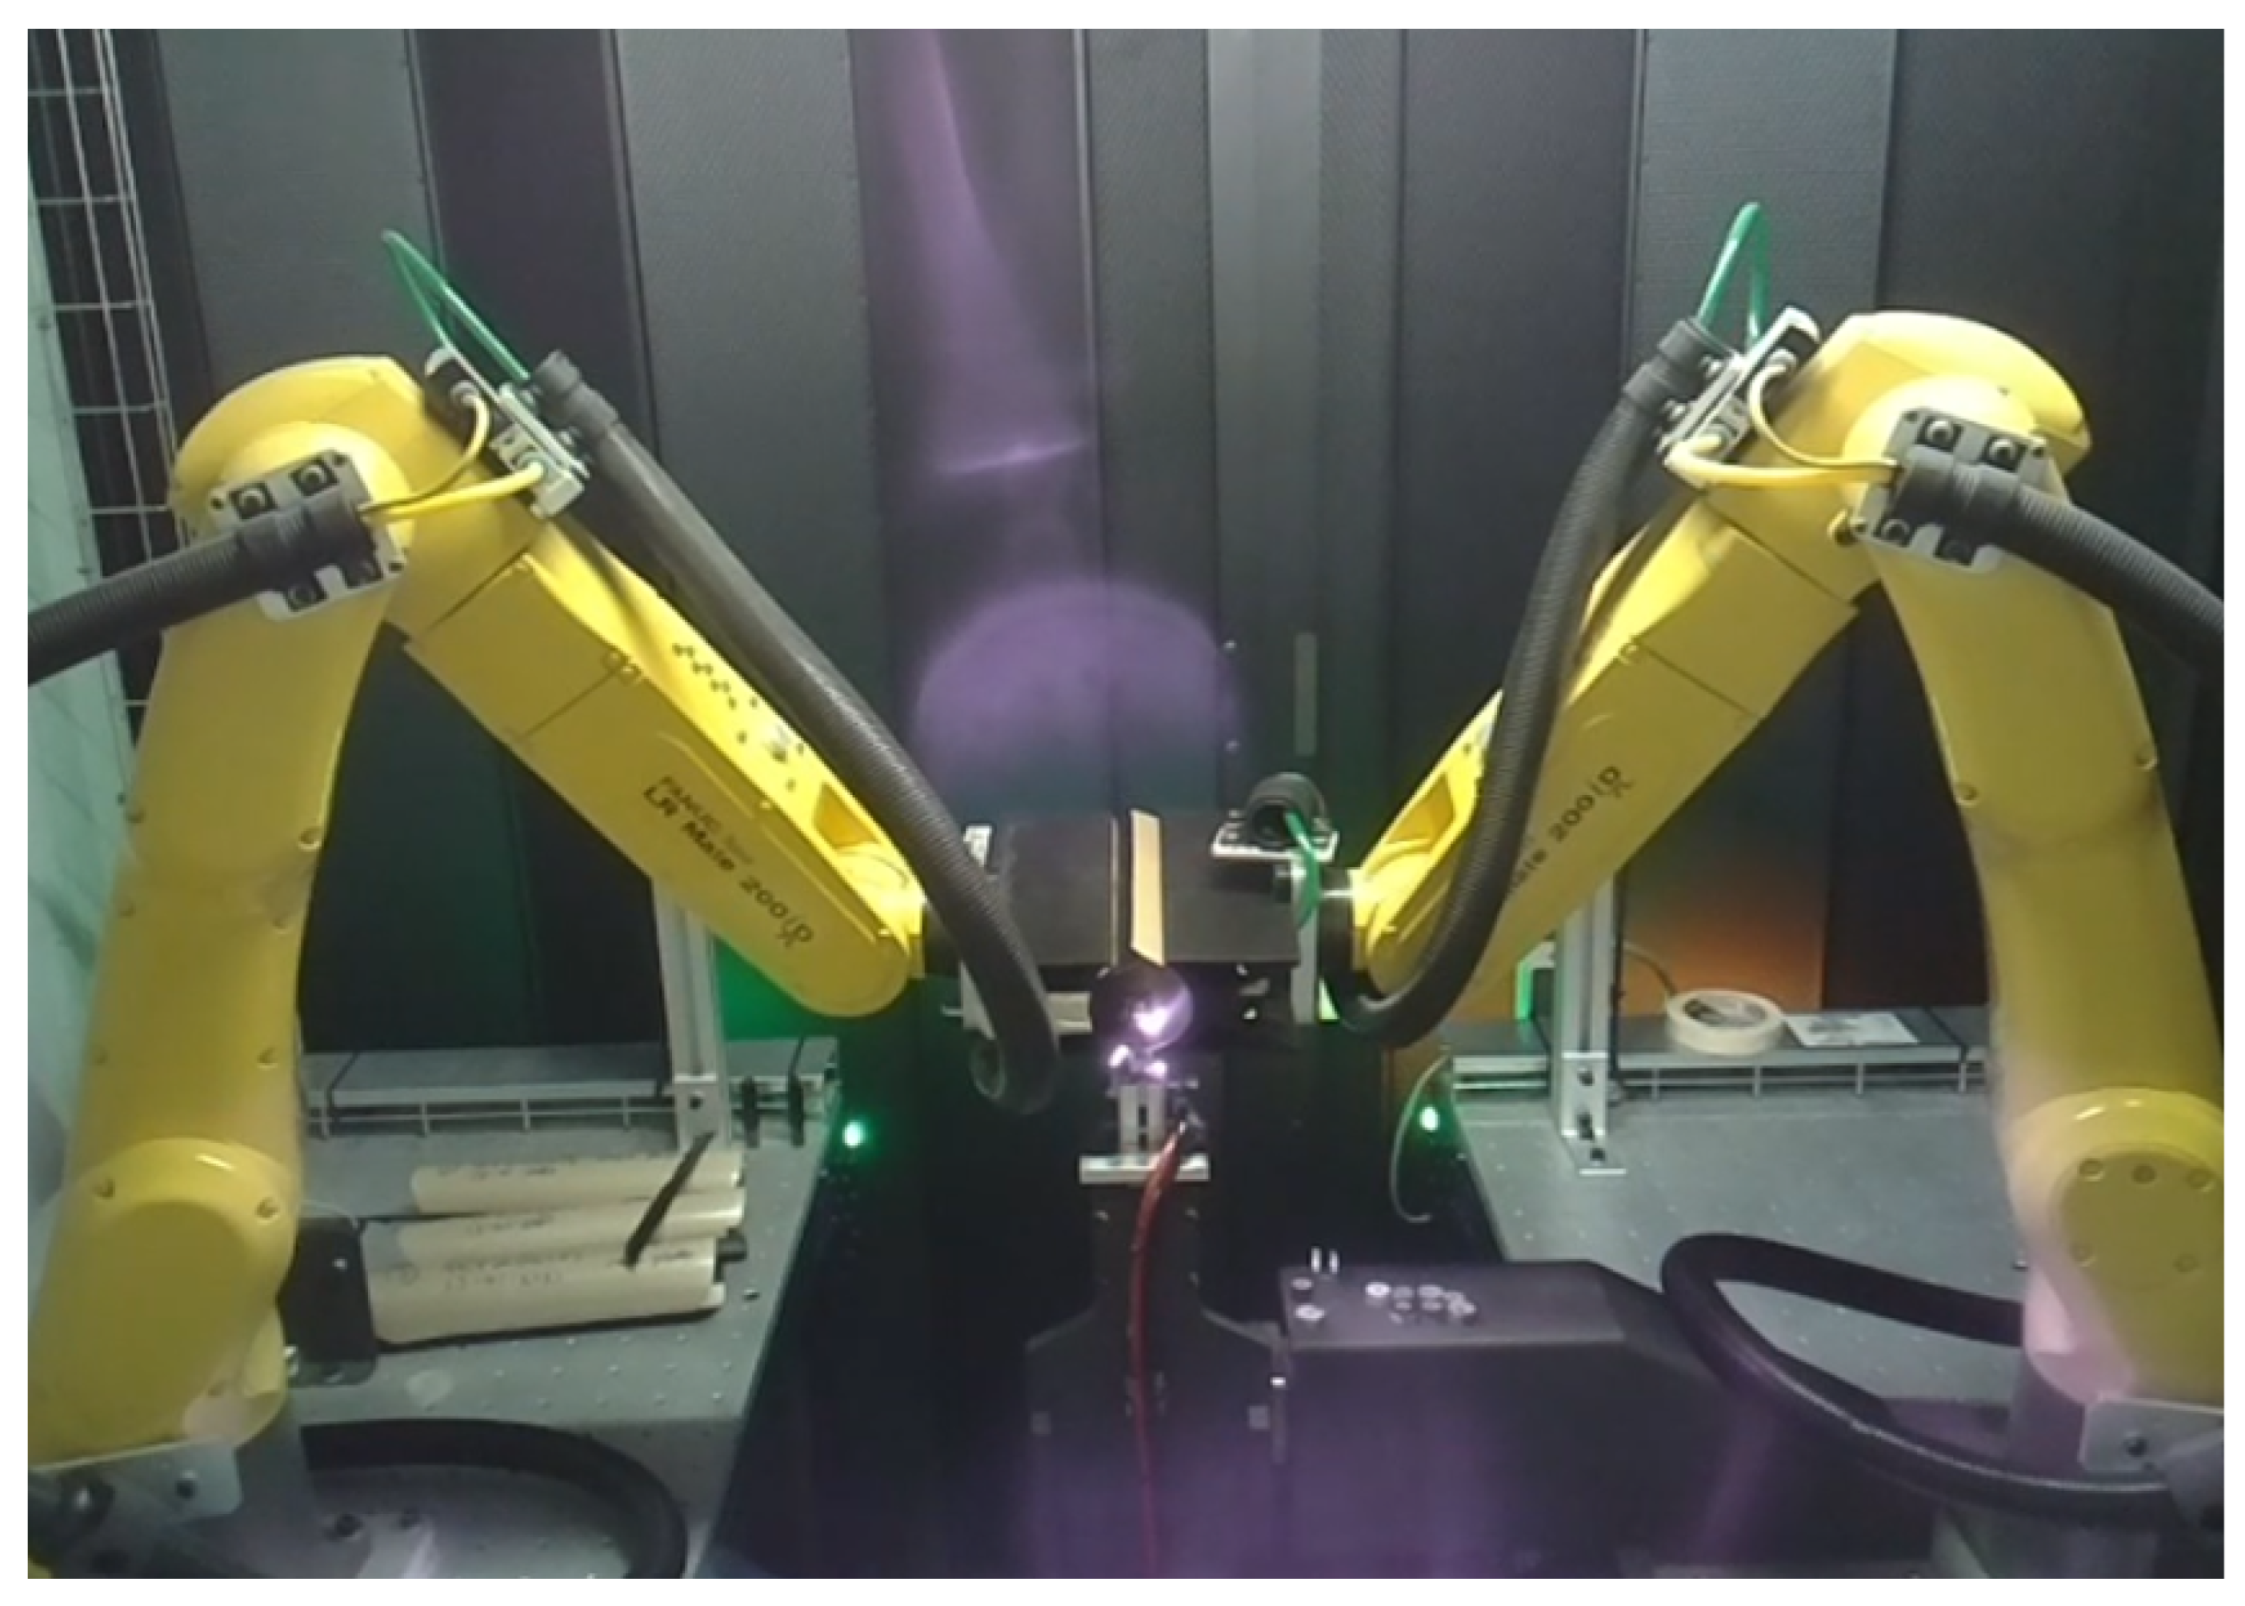
Figure 10.
Laser transmission welding process for thermoplastic composite parts, reproduced from [24].
Figure 10.
Laser transmission welding process for thermoplastic composite parts, reproduced from [24].
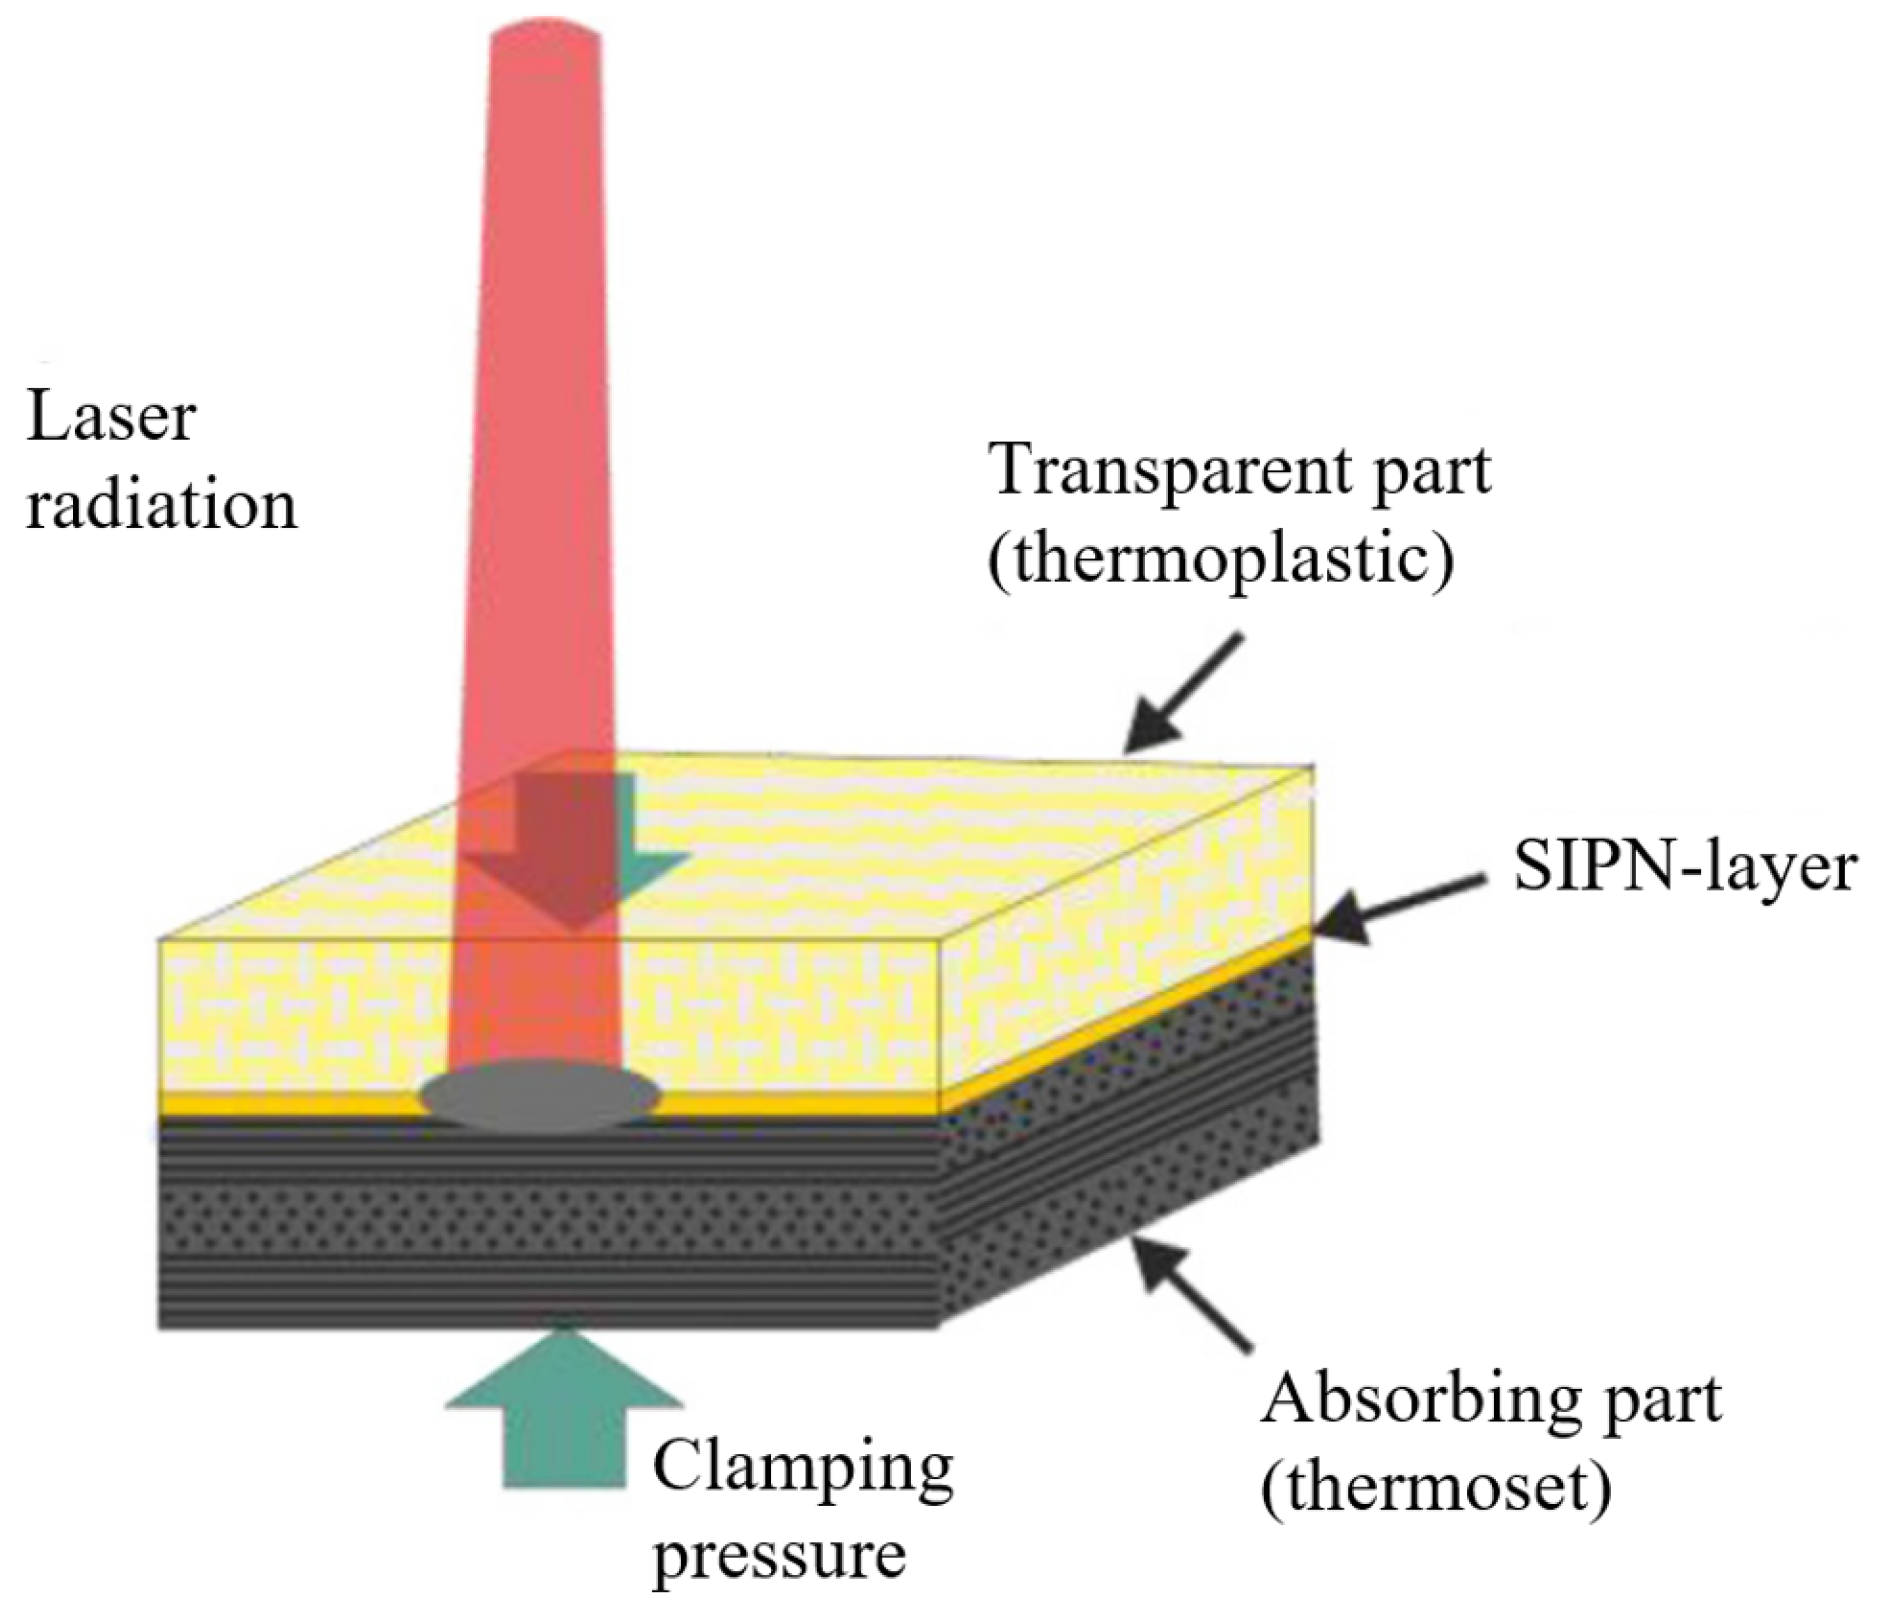
Figure 11.
Workflow used for manufacturing and mechanical testing of welded samples.
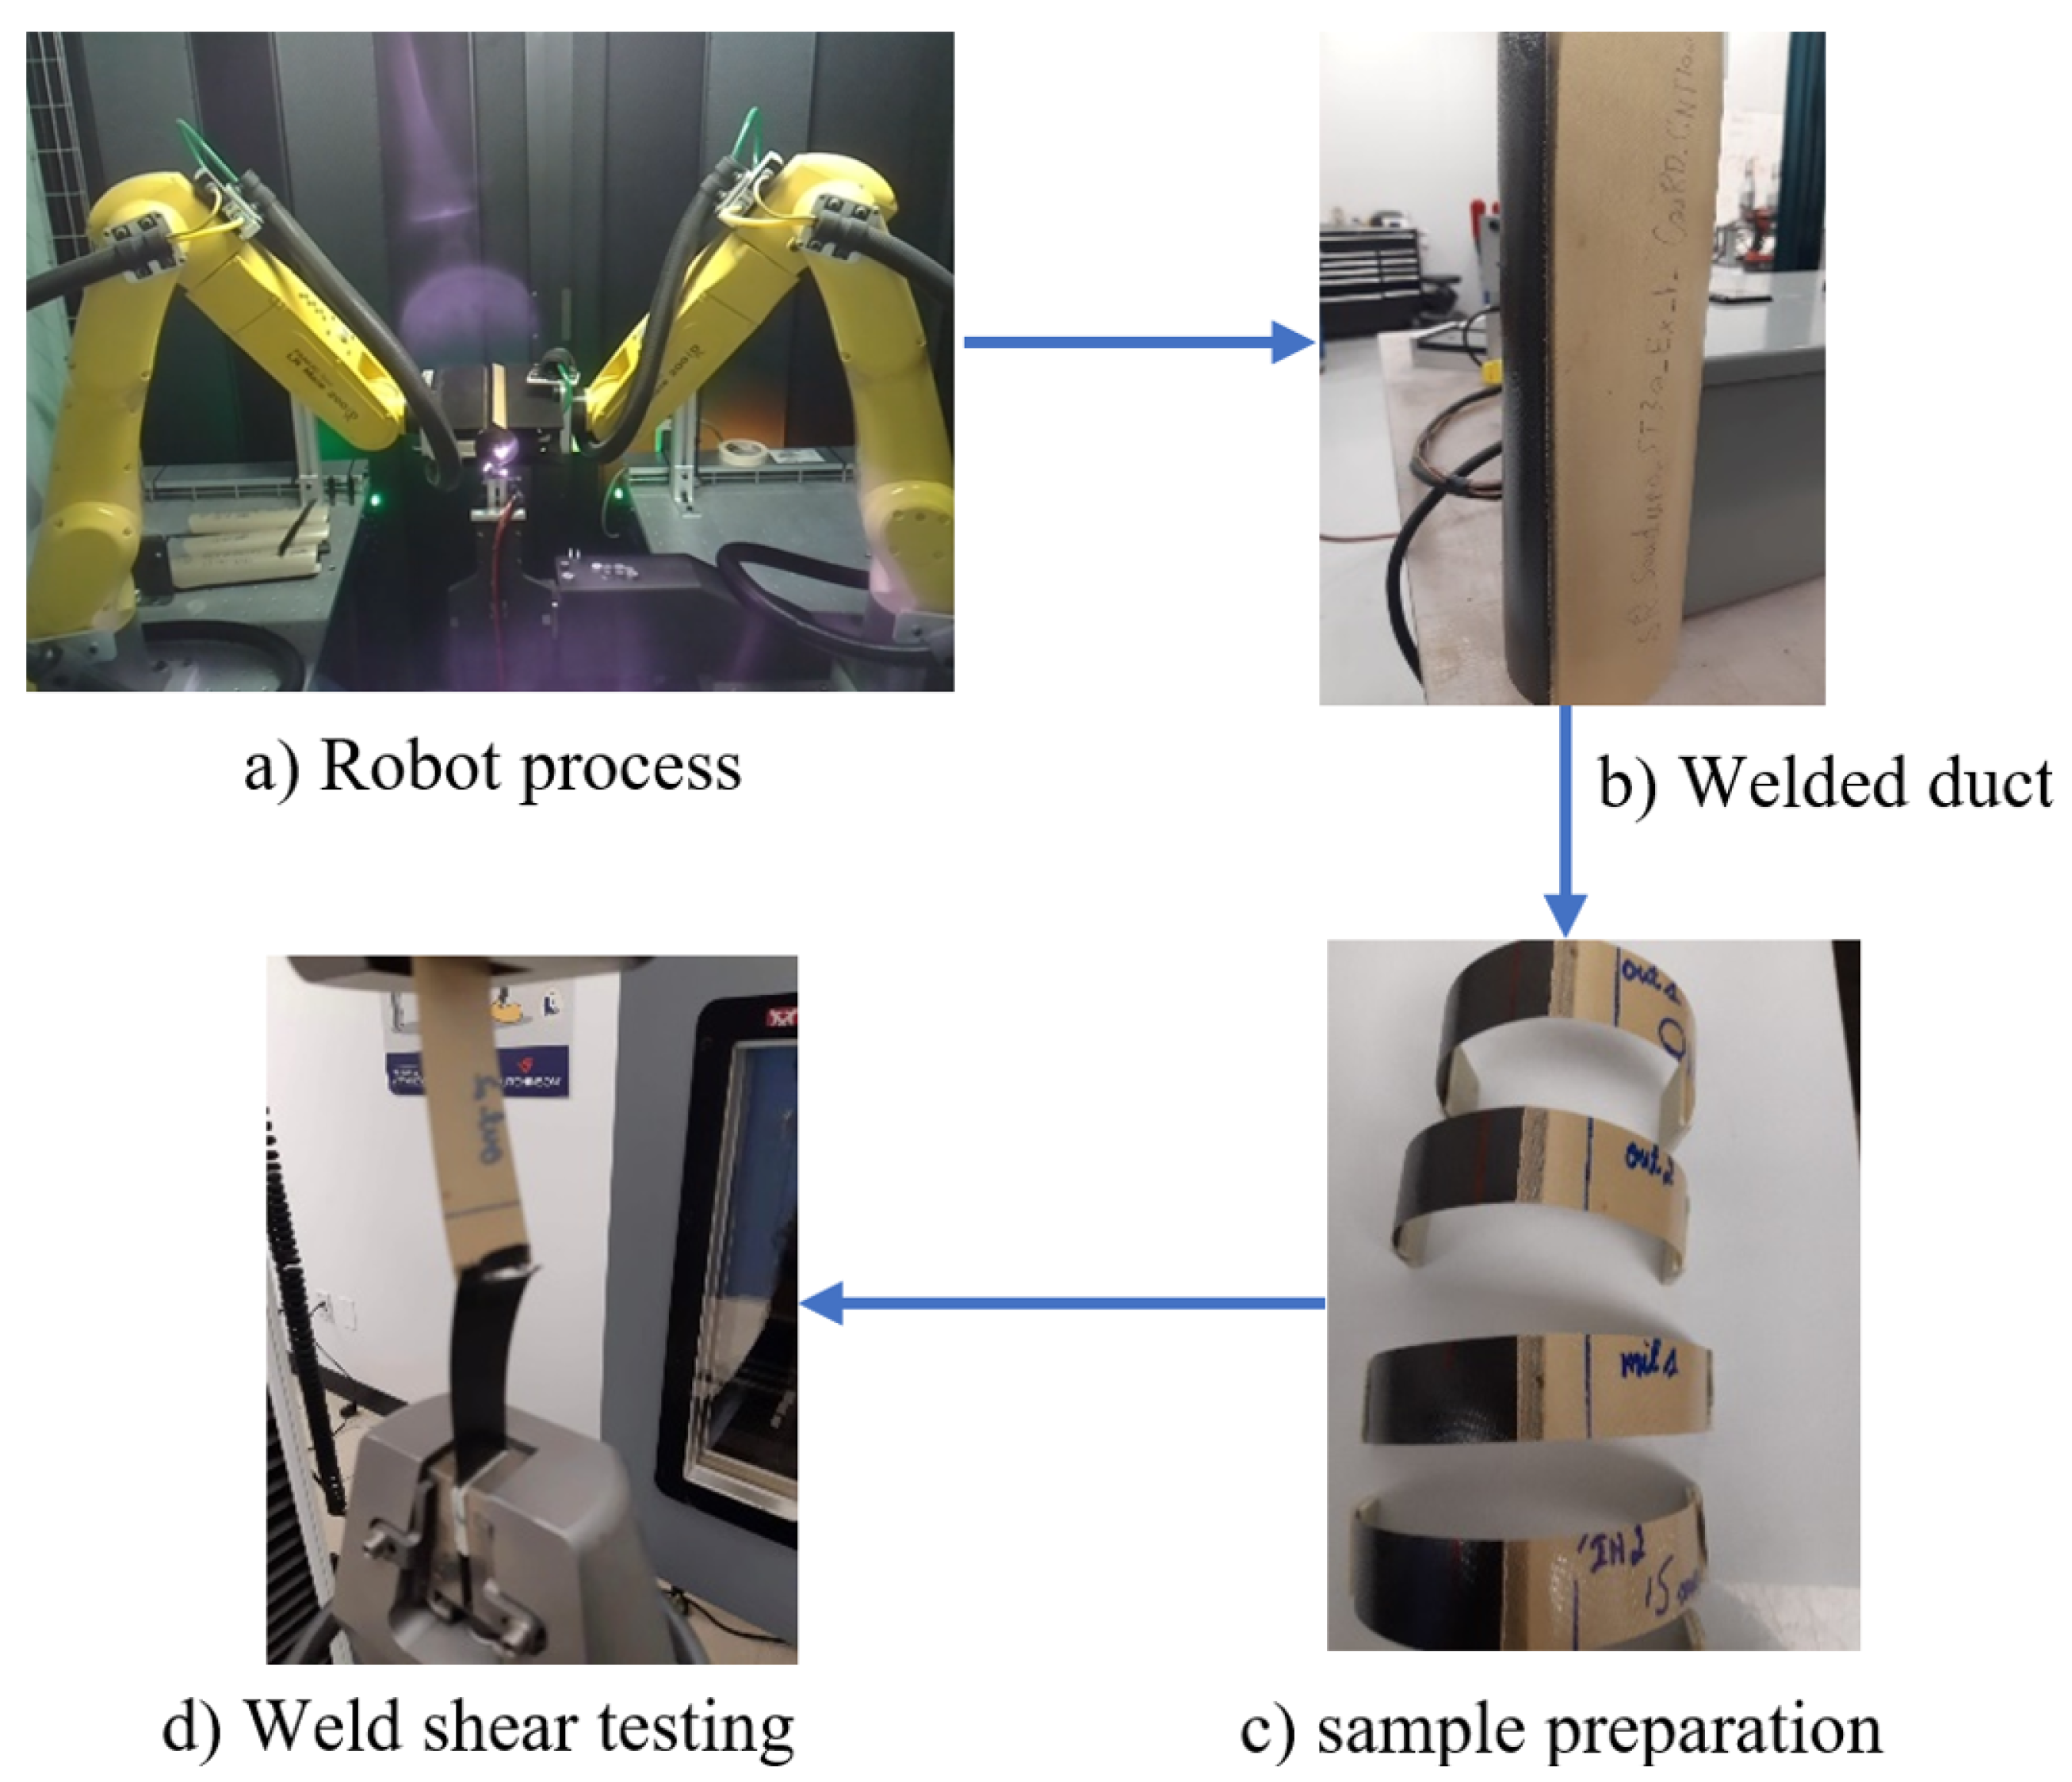
Figure 12.
Weld Shear strength (KN) with respect to Laser power (W) and operation speed (mm/s)
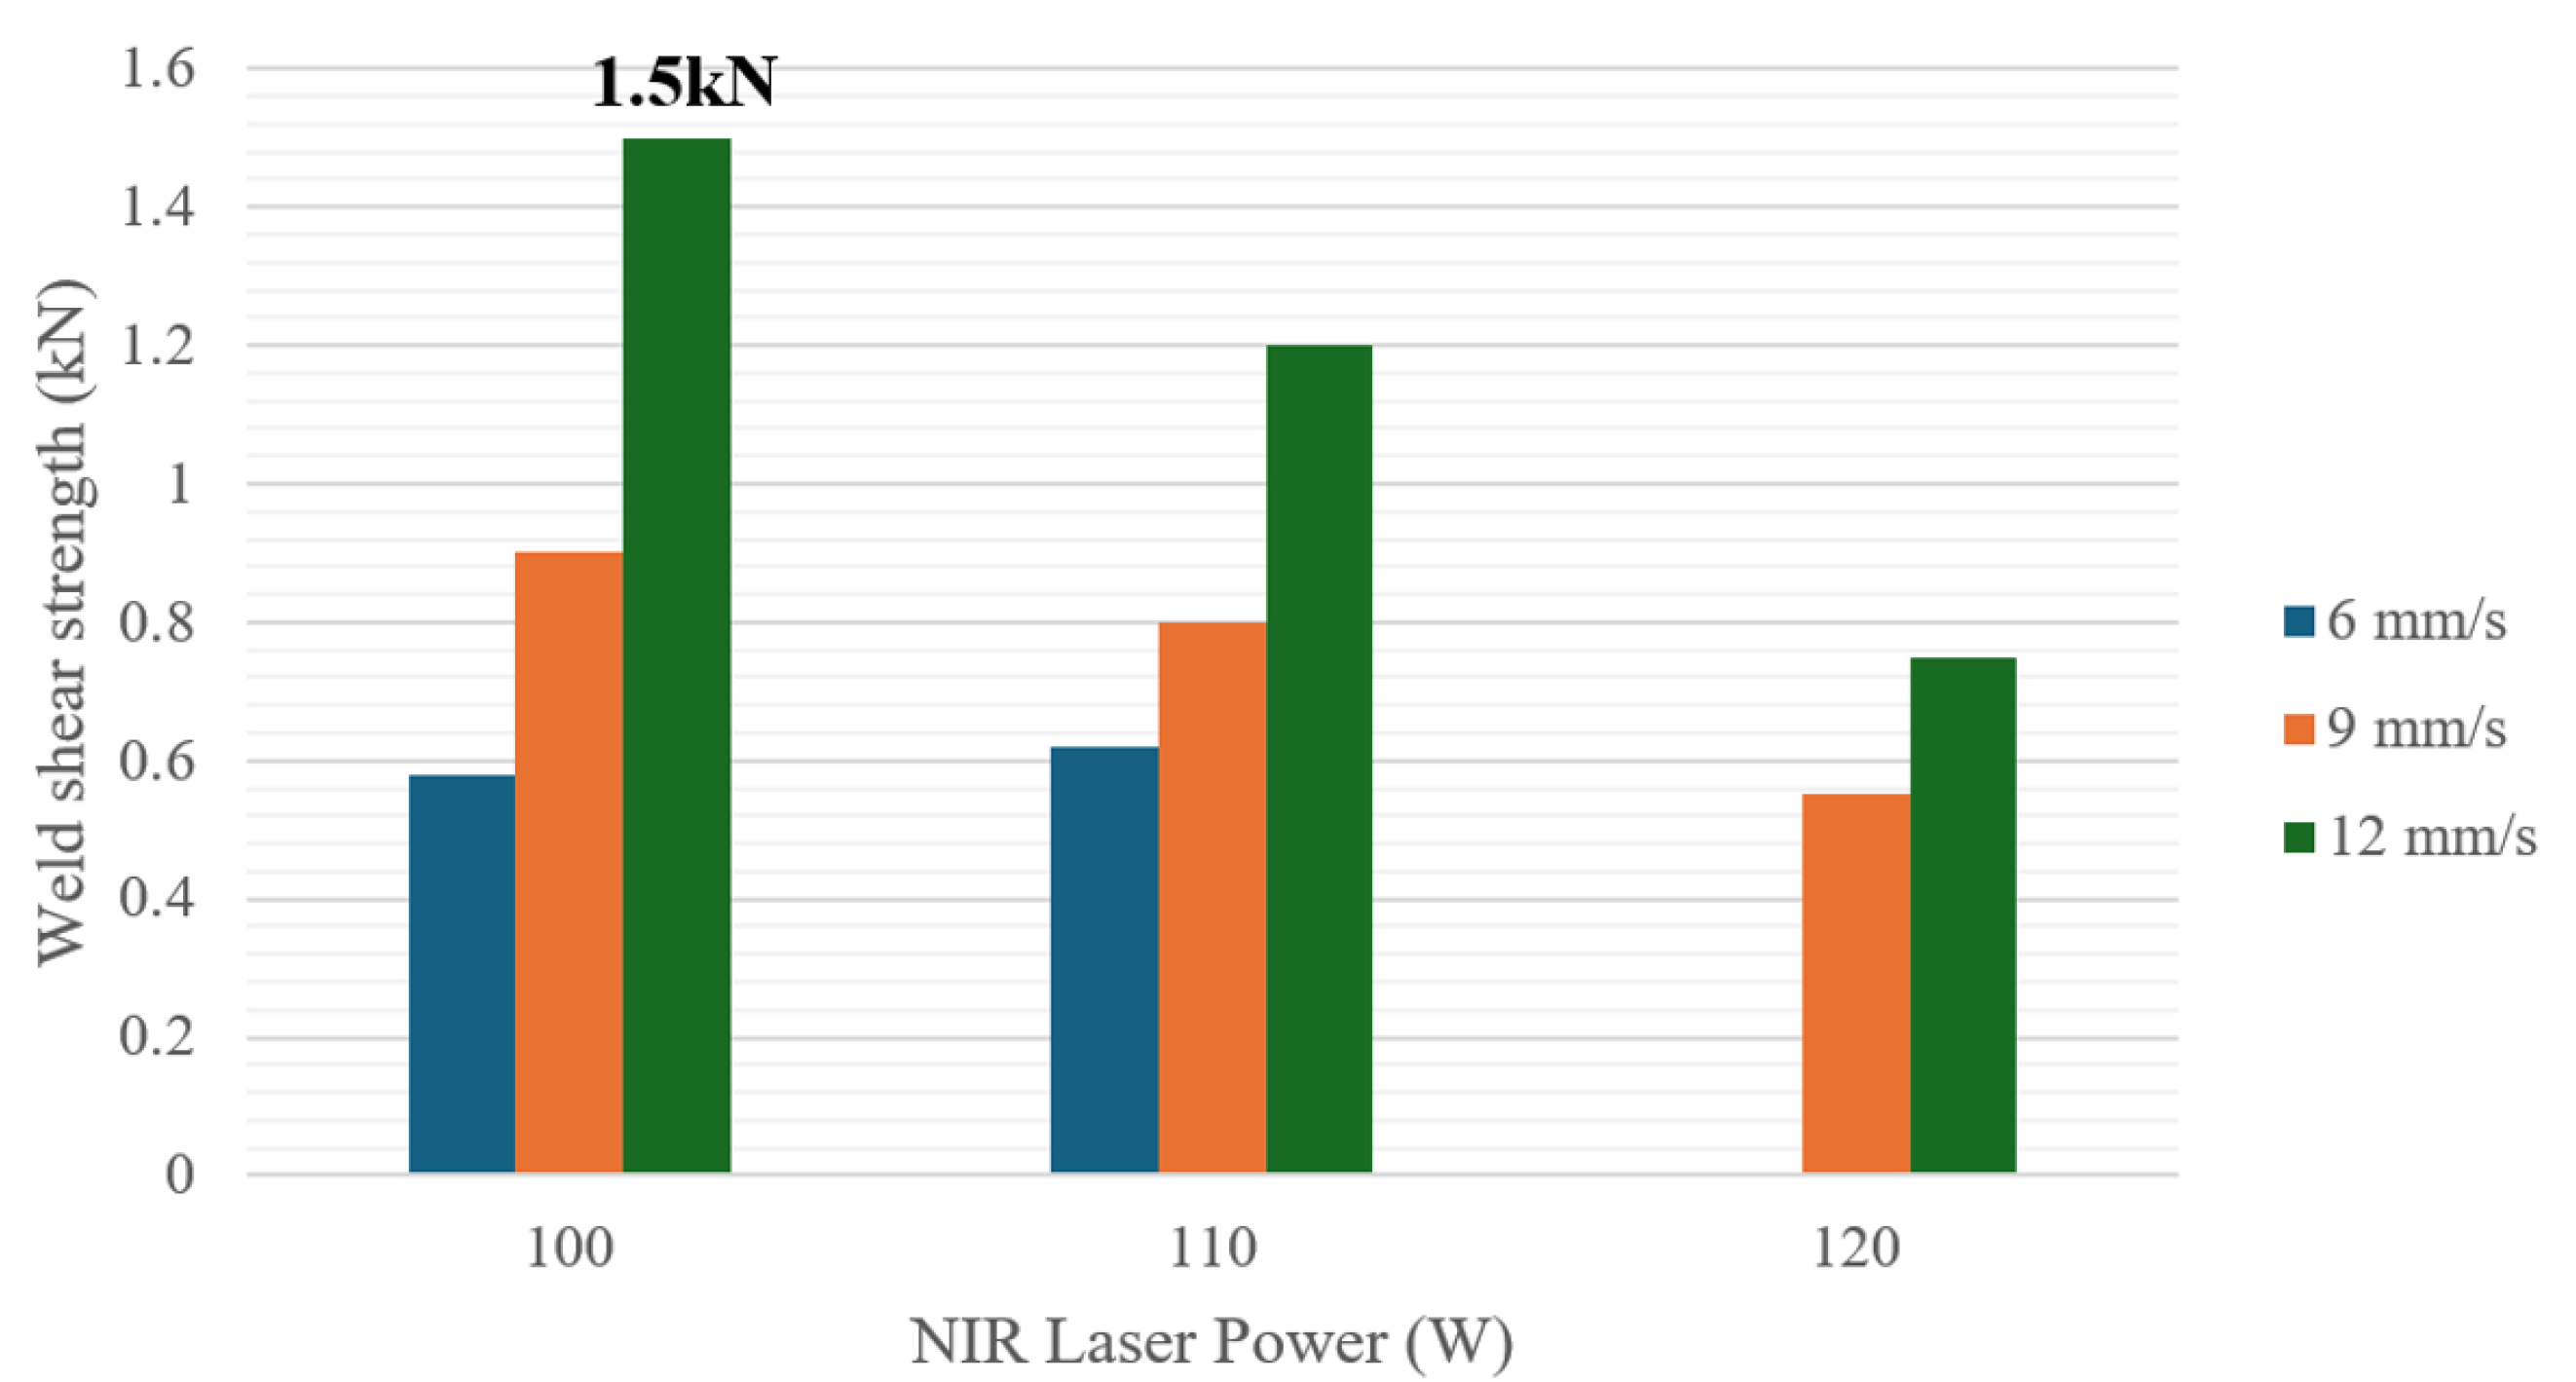
Figure 13.
Air leakage area at 7.5 psi
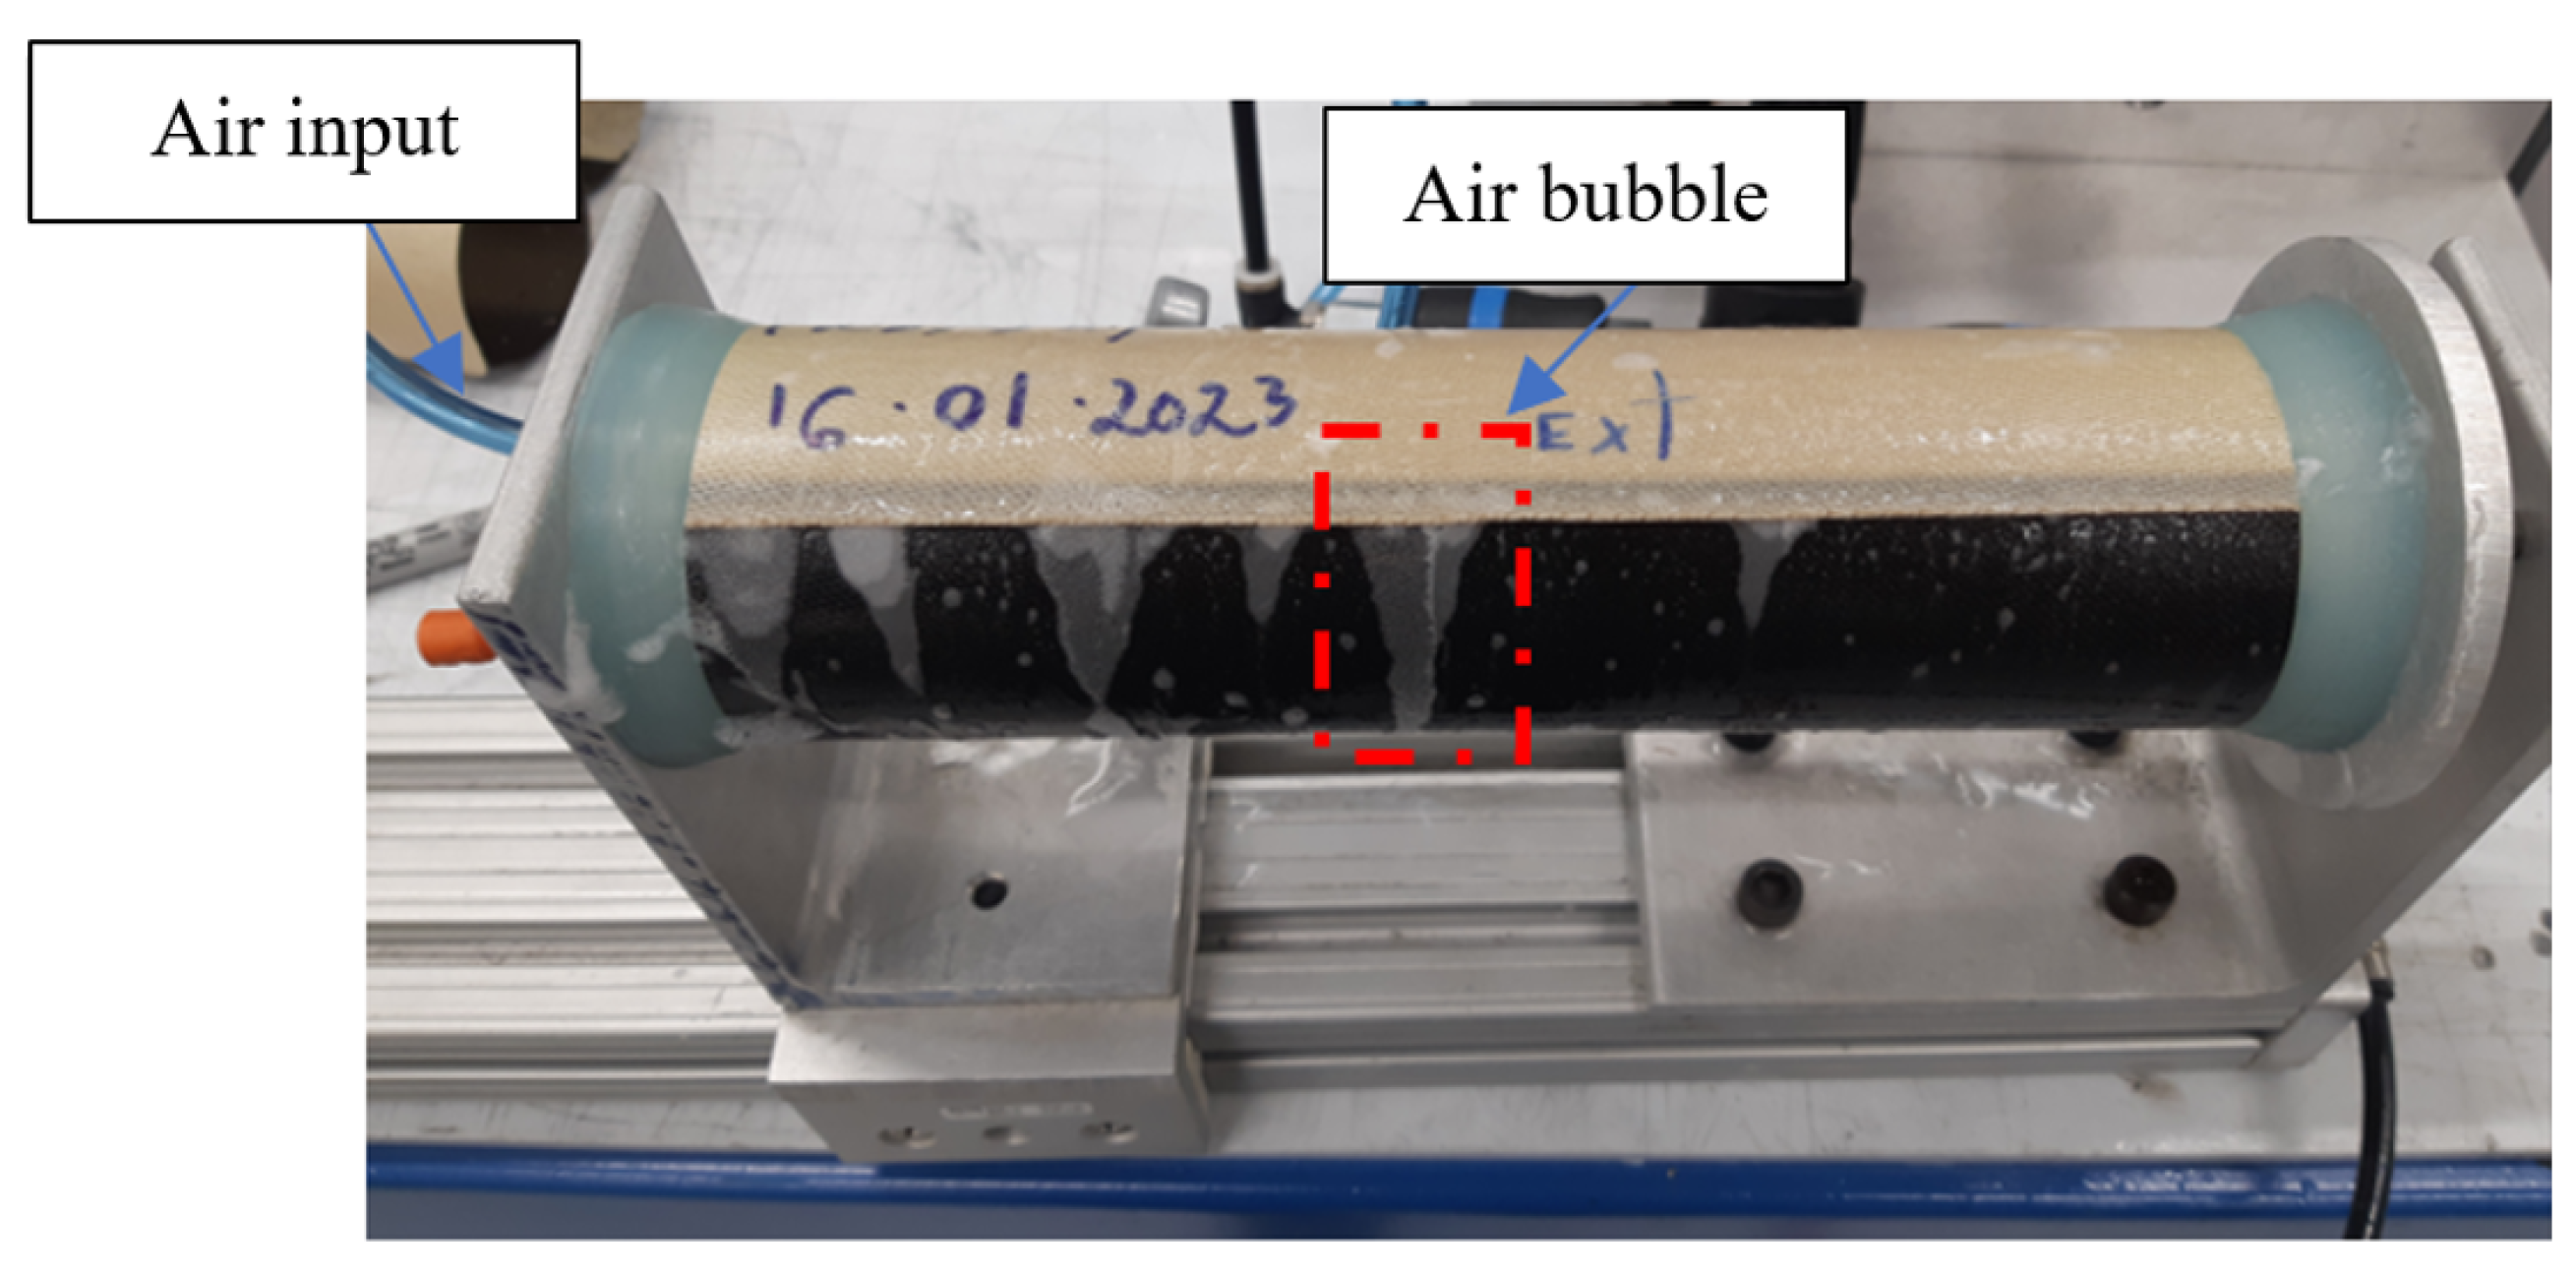
Figure 14.
Internal pressure variation (psi) over time (s)
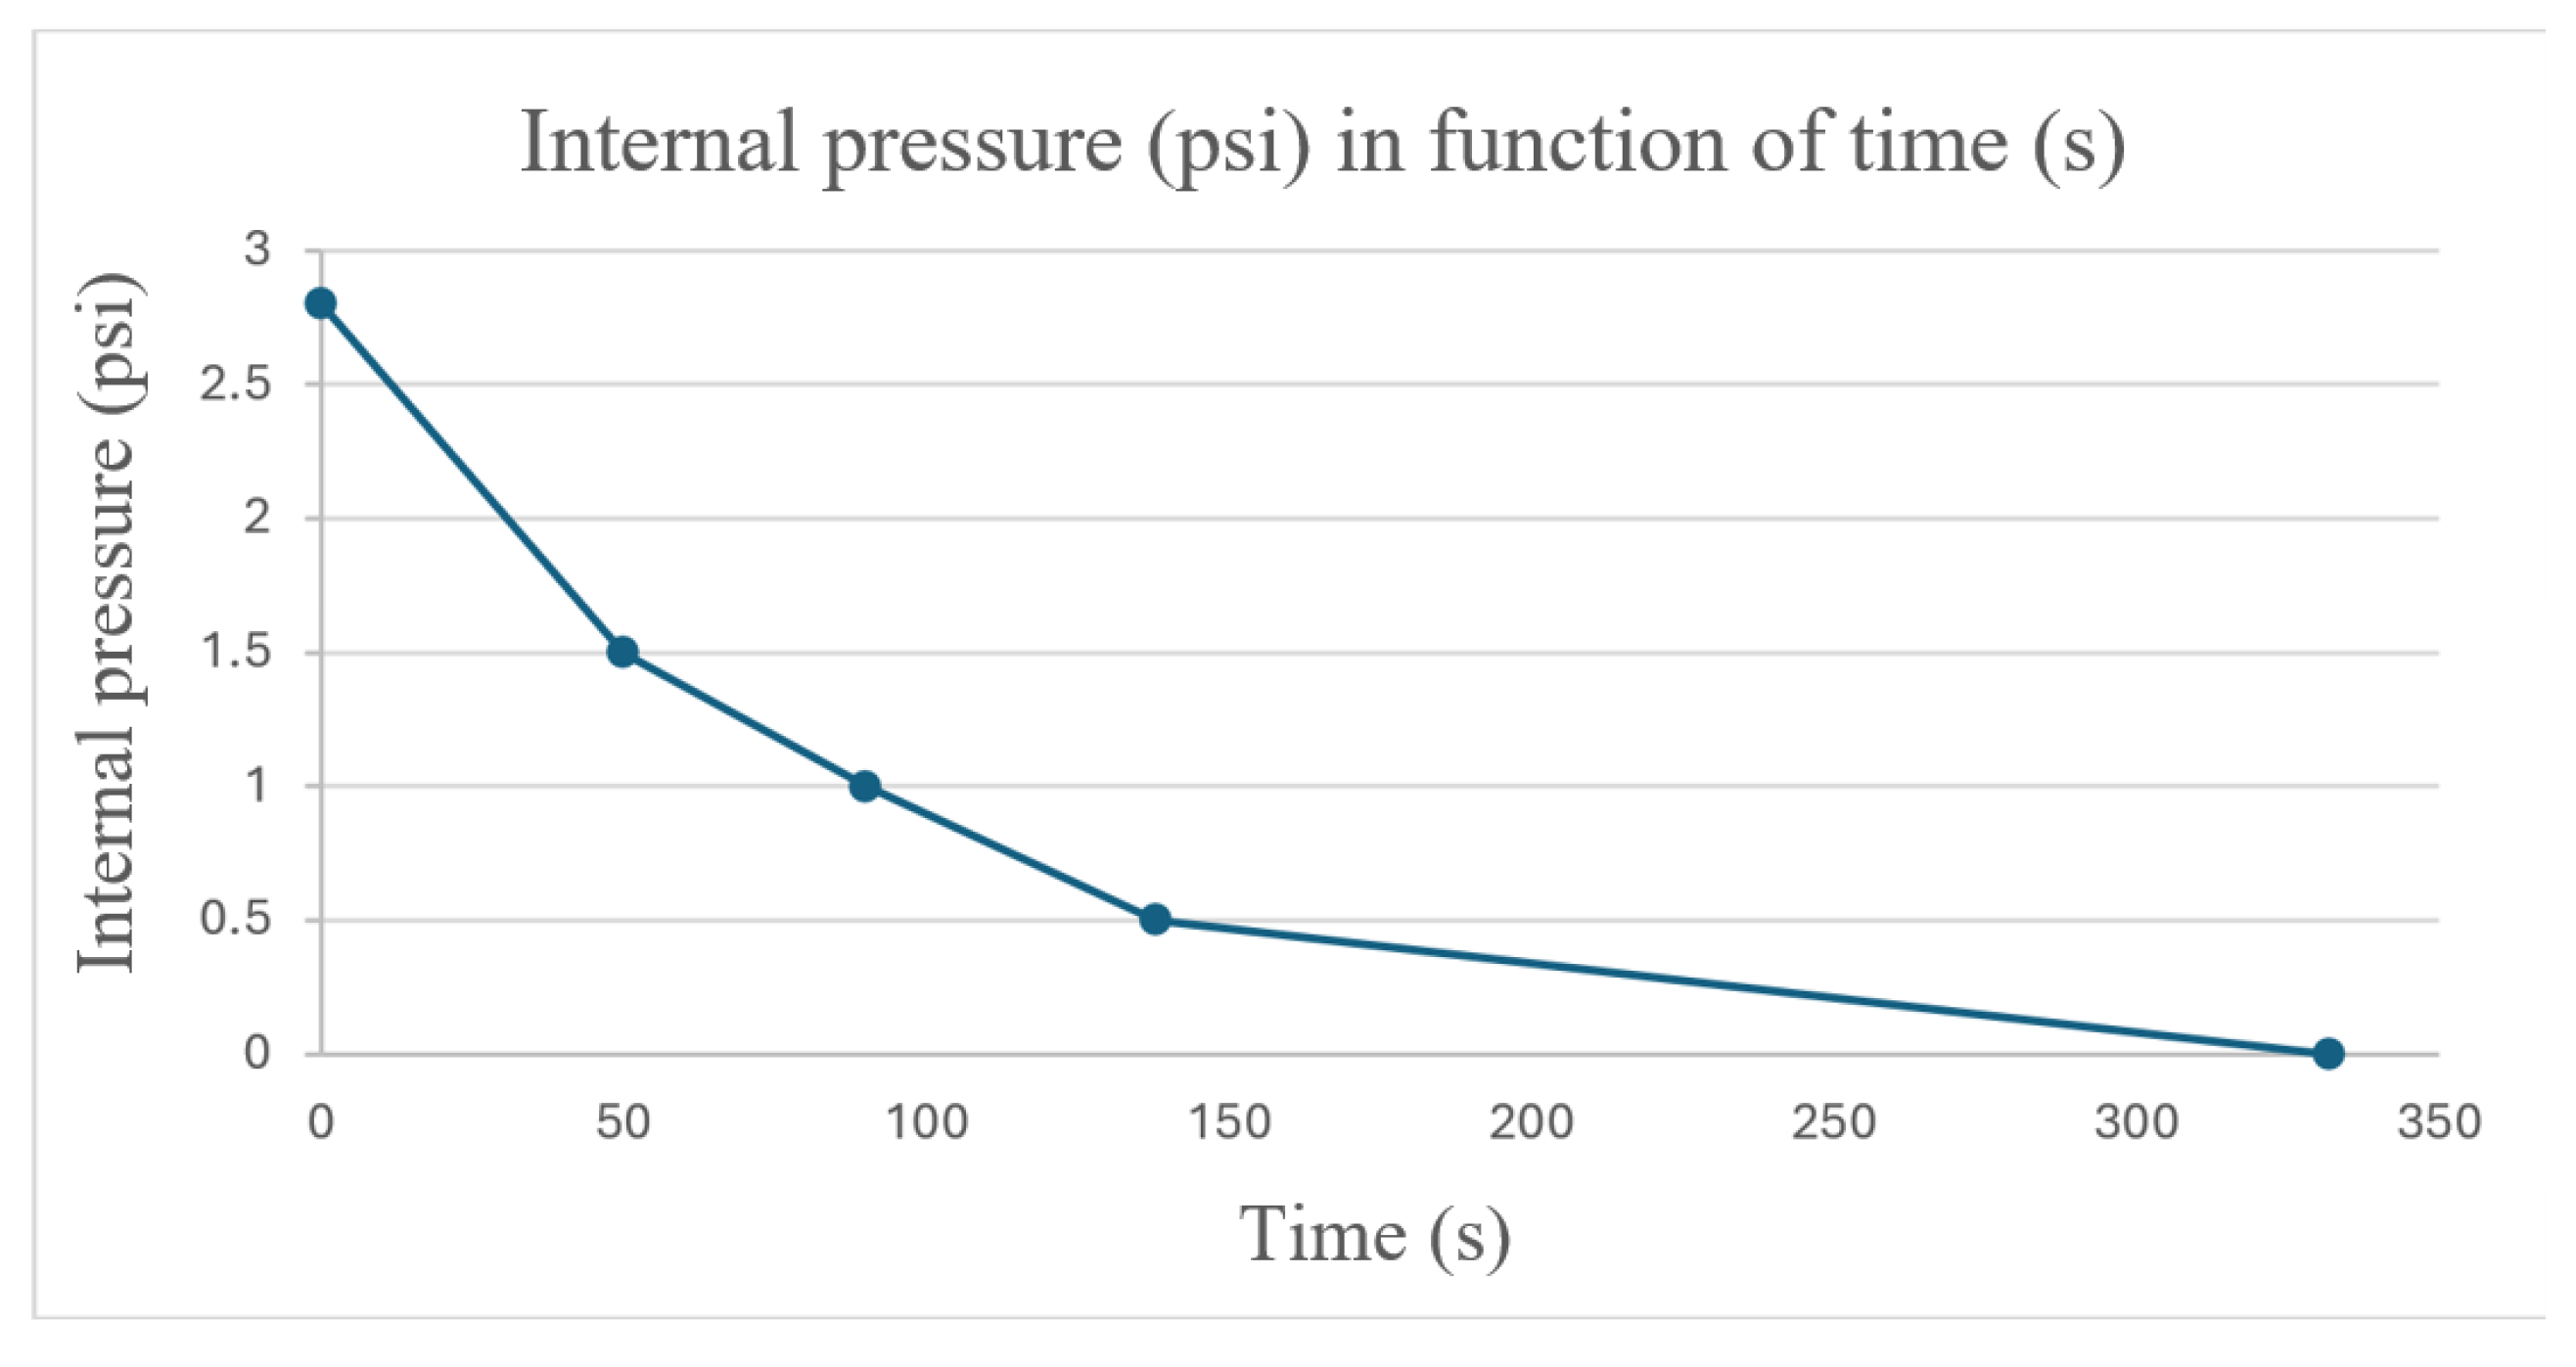
Figure 15.
Reinforced Thermoplastic 3D curve test part result
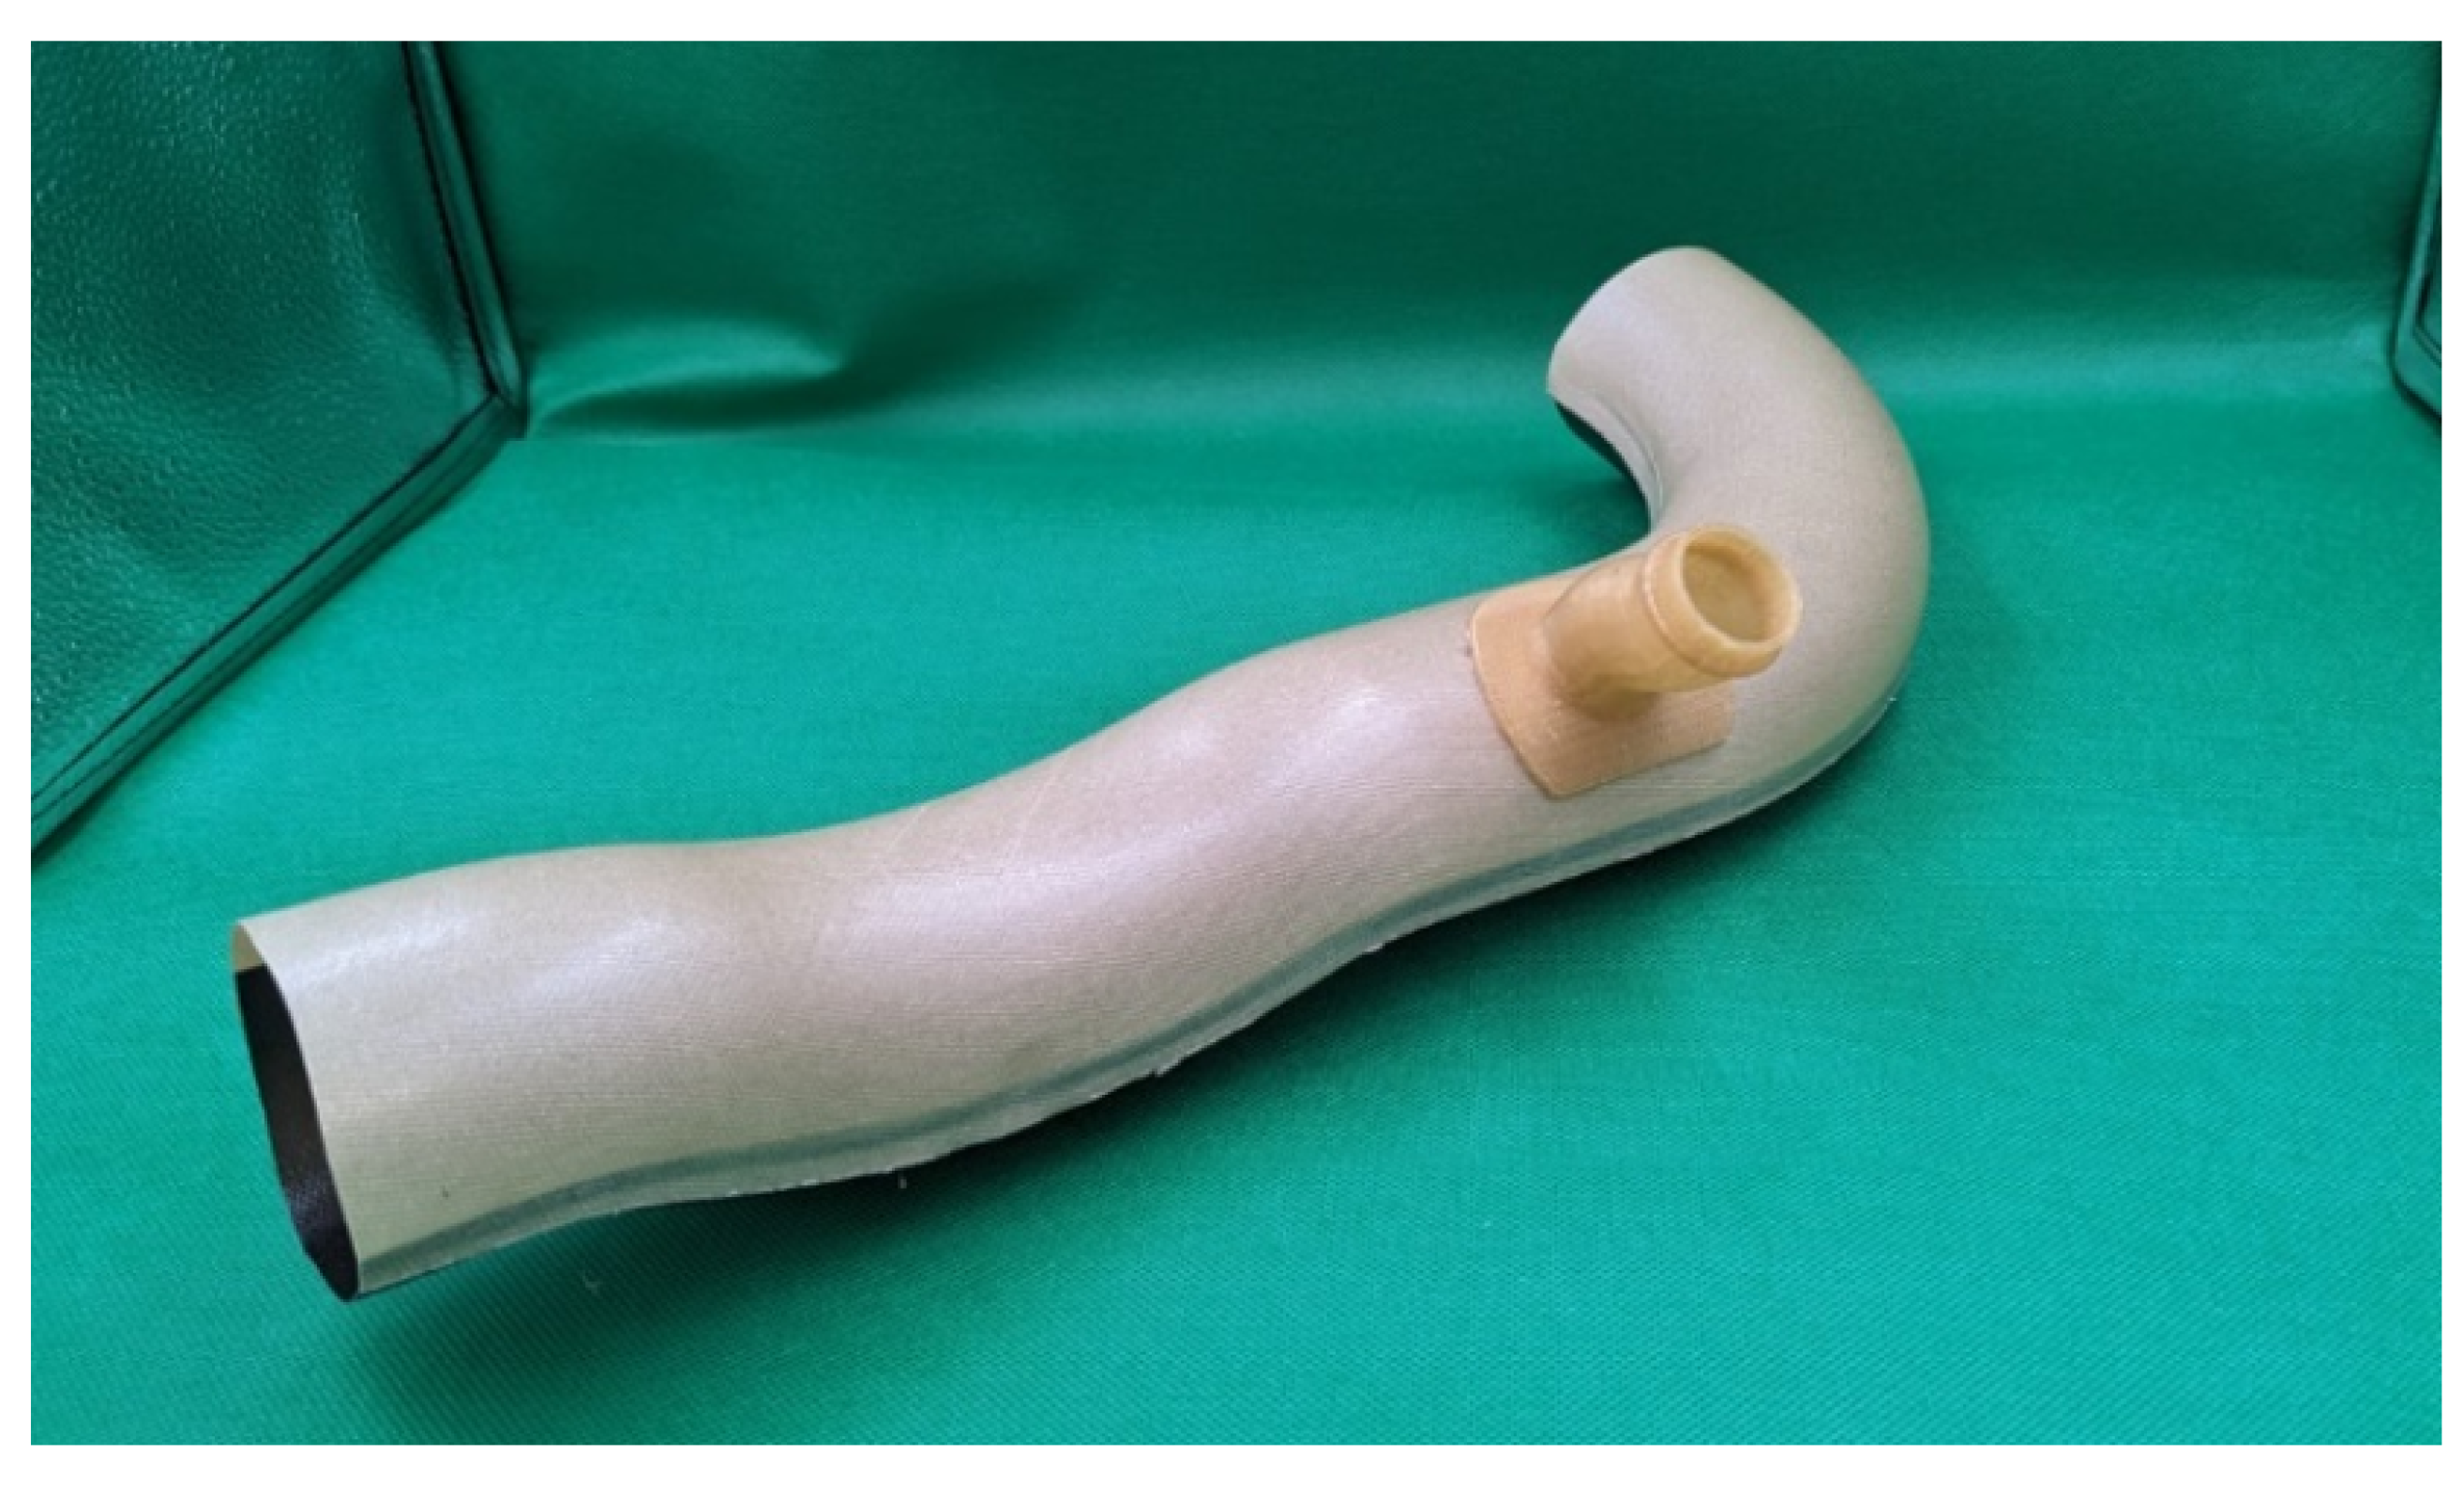
Figure 16.
a) Foam half-shell preform and b) final cutting result
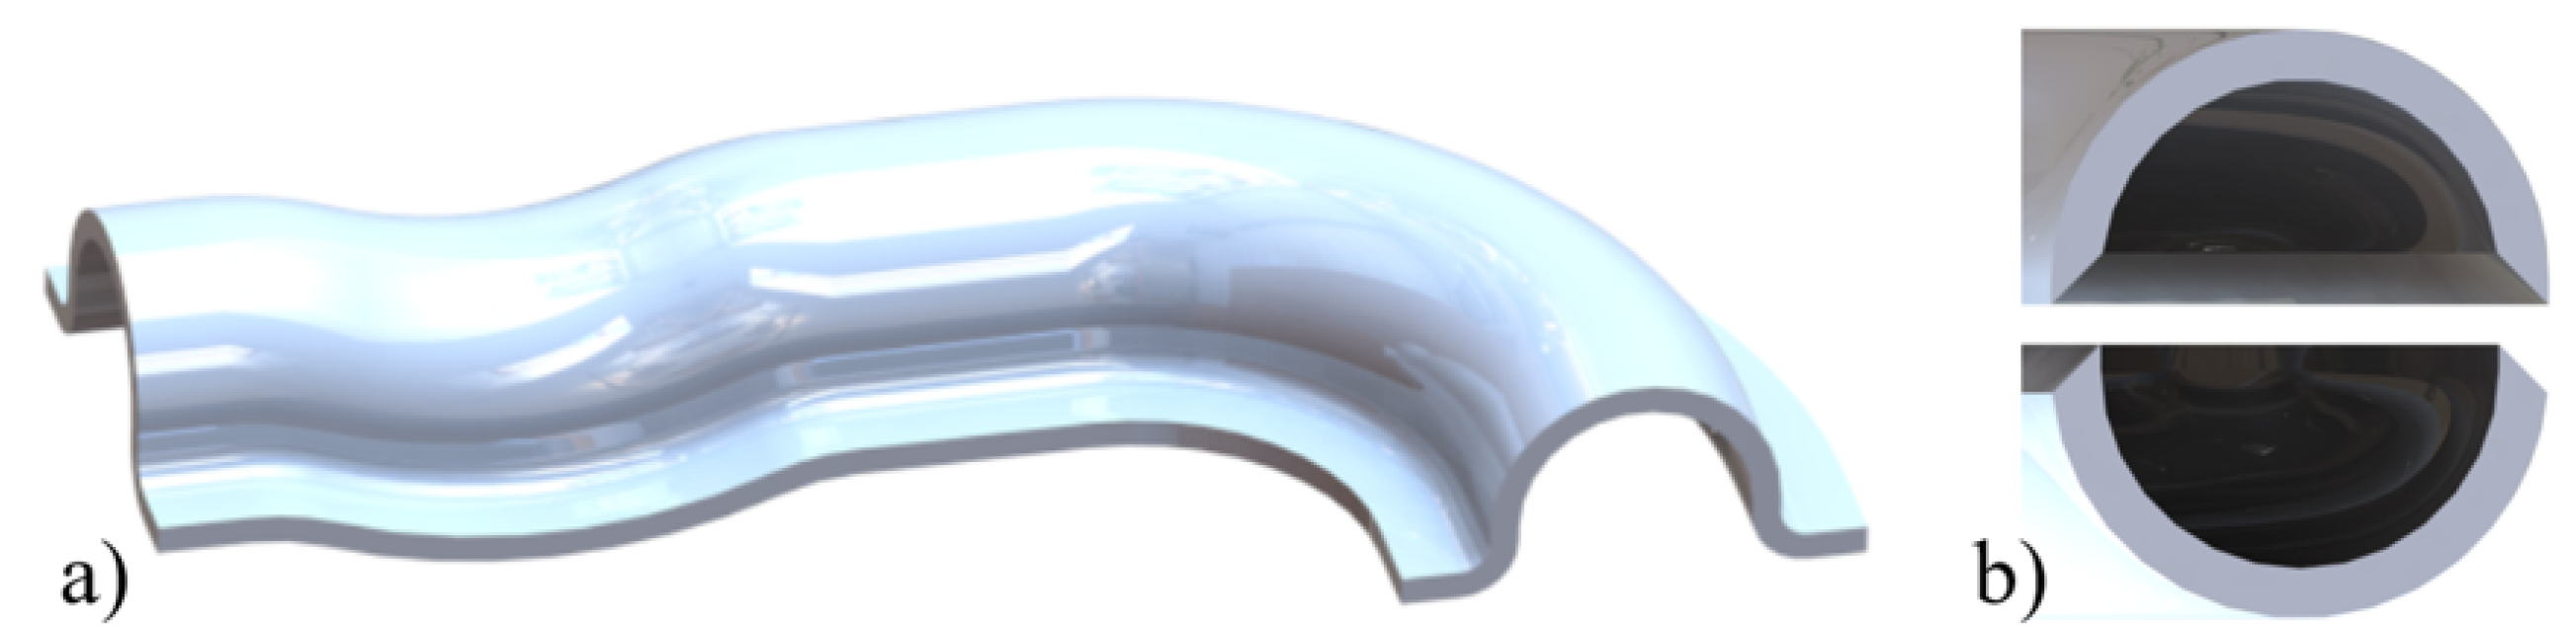
Figure 17.
Failures in cutting 3D-shaped foam: a) Initial snagging and deformation of the half-shell; b) Progression of the half-shell tearing
Figure 17.
Failures in cutting 3D-shaped foam: a) Initial snagging and deformation of the half-shell; b) Progression of the half-shell tearing
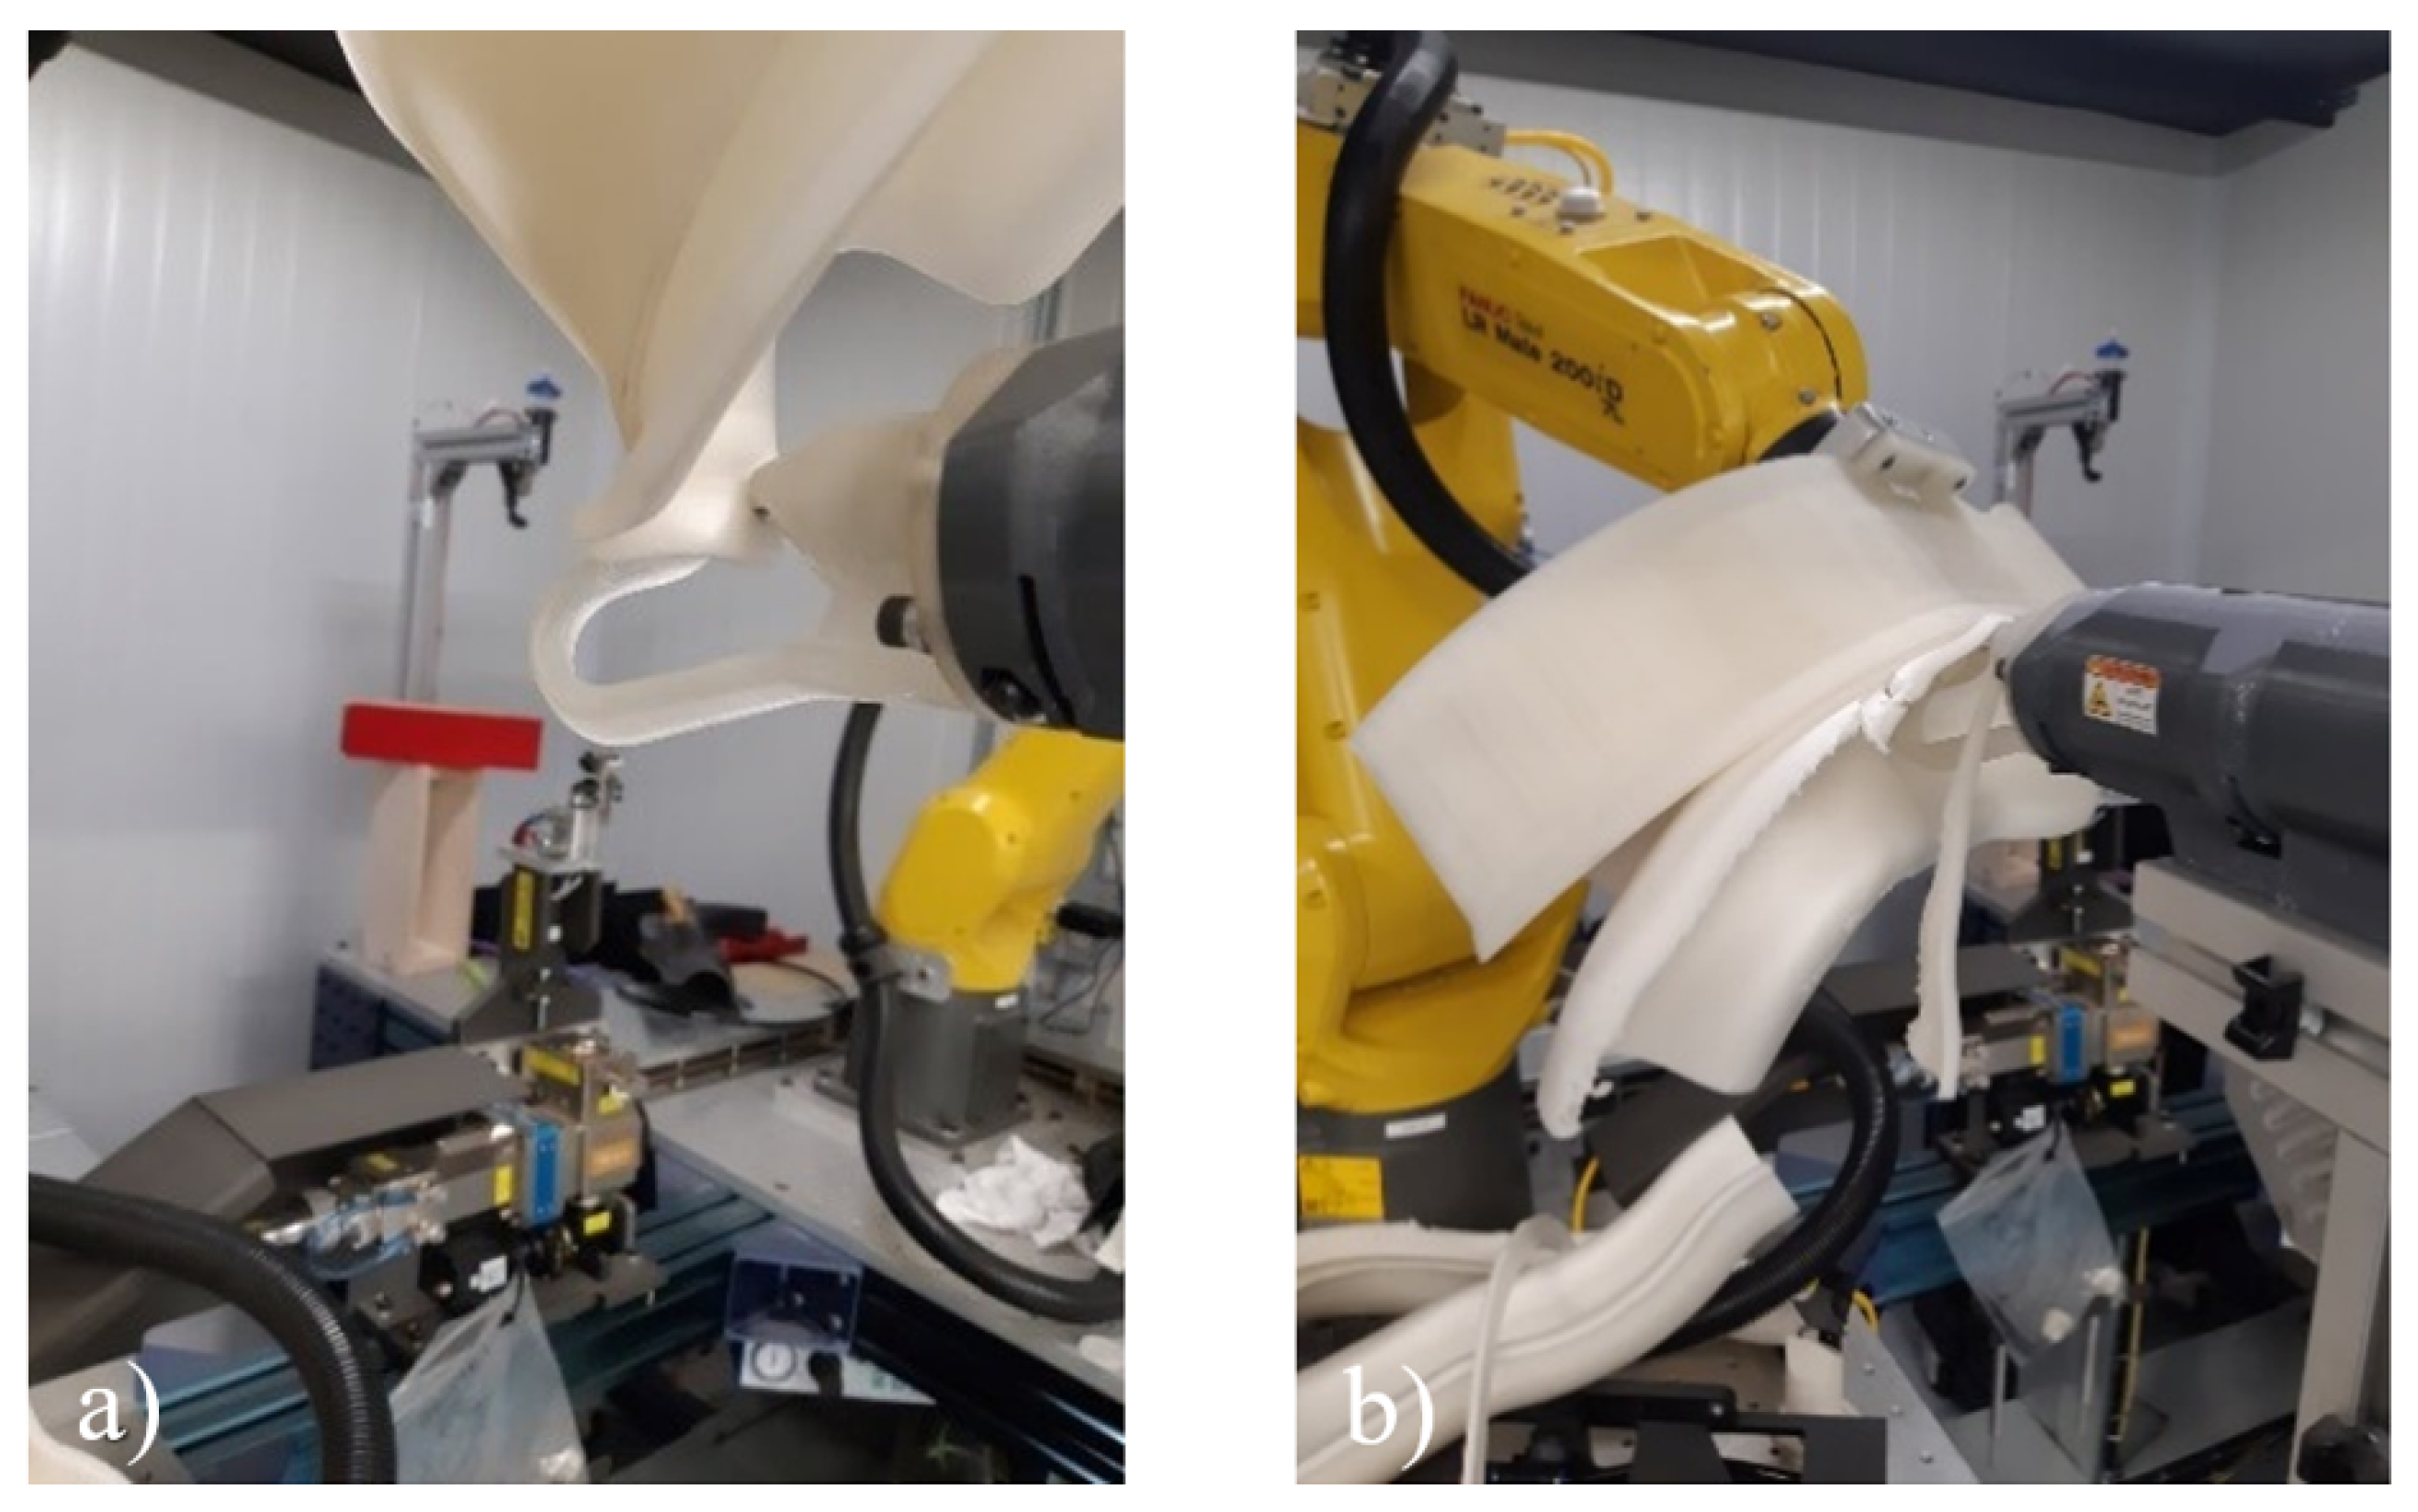
Figure 18.
Test setup for foam cutting using a Nichrome wire
Disclaimer/Publisher’s Note: The statements, opinions and data contained in all publications are solely those of the individual author(s) and contributor(s) and not of MDPI and/or the editor(s). MDPI and/or the editor(s) disclaim responsibility for any injury to people or property resulting from any ideas, methods, instructions or products referred to in the content. |
© 2026 by the authors. Licensee MDPI, Basel, Switzerland. This article is an open access article distributed under the terms and conditions of the Creative Commons Attribution (CC BY) license (http://creativecommons.org/licenses/by/4.0/).
Copyright: This open access article is published under a Creative Commons CC BY 4.0 license, which permit the free download, distribution, and reuse, provided that the author and preprint are cited in any reuse.


