

Submitted:
11 August 2026
Posted:
12 August 2026
You are already at the latest version
Abstract
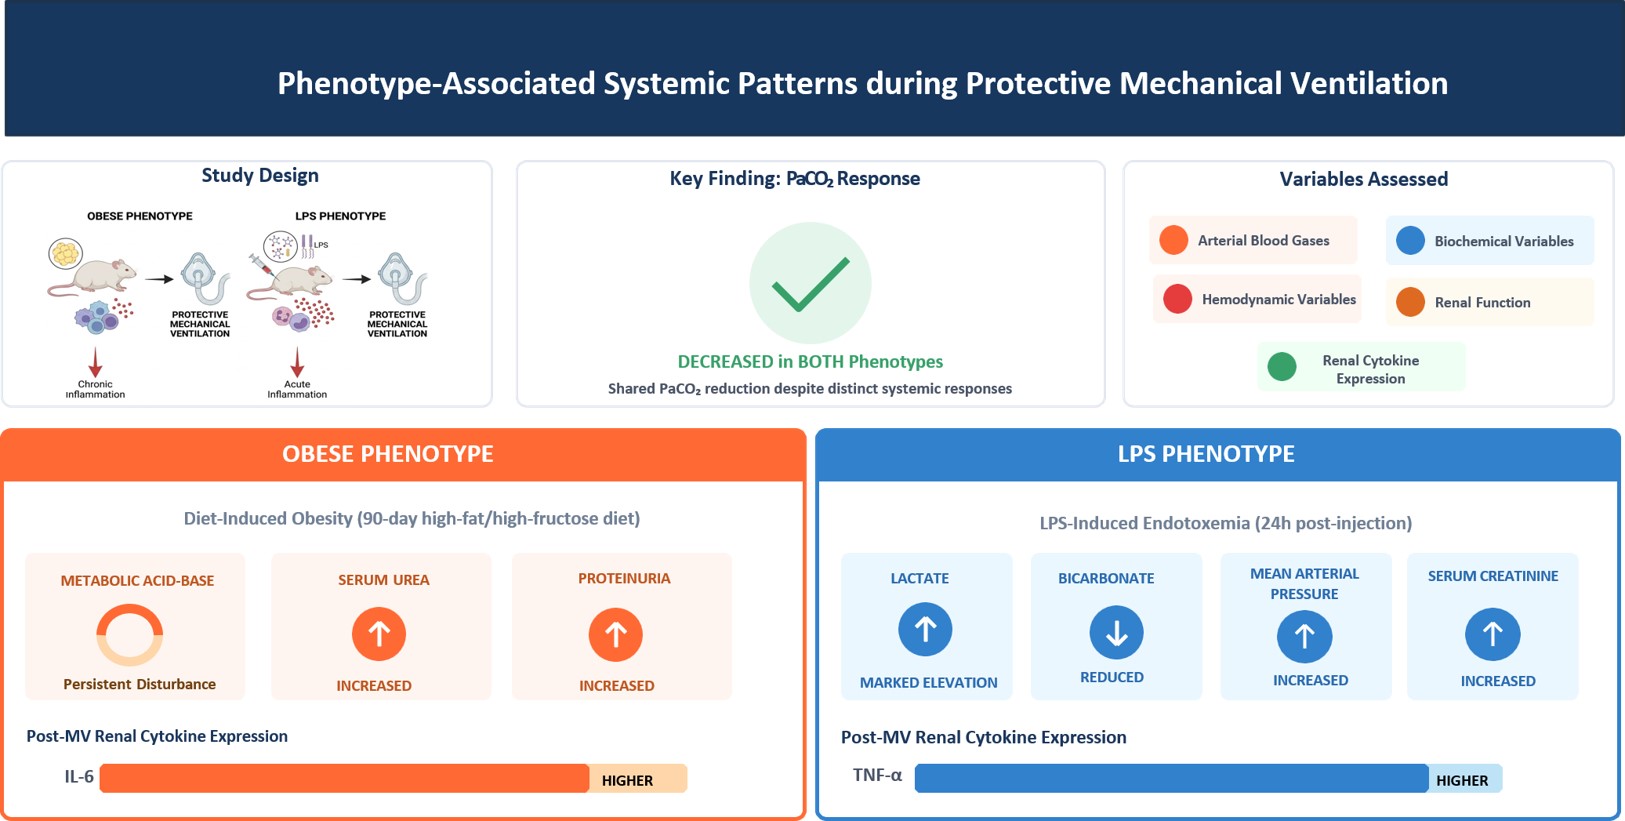
Mechanical ventilation may induce extrapulmonary responses shaped by the host inflammatory-metabolic background. This exploratory study characterized renal functional changes during 1 h of reduced-tidal-volume mechanical ventilation in male Wistar rats with diet-induced obesity or lipopolysaccharide (LPS)-induced endotoxemia, together with concurrent respiratory, acid–base, metabolic, and hemodynamic alterations. Arterial blood gas, biochemical, hemodynamic, and urinary variables were assessed at the pre-MV and post-MV time points. Renal protein expression was evaluated only at the post-MV time point. The arterial partial pressure of carbon dioxide (PaCO₂) decreased significantly in both groups. In the Obese group, metabolic acid–base abnormalities persisted and were accompanied by increases in serum urea and the urinary protein-to-creatinine ratio. In the LPS group, lactate increased, bicarbonate decreased, and mean arterial pressure and serum creatinine increased. At the post-MV time point, renal interleukin-6 expression was higher in the Obese group than in the LPS group, whereas renal tumor necrosis factor-alpha expression was higher in the LPS group than in the Obese group. These findings indicate that a shared reduction in PaCO₂ may coexist with phenotype-associated renal and systemic patterns. The results support the interpretation that physiological and renal changes observed during mechanical ventilation should be considered in relation to the underlying pathophysiology and inflammatory-metabolic context of the host.
Keywords:
mechanical ventilation
; inflammation
; acid–base balance
; renal function
; lactate metabolism
1. Introduction
Mechanical ventilation (MV) is an essential intervention in the management of acute respiratory failure; however, its effects extend beyond the pulmonary compartment. In addition to modifying alveolar ventilation and gas exchange, positive-pressure ventilation is associated with changes in systemic hemodynamics, acid–base balance, energy metabolism, inflammatory responses, and renal function. Increased intrathoracic pressure may reduce venous return, alter cardiac output, affect renal blood flow, and decrease glomerular filtration [1]. Furthermore, MV may contribute to renal dysfunction through inflammatory lung–kidney crosstalk [2].
Despite the adoption of protective strategies, mechanical ventilation remains associated with a risk of acute kidney injury, and distinguishing the effects of ventilatory support from those related to the severity of the underlying disease remains challenging in critically ill patients [3,4]. The development of individualized ventilatory strategies is therefore a central goal in intensive care medicine, as responses to mechanical ventilation are influenced by respiratory mechanics, underlying pathophysiology, and host comorbidities [5,6]. In this context, understanding how different inflammatory microenvironments shape systemic responses during reduced-tidal-volume ventilation may help clarify the extrapulmonary effects of mechanical ventilation, particularly those involving acid–base balance, lactate metabolism, hemodynamics, and renal function.
Obesity represents a clinically and experimentally relevant microenvironment of chronic low-grade metabolic inflammation [7]. From a respiratory standpoint, excess adipose tissue reduces functional residual capacity, increases pleural pressure, decreases respiratory system compliance, and promotes airway closure, atelectasis, hypoxemia, and susceptibility to hypercapnia [8]. The relationship between obesity, mechanical ventilation, and outcomes in critically ill patients remains complex. Although obesity is associated with an increased need for mechanical ventilation, epidemiological studies in critically ill and mechanically ventilated patients have, in some settings, reported mortality rates similar to those observed in patients without obesity. This apparent dissociation between greater respiratory support requirements and mortality has been described as the “obesity paradox” [9,10].
However, studies of mechanical ventilation in obesity have focused predominantly on respiratory mechanics and pulmonary variables, including lung volumes, positive end-expiratory pressure, airway pressures, atelectasis, and oxygenation [11]. Less is known about metabolic and renal responses during reduced-tidal-volume ventilation in the obesogenic microenvironment. This knowledge gap is relevant because obesity is not only an anatomical condition that alters respiratory mechanics, but also a systemic metabolic–inflammatory state associated with acid–base disturbances, altered energy metabolism, glycemic dysregulation, and increased renal susceptibility to critical stress [12].
In contrast, lipopolysaccharide-induced endotoxemia represents a model of acute systemic inflammation frequently used to study acute lung injury, organ dysfunction, and sepsis-related inflammatory responses [13]. Exposure to LPS triggers marked immune activation, pro-inflammatory cytokine release, increased vascular permeability, pulmonary impairment, hemodynamic alterations, and metabolic dysfunction [13]. In the context of mechanical ventilation, this acute endotoxin-driven microenvironment is particularly relevant because pulmonary inflammation, circulatory instability, lactate accumulation, and renal vulnerability may coexist during ventilatory support, thereby complicating the interpretation of systemic responses attributed to ventilation itself [14].
Thus, obesity and endotoxemia represent distinct inflammatory microenvironments: the former is chronic, metabolic, and low-grade, whereas the latter is acute, endotoxin-driven, and rapidly progressive. In this context, distinguishing inflammation related to mechanical ventilation, or biotrauma, from the pre-existing inflammatory state of the critically ill organism constitutes an important analytical challenge [15]. The concept of the “two-hit model” helps illustrate this complexity: an initial insult may sensitize pulmonary, vascular, and renal tissues, while mechanical ventilation is delivered against a pre-existing inflammatory and metabolic background [16,17,18]. Therefore, attributing molecular, metabolic, or renal alterations exclusively to ventilatory support may be inappropriate when the organism is already exposed to an active inflammatory microenvironment.
In this context, diet-induced obesity and LPS-induced endotoxemia represent contrasting inflammatory microenvironments, the former characterized by chronic low-grade metabolic inflammation and the latter by acute endotoxin-driven inflammation. Given their distinct baseline pathophysiology, the primary analytical approach focused on pre-to-post changes within each phenotype rather than on direct comparisons of the magnitude of change between phenotypes. This approach allowed each group to be interpreted relative to its own baseline state. Ventilatory settings were tailored to each experimental condition within a reduced-tidal-volume strategy intended to provide protective ventilation.
Accordingly, this exploratory study primarily characterized renal functional changes during 1 h of reduced-tidal-volume mechanical ventilation in male Wistar rats with diet-induced obesity or LPS-induced endotoxemia, while concurrent respiratory, acid–base, metabolic, and hemodynamic alterations were evaluated as complementary physiological domains. Direct between-phenotype comparisons were restricted to renal molecular markers assessed at the post-MV time point, including interleukin-10 (IL-10), interleukin-6 (IL-6), tumor necrosis factor-alpha (TNF-α), and angiotensin II (Ang II).
2. Material and Methods
2.1. Experimental Group Allocation and Mechanical Ventilation
All animal handling, housing, and experimental procedures were conducted in accordance with established institutional guidelines [19]. The study was approved by the Institutional Animal Care and Use Committee under protocol CEUA 2994070823. Male Wistar rats aged 6–8 weeks, with an initial body weight of 190–210 g, were used. Animals were housed either at the animal facility of the Federal University of São Paulo (UNIFESP), São Paulo, SP, Brazil, depending on the need for metabolic-cage housing.
A total of 19 animals were included in the study and maintained in individual cages or housed in pairs, with ad libitum access to water and either standard or high-calorie chow. Ambient temperature was maintained between 22 and 26 °C, and animals were kept under a 12-h light/dark cycle. Following a 7-day acclimatization period, the animals were assigned to the predefined experimental protocols according to the planned phenotype induction strategy.
In the Obese group (n = 11), obesity was induced over 90 days using a high-fat/high-fructose diet with a caloric profile of 15.3% protein, 16.4% carbohydrates, and 68.3% fat. The diet formulation contained 20% fructose and 35% lard and had an energy density of 5.6 kcal/g (RH19543; Rhoster Indústria e Comércio Ltda., SP, Brazil).This protocol was based on a high-fat/high-fructose diet-induced obesity model previously standardized by our group to investigate obesity-associated renal, metabolic, hemodynamic, and structural alterations [7]. On day 91, the animals underwent mechanical ventilation.
In the LPS group (n = 8), endotoxemia was induced by intraperitoneal administration of lipopolysaccharide (LPS) from Escherichia coli O111:B4 (Sigma-Aldrich, MO, USA). LPS was administered at a dose of 5 mg/kg after dilution in phosphate-buffered saline (PBS) [20]. These animals received a standard diet containing 20.6% protein, 61.7% carbohydrates, 17.7% lipids, and 10% sucrose, with an energy density of 3.9 kcal/g (AIN-93; Rhoster Indústria e Comércio Ltda., SP, Brazil). Twenty-four hours after LPS administration, the animals underwent mechanical ventilation.
Before surgical preparation, animals received morphine (2.5 mg/kg, intraperitoneally) for analgesia, followed by sodium pentobarbital (50 mg/kg, intraperitoneally; Syntec, Brazil) for anesthesia. Supplemental pentobarbital was administered as needed to maintain an adequate anesthetic plane. During anesthetic induction and surgical preparation, animals received 100% oxygen. After tracheostomy, they were connected to a VentElite 55-7040 ventilator (Harvard Apparatus, Jiangsu, China), designed for small animals and capable of operating in volume- or pressure-controlled modes. The device allows adjustment of tidal volume from 50 µL to 5 mL and peak inspiratory pressure from 0 to 50 cmH₂O.
Ventilatory settings were defined according to the experimental condition and documented throughout the protocol. The recorded variables included set tidal volume, applied positive end-expiratory pressure (PEEP), peak inspiratory pressure, respiratory rate, and fraction of inspired oxygen (FiO₂). After connection to the ventilator, FiO₂ was adjusted to 0.50. The pre-MV arterial blood sample was then collected before the start of the predefined 1-h experimental ventilation period. FiO₂ was maintained at 0.50 throughout both the pre-MV assessment and the subsequent ventilation period.
In the Obese group animals were mechanically ventilated for 1 h using a reduced-tidal-volume strategy adapted to the respiratory mechanics associated with obesity and intended to limit ventilation-associated lung injury. The recorded set tidal volume ranged from 2.5 to 4.0 mL and, after normalization to body weight, corresponded to 5.90 ± 0.62 mL/kg. Peak inspiratory pressure was 17.8 ± 2.1 cmH₂O, PEEP was maintained at 1 cmH₂O, respiratory rate at 90 breaths/min, and FiO₂ at 0.50. The use of reduced tidal volumes was based on protective ventilation principles described in obesity; whereby tidal volume limitation is intended to reduce excessive alveolar distension. The interpretation of airway pressure in obesity also considered the contribution of increased chest wall and pleural pressures to measured airway pressure [21,22,23,24]. A low PEEP level was selected to avoid zero PEEP while limiting the potential hemodynamic effects of higher positive-pressure levels during the short-term protocol [23,24].
In the LPS group, animals were mechanically ventilated for 1 h using a ventilation strategy intended to limit ventilation-associated lung injury, based on experimental studies of LPS-induced lung injury and protective ventilation principles applied in acute respiratory distress syndrome [14,25]. The ventilator was set to deliver a nominal tidal volume of 4.0 mL, corresponding to 8.65 ± 0.11 mL/kg after normalization to body weight (n = 8). Peak inspiratory pressure was 13.1 ± 0.7 cmH₂O, PEEP was maintained at 1 cmH₂O, respiratory rate at 90 breaths/min, and FiO₂ at 0.50. These settings were selected to limit exposure to tidal volumes associated with experimental ventilator-induced lung injury. A PEEP of 1 cmH₂O was maintained as a conservative approach, avoiding zero PEEP while limiting the potential hemodynamic effects of higher levels of positive end-expiratory pressure during the short-term protocol [26,27]. Figure 1 summarizes the experimental design.
2.2. Arterial Blood Gas Analysis and Acid–Base Parameters
Arterial blood gas analysis was performed during the pre-MV and post-MV periods. The following parameters were assessed: pH, partial pressure of carbon dioxide (PaCO₂), partial pressure of oxygen (PaO₂), plasma bicarbonate (HCO₃⁻), chloride (Cl⁻), hematocrit (Ht), lactate, sodium (Na⁺), potassium (K⁺), ionized calcium (Ca²⁺), blood base excess (BE-B), and non-fasting blood glucose. Analyses were performed using a previously calibrated GEM Premier 3500 analyzer with an iQM 150 GEM Premier cartridge (Instrumentation Laboratory Co., MA, USA), according to the manufacturer’s instructions. Hemoglobin (Hb) was estimated from hematocrit using the following formula: Hb (g/dL) = Ht (%)/3. The PaO₂/FiO₂ ratio was calculated with FiO₂ expressed as a decimal fraction and used as an index of oxygenation and pulmonary gas exchange [28].
2.3. Acid-Base Indices
The acid–base indices were calculated during the pre-MV and post-MV periods using the following formulas [29]: anion gap = Na⁺ − (Cl⁻ + HCO₃⁻), where Na⁺ represents serum sodium concentration, Cl⁻ represents serum chloride concentration, and HCO₃⁻ represents plasma bicarbonate concentration. The apparent strong ion difference (SID) was calculated as SID = (Na⁺ + K⁺) − Cl⁻, where K⁺ represents serum potassium concentration [30].
2.4. Assessment of Alveolar Oxygen Pressure and the Alveolar–Arterial Oxygen Gradient
Alveolar oxygen pressure (PAO₂) was estimated for each animal at the pre-MV and post-MV time points using the alveolar gas equation: PAO₂ = FiO₂ × (PB − PH₂O) − PaCO₂/RQ, assuming FiO₂ = 0.50, barometric pressure (PB) = 760 mmHg, water vapor pressure (PH₂O) = 47 mmHg, and a respiratory quotient (RQ) of 0.8. The corresponding alveolar–arterial oxygen gradient was then calculated as the A–a gradient = PAO₂ − PaO₂ [31].
2.5. Assessment of Mean Arterial Pressure (MAP)
Mean arterial pressure (MAP) was assessed invasively during the pre-MV and post-MV periods. After confirmation of an adequate anesthetic plane, the animals were placed in the supine position, and the ventral cervical region was shaved. The left carotid artery was exposed through a cervical approach, with careful identification of the neurovascular bundle to minimize vascular injury and vagal stimulation. The artery was then catheterized with PE-50 polyethylene tubing for arterial blood sampling and continuous hemodynamic monitoring. MAP was recorded using a BIOPAC data acquisition system (BIOPAC Systems Inc., CA, USA). After catheterization, the animals underwent tracheostomy for insertion of a tracheal cannula and connection to the mechanical ventilator.
2.6. Biochemical Assessment of Renal Function
Renal function was assessed during the pre-MV and post-MV periods by measuring serum and urinary urea concentrations, serum and urinary creatinine concentrations, and proteinuria. Urea concentrations were determined using a commercial enzymatic-colorimetric kit (Labtest Diagnóstica S.A., MG, Brazil), according to the manufacturer’s instructions. The method was based on urease-mediated hydrolysis of urea, followed by indophenol blue formation, with absorbance measured at 620 nm. Serum and urinary creatinine concentrations were determined using the modified Jaffé method [32]. For creatinine measurement, serum and urine samples were homogenized, incubated for 10 min, centrifuged for 10 min, incubated again for 15 min at 25 °C, and analyzed using a Multiskan EX microplate reader (Labsystems, Finland). Proteinuria was measured using a commercial enzymatic-colorimetric kit (Labtest Diagnóstica S.A., MG, Brazil) and normalized to urinary creatinine.
2.7. Western Blotting
Protein expression was assessed by Western blotting in kidney tissues collected during the post-MV period. Proteins were extracted using 600 µL of radioimmunoprecipitation assay (RIPA) buffer supplemented with protease inhibitors, and protein concentration was determined using the Lowry method [33] with a bovine serum albumin standard curve. Samples were separated by polyacrylamide gel electrophoresis and transferred to nitrocellulose membranes using a Trans-Blot® Turbo™ transfer system (Bio-Rad Laboratories, CA, USA). After blocking, the membranes were incubated overnight with primary antibodies against interleukin-10 (IL-10; 1:1000; Abcam, MA, USA), interleukin-6 (IL-6; 1:1000; Novus Biologicals, CO, USA), tumor necrosis factor-alpha (TNF-α; 1:1000; Abcam, MA, USA), angiotensin II (Ang II; 1:1000; Abcam, MA, USA), and beta-actin (β-actin; 1:1000; Abcam, MA, USA).
After incubation with the corresponding secondary antibodies, chemiluminescent detection was performed using ECL Plus, and the bands were visualized with an Amersham™ Imager 600 system (GE Healthcare, IL, USA). Densitometric analysis was performed using ImageJ software (version 1.53k; National Institutes of Health, MD, USA), and the results were expressed as the ratio of the protein of interest to β-actin. Uncropped images of the Western blot membranes are provided in Figure S1.
2.8. Statistical Analysis
Statistical analyses were performed using Action Stat software, version 3.3.2, for Windows. A sensitivity analysis based on a two-sided paired-samples t-test, assuming a standardized effect size of δ = 0.50 and α = 0.05, yielded an estimated statistical power of 54.1%. Therefore, non-significant findings were interpreted with caution given the limited statistical power. The normality of the data was assessed using the Shapiro–Wilk test. For paired comparisons between the pre-MV and post-MV periods within the same group, the paired Student’s t-test was used when the data were normally distributed; otherwise, the Wilcoxon signed-rank test was applied.
For Western blot analyses performed at the post-MV time point, comparisons between the Obese and LPS groups were conducted using the unpaired Student’s t-test for normally distributed data or the Mann–Whitney U test when the normality assumption was not met. No post hoc tests were required because each individual analysis involved only two comparison levels. Given the small sample size and exploratory nature of the study, stringent multiplicity corrections could substantially reduce statistical power and increase the risk of type II error. Therefore, no adjustment for multiplicity across outcomes was applied. The reported p-values are unadjusted and should be interpreted as hypothesis-generating. Results were expressed as mean ± standard error of the mean (SEM). Values of p ≤ 0.05 were considered statistically significant.
3. Results
3.1. Ventilatory Response and Metabolic Acid–Base Profile
Table 1 presents the arterial blood gas and hemodynamic parameters in the Obese and LPS groups before and after mechanical ventilation. In the Obese group, pH increased significantly from 7.11 ± 0.0 to 7.26 ± 0.0 (p = 0.05), while PaCO₂ decreased significantly from 51.9 ± 6.3 to 31.3 ± 2.1 mmHg (p = 0.01). PaO₂ changed from 110.6 ± 36.2 to 132.2 ± 33.5 mmHg, HCO₃⁻ from 16.3 ± 1.6 to 14.1 ± 1.23 mEq/L, chloride from 116.8 ± 1.9 to 117.2 ± 2.1 mmol/L, BE-B from −10.8 ± 4.1 to −11.3 ± 3.1 mmol/L, lactate from 2.74 ± 1.0 to 3.22 ± 0.6 mmol/L, and MAP from 97.0 ± 9.9 to 102.2 ± 9.60 mmHg.
None of these latter changes reached statistical significance. In the LPS group, PaCO₂ decreased significantly from 46.6 ± 10.3 to 21.4 ± 3.5 mmHg (p = 0.04), HCO₃⁻ decreased significantly from 19.6 ± 0.77 to 12.03 ± 1.9 mEq/L (p = 0.01), lactate increased significantly from 1.55 ± 0.2 to 4.88 ± 1.2 mmol/L (p = 0.04), and MAP increased significantly from 119.1 ± 6.3 to 148.5 ± 11.4 mmHg (p = 0.05). pH changed from 7.18 ± 0.1 to 7.29 ± 0.0, PaO₂ from 80.2 ± 14.4 to 90.9 ± 14.6 mmHg, chloride from 116.00 ± 3.2 to 113.0 ± 1.3 mmol/L, and BE-B from −8.95 ± 7.1 to −5.63 ± 5.4 mmol/L; none of these changes reached statistical significance.
Figure 2 presents the anion gap (Figure 2A) and apparent strong ion difference (SID; Figure 2B) in the Obese and LPS groups at the pre-MV and post-MV time points. In the Obese group, the mean anion gap changed from 19.78 ± 6.94 at pre-MV to 22.05 ± 7.30 at post-MV, whereas the mean SID changed from 42.15 ± 6.15 to 39.25 ± 7.39. These findings occurred in the context of lower HCO₃⁻, a modest increase in lactate, stable sodium concentrations, and minimal variation in chloride. In the LPS group, the mean anion gap changed from 13.90 ± 5.67 at pre-MV to 24.08 ± 11.36 at post-MV, while the mean SID changed from 36.80 ± 5.18 to 41.13 ± 9.17. These findings occurred alongside a significant reduction in HCO₃⁻ and a significant increase in lactate. Sodium remained stable, whereas chloride decreased modestly at post-MV.
3.2. Oxygenation Profile
Figure 3 shows the estimated alveolar oxygen pressure (PAO₂) at the pre-MV and post-MV time points in the Obese and LPS groups. In the Obese group, estimated PAO₂ increased significantly from 291.6 ± 7.9 mmHg at pre-MV to 317.4 ± 2.5 mmHg at post-MV (p = 0.01). In the LPS group, estimated PAO₂ also increased significantly, from 298.2 ± 12.9 mmHg at pre-MV to 329.7 ± 4.4 mmHg at post-MV (p = 0.02). Thus, estimated PAO₂ increased significantly from pre-MV to post-MV within each phenotype.
Figure 4 shows the alveolar–arterial oxygen gradient at the pre-MV and post-MV time points in the Obese and LPS groups. In the Obese group, the mean A–a gradient changed from 212.88 ± 13.90 mmHg at pre-MV to 185.02 ± 34.30 mmHg at post-MV. In the LPS group, the mean A–a gradient changed from 218.02 ± 25.03 mmHg at pre-MV to 238.75 ± 12.54 mmHg at post-MV.
Figure 5 shows the PaO₂/FiO₂ ratio at the pre-MV and post-MV time points in the Obese and LPS groups. In the Obese group, the mean PaO₂/FiO₂ ratio changed from 221.29 ± 78.23 mmHg at pre-MV to 264.57 ± 72.43 mmHg at post-MV. In the LPS group, the mean ratio changed from 160.43 ± 28.90 mmHg at pre-MV to 181.80 ± 29.35 mmHg at post-MV.
3.3. Biochemical and Renal Functional Responses
Table 2 presents the biochemical parameters in the Obese and LPS groups at the pre-MV and post-MV time points. In the Obese group, sodium changed from 152.0 ± 2.7 to 153.5 ± 3.1 mEq/L, potassium from 4.20 ± 0.2 to 4.24 ± 0.2 mEq/L, ionized calcium from 0.55 ± 0.0 to 0.47 ± 0.0 mmol/L, and non-fasting glucose from 276.0 ± 30.7 to 325.4 ± 32.4 mg/dL. Hematocrit changed from 35.4 ± 1.8% to 34.4 ± 2.0%, whereas estimated hemoglobin changed from 11.8 ± 0.6 to 11.5 ± 0.7 g/dL. None of these changes reached statistical significance.
In the LPS group, sodium remained unchanged at 145.7 mEq/L, with SEM values of 3.1 and 5.5 mEq/L at the pre-MV and post-MV time points, respectively. Potassium changed from 4.01 ± 0.3 to 4.73 ± 0.4 mEq/L, ionized calcium from 0.85 ± 0.1 to 0.69 ± 0.1 mmol/L, and non-fasting glucose from 263.8 ± 36.1 to 320.8 ± 45.9 mg/dL. Hematocrit changed from 43.43 ± 4.3% to 38.43 ± 2.2%, whereas estimated hemoglobin changed from 14.5 ± 1.4 to 12.8 ± 0.7 g/dL. None of these changes reached statistical significance.
Table 3 presents renal function parameters in the Obese and LPS groups at the pre-MV and post-MV time points. In the Obese group, serum creatinine changed from 0.90 ± 0.1 to 0.92 ± 0.0 mg/dL, urinary creatinine changed from 26.2 ± 7.1 to 23.1 ± 0.7 mg/dL, serum urea increased significantly from 40.2 ± 4.9 to 53.8 ± 2.8 mg/dL (p = 0.03), and urinary urea changed from 1398 ± 318 to 1140 ± 293 mg/dL. The urinary protein-to-creatinine ratio also increased significantly, from 21.75 ± 12.4 to 31.50 ± 5.7 mg/mg (p = 0.02). In the LPS group, serum creatinine increased significantly from 0.52 ± 0.0 to 0.76 ± 0.0 mg/dL (p = 0.04), urinary creatinine changed from 15.7 ± 4.2 to 19.4 ± 3.4 mg/dL, serum urea increased from 35.7 ± 1.2 to 57.8 ± 8.1 mg/dL, and urinary urea changed from 1167 ± 348 to 1343 ± 391 mg/dL. The urinary protein-to-creatinine ratio changed from 4.74 ± 1.9 to 6.84 ± 2.7 mg/mg.
3.4. Renal Inflammatory and Angiotensin II Protein Expression After Mechanical Ventilation
Figure 6 shows renal protein expression at the post-MV time point in the Obese and LPS groups. IL-10 expression was 1.23 ± 0.35 in the Obese Post-MV group and 2.05 ± 0.12 in the LPS Post-MV group, with no statistically significant between-group difference (p = 0.25). IL-6 expression was significantly higher in the Obese Post-MV group than in the LPS Post-MV group, with values of 1.25 ± 0.05 and 0.79 ± 0.12, respectively (p < 0.05). In contrast, TNF-α expression was significantly higher in the LPS Post-MV group than in the Obese Post-MV group, with values of 2.31 ± 0.06 and 1.66 ± 0.23, respectively (p < 0.05). Ang II expression was 1.04 ± 0.05 in the Obese Post-MV group and 1.87 ± 0.35 in the LPS Post-MV group, with no statistically significant between-group difference (p = 0.08).
4. Discussion
The principal contribution of this exploratory study was to describe early renal changes observed during a short-term mechanical ventilation protocol, which displayed distinct profiles across two inflammatory-metabolic contexts. These renal findings occurred in association with different systemic patterns, reinforcing the importance of interpreting the renal response within the specific pathophysiological context of each phenotype. In this regard, acid–base, respiratory, metabolic, and hemodynamic alterations provided the physiological framework for this interpretation.
The reduction in the acidotic respiratory component was not accompanied by systemic normalization during the short-term reduced-tidal-volume mechanical ventilation protocol. In both models, the decrease in PaCO₂ indicated attenuation of the respiratory component of the acid–base disturbance; however, metabolic abnormalities persisted. This finding is relevant because, under critical conditions, interpretation of pH or PaCO₂ in isolation may suggest partial correction of acid–base balance while simultaneously obscuring the persistence of adverse metabolic and systemic alterations. The nature of these alterations, however, differed between the two experimental contexts.
In the Obese group, the significant increase in pH, accompanied by the reduction in PaCO₂, indicated attenuation of the acidotic respiratory component. However, the persistence of reduced bicarbonate, negative base excess, and persistently elevated lactate was consistent with maintenance of the metabolic component of the acid–base disturbance throughout the protocol. This pattern is biologically compatible with the context of diet-induced obesity, a condition associated with chronic low-grade inflammation, insulin resistance, adipocyte dysfunction, and alterations in energy metabolism [38]. The reduction in the acidotic respiratory component was not accompanied by normalization of the metabolic and systemic alterations evaluated.
In contrast, in the LPS group, PaCO₂ decreased markedly after the protocol, reaching values consistent with pronounced hypocapnia. Although this change contributed to the increase in pH, it did not represent normalization of acid–base balance, as it occurred simultaneously with a significant decrease in bicarbonate and a significant increase in lactate. This combination of changes was consistent with persistence of the metabolic component of the acid–base disturbance in association with hypocapnia. This pattern is compatible with the context of LPS-induced endotoxemia, a model of acute systemic inflammation [13], in which alterations in microvascular perfusion, mitochondrial dysfunction, increased lactate production, and impaired lactate clearance may contribute to hyperlactatemia [39,40].
In addition to the acid–base alterations, the oxygenation data indicate that the reduction in PaCO₂ was not accompanied by a proportional improvement in gas exchange in either experimental context. Estimated PAO₂ increased significantly in both groups, as expected from the alveolar gas equation in the setting of reduced PaCO₂ with FiO₂ maintained constant. However, this increase was not accompanied by a significant improvement in the PaO₂/FiO₂ ratio. Changes in the A–a gradient also did not reach statistical significance: the gradient decreased in the Obese group but increased in the LPS group. Since the A–a gradient increases when oxygen transfer from the alveoli to the arterial blood becomes less efficient, the increase observed in the LPS group is consistent with impaired gas exchange.
Taken together, these findings indicate that the reduction in PaCO₂ was not accompanied by a significant improvement in the gas-exchange indices evaluated. The persistence of an elevated A–a gradient despite the reduction in PaCO₂ is physiologically more consistent with ventilation–perfusion mismatch and/or intrapulmonary shunt than with isolated alveolar hypoventilation; diffusion impairment may also have contributed [41,42,43,44]. However, because the present study did not directly assess ventilation–perfusion relationships, shunt fraction, lung recruitability, or the regional distribution of aeration, these interpretations should be considered physiologically plausible but exploratory.
Within this context of systemic and respiratory alterations, the renal findings constituted the central focus of the analysis. In the Obese group, the significant increases in serum urea and proteinuria, in the presence of stable serum creatinine, were consistent with a predominantly nitrogenous and proteinuric pattern. This combination of changes is biologically compatible with obesity as a systemic condition associated with hemodynamic, metabolic, and inflammatory alterations capable of affecting renal function [7].
In the LPS group, by contrast, a distinct pattern predominated, characterized by a significant increase in serum creatinine. This finding was consistent with functional renal involvement in the context of acute endotoxemia, without allowing structural injury to be inferred from this marker alone. This pattern is biologically plausible given the hemodynamic, microcirculatory, endothelial, tubular, and intrarenal inflammatory alterations that may impair glomerular filtration and tubular homeostasis [45,46]. Given the relatively delayed kinetics of serum creatinine, its increase should be interpreted cautiously as an early functional marker rather than as a comprehensive measure of the change in glomerular filtration over the 1-h interval.
Complementing the functional and urinary findings, analysis of renal protein expression added a molecular dimension to the interpretation of the results. This assessment was performed exclusively at the post-MV time point and constituted the only direct statistical comparison between the Obese and LPS groups, restricted to renal markers. Renal IL-6 expression was significantly higher in the Obese group, whereas TNF-α expression was significantly higher in the LPS group. These findings were consistent with distinct renal molecular profiles between the groups, in line with the literature describing obesity as a state of chronic low-grade inflammation, frequently associated with increased levels of mediators such as IL-6 [47,48,49], and LPS as a potent endotoxin capable of inducing TNF-α-mediated pro-inflammatory responses [50,51]. IL-10 and Ang II expression levels were higher in the LPS group; however, the between-group differences did not reach statistical significance and should be interpreted with caution.
Taken together, the results showed distinct systemic and renal patterns within each experimental context. In the Obese group, the main findings were persistent metabolic alterations, increased serum urea and proteinuria, and higher renal IL-6 expression at the post-MV time point. In the LPS group, increased lactate, reduced bicarbonate, elevated mean arterial pressure, increased serum creatinine, and higher renal TNF-α expression were observed at the post-MV time point. These findings are biologically consistent with the respective inflammatory-metabolic contexts, without allowing exclusive causal attribution to mechanical ventilation. Figure 7 summarizes this integrated interpretation.
The patterns observed in each phenotype were also consistent with the concept of the two-hit model [18], in which an initial insult modifies the host’s physiological state, while a second stressor may amplify or unmask subsequent systemic alterations. In this context, mechanical ventilation may have acted as an additional stressor in previously modified organisms. However, the data from the present study do not allow the observed metabolic, hemodynamic, and renal alterations to be attributed specifically to mechanical ventilation.
Other experimental studies in rats have also demonstrated substantial heterogeneity in mechanical ventilation protocols, including variations in tidal volume, PEEP, respiratory rate, FiO₂, ventilation duration, and the nature of the preceding insult [21,22,23,24,25,26,27,53]. Although tidal volumes of approximately 5–10 mL/kg are often classified as low or protective, the physiological response depends on the combination of ventilatory parameters and the pre-existing biological context [18,53]. This observation is consistent with the findings of the present study, in which a reduced-tidal-volume strategy was associated with different systemic and renal patterns in each phenotype, without significant improvement in the gas-exchange indices evaluated.
This perspective underscores the difficulty of disentangling, at both the molecular and functional levels, biotrauma from the host inflammatory context, which remains one of the major challenges in contemporary critical care medicine [54,55]. In clinical practice, biological responses potentially related to the mechanical forces generated by the ventilator may overlap with pathways already activated by the underlying disease, comorbidities, and the systemic immune response, thereby complicating identification of the specific contribution of ventilatory support to the observed alterations. In the experimental setting, even the inclusion of a ventilated control group would not eliminate the influence of the pre-existing biological state, because healthy animals and animals previously exposed to an initial insult may respond differently to the same ventilatory stressor. From this perspective, the two-hit model remains relevant for interpreting the interaction between the host’s baseline condition and mechanical ventilation.
It is important to emphasize that all pre- to post-MV changes were observed during an integrated experimental protocol that included anesthesia, surgical instrumentation, and mechanical ventilation. Therefore, the study design does not allow the independent contribution of each component to be isolated, and the observed physiological, metabolic, hemodynamic, and renal alterations should not be attributed exclusively to mechanical ventilation. Accordingly, the findings do not support a definitive causal attribution. However, they generate the hypothesis that the response to ventilatory support may depend not only on tidal volume reduction but also on the host’s underlying pathophysiological and inflammatory-metabolic context.
5. Conclusion
The present study underscores the challenges involved in interpreting systemic responses to mechanical ventilation in clinical practice. In this exploratory study, attenuation of the respiratory component of acidosis was observed in both inflammatory contexts during an integrated protocol of anesthesia, surgical instrumentation, and short-term reduced-tidal-volume mechanical ventilation, without proportional normalization of the systemic alterations. In the Obese group, the main findings were persistence of the metabolic disturbance, increased serum urea and proteinuria, and higher renal IL-6 expression at the post-protocol time point. In the LPS group, increased lactate, reduced bicarbonate, elevated mean arterial pressure, increased serum creatinine, and higher renal TNF-α expression were observed at the post-protocol time point. These findings support the interpretation that the systemic and renal responses observed during the protocol should be considered in relation to the underlying pathophysiology and the host inflammatory-metabolic state. In addition, the data generate hypotheses for future studies directly comparing standardized ventilatory strategies with strategies adapted to the pre-existing phenotype.
Study Limitations
This study has several limitations. The exploratory design included a small sample size and limited statistical power to detect small-to-moderate effects, requiring caution in the interpretation of non-significant findings. In addition, mechanical ventilation was applied for only 1 h, allowing the assessment of early responses but not of later metabolic, renal, or inflammatory trajectories. Estimated alveolar oxygen pressure (PAO₂) and the alveolar–arterial oxygen gradient were calculated assuming a respiratory quotient of 0.8, without direct measurement by indirect calorimetry. Plateau pressure, intrinsic PEEP, expired tidal volume, driving pressure, and respiratory system compliance were not measured; consequently, the mechanical load imposed on the respiratory system and the equivalence of pulmonary stress between groups could not be fully characterized. Because anesthesia, surgical instrumentation, and mechanical ventilation were components of the same experimental protocol, the independent contribution of each component to the observed changes could not be isolated. Finally, evaluation of a combined Obese + LPS group could not be completed because of mortality observed during the experimental protocol, preventing its inclusion in the main analysis and limiting direct investigation of the interaction between the two insults.
Author Contributions
Conceptualization, M.B.C. and F.T.B.; methodology, F.T.B.; software, M.B.C.; validation, M.B.C. and F.T.B.; formal analysis, M.B.C.; investigation, L.J., B.C.J.S., C.V.R., M.A.G., C.D.F., E.O.S. and M.F.F.V.; resources, M.F.F.V. and F.T.B.; data curation, M.B.C. and F.T.B.; writing—original draft preparation, M.B.C.; writing—review and editing, M.B.C. and F.T.B.; visualization, M.B.C.; supervision, F.T.B.; project administration, F.T.B.; funding acquisition, F.T.B. All authors have read and agreed to the published version of the manuscript. All authors have read and agreed to the published version of the manuscript.
Funding
This research was funded by the Sao Paulo Research Foundation (FAPESP), grant number 2020/13405-2.
Institutional Review Board Statement
The animal study protocol was approved by the Institutional Animal Care and Use Committee of UNIFESP (protocol code CEUA 2994070823).
Data Availability Statement
The data supporting reported results are available on request from the corresponding author.
Conflicts of Interest
The authors declare no conflicts of interest.
Acknowledgments
The authors acknowledge the support of the São Paulo Research Foundation (FAPESP), the Brazilian National Council for Scientific and Technological Development (CNPq), Funding for Studies and Projects (FINEP), the Oswaldo Ramos Foundation (FOR), and the Coordination for the Improvement of Higher Education Personnel (CAPES). During the preparation of this manuscript, the authors used Grammarly and Ginger (version 3.7.158) exclusively for grammar checking and language refinement. The authors reviewed and edited the output and take full responsibility for the content of this publication.
References
- Merola, R.; Vargas, M.; Battaglini, D. Ventilator-Induced Lung Injury: The Unseen Challenge in Acute Respiratory Distress Syndrome Management. J. Clin. Med. 2025, 14(11), 3910. [Google Scholar] [CrossRef] [PubMed]
- Yang, H.; Benos, P. V.; Kitsios, G. D. Protecting the Lungs but Hurting the Kidneys: Causal Inference Study for the Risk of Ventilation-Induced Kidney Injury in ARDS. Ann. Transl. Med. 2020, 8(16), 985. [Google Scholar] [CrossRef] [PubMed]
- Benites, M. H.; Suarez-Sipmann, F.; Kattan, E.; Cruces, P.; Retamal, J. Ventilation-Induced Acute Kidney Injury in Acute Respiratory Failure: Do PEEP Levels Matter? Crit. Care 2025, 29(1), 130. [Google Scholar] [CrossRef] [PubMed]
- Muñoz, J.; Cedeño, J. A.; Castañeda, G. F.; Visedo, L. C. Personalized Ventilation Adjustment in ARDS: A Systematic Review and Meta-Analysis of Image, Driving Pressure, Transpulmonary Pressure, and Mechanical Power. Heart Lung 2024, 68, 305–315. [Google Scholar] [CrossRef] [PubMed]
- Merola, R.; Battaglini, D.; Schultz, M. J.; Rocco, P. R. M. Physiology-Guided Personalized Mechanical Ventilation to Prevent Ventilator-Induced Lung Injury. Front. Med. 2026, 13, 1764151. [Google Scholar] [CrossRef] [PubMed]
- Leite, T. T.; Gomes, C. A. M.; Valdivia, J. M. C.; Libório, A. B. Respiratory Parameters and Acute Kidney Injury in Acute Respiratory Distress Syndrome: A Causal Inference Study. Ann. Transl. Med. 2019, 7(23), 742. [Google Scholar] [CrossRef] [PubMed]
- Pessoa, E. A.; Convento, M. B.; Castino, B.; Leme, A. M.; de Oliveira, A. S.; Aragão, A.; Fernandes, S. M.; Carbonel, A.; Dezoti, C.; Vattimo, M. F.; et al. Beneficial Effects of Isoflavones in the Kidney of Obese Rats Are Mediated by PPAR-Gamma Expression. Nutrients 2020, 12(6), 1624. [Google Scholar] [CrossRef] [PubMed]
- Athayde, R. A. B.; Oliveira Filho, J. R. B.; Lorenzi Filho, G.; Genta, P. R. Obesity Hypoventilation Syndrome: A Current Review. J. Bras. Pneumol. 2018, 44(6), 510–518. [Google Scholar] [CrossRef] [PubMed]
- Tafelski, S.; Yi, H.; Ismaeel, F.; Krannich, A.; Spies, C.; Nachtigall, I. Obesity in Critically Ill Patients Is Associated with Increased Need of Mechanical Ventilation but Not with Mortality. J. Infect. Public Health 2016, 9(5), 577–585. [Google Scholar] [CrossRef] [PubMed]
- Wang, Y.; Li, D.; Zhu, L. Obesity Paradox in Critically Ill Patients: Do Patients with Critical Diseases Benefit from Obesity? Obes. Facts 2026, 19(2), 206–218. [Google Scholar] [CrossRef] [PubMed]
- Rabec, C.; Janssens, J. P.; Murphy, P. B. Ventilation in the Obese: Physiological Insights and Management. Eur. Respir. Rev. 2025, 34(176), 240190. [Google Scholar] [CrossRef] [PubMed]
- Lambert, D. C.; Kane, J.; Slaton, A.; Abramowitz, M. K. Associations of Metabolic Syndrome and Abdominal Obesity with Anion Gap Metabolic Acidosis among US Adults. Kidney360 2022, 3(11), 1842–1851. [Google Scholar] [CrossRef] [PubMed]
- Anhê, F. F.; Barra, N. G.; Cavallari, J. F.; Henriksbo, B. D.; Schertzer, J. D. Metabolic Endotoxemia Is Dictated by the Type of Lipopolysaccharide. Cell Rep. 2021, 36(11), 109691. [Google Scholar] [CrossRef] [PubMed]
- Kriswidyatomo, P.; Pradnyan Kloping, Y.; Guntur Jaya, M.; Adrian Nugraha, R.; Prawira Putri, C.; Hendrawan Putra, D.; Ananda Kloping, N.; Adityawardhana, T.; Yogiswara, N.; Margarita Rehatta, N. Prognostic Value of PCO2 Gap in Adult Septic Shock Patients: A Systematic Review and Meta-Analysis. Turk. J. Anaesthesiol. Reanim. 2022, 50(5), 324–331. [Google Scholar] [CrossRef] [PubMed]
- Shen, X.; He, L.; Cai, W. Role of Lipopolysaccharides in the Inflammation and Pyroptosis of Alveolar Epithelial Cells in Acute Lung Injury and Acute Respiratory Distress Syndrome. J. Inflamm. Res. 2024, 17, 5855–5869. [Google Scholar] [CrossRef] [PubMed]
- Kuipers, M. T.; van der Poll, T.; Schultz, M. J.; Wieland, C. W. Bench-to-Bedside Review: Damage-Associated Molecular Patterns in the Onset of Ventilator-Induced Lung Injury. Crit. Care 2011, 15(6), 235. [Google Scholar] [CrossRef] [PubMed]
- Curley, G. F.; Laffey, J. G.; Zhang, H.; Slutsky, A. S. Biotrauma and Ventilator-Induced Lung Injury: Clinical Implications. Chest 2016, 150(5), 1109–1117. [Google Scholar] [CrossRef] [PubMed]
- Bilodeaux, J.; Farooqi, H.; Osovskaya, M.; Sosa, A.; Wallbank, A.; Knudsen, L.; Sottile, P. D.; Albers, D. J.; Smith, B. J. Differential Effects of Two-Hit Models of Acute and Ventilator-Induced Lung Injury on Lung Structure, Function, and Inflammation. Front. Physiol. 2023, 14, 1217183. [Google Scholar] [CrossRef] [PubMed]
- Marques, R. G.; Morales, M. M.; Petroianu, A. Brazilian Law for Scientific Use of Animals. Acta Cir. Bras. 2009, 24(1), 69–74. [Google Scholar] [CrossRef] [PubMed]
- Patel, S.; Dhande, I.; Gray, E. A.; Ali, Q.; Hussain, T. Prevention of Lipopolysaccharide-Induced \(\text{CD11b}^{+}\) Immune Cell Infiltration in the Kidney: Role of \(\text{AT}_{2}\) Receptors. Biosci. Rep. 2019, 39(5), BSR20190429. [Google Scholar] [CrossRef] [PubMed]
- Ball, L.; Pelosi, P. How I Ventilate an Obese Patient. Crit. Care 2019, 23(1), 176. [Google Scholar] [CrossRef] [PubMed]
- De Jong, A.; Wrigge, H.; Hedenstierna, G.; Gattinoni, L.; Chiumello, D.; Frat, J. P.; Ball, L.; Schetz, M.; Pickkers, P.; Jaber, S.; et al. How to Ventilate Obese Patients in the ICU. Intensive Care Med. 2020, 46(12), 2423–2435. [Google Scholar] [CrossRef] [PubMed]
- De Jong, A.; Chanques, G.; Jaber, S. Mechanical Ventilation in Obese ICU Patients: From Intubation to Extubation. Crit. Care 2017, 21(1), 63. [Google Scholar] [CrossRef] [PubMed]
- Jones, R.; Gittens, J.; Manuel, A. Ventilation Modes for Obese Patients Under Mechanical Ventilation. In Mechanical Ventilation in the Critically Ill Obese Patient; Esquinas, A., Lemyze, M., Eds.; Springer: Cham, 2018; pp. 163–167. [Google Scholar] [CrossRef]
- Gorman, E. A.; O’Kane, C. M.; McAuley, D. F. Acute Respiratory Distress Syndrome in Adults: Diagnosis, Outcomes, Long-Term Sequelae, and Management. Lancet 2022, 400(10358), 1157–1170. [Google Scholar] [CrossRef] [PubMed]
- Wang, X.; Bai, C.; Chen, H. The Value of the Lipopolysaccharide-Induced Acute Lung Injury Model in Respiratory Medicine. Expert Rev. Respir. Med. 2010, 4(6), 773–783. [Google Scholar] [CrossRef] [PubMed]
- Fonseca, L. M. C.; Reboredo, M. M.; Lucinda, L. M. F.; Fazza, T. F.; Bergamini, B. C.; Botelho, M. P.; Lopes, G. M.; Ferreira, J. N. D.; Carvalho, E. V.; Pinheiro, B. V. Effects of Atelectatic Areas on the Surrounding Lung Tissue During Mechanical Ventilation in an Experimental Model of Acute Lung Injury Induced by Lipopolysaccharide. Crit. Care Sci. 2023, 35(4), 386–393. [Google Scholar] [CrossRef] [PubMed]
- Zhou, H.; Fu, Z.; Wei, Y.; Liu, J.; Cui, X.; Yang, W.; Ding, W.; Pan, P.; Li, W. Hydrogen Inhalation Decreases Lung Graft Injury in Brain-Dead Donor Rats. J. Heart Lung Transplant. 2013, 32(2), 251–258. [Google Scholar] [CrossRef] [PubMed]
- Peralta-Ramírez, A.; Raya, A. I.; Pineda, C.; Rodríguez, M.; Aguilera-Tejero, E.; López, I. Acid-Base Balance in Uremic Rats with Vascular Calcification. Nephron Extra 2014, 4(2), 89–94. [Google Scholar] [CrossRef] [PubMed]
- Marano, M.; Jain, D.; Aggarwal, H. K.; Izzo, F. Evaluation of Expected Ventilatory Response to Metabolic Acidosis in Severely Ill Patients. J. Assoc. Physicians India 2021, 69(11), 11–12. [Google Scholar] [PubMed]
- Albert, M. S.; Dell, R. B.; Winters, R. W. Quantitative Displacement of Acid-Base Equilibrium in Metabolic Acidosis. Ann. Intern. Med. 1967, 66(2), 312–322. [Google Scholar] [CrossRef] [PubMed]
- Taussky, H. H. A Procedure Increasing the Specificity of the Jaffe Reaction for the Determination of Creatine and Creatinine in Urine and Plasma. Clin. Chim. Acta 1956, 1(3), 210–224. [Google Scholar] [CrossRef] [PubMed]
- Lowry, O. H.; Rosebrough, N. J.; Farr, A. L.; Randall, R. J. Protein Measurement with the Folin Phenol Reagent. J. Biol. Chem. 1951, 193(1), 265–275. [Google Scholar] [CrossRef]
- Subramanian, R. K.; Sidharthan, A.; Maneksh, D.; Ramalingam, L.; Manickam, S. A.; Kanthakumar, P.; Subramani, S. Normative Data for Arterial Blood Gas and Electrolytes in Anesthetized Rats. Indian J. Pharmacol. 2013, 45(1), 103–104. [Google Scholar] [CrossRef] [PubMed]
- Giknis, M. L. A.; Clifford, C. B. Clinical Laboratory Parameters for Crl:WI(Han); Charles River Laboratories: Wilmington, MA, 2008. [Google Scholar]
- Harkness, J. E.; Wagner, J. E. Biologia e Clínica de Coelhos e Roedores, 3ª ed.; Editora Roca: São Paulo, 1993. [Google Scholar]
- Castro, B. B. A.; Colugnati, F. A. B.; Cenedeze, M. A.; Suassuna, P. G. A.; Pinheiro, H. S. Padronização da Avaliação da Função Renal de Ratos (Rattus norvegicus) Wistar do Biotério da Universidade Federal de Juiz de Fora. Braz. J. Nephrol. 2014, 36(2), 139–149. [Google Scholar] [CrossRef] [PubMed]
- Mokhlesi, B.; Masa, J. F.; Brozek, J. L.; Gurubhagavatula, I.; Murphy, P. B.; Piper, A. J.; Tulaimat, A.; Afshar, M.; Balachandran, J. S.; Dweik, R. A.; et al. Evaluation and Management of Obesity Hypoventilation Syndrome. An Official American Thoracic Society Clinical Practice Guideline. Am. J. Respir. Crit. Care Med. 2019, 200(3), e6–e24. [Google Scholar] [CrossRef] [PubMed]
- Sun, Z.; Song, Y.; Li, J.; Li, Y.; Yu, Y.; Wang, X. Potential Biomarker for Diagnosis and Therapy of Sepsis: Lactylation. Immun. Inflamm. Dis. 2023, 11(10), e1042. [Google Scholar] [CrossRef] [PubMed]
- Imig, J. D.; Ryan, M. J. Immune and Inflammatory Role in Renal Disease. Compr. Physiol. 2013, 3(2), 957–976. [Google Scholar] [CrossRef] [PubMed]
- Hantzidiamantis, P. J.; Amaro, E. Physiology, Alveolar to Arterial Oxygen Gradient. In StatPearls; StatPearls Publishing: Treasure Island, FL, 2026. [Google Scholar]
- Nagato, A. C.; Machado-Junior, P. A.; Valenca, S. S.; Russo, R. C.; Bezerra, F. S. Experimental Models of Acute Lung Injury to Study Inflammation and Pathophysiology: A Narrative Review. Antioxidants 2026, 15(1), 63. [Google Scholar] [CrossRef] [PubMed]
- Rabec, C.; Janssens, J. P.; Murphy, P. B. Ventilation in the Obese: Physiological Insights and Management. Eur. Respir. Rev. 2025, 34(176), 240190. [Google Scholar] [CrossRef] [PubMed]
- Piagnerelli, M.; Boudjeltia, K. Z.; Vanhaeverbeek, M.; Vincent, J. L. Red Blood Cell Rheology in Sepsis. Intensive Care Med. 2003, 29(7), 1052–1061. [Google Scholar] [CrossRef] [PubMed]
- Nguyen, A. T.; Mandard, S.; Dray, C.; Deckert, V.; Valet, P.; Besnard, P.; Drucker, D. J.; Lagrost, L.; Grober, J. Lipopolysaccharides-Mediated Increase in Glucose-Stimulated Insulin Secretion: Involvement of the GLP-1 Pathway. Diabetes 2014, 63(2), 471–482. [Google Scholar] [CrossRef] [PubMed]
- Vaschetto, R.; Kuiper, J. W.; Musters, R. J.; Eringa, E. C.; Della Corte, F.; Murthy, K.; Groeneveld, A. B.; Plötz, F. B. Renal Hypoperfusion and Impaired Endothelium-Dependent Vasodilation in an Animal Model of VILI: The Role of the Peroxynitrite-PARP Pathway. Crit. Care 2010, 14(2), R45. [Google Scholar] [CrossRef] [PubMed]
- Saad, K. M.; Gad, M. S.; Tang, J.; Capehart, K.; Abdelsayed, R.; Williams, J. M.; Elmarakby, A. A. Obesity Promotes Renal Inflammation and Fibrosis Independent of Sex in SS Leptin Receptor Mutant (SSLepR) Rats. Biomedicines 2025, 13(12), 3105. [Google Scholar] [CrossRef] [PubMed]
- Stemmer, K.; Perez-Tilve, D.; Ananthakrishnan, G.; Bort, A.; Seeley, R. J.; Tschöp, M. H.; Dietrich, D. R.; Pfluger, P. T. High-Fat-Diet-Induced Obesity Causes an Inflammatory and Tumor-Promoting Microenvironment in the Rat Kidney. Dis. Model. Mech. 2012, 5(5), 627–635. [Google Scholar] [CrossRef] [PubMed]
- Zhang, L.; Xu, F.; Hou, L. IL-6 and Diabetic Kidney Disease. Front. Immunol. 2024, 15, 1465625. [Google Scholar] [CrossRef] [PubMed]
- Shin, S. H.; Kim, E. K.; Lee, K. Y.; Kim, H. S. TNF-α Antagonist Attenuates Systemic Lipopolysaccharide-Induced Brain White Matter Injury in Neonatal Rats. BMC Neurosci. 2019, 20(1), 45. [Google Scholar] [CrossRef] [PubMed]
- Noiri, E.; Kuwata, S.; Nosaka, K.; Tokunaga, K.; Juji, T.; Shibata, Y.; Kurokawa, K. Tumor Necrosis Factor-Alpha mRNA Expression in Lipopolysaccharide-Stimulated Rat Kidney. Chronological Analysis of Localization. Am. J. Pathol. 1994, 144(6), 1159–1166. [Google Scholar] [PubMed]
- Eliyatkın, N. Ö.; İşlek, A.; Durmaz, S.; Ayyıldız, F.; Rahman, Ö. Can Adalimumab Prevent from Acute Effects of Lipopolysaccharide Induced Renal Injury in Rats? Acta Cir. Bras. 2024, 39, e394624. [Google Scholar] [CrossRef] [PubMed]
- Joelsson, J. P.; Karason, S. Ventilator-Induced Lung Injury in Rat Models: Are They All Equal in the Race? Lab. Anim. Res. 2025, 41(1), 14. [Google Scholar] [CrossRef] [PubMed]
- Costa, A.; Sakho, B.; Gomez, S.; Khanyan, B.; Leybengrub, P.; Bergese, S. Ventilator-Associated Lung Injury: Pathophysiology, Prevention, and Emerging Therapeutic Strategies. Int. J. Mol. Sci. 2025, 26(21), 10448. [Google Scholar] [CrossRef] [PubMed]
- Li, L.; Yang, D.; Yang, M.; Zhang, H.; Li, L.; Lu, X.; Wang, L.; Luo, H. Ventilator-Induced Lung Injury: From Mechanisms to Integrated Clinical Management. Front. Med. 2026, 13, 1789457. [Google Scholar] [CrossRef] [PubMed]
Figure 1.
Experimental design, ventilatory settings, and phenotype characterization. Values are presented as mean ± SEM. Final body weight was 557.13 ± 10.14 g in the Obese group and 462.75 ± 4.33 g in the LPS group. Total cholesterol was 81.17 ± 8.51 mg/dL in the Obese group and 65.00 ± 1.54 mg/dL in the LPS group. Triglyceride levels were 129.83 ± 23.61 mg/dL and 39.67 ± 11.68 mg/dL, respectively.
Figure 1.
Experimental design, ventilatory settings, and phenotype characterization. Values are presented as mean ± SEM. Final body weight was 557.13 ± 10.14 g in the Obese group and 462.75 ± 4.33 g in the LPS group. Total cholesterol was 81.17 ± 8.51 mg/dL in the Obese group and 65.00 ± 1.54 mg/dL in the LPS group. Triglyceride levels were 129.83 ± 23.61 mg/dL and 39.67 ± 11.68 mg/dL, respectively.
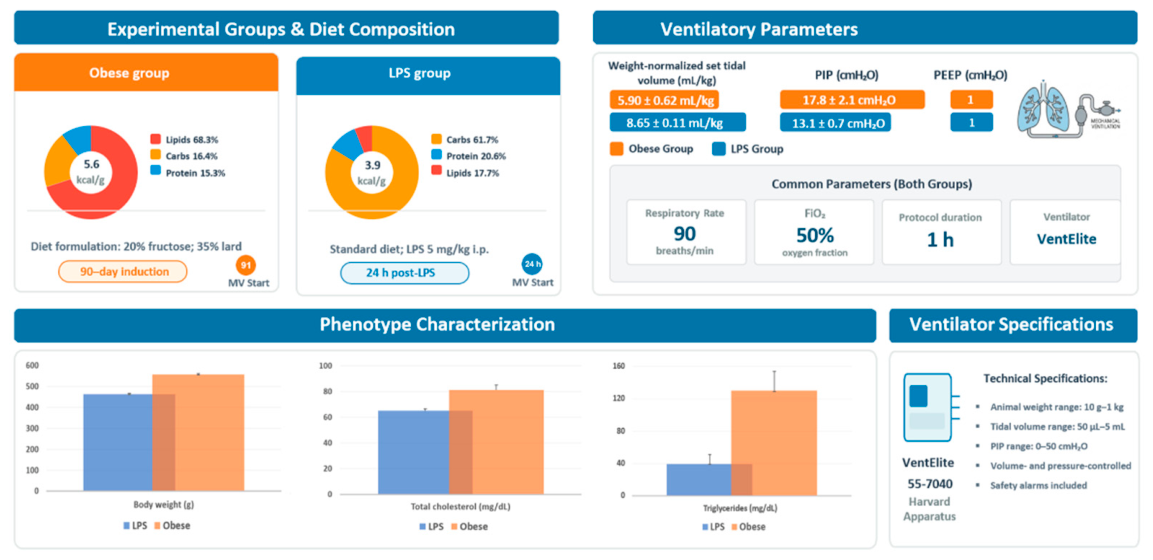
Figure 2.
Acid–base indices at the pre-MV and post-MV time points during reduced-tidal-volume mechanical ventilation. A. Anion gap. B. Apparent strong ion difference in Obese and LPS rats. Values are presented as mean ± SEM within each phenotype.
Figure 2.
Acid–base indices at the pre-MV and post-MV time points during reduced-tidal-volume mechanical ventilation. A. Anion gap. B. Apparent strong ion difference in Obese and LPS rats. Values are presented as mean ± SEM within each phenotype.
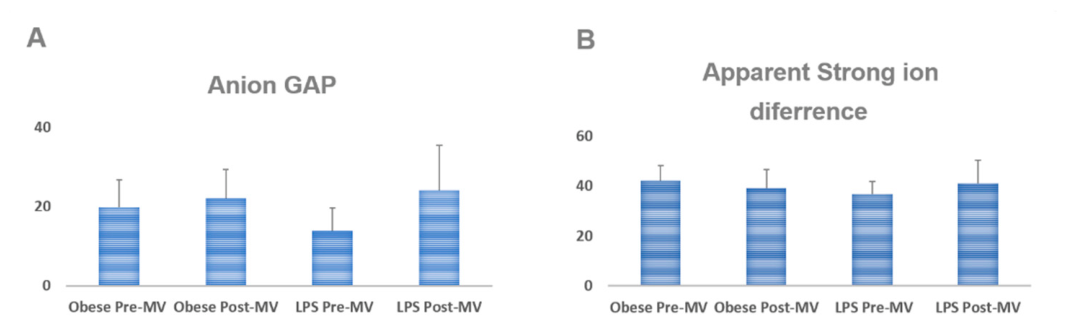
Figure 3.
Estimated alveolar oxygen pressure (PAO₂) at the pre-MV and post-MV time points during reduced-tidal-volume mechanical ventilation in Obese and LPS rats. Values are presented as mean ± SEM within each phenotype. (*) p ≤ 0.05 was considered statistically significant for post-MV versus pre-MV comparisons within each phenotype.
Figure 3.
Estimated alveolar oxygen pressure (PAO₂) at the pre-MV and post-MV time points during reduced-tidal-volume mechanical ventilation in Obese and LPS rats. Values are presented as mean ± SEM within each phenotype. (*) p ≤ 0.05 was considered statistically significant for post-MV versus pre-MV comparisons within each phenotype.
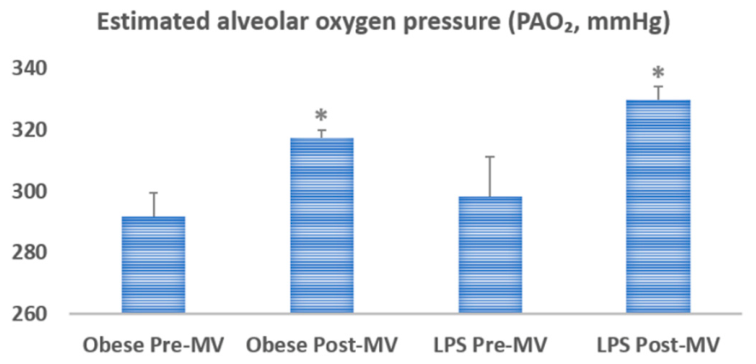
Figure 4.
Alveolar–arterial oxygen gradient at the pre-MV and post-MV time points during reduced-tidal-volume mechanical ventilation in Obese and LPS rats. Values are presented as mean ± SEM within each phenotype.
Figure 4.
Alveolar–arterial oxygen gradient at the pre-MV and post-MV time points during reduced-tidal-volume mechanical ventilation in Obese and LPS rats. Values are presented as mean ± SEM within each phenotype.
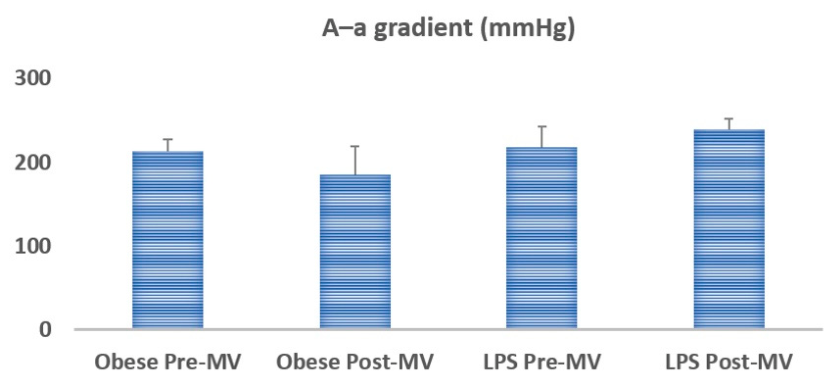
Figure 5.
PaO₂/FiO₂ ratio at the pre-MV and post-MV time points during reduced-tidal-volume mechanical ventilation in Obese and LPS rats. Values are presented as mean ± SEM within each phenotype.
Figure 5.
PaO₂/FiO₂ ratio at the pre-MV and post-MV time points during reduced-tidal-volume mechanical ventilation in Obese and LPS rats. Values are presented as mean ± SEM within each phenotype.
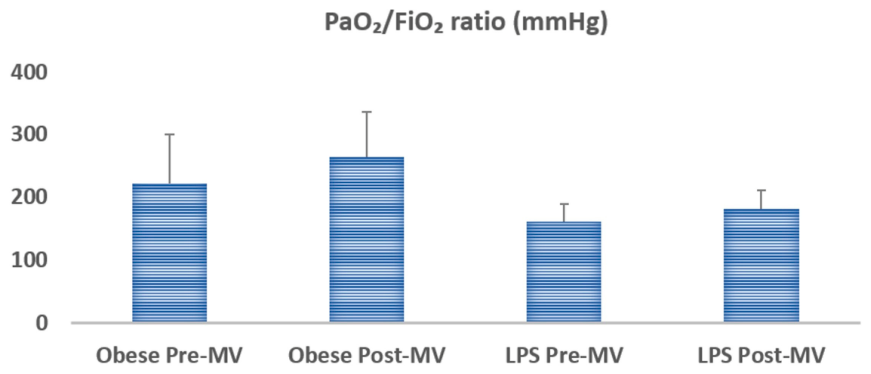
Figure 6.
Protein expression in renal tissue at the post-MV time point in the Obese and LPS groups. Protein expression of interleukin-10 (IL-10), interleukin-6 (IL-6), tumor necrosis factor-alpha (TNF-α), and angiotensin II (Ang II) was assessed by Western blotting in renal tissue collected at post-MV. Values are presented as mean ± SEM and expressed relative to β-actin. (*) p ≤ 0.05 for comparisons between the Obese Post-MV and LPS Post-MV groups.
Figure 6.
Protein expression in renal tissue at the post-MV time point in the Obese and LPS groups. Protein expression of interleukin-10 (IL-10), interleukin-6 (IL-6), tumor necrosis factor-alpha (TNF-α), and angiotensin II (Ang II) was assessed by Western blotting in renal tissue collected at post-MV. Values are presented as mean ± SEM and expressed relative to β-actin. (*) p ≤ 0.05 for comparisons between the Obese Post-MV and LPS Post-MV groups.
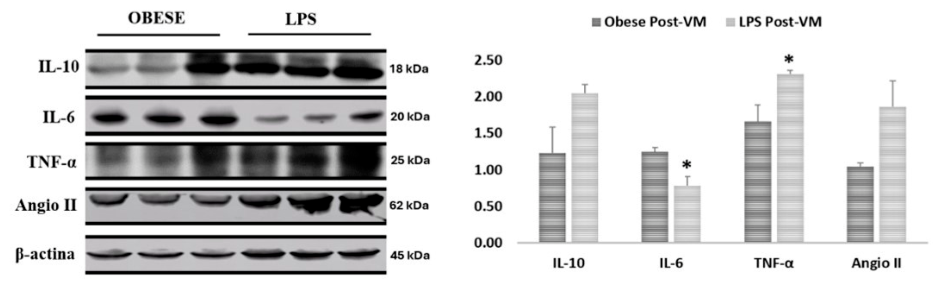
Figure 7.
Summary of phenotype-associated systemic and renal patterns observed during short-term reduced-tidal-volume mechanical ventilation. A. Diet-induced obesity and LPS-induced endotoxemia as distinct inflammatory-metabolic contexts. B. Findings shared by both phenotypes, including decreased PaCO₂, persistent metabolic acid–base abnormalities, lack of proportional improvement in oxygenation, and renal and systemic biochemical changes. C. Post-MV findings in the Obese phenotype, characterized by increased serum urea, increased urinary protein-to-creatinine ratio, higher renal IL-6 expression than in the LPS group, and no significant improvement in gas-exchange indices. D. Post-MV findings in the LPS phenotype, characterized by reduced HCO₃⁻, increased lactate and mean arterial pressure, higher renal TNF-α expression than in the Obese group, and no significant improvement in gas-exchange indices. Mechanistic interpretations are exploratory.
Figure 7.
Summary of phenotype-associated systemic and renal patterns observed during short-term reduced-tidal-volume mechanical ventilation. A. Diet-induced obesity and LPS-induced endotoxemia as distinct inflammatory-metabolic contexts. B. Findings shared by both phenotypes, including decreased PaCO₂, persistent metabolic acid–base abnormalities, lack of proportional improvement in oxygenation, and renal and systemic biochemical changes. C. Post-MV findings in the Obese phenotype, characterized by increased serum urea, increased urinary protein-to-creatinine ratio, higher renal IL-6 expression than in the LPS group, and no significant improvement in gas-exchange indices. D. Post-MV findings in the LPS phenotype, characterized by reduced HCO₃⁻, increased lactate and mean arterial pressure, higher renal TNF-α expression than in the Obese group, and no significant improvement in gas-exchange indices. Mechanistic interpretations are exploratory.
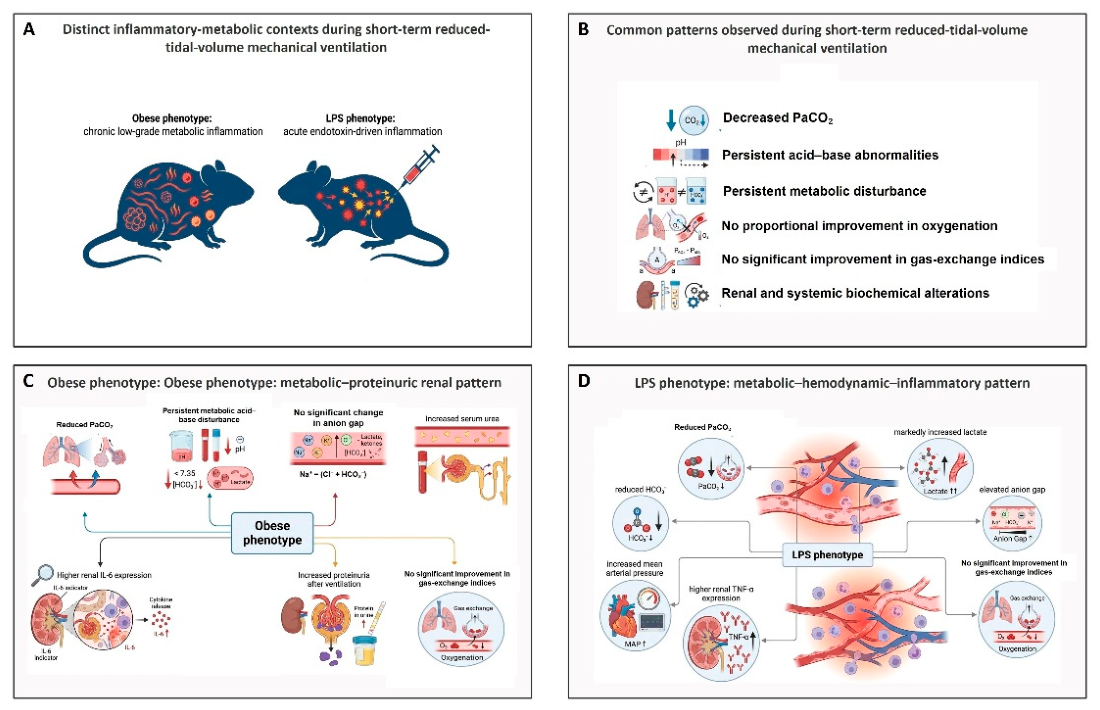

Table 1.
Arterial blood gas parameters and mean arterial pressure in the Obese and LPS groups before and after mechanical ventilation. PaCO₂, arterial partial pressure of carbon dioxide; PaO₂, arterial partial pressure of oxygen; HCO₃⁻, bicarbonate; BE-B, blood base excess; MAP, mean arterial pressure. Values are presented as mean ± SEM. (*) p ≤ 0.05 versus the respective pre-MV period within the same group.
Table 1.
Arterial blood gas parameters and mean arterial pressure in the Obese and LPS groups before and after mechanical ventilation. PaCO₂, arterial partial pressure of carbon dioxide; PaO₂, arterial partial pressure of oxygen; HCO₃⁻, bicarbonate; BE-B, blood base excess; MAP, mean arterial pressure. Values are presented as mean ± SEM. (*) p ≤ 0.05 versus the respective pre-MV period within the same group.
| Arterial blood gas | Obese Group | LPS Group | ||
|---|---|---|---|---|
| Physiological reference | Pre-MV | Post-MV | Pre-MV | Post-MV |
| pH (7.29–7.38) | 7.11 ± 0.0 | 7.26 ± 0.0 * | 7.18 ± 0.1 | 7.29 ± 0.0 |
| PaCO₂ (40–53 mmHg) | 51.9 ± 6.3 | 31.3 ± 2.1 * | 46.6 ± 10.3 | 21.4 ± 3.5 * |
| PaO₂ (87–106 mmHg) | 110.6 ± 36.2 | 132.2 ± 33.5 | 80.2 ± 14.4 | 90.9 ± 14.6 |
| HCO₃⁻ (22–26 mEq/L) | 16.3 ± 1.6 | 14.1 ± 1.23 | 19.6 ± 0.77 | 12.03 ± 1.9 * |
| Chloride (98–110 mmol/L) | 116.8 ± 1.9 | 117.2 ± 2.1 | 116.00 ± 3.2 | 113.0 ± 1.3 |
| BE-B (−4 to +2 mmol/L) | -10.8 ± 4.1 | -11.3 ± 3.1 | -8.95 ± 7.1 | -5.63 ± 5.4 |
| Lactate (0.5–1.5 mmol/L) | 2.74 ± 1.0 | 3.22 ± 0.6 | 1.55 ± 0.2 | 4.88 ± 1.2 * |
| MAP (80–120 mmHg) | 97.0 ± 9.9 | 102.2 ± 9.60 | 119.1 ± 6.3 | 148.5 ± 11.4 * |
Note: Values in parentheses indicate published physiological ranges for Wistar rats [34], provided only as biological context. These values were not obtained from contemporaneous healthy control animals, were not included in the statistical analysis, and should not be interpreted as a formal control group.
Table 2.
Biochemical parameters in the Obese and LPS groups at the pre-MV and post-MV time points. Na⁺, sodium; K⁺, potassium; Ca²⁺, ionized calcium; non-fasting glucose, blood glucose measured without fasting; Ht, hematocrit; Hb, hemoglobin. Values are presented as mean ± SEM.
Table 2.
Biochemical parameters in the Obese and LPS groups at the pre-MV and post-MV time points. Na⁺, sodium; K⁺, potassium; Ca²⁺, ionized calcium; non-fasting glucose, blood glucose measured without fasting; Ht, hematocrit; Hb, hemoglobin. Values are presented as mean ± SEM.
| Biochemical parameters | Obese Group | LPS Group | ||
|---|---|---|---|---|
| Physiological reference | Pre-MV | Post-MV | Pre-MV | Post-MV |
| Na⁺, sodium (142–151 mEq/L) | 152.0 ± 2.7 | 153.5 ± 3.1 | 145.7 ± 3.1 | 145.7 ± 5.5 |
| K⁺, potassium (3.8–5.5 mEq/L) | 4.20 ± 0.2 | 4.24 ± 0.2 | 4.01 ± 0.3 | 4.73 ± 0.4 |
| Ca²⁺ (1.11–1.14 mmol/L) | 0.55 ± 0.0 | 0.47 ± 0.0 | 0.85 ± 0.1 | 0.69 ± 0.1 |
| Non-fasting glucose (70–208 mg/dL) | 276.0 ± 30.7 | 325.4 ± 32.4 | 263.8 ± 36.1 | 320.8 ± 45.9 |
| Hematocrit (39–52%) | 35.4 ± 1.8 | 34.4 ± 2.0 | 43.43 ± 4.3 | 38.43 ± 2.2 |
| Hemoglobin (13–17 g/dL) | 11.8 ± 0.6 | 11.5 ± 0.7 | 14.5 ± 1.4 | 12.8 ± 0.7 |
Note: Values in parentheses indicate published physiological ranges for Wistar rats [35], provided only as biological context. These values were not obtained from contemporaneous healthy control animals, were not included in the statistical analysis, and should not be interpreted as a formal control group.
Table 3.
Renal function parameters in the Obese and LPS groups at the pre-MV and post-MV time points. Values are presented as mean ± SEM. (*) p ≤ 0.05 versus the respective pre-MV period within the same group.
Table 3.
Renal function parameters in the Obese and LPS groups at the pre-MV and post-MV time points. Values are presented as mean ± SEM. (*) p ≤ 0.05 versus the respective pre-MV period within the same group.
| Renal function | Obese Group | LPS Group | ||
|---|---|---|---|---|
| Physiological reference | Pre-MV | Post-MV | Pre-MV | Post-MV |
| Serum creatinine (0.30–0.60 mg/dL) | 0.90 ± 0.1 | 0.92 ± 0.0 | 0.52 ± 0.0 | 0.76 ± 0.0 * |
| Urinary creatinine (8–25 mg/dL) | 26.2 ± 7.1 | 23.1 ± 0.7 | 15.7 ± 4.2 | 19.4 ± 3.4 |
| Serum urea (20–50 mg/dL) | 40.2 ± 4.9 | 53.8 ± 2.8 * | 35.7 ± 1.2 | 57.8 ± 8.1 |
| Urinary urea (300–600 mg/dL) | 1398 ± 318 | 1140 ± 293 | 1167 ± 348 | 1343 ± 391 |
| Urinary protein-to-creatinine ratio, mg/mg (<7 mg/mg) |
21.75 ± 12.4 | 31.50 ± 5.7 * | 4.74 ± 1.9 | 6.84 ± 2.7 |
Note: Values in parentheses indicate published physiological ranges for Wistar rats [36,37], provided only as biological context. These values were not obtained from contemporaneous healthy control animals, were not included in the statistical analysis, and should not be interpreted as a formal control group.
Disclaimer/Publisher’s Note: The statements, opinions and data contained in all publications are solely those of the individual author(s) and contributor(s) and not of MDPI and/or the editor(s). MDPI and/or the editor(s) disclaim responsibility for any injury to people or property resulting from any ideas, methods, instructions or products referred to in the content. |
© 2026 by the authors. Licensee MDPI, Basel, Switzerland. This article is an open access article distributed under the terms and conditions of the Creative Commons Attribution (CC BY) license (http://creativecommons.org/licenses/by/4.0/).
Copyright: This open access article is published under a Creative Commons CC BY 4.0 license, which permit the free download, distribution, and reuse, provided that the author and preprint are cited in any reuse.