

Submitted:
11 August 2026
Posted:
11 August 2026
You are already at the latest version
Abstract
Terrestrial LiDAR provides detailed three-dimensional (3-D) observations of forest structure, yet wood-foliar semantics remains challenging because of structural heterogeneity, occlusion, and variability among forest ecosystems and terrestrial LiDAR platforms. Existing deep learning (DL) approaches are commonly developed for localized forest conditions or complex multi-class semantic taxonomies that often exhibit limited transferability across structurally diverse forests. We present a terrestrial LiDAR platform-agnostic DL framework for wood–foliar semantics using globally harmonized benchmark datasets acquired from multiple terrestrial LiDAR systems representing broadleaf, coniferous, mixed, regenerating, and structurally complex forests. Three point-based architectures (PointNet++, PointNeXt, and PT) were benchmarked using identical training and evaluation protocols. PT consistently achieved the highest performance, with overall accuracy (OA) of 92–94%, balanced accuracy (BA) of 88–94%, mean Intersection-over-Union (mIoU) of 0.78–0.87, macro F1-score of 0.87–0.93, and Matthew’s correlation coefficient (MCC) of 0.74–0.86 across four independent benchmark datasets. Species-level, vertical-profile, and qualitative cross-ecosystem evaluations further demonstrated stable preservation of wood-foliar semantics throughout the 3-D fuel continuum, while revealing that many apparent disagreements originated from incomplete manual annotation of fine branches in complex forest ecosystems. The resulting wood–foliar predictions were subsequently decomposed into ecologically relevant fuel classes using a geometric framework, achieving F1-scores of 0.98 for stems and 0.92 for foliage, thereby demonstrating that binary semantic abstraction preserves sufficient structural information for hierarchical fuel characterization.
Keywords:
deep learning
; terrestrial laser scanning
; forest
; wildland fuel mapping
; semantic segmentation
; global ecosystems
1. Introduction
Since the release of the first commercial Terrestrial Laser Scanner (TLS) in 1998 [1], terrestrial Light Detection and Ranging (LiDAR) systems have substantially improved the ability to capture detailed understory and near-surface forest structure through high-density point clouds [2]. Modern terrestrial LiDAR systems encompass a broad range of sensor platforms, including TLS, handheld and backpack mobile laser scanning (MLS), personal laser scanning (PLS), and Simultaneous Localization and Mapping (SLAM)-based LiDAR systems, enabling flexible and efficient data acquisition across structurally complex forest environments [1,3,4,5,6].
Terrestrial LiDAR can resolve detailed 3-D structural information associated with stems, branches, foliage, understory, shrubs, coarse woody debris (CWD), and fine woody debris (FWD). This information supports a wide range of ecological and operational applications, including forest inventory, aboveground biomass (AGB) estimation, habitat assessment, branch characterization [1], canopy cover estimation, gap fraction analysis, Leaf Area Index (LAI), Leaf Area Density (LAD), Canopy Base Height (CBH), and Canopy Bulk Density (CBD). These are essential metrics for currently available wildfire behavior models used for operational decision support [7,8,9,10]. TLS-based point clouds are highly heterogeneous in forested sites and can require automated segmentation frameworks to classify points into ecologically meaningful structural components [11,12,13]. In terrestrial LiDAR applications, semantic segmentation assigns a class label to each point according to its structural category (e.g., stem, branch, and foliage), whereas instance segmentation further distinguishes individual object instances within the same semantic classes, such as individual trees [14,15,16]. Of these two tasks, accurate semantic segmentation is particularly important for characterizing complete forest strata and near-surface fuel complexes [17,18].
To achieve semantic segmentation of terrestrial LiDAR point clouds, parametric algorithms, e.g., Density-Based Spatial Clustering of Applications with Noise (DBSCAN), machine learning (ML), and deep learning (DL) have extensively been investigated in past studies [11,19,20,21]. Parametric algorithms and ML frameworks are generally easier to implement and computationally efficient, yet their performance often remains sensitive to forest structural variability, sensor characteristics, and manually tuned parametric thresholds, limiting their transferability [3,11,22,23]. Recent studies comprehensively evaluated a large number of widely used wood-leaf separation algorithms and ML/DL frameworks to assess their performance on wood-leaf segmentation [24,25]. The results demonstrated substantial variability in individual tree-AGB (IAGB) among methods, primarily due to difficulties in accurately separating branches from leaf clouds. Inaccurate branch delineation resulted in notable underestimation of IAGB, reaching up to 14% in broadleaf and 17% in coniferous species [24,25]. The study further reported that 3DSegFormer [15], a DL framework, achieved better IAGB compared with other approaches, highlighting the potential of DL frameworks to better capture complex branch architecture, whereas trunk biomass predictions remained comparatively consistent across algorithms [23,24,26].
In particular, supervised point-wise DL frameworks directly operate on 3-D irregular point clouds and can learn complex geometric representations from the data, thereby improving segmentation quality under structurally heterogeneous forest conditions [15,27,28,29]. Recent advances in point-wise supervised DL architectures, including PointNet, PointNet++ [25], PointNeXt, Point-based Convolutional Neural Network (e.g., PointCNN), KPConv, RandLA-Net [30], PT [28], LWSNet, and Forestformer3D, among others, have substantially advanced semantic segmentation of terrestrial LiDAR point clouds by enabling hierarchical feature extraction and local neighborhood learning [3,17,31]. These frameworks have consistently demonstrated improved segmentation compared with conventional parametric approaches, particularly in complex forest environments where occlusion and fine-scale structural variability remain challenging [15,24,25].
1.1. Related Work
LiDAR semantic segmentation generally falls into two categories: tree-centric and plot-level methods. Tree-centric approaches operate on individual trees isolated from surrounding vegetation and are primarily designed for applications such as branch characterization, tree morphology analysis, IAGB estimation, and species classification [1,19,24,26,32,33]. Though these methods provide detailed information on individual tree structure, they are not intended to represent the full semantic complexity of forest plots containing canopy, understory, and surface fuels [24,34]. Plot-level semantic segmentation remains comparatively less investigated and is typically formulated as a multi-class semantic problem involving classes such as stem, branch, leaf, understory, ground, and CWD [6,19,35,36,37]. Although many frameworks report high semantic accuracies, model development and evaluation are often conducted within localized forest environments, where training and testing data originate from similar ecological and structural conditions [38,39]. Consequently, performance may decline when applied to forests with different species compositions, structural characteristics, fuel complexes, disturbance histories, or sensor acquisition geometries, frequently requiring additional labeled data and model retraining to maintain performance [6,9,27,29,37,40].
Furthermore, many existing segmentation frameworks rely on supplementary attributes such as intensity, optical imagery red-green-blue (RGB) based colorization, multispectral imagery, multispectral LiDAR, geometric descriptors, or combinations thereof to improve classification performance [19,21,41]. Radiometric or spectral features can enhance wood–leaf discrimination [14,41]; however, their consistency is often affected by sensor characteristics, acquisition geometry, radiometric responses, and variability in wood and leaf reflectance, limiting transferability across sensor platforms and forest conditions [6,17,42]. In addition, most frameworks have been evaluated using relatively few forest plots representing localized environmental conditions, leaving their broader transferability capability largely unexplored [35,40,43].
1.2. Terrestrial LiDAR on Wildfire Fuel Mapping
In fire behavior modeling, forest structure is broadly classified into three interconnected fuel strata—surface fuels (e.g., litter, grasses, and low shrubs), ladder fuels (vegetation and wood materials that create vertical fuel continuity between surface and canopy layers, facilitating the upward spread of fire into tree crowns), and canopy fuels (live and dead foliage, twigs, and branches within the tree crowns). Fuel strata vertical and horizontal continuity strongly influences fire ignition, crown fire transition, spread dynamics, and fire intensity [10,44,45]. Among forest fuel strata, canopy fuels have been the most extensively studied because the overstory is comparatively easier to characterize using remote sensing, including optical imagery, space-borne-LiDAR e.g., Global Ecosystem Dynamics Investigations (GEDI), airborne laser scanning (ALS), and Synthetic Aperture Radar (SAR), which effectively characterize canopy height, cover, structure, and AGB across large spatial scales [46,47,48]. In contrast, ladder and surface fuels are substantially more difficult to quantify because of canopy occlusion and fine-scale structural heterogeneity [17,36,49,50].
However, forests lower strata contain herbaceous (grasses and forbs), and highly heterogeneous woody fuel complexes, including shrubs, regenerating seedlings and saplings, downed woody materials e.g., the dead twigs, branches, stems, and boles broadly classified as CWD (diameter ≥ 7.6 cm) and fine woody debris (FWD; diameter < 7.6 cm), which collectively govern horizontal and vertical fuel continuity, surface fire propagation, fire intensity, and crown-fire transition dynamics [11,51,52]. CWD and FWD are commonly quantified using field-based fuel inventory methods that measure fuel diameter, length, volume, spatial distribution, and fuel loading across surface and near-surface strata [52]. Fine fuels strongly influence fire behavior (including grasses, shrubs, and FWD). Fine and coarse woody fuels collectively influence fuel continuity, fuel moisture dynamics, fire intensity, rate of spread, and crown-fire initiation. Fine woody fuels primarily govern ignition and rapid fire spread, whereas CWD sustains higher heat release and prolonged smouldering combustion after flaming has ceased, contributing to extended wildfire smoke emissions [53,54,55]. For that reason(s), 3-D fuel characterization is essential yet remains challenging due to their highly heterogeneous spatial organization, variable decomposition states, and complex 3-D structure across forest ecosystems [55,56,57].
Forest ecosystems exhibit substantial variability in species composition, canopy architecture, understory complexity, shrub abundance, regeneration dynamics, and the spatial distribution of CWD and FWD [58,59,60]. Consequently, semantic classes commonly used in existing multi-class segmentation frameworks—such as ground, understory, lower objects, stem, and foliage—may exhibit substantial variability across diverse forest ecosystems, with some classes becoming sparse, structurally ambiguous, or absent under certain environmental conditions [1,37,59]. Recent studies have similarly highlighted difficulties in separating understory and lower-object classes because of their strong geometric overlap with terrain and fine-scale mixing of wood-leaf components [36,37]. In contrast, although forest fuels comprise multiple structural strata and fuel types, their vegetation components can be represented for semantic segmentation by two primary combustible materials: wood-foliar biomasses (Figure 1).
Wood fuels—including stems, branches, CWD, and FWD—form relatively persistent structural frameworks, whereas foliar fuels such as foliage, grasses, and fine litter are more dynamic and strongly influence ignition and fire spread [44]. Wood-leaf abstraction aligns with established fire behavior concepts while reducing semantic ambiguity in terrestrial LiDAR point clouds [10]. Existing segmentation frameworks primarily emphasize structural classes rather than explicitly representing fuel heterogeneity across canopy, ladder, and surface fuel strata [30]. Following robust ground filtering, the remaining above-ground point cloud consistently consists of wood and foliar components distributed throughout the vertical 3-D fuel continuum, regardless of forest type or structural complexity [61,62]. Since wood-leaf classes represent fundamental structural elements common to virtually all forest ecosystems, it can provide a more stable and transferable target representation than ecosystem-specific semantic classes (Figure 1). Moreover, the millimeter-scale geometric detail captured by terrestrial LiDAR systems offers an opportunity to develop sensor-agnostic segmentation frameworks that not only separate wood and foliar components but also support subsequent decomposition into ecologically meaningful fuel classes relevant to wildfire behavior modeling [37].
1.3. Research Objectives
To the best of our knowledge, no previous study has comprehensively evaluated wood–leaf semantic segmentation transferability across complete global forest plots while explicitly representing the full 3-D fuel continuum, including canopy, ladder, and surface fuel strata. We focus exclusively on terrestrial LiDAR systems because their proximal sensing capabilities enable ultra-high-density point clouds with substantially greater structural detail than airborne LiDAR platforms, thereby providing improved characterization of surface, understory, and vertically connected fuel complexes that strongly influence wildfire behavior [49,63]. Furthermore, the datasets used in this study were acquired using several widely used terrestrial LiDAR platforms, e.g., RIEGL, GeoSLAM, Leica [28,36]. Collectively, the independent terrestrial LiDAR datasets encompass a wide spectrum of forest ecosystems, vegetation structures, climatic conditions, phenological states, terrestrial LiDAR platforms, and acquisition strategies, providing a globally representative evaluation framework for assessing the robustness, transferability, and operational applicability of DL models beyond conventional benchmark datasets [37]. Consequently, this study aims to develop a terrestrial LiDAR platform-agnostic DL framework for semantic segmentation. Specifically, the study addresses the following objectives:
1. Evaluate whether point-based supervised DL frameworks can achieve robust and transferable wood-leaf semantic segmentation across diverse forest ecosystems, sensor platforms, point densities, acquisition conditions, and seasonal leaf-on and leaf-off conditions [37].
2. Benchmark three widely used supervised point-based architectures—PointNet++, PointNeXt, and PT [24,28,36,64] —using harmonized manually annotated terrestrial LiDAR point clouds and identical training, validation, and evaluation protocols, thereby isolating the influence of network architecture on segmentation accuracy and cross-ecosystem transferability.
3. Investigate whether wood-leaf segmentation can serve as a foundation for automated fuel characterization by developing a geometric post-processing framework that further partitions wood-foliar binary abstractions into ecologically and operationally relevant fuel classes (i.e., stems, branches, canopy foliage, wood debris, and surface leafy fuels). We hypothesize that the wood component contains sufficient geometric information to support subsequent structural decomposition while reducing computational requirements and improving transferability relative to existing multi-class DL segmentation frameworks.
2. Materials and Methods
2.1. Datasets
To address the research objectives (Section 1.3), a comprehensive set of wood-foliar manually annotated point clouds representative of globally distributed forest ecosystems is required to train and evaluate DL frameworks [28,37,65]. Given the limited availability of manually annotated point clouds, we acquired most of the available labelled point clouds of different scales and representations [3]. The integration of these complementary datasets enables model development across multiple hierarchical levels of forest structure, ranging from individual trees and plot-level forest stands (understory and surface fuels removed) to complete forest scenes containing understory vegetation, surface fuels, and terrain, thereby supporting robust learning across increasingly complex structural environments (Table 1).
2.1.1. Wood-Leaf Plot-Level Datasets
Plot-level semantically labeled TLS point clouds from diverse forest ecosystems (Figure 2a-b) were incorporated to strengthen the representation of complete forest structural conditions. These datasets were acquired using multi-scan TLS protocols with extensive upright and tilted scan positions to minimize occlusion and preserve fine wood structures throughout the canopy profile [21]. Unlike isolated individual-tree datasets, plot-scale acquisitions capture complex interactions among stems, branches, foliage, understory, and surface fuels under natural stand conditions. The manually curated binary wood–leaf annotations provide high-quality benchmarks for learning wood-leaf structure across complete forest scenes [67].
The Lin3D dataset is a forest-scene point cloud benchmark developed for semantic segmentation across forest types and sensor platforms. It contains forest point clouds annotated into four semantic categories: foliage, wood, ground, and lower objects [36]. Given that wood-foliar semantics are not available for understory, only tree assemblies are included at the plot level by removing the understory and ground. We only used a single plot and retained the remaining 5 plots for model generalization assessment [36]. The Plot-Semantics dataset is a high-density TLS dataset developed for wood–leaf semantic segmentation across diverse temperate forest ecosystems, comprising plots collected from Spain, Austria, Germany, Finland, and the United Kingdom (UK). Data were acquired using a RIEGL VZ-400i following a systematic multi-scan protocol within 30 × 30 m forest plots to minimize occlusion and capture detailed canopy architecture. The final dataset consists of twelve plots spatially partitioned into 10 × 10 m blocks at 1 cm resolution, containing xyz coordinates, reflectance values, and wood-leaf semantics of canopy and understory [67].
2.1.2. Individual Tree Point Clouds
Second, manually annotated individual-tree TLS point clouds with wood–leaf annotations (Figure 2c) were incorporated to complement the plot-level benchmarks. Unlike plot-level acquisitions, these datasets provide detailed representations of individual tree architecture, preserving fine branches, crown morphology, and wood–foliar interactions while substantially reducing occlusion through multi-scan acquisitions [66]. This enables the training framework to learn genus-specific structural characteristics across diverse branching patterns and crown forms, thereby improving its ability to generalize across heterogeneous forest conditions.
The SYSSIFOSS-Trees benchmark consists of 11 manually annotated individual-tree TLS point clouds representing seven temperate and boreal tree species, including Norway spruce (Picea abies), Scots pine (Pinus sylvestris), Douglas fir (Pseudotsuga menziesii), European beech (Fagus sylvatica), sycamore maple (Acer pseudoplatanus), silver birch (Betula pendula), and European aspen (Populus tremula), acquired under leaf-on conditions in managed mixed forests of southwest Germany [69]. Individual trees were scanned from five to eight terrestrial laser scanning positions using a RIEGL VZ-400 to maximize canopy coverage and minimize occlusion. Each point cloud was manually annotated into binary wood and foliar classes, providing a high-quality benchmark for evaluating fine-scale wood–foliar semantic segmentation across diverse crown architectures and branching organizations [27].
2.1.3. Multi-Class Plot Labels
Existing plot-level forest semantic segmentation benchmarks provide detailed multi-class semantic annotation comprising 16 manually annotated vegetation and non-vegetation categories, including ground and ground vegetation, shrubs, understory and stems, branches and foliage, down wood, stumps, ivy, and ancillary non-vegetation objects (e.g., rocks, stakes, and people), following the SegmentedForests annotation scheme [68]. However, a major limitation of SegmentedForest is the absence of explicit wood-foliar semantics; e.g., leaves and fine branches are often grouped within the same vegetation class, obscuring the structural distinction between fine wood and foliar components (Figure 3a). Consequently, fine branches are frequently grouped with foliage within the same canopy class, obscuring the structural distinction between wood-foliar components (Figure 3a).
To overcome this limitation, we incorporated a manually refined subset of the SegmentedForests benchmark [68], which contains forest point clouds acquired using TLS and MLS across multiple forest ecosystems. Eight structurally diverse plots (Plots 6–10 and 12–14) were selected from the original benchmark. Rather than annotating the complete forest plots (≈1,300–3,600 m² ), representative 5 m × 10 m transects were extracted to maximize structural diversity while substantially reducing the manual annotation effort required for the much larger original scenes. Manual refinement was performed in CloudCompare (Version:2.14. beta) following the same slice-based workflow described by the original authors, ensuring methodological consistency with the published benchmark [68]. To this end, branches were manually separated from foliage throughout tree crowns, understory, shrubs, and wood debris to produce high-quality binary semantic labels (Figure 3c,d). Finally, the refined annotations were harmonized into a unified binary representation by merging stems, branches, CWD/FWD, and woody shrubs into a single wood class, while foliage and all foliar vegetation were assigned to the foliar class (Figure 3b–d).
ForestSegmented represents diverse natural and managed temperate forest ecosystems across Austria and the USA, spanning broadleaf, coniferous, and mixed stands dominated by European beech (Fagus sylvatica), European ash (Fraxinus excelsior), Norway spruce (Picea abies), silver fir (Abies alba), ponderosa pine (Pinus ponderosa), and longleaf pine (Pinus palustris) [68]. Structurally, these plots encompass multi-layer canopies, dense understory, natural regeneration, open woodlands, and stands with strong vertical fuel continuity (Figure 3a-c). The processed subset contributed approximately 51.7 million labeled points, comprising 10.9 million wood points (21.1%) and 40.3 million leaf points (77.8%).
2.2. Quality Control and Data Inclusion Criteria
All labeled datasets were subjected to rigorous quality control (QC) to ensure consistency of wood-foliar annotations across datasets (Table 1). Plot-level binary labels were assessed through statistical sampling to identify potential labeling errors. Because visual assessment of entire forest plots is difficult in high-density terrestrial LiDAR point clouds, a transect-based QC approach was implemented in which total (n = 100) non-overlapping (10 × 5) m transects were automatically extracted from each plot for detailed visual qualitative assessment. This procedure enabled efficient assessment of canopy, understory, and wood-foliar labels across structurally heterogeneous forest environments. Datasets exhibiting poor labeling quality or combined wood–leaf classes were excluded. Although manually annotated point clouds inherently contain some degree of labeling uncertainty, the QC process ensured that residual labeling noise remained within an acceptable tolerance (≈ 5%) for DL training (Figure 2 and Figure 3).
While recent studies have increasingly relied on synthetic forest point clouds to augment training data, simulated environments cannot fully reproduce the structural complexity, ecological variability, sensor-specific artifacts, and labeling uncertainty present in real forests [37]. Furthermore, training on narrowly distributed datasets may increase susceptibility to domain shift and negative transfer when models are applied to structurally distinct forest conditions [37,70]. Negative transfer occurs when a model trained on one or more source forest ecosystems experiences a measurable decline in semantic accuracy after transfer to previously unseen target forests exhibiting different structural characteristics, species compositions, or acquisition conditions than those represented in the training data. To our knowledge, this represents the first effort to systematically combine tree-assembly (plots without understory and ground; Figure 2a), individual-tree (Figure 2c), and complete plot-scale terrestrial LiDAR datasets (Figure 2b and Figure 3) for the development and evaluation of a generalized wood-leaf semantic segmentation framework.
2.2.1. Structural Variability and Class Composition of the Training Datasets
Across all benchmark datasets, foliar points accounted for approximately 74% of all labeled observations, whereas wood points represented 26% (Figure 4a), reflecting the natural class imbalance commonly observed in LiDAR acquisitions under leaf-on canopy conditions [19]. At the individual dataset level, however, class composition varied substantially, with wood fractions ranging from approximately 3% to 62% and foliar fractions from 38% to 97%, indicating pronounced differences in canopy density, branching architecture, and structural organization among forest ecosystems. Within-dataset distribution of class proportions further highlights this heterogeneity (Figure 4b). The median foliar fraction was 0.68, compared with 0.32 for wood points, while the broad interquartile ranges demonstrate considerable variability in vegetation composition across benchmark datasets. Such variability is advantageous for model development because it exposes DL frameworks to a wide range of structural conditions rather than a narrow, species-specific domain. Point densities spanned more than one order of magnitude, ranging from approximately 5 × 10³ to over 1.5 × 10⁵ points m⁻² (Figure 4c). Both wood and leaf classes were represented across the full density spectrum, indicating substantial diversity in sensor configurations, acquisition geometries, and scanning protocols. Similarly, vertical structural complexity varied markedly among datasets, with vertical extents ranging from 12 to 57 m (Figure 4d), encompassing low-stature vegetation, intermediate-height stands, and tall dominant canopy forests.
2.3. Benchmark Datasets for DL Frameworks Evaluation
To evaluate model transferability and transferability, five independent benchmark datasets representing contrasting forest structures, fuel conditions, and spatial scales were used for model assessment (Table 2). Importantly, these datasets were not represented during training and validation (except Lin3D single plot to understand how in-domain training validation influences the DL frameworks); they therefore provide an independent evaluation of model robustness across different forest regimes.
The TLS benchmark dataset consists of plot-level point clouds collected across Finland and Canada using Leica HDS6100 and Optech ILRIS terrestrial laser scanners operating under different acquisition configurations and wavelengths (Table 2). The subset used in this study includes lodgepole pine (Pinus contorta Douglas; LPine), red pine (Pinus resinosa Aiton; RPine), Scots pine (Pinus sylvestris; SPine), Norway spruce (Picea abies; NSpruce), sugar maple (Acer saccharum Marshall; SMaple), and trembling aspen (Populus tremuloides; TAspen), representing a broad range of forest structures, species compositions, and canopy architectures [71,72]. Representative examples of the plot-level benchmark datasets are presented in Figure 5a–c, illustrating wood–leaf annotations for NSpruce, RPine, and TAspen genera.
The Tropical Tree benchmark dataset consists of 147 individual tropical tree TLS point clouds acquired from three tropical rainforest sites in north-eastern Australia, including Daintree Rainforest Observatory (DRO), Oliver Creek (OC), and Robson Creek (RC), using a RIEGL VZ-400 operational at a 1550 nm, 300 kHz pulse repetition rate, 0.35 mrad beam divergence, and 0.04° angular resolution. The benchmark manually annotated trees representing 41 tropical species, selected from structurally diverse rainforest plots spanning tree heights from approximately 10 to 37 m and encompassing a wide range of crown architectures, stem diameters, and branching complexities. Trees were extracted from registered plot-level TLS acquisitions and subsequently labelled into wood and foliar classes (Figure 5e) through a semi-automated workflow followed by rigorous manual refinement [28].
The LeWoS benchmark dataset consists of 61 individual tropical tree TLS point clouds acquired from tropical forests in eastern Cameroon using a Leica C10 ScanStation under multi-scan acquisition protocols. The benchmark encompasses structurally diverse tropical trees spanning a broad range of heights (8.7–53.6 m) and diameters at breast height (10.8–186.6 cm), providing high-quality binary wood–foliar annotations (Figure 5f) for independent semantic segmentation evaluation [73].
ForestSemantic is a TLS benchmark dataset collected from six 32 × 32 m boreal forest plots in Evo, Finland, using a Leica HDS6100 scanner [74]. The dataset contains manually annotated plot-level point clouds representing the major boreal tree species, including Scots pine (Pinus sylvestris), Norway spruce (Picea abies), and silver birch (Betula pendula), with semantic labels for ground, trunk, first-order branch, higher-order branch, foliage, and miscellaneous objects [74]. It was used to evaluate the capability of the points2woodyseg framework (research objective 3) to further separate wood components into stem and branch classes. Surface wood and surface leaf annotations are not available; quantitative assessment was limited to stem, branch, and foliage classes within the annotated single plot data [74].
2.4. Global Datasets for Qualitative Evaluation
In addition to the benchmark (Table 2), a diverse collection of publicly available TLS and MLS datasets was assembled for qualitative assessment (Table 3). These datasets, including Wytham Woods, BlueCat, Ofental, Robson Creek, Litchfield, and other independent forest sites, have been widely adopted for DL frameworks for tree instance segmentation [13,39,75,76]. In contrast, their application to wood–foliar semantic segmentation has remained comparatively limited owing to the lack of consistent semantic annotations and standardized evaluation protocols. Collectively, these datasets encompass diverse forest ecosystems, acquisition geometries, sensor platforms, and structural conditions, thereby providing a rigorous assessment of DL frameworks’ transferability under realistic operational scenarios.
Datasets (Table 3) were intentionally excluded from quantitative evaluation because they do not satisfy the QC criteria established in the present study (Section 2.2). For example, Wytham Woods, which is a leaf-off TLS dataset [37], and several recently released benchmarks provide high-quality TLS point clouds but do not include point-wise wood–foliar semantics required for quantitative evaluation. Conversely, datasets such as BlueCat provide wood–foliar semantics and have been adopted in previous semantic segmentation studies [31]; however, visual inspection revealed substantial annotation inconsistencies, particularly within fine branches, branch–foliage interfaces, and partially occluded woody structures. Consequently, these datasets were retained exclusively for qualitative assessment, which is visual quality assessment of the processed dataset [36]. This evaluation strategy ensures that quantitative benchmark metrics are derived only from datasets satisfying the proposed QC protocol, while simultaneously demonstrating the transferability and operational applicability of the trained framework across a broad range of independently acquired forest LiDAR datasets.
2.5. Methodology Overview
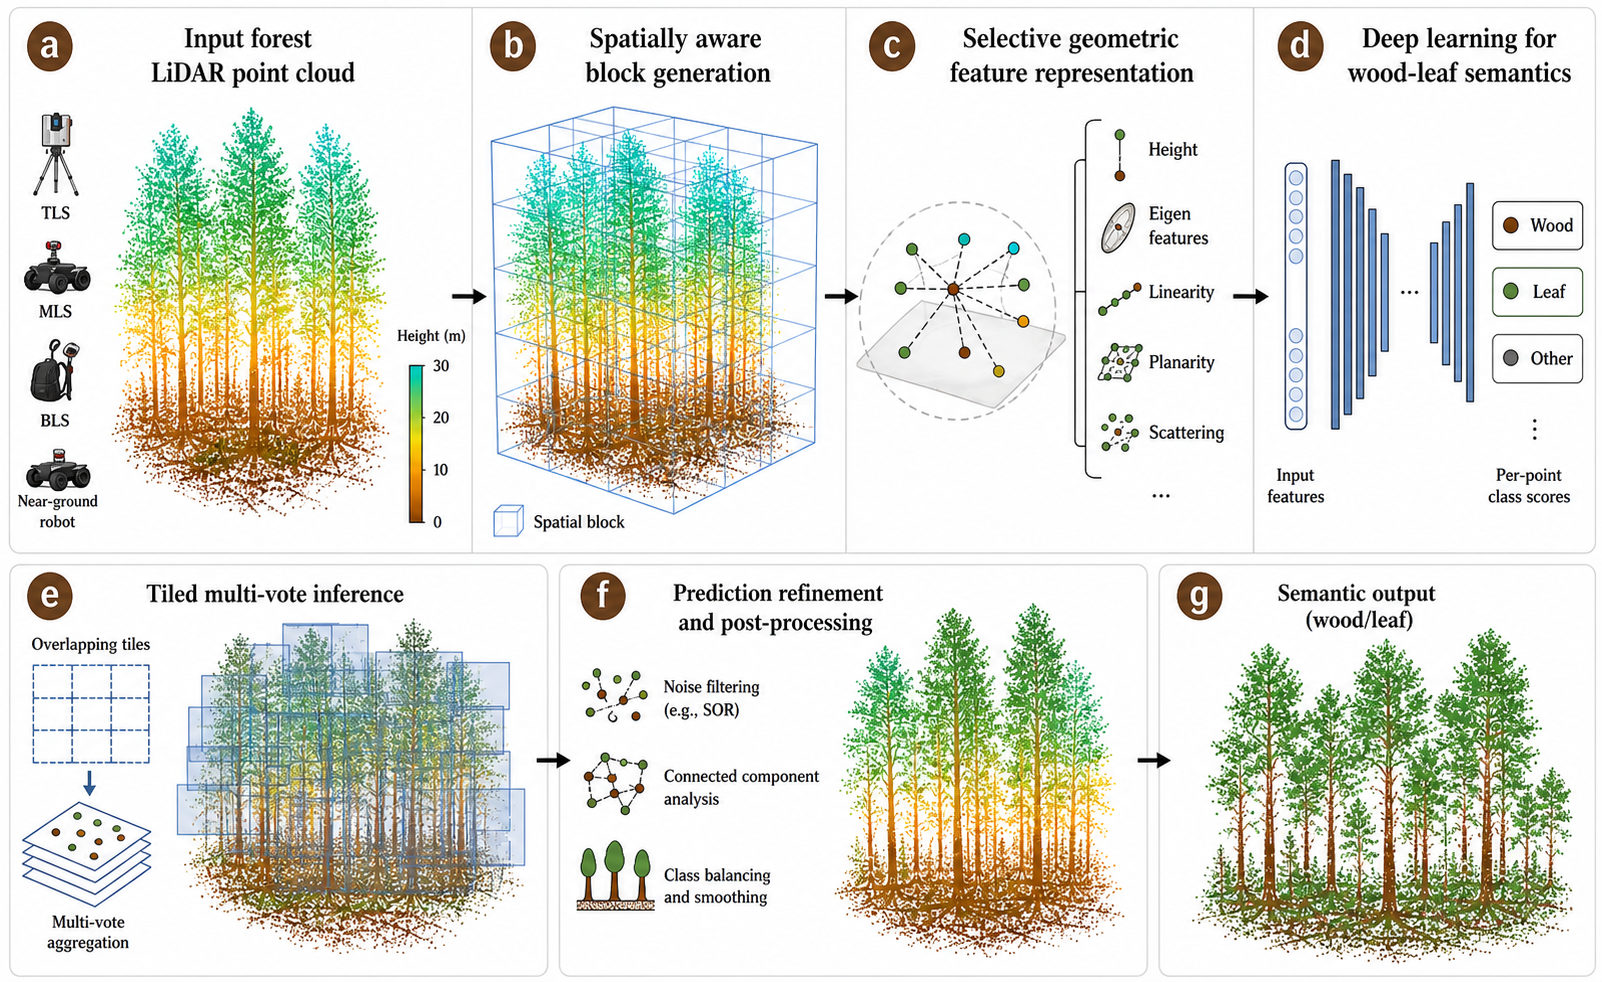
The proposed framework, points2SBL, which performs segmentation of LiDAR point clouds into wood-foliar semantics, uses diverse training and validation datasets presented in Section 2.1. The framework was specifically designed to generalize across heterogeneous forest ecosystems, structural conditions, and close-range LiDAR acquisition systems, including TLS, MLS, backpack laser scanning (BLS), and other near-ground platforms. Unlike conventional multi-class semantic segmentation approaches that rely heavily on radiometric information, spectral attributes, or sensor-specific features [78], points2SBL emphasizes geometry-driven learning using spatial structure and local neighborhood characteristics derived directly from 3-D point clouds [19]. Points2SBL is implemented in Python within the Anaconda environment and is publicly available at https://github.com/nadeemfareed/points2SBL.All experiments were implemented in Python 3.11 using PyTorch (≥ 2.0). Processing and benchmarking were performed on a high-performance workstation running Windows 11 Enterprise (64-bit), equipped with an Intel Xeon W5-2465X processor (3.10 GHz), 384 GB DDR5 RAM (4400 MT/s), and an NVIDIA RTX 5000 Ada Generation GPU (31 GB VRAM)
Figure 6 shows the schematic design of points2SBL, which consists of five automated modules comprised of: (a) point cloud preparation and label harmonization, (b) block generation and sampling, (c) geometric feature extraction, (d) DL network training, (e) tiled multi-vote inference, and (f) post-processing. Each module is thoroughly described in the following sub-sections.
2.5.1. Spatially Aware Block Generation
A large fraction of points in terrestrial LiDAR scans correspond to ground, which is not relevant for wood–leaf segmentation [62]. Ground points were first classified using the Fully Adaptive Self-Tuning Ground Classification (FAST-GC) algorithm (https://pypi.org/project/fastgc/, accessed on 25 July 2026). After removing the classified ground points, the remaining 3-D point clouds consisted solely of wood and leaf components [19]. This pre-processing step also reduces the computational burden of geometric feature calculation and DL framework training. Wood-foliar point clouds were then partitioned into spatial blocks to further improve scalability and mitigate boundary artifacts during DL training and inference. Spatial partitioning was performed in the horizontal plane while preserving the complete vertical structure of vegetation and fuel strata within each block (Figure 6b). The spatial support of each block was defined as:
where represents the -th spatial block, denotes the input point cloud, and and represent the horizontal window dimensions. A set of candidate tile sizes (0.5, 1, 2, 4, and 6 m) was evaluated to select an appropriate horizontal block extent. Because of the strong wood–leaf class imbalance (Figure 4), very small tiles (< 2 m) produced a large number of leaf’s-dominated blocks, whereas large tiles (e.g., 5 m) substantially reduced the number of training tiles for individual-tree point clouds (Figure 2). Based on these experiments, we adopted 2 × 2 m spatial windows with 50% overlap in both horizontal directions (x, y), which provided a well-balanced total number of training tiles across wood- and leaf-dominated regions. For each valid block, a fixed number of points was randomly sampled to maintain consistent tensor dimensions during optimization. Blocks with too few valid points were discarded, whereas partially sparse but still valid blocks were sampled with replacement to preserve fixed-size network inputs. To improve geometric invariance and reduce directional bias, training blocks were randomly rotated around the vertical axis and spatially centered prior to model optimization. Instead of splitting the input datasets into three distinct blocks (e.g., 70% training, 15% inference, and 15% testing), blocks from entire labelled point clouds were pooled and randomly shuffled before being partitioned into training and validation subsets to minimize site-specific and acquisition-specific bias during training and validation.
2.5.2. Selective Geometric Feature Representation
The proposed framework was designed to operate exclusively on geometric features derived from local 3-D neighborhood structure without relying on radiometric attributes and RGB [78]. This limitation is generally associated with labelled point clouds in that a large amount of labeled data is missing radiometric/intensity and RGB information [78,79]. Geometric features-based design improves transferability across heterogeneous terrestrial LiDAR systems where radiometric responses and acquisition geometries vary substantially among sensors and forest environments [80]. For each point, local geometric structure was estimated by k-nearest-neighbors (KNN) neighborhoods using covariance-based eigenvalue decomposition (Figure 6c). The covariance matrix was computed as:
where denotes the covariance matrix associated with the point , represents the -th neighboring point, and denotes the centroid of the local neighborhood (Figure 6c). Eigenvalue decomposition was subsequently applied as:
where are the ordered eigenvalues and are the corresponding eigenvectors. Four covariance-derived geometric descriptors were computed from the eigenvalues:
where , , , and represent linearity, planarity, scattering, and curvature, respectively. The final point-wise feature vector comprised centered spatial coordinates and a compact set of covariance-derived geometric descriptors. Although many additional geometric metrics can be computed from TLS point clouds [25,65], all of them would substantially increase computational costs for feature calculation, model training, and inference on large scenes [12,79]. Moreover, several higher-order descriptors are sensitive to forest structure, sensor modality, and local point density, which can reduce robustness when transferring models across sites or LiDAR systems. We therefore focused on a small subset of descriptors that complement and are most informative on wood–leaf separation. In particular, linearity, planarity, and curvature provide a stable foundation for distinguishing wood components from foliage, while scattering is highly indicative of leaf clusters. Using the Classification and Regression Tree (CART), a recent study concluded that curvature, planarity, and linearity are important distinguishing features for woody surfaces [25]. Furthermore, the training data contains a very large number of leaf samples but relatively fewer wood samples (Figure 4); selective geometric features better characterize wood structure and potentially compensate for class imbalance for DL frameworks. All feature channels were independently standardized prior to model training using z-score normalization. DL frameworks were input with the same sets of 7-dimensional training, validation, and inference datasets (Equation (8)).
2.5.3. DL Frameworks for Wood-Leaf Semantics
Three supervised point-based DL architectures were evaluated, including PointNet++, PointNeXt, and PT. The primary configuration used seven input channels (Equation (8)) and binary semantic outputs corresponding to wood and foliar classes. The optimization objective combined weighted cross-entropy and Dice losses (Equation (9)) to improve segmentation stability under strong class imbalance (Figure 4) conditions commonly observed in terrestrial LiDAR point clouds [36,78].
where , , and are weighting coefficients controlling the contribution of each loss component. Weighted cross-entropy loss was estimated as:
where denotes the class-specific weighting coefficient, represents the reference class label, and denotes the predicted posterior probability for class .
Dice loss was computed as:
Focal loss was additionally implemented as an optional optimization component to emphasize difficult samples during training:
Model optimization was performed using stochastic gradient optimization with adaptive learning-rate scheduling and mixed-precision GPU acceleration. The best-performing validation checkpoint was retained for inference.
2.5.4. Multi-Vote Inference
To support operational-scale prediction of large terrestrial LiDAR point clouds, tiled multi-vote inference was implemented using overlapping spatial offsets (Figure 6e). During inference, each point cloud was partitioned into multiple overlapping tiles, and semantic predictions were independently generated for each tile configuration. Individual points, therefore, received multiple semantic predictions from neighboring inference windows. Final posterior probabilities were estimated using weighted ensemble averaging:
where represents the predicted probability from the -th vote, denotes the corresponding vote weight, and is the total number of valid predictions received for the point . The final semantic label was assigned using maximum posterior probability:
The multi-vote inference strategy substantially reduced tile-boundary artifacts and improved spatial consistency across neighboring prediction regions while preserving fine-scale wood and foliage structures under strong canopy occlusion conditions.
2.5.5. Prediction Refinement and Post-Processing
To improve the spatial consistency of semantic predictions and reduce isolated segmentation artifacts, particularly when offset voting contributes less to per-point predictions at the scene edges of plots or individual trees, several optional post-processing operations were implemented following neural-network inference. These operations were designed to preserve continuous wood structures while suppressing noisy leaf-to-wood and wood-to-leaf misclassifications commonly observed in dense canopy environments. Prior to inference, statistical outlier removal was optionally applied to suppress isolated noisy returns and unstable neighborhood configurations. During inference, existing ground points are excluded from semantic prediction and preserved separately to avoid confusion between terrain and woody vegetation components. Following semantic prediction, neighborhood-based spatial refinement was applied to improve the local consistency of semantic labels. For each point, neighboring semantic probabilities were aggregated within a local spatial neighborhood to reduce isolated point-wise prediction noise:
where denotes the refined posterior probability for point , represents neighboring probabilities, and is the number of local neighbors. Additional structural refinement operations were implemented to preserve the spatial continuity of wood structures and suppress isolated false-positive wood predictions. Small, disconnected wood components below a user-defined minimum size threshold were optionally removed, while local wood-support filtering was applied to reinforce structurally coherent stem and branch regions under strong foliage occlusion. In addition to discrete semantic labels, continuous posterior probabilities were retained for downstream analysis and uncertainty assessment.
2.5.6. Performance Evaluation of DL Frameworks
For wood-foliar semantics, DL frameworks were evaluated using standard point-level semantics derived from the confusion matrix, including overall accuracy (oACC), mean accuracy (mACC), mean Intersection over Union (mIoU), precision (P), recall (R), F1-score, Micro-F1 (MF1), and balanced accuracy (BA) (Equations (16)–(22)). These metrics were computed for wood-leaf semantics across all terrestrial LiDAR point cloud datasets (Section 2.2). Global semantic performance was quantified using oACC, mACC, mIoU, and BA, while class-specific distinction was assessed using precision, recall, F1-score, and MF1. Herein, , , , and represent the true positives, true negatives, false positives, and false negatives for class , respectively, and denotes the total number of semantic classes.
To evaluate segmentation performance along the vertical forest strata, all metrics (Equations (16)–(24)) were additionally assessed across relative height from the surface to the canopy. Relative height was defined by normalizing the vertical extent of each benchmark dataset between its minimum and maximum heights, where the minimum height was assigned 0 and the maximum height was assigned 1. The distributions of both reference and predicted wood and leaf points were normalized within this range to enable consistent comparison across datasets with varying vertical extents.
2.5.7. Evaluation Scenarios
DL frameworks were evaluated under three complementary scenarios: (1) complete forest plots containing surface, understory, and overstory vegetation (Figure 5a-c); (2) individually segmented trees (Figure 5e-f); and (3) plot-level tree point clouds with surface and understory vegetation removed to isolate overstory tree structures and assess improvements in segmentation performance following the exclusion of lower vegetation strata, where wood–leaf discrimination is often more challenging [28]. This third scenario was particularly significant for the Lin3D benchmark, where understory and surface fuel components are not explicitly annotated for wood–leaf semantics (Figure 5d). The three-tier evaluation framework, applied across four benchmark datasets, i.e., three plot-level and two tree-level datasets (Section 2.3), enables a more comprehensive investigation of terrestrial LiDAR semantic segmentation across varying structural complexities and operational scales. To the best of our understanding of existing investigations of similar scopes, such a unified multi-scenario 3-D forest vertical stratum evaluation remains largely unexplored, whereas a large number of studies have documented overall accuracy assessments for individual trees or forest plots [36,81,82] using a combination of equations (Equations (16)–(27)). Furthermore, the proposed framework was designed to establish a fully automated DL framework capable of operating robustly across these complementary scenarios, thereby extending its practical applicability and utility for broader forest vegetation, AGB, and fuel characterization using emerging terrestrial LiDAR systems [40,83].
3. Results
3.1. Comparative Assessment of DL-Frameworks Performance
DL frameworks showed stable convergence, with rapid loss reduction during the first 10–15 epochs followed by gradual stabilization in both training and validation phases (Figure 7a,b). PT consistently achieved the lowest training and validation losses, indicating more effective optimization than PointNeXt (PNx) and PointNet++ (PN++). This trend was consistently reflected across all validation metrics, where PT maintained the highest and most stable performance throughout training, reaching peak values of approximately OA = 92.00, mIoU = 78.00, MF1 = 86.00, WF1 = 78.00, LF1 = 95.00, and BA = 87.00 (Figure 7c–h). PointNeXt and PointNet++ followed similar optimization trajectories and converged to comparable performance, generally remaining 1–3 percentage points lower across most metrics (Figure 7c–h).
Overall, these results indicate that all three architectures successfully learned the generalized wood-leaf semantics under identical training conditions, with PT showing superior optimization stability and stronger within-distribution validation performance [28]. However, because the validation subsets represent sparse samples drawn from the broader harmonized training pool (Figure 4), these results primarily reflect within-distribution model behavior. Therefore, the independent benchmark evaluations presented in the following sections provide a more rigorous assessment of model robustness and true cross-ecosystem transferability.
3.2. Post-Processing
An optional post-processing refinement step was applied after DL inference to improve the spatial consistency of wood-foliar semantics. This is an optional yet important step to suppress isolated artefacts in wood-foliar semantics. This refinement combined neighborhood-based posterior smoothing and local wood-support filtering to preserve continuous stem and branch structures under dense canopy occlusion. The effect of refinement was quantified as the change in performance metrics between raw and refined predictions, expressed in percentage points (pp). The response to refinement was strongly model-dependent (Figure 9). PT showed consistent improvement across nearly all metrics, including OA (+0.26 pp), mIoU (+0.36 pp), MF1 (+0.21 pp), MCC (+0.58 pp), WF1 (+0.12 pp), WIoU (+0.20 pp), and notably wood precision (+2.17 pp), indicating that its predictions already exhibited stronger spatial coherence and clearer structural boundaries between wood and leaf components (see Figure 8).
Results indicate that neighborhood-based refinement was able to reinforce existing local consistency while suppressing localized salt-and-pepper inference artifacts, resulting in cleaner and structurally more coherent semantic boundaries even where overall metric gains remained modest. In contrast, PN++ and PNx showed slight declines across most metrics, despite modest gains in wood precision (+1.91 and +1.76 pp, respectively), accompanied by larger reductions in wood recall (-2.83 and -2.51 pp). This pattern shows that these architectures produced noisier and less distinct class boundaries, where refinement tended to over-smooth ambiguous regions and removed valid wood predictions. Overall, the results indicate that post-processing refinement is most effective when the underlying model already provides spatially stable and structurally coherent predictions (PT). It should be noted that post-processing refinement remains an optional user-defined step. Based on the performance trends observed (See Figure 8), its application is not recommended for PN++ and PNx, as these frameworks already provide results comparable to PT and may experience slight reductions in overall performance following refinement.
3.3. Models Generalization Evaluation on Lin3D
To provide an intermediate assessment between within-distribution validation and fully independent external benchmarking, Lin3D was used for a spatially held-out cross-plot evaluation. One comparatively small Lin3D plot, with ground and understory removed, was included in the harmonized training and validation pool. The remaining five plots (plots 2–6) were excluded entirely from model development and used only for final evaluation. The experiment therefore assesses generalization to unseen forest plots from the same benchmark, while retaining consistency in annotation taxonomy and acquisition domain.
Across all metrics, PT achieved the highest overall performance (Table 4), with an OA of 92.35, mIoU of 85.12, MF1 of 91.93, MCC of 84.08, WF1 of 90.09, and WIoU of 81.97, consistently outperforming PN++ and PNx. Although PN++ and PNx showed comparable overall performance, both remained lower than PT across all major segmentation metrics, consistent with previous benchmark studies [28]. The largest improvements were observed in wood-specific agreement, where PT improved WF1 by 1.78–2.10% and WIoU by 2.90–3.41% relative to the other architectures.
The metric distributions further support this pattern (Figure 9), with PT showing consistently higher median values and narrower interquartile ranges across mIoU, MF1, WF1, WIoU, MCC, and OA, indicating stronger and more stable generalization and transferability. In contrast, PN++ and PNx exhibited broader variability and lower lower-bound performance, particularly in wood-sensitive metrics (WF1, WIoU, MCC), reflecting higher uncertainty in structural discrimination.
These results confirm that the performance metrics observed during training and validation remained consistent under a spatially held-out complete Lin3D benchmark, with PT maintaining its generalization capabilities.
3.4. PT Transferability Assessment of Benchmark Datasets
Table 4 summarizes the overall wood-foliar semantic performance achieved by the PT model across benchmark datasets (Section 2.3). PT was selected for detailed evaluation because it consistently outperformed PN++ and PNx during model generalization and transferability assessment (Section 3.1 and Section 3.3). Consequently, the following analyses focus on evaluating PT across benchmark datasets comprised of forest plots, LeWoS Trees, and Tropical Trees (Table 2).
Table 5 shows that the PT demonstrated consistently high wood-foliar semantic segmentation performance across benchmarks despite substantial differences in forest structure, species composition, point density, acquisition geometry, and sensor characteristics (Section 2.3; Figure 5). OA remained remarkably stable, ranging from 91.63 to 94.09, while mACC and BA varied between 87.60 and 93.57. Similarly, mIoU ranged from 77.57 to 86.57, MF1 from 86.80 to 92.73, MCC from 73.65 to 85.57, WF1 from 78.82 to 90.01, WP from 76.72 to 87.11, and WR from 81.04 to 93.11, indicating a balanced tradeoff between wood precision and recall across all evaluation scenarios. The close correspondence between mACC and BA indicates that wood-foliar semantic segmentation remained relatively insensitive to class imbalance despite the predominance of foliar points within the training data (Figure 4b).
The TLS plots dataset represented the most challenging evaluation scenario because it contained the complete 3-D fuel continuum, including canopy fuels, ladder fuels, understory vegetation, shrubs, regenerating seedlings and saplings, CWD, and FWD. Consequently, this dataset produced the lowest yet comparable metrics, with OA = 91.63, mACC = 87.60, BA = 87.57, mIoU = 77.57, MF1 = 86.80, MCC = 73.65, WF1 = 78.82, WP = 76.72, and WR = 81.04. In contrast, the highest performance was observed for the individual-tree datasets. LeWoS Trees achieved the strongest overall agreement across nearly all metrics (OA = 93.75, mACC = 93.57, BA = 93.57, mIoU = 86.57, MF1 = 92.73, MCC = 85.57, WF1 = 90.01, WP = 87.11, WR = 93.11), followed closely by the Tropical Tree benchmark (OA = 94.09, mACC = 92.66, BA = 92.66, mIoU = 84.41, MF1 = 91.33, MCC = 82.78, WF1 = 86.44, WP = 82.97, WR = 90.21) (Table 5).
3.5. Confusion Matrix Analysis
To further investigate the sources of classification uncertainty, the distributions of TP, TN, FP, and FN together with class-specific omission and commission errors were examined across all benchmark datasets (Figure 10 and Figure 11). Although overall wood-foliar semantics remained consistently high (Table 5), the confusion analysis revealed important differences in how classification errors were distributed among benchmark datasets and structural conditions.
Across all datasets, TN represented the largest proportion of classified points, ranging from 62.0% in Lin3D to 76.0% in TLS plots (Figure 10). TN reflects the large proportion of foliar points present within benchmarks and indicates consistently reliable segmentation. Likewise, FP fractions remained low across all benchmarks, varying between 2.4% and 4.7%. The lowest FP fraction was observed in Lin3D, whereas TLS plots exhibited FP (4.7%). Lin3D and LeWoS Trees exhibited the largest TP fractions, 29.8% and 28.2%, respectively, whereas TLS plots contained the smallest TP fraction (15.6%). However, Lin3D also produced the largest FN fraction (5.8%), indicating a tendency toward conservative wood classification in which uncertain points were preferentially assigned to the leaf class. In contrast, the Tropical tree and LeWoS Trees exhibited substantially lower FN fractions (2%), indicating improved recovery of wood structures.
The class-specific error metrics are shown in Figure 11 to further clarify metric trends. Wood omission decreased progressively from 0.19 in TLS plots to 0.07 in the LeWoS Trees, while wood commission declined from 0.23 to 0.13 across the same datasets. The relatively large wood-related errors observed in TLS plots indicate that most residual uncertainty originated from the classification of wood components rather than foliage. By comparison, LeWoS Trees and Tropical Trees exhibited substantially lower wood-related errors, reflecting improved visibility of wood elements. Foliar-related errors remained consistently small across all benchmark datasets (Figure 11). Leaf omission varied between 0.04 and 0.06, while leaf commission remained below 0.09 in all benchmarks. The comparatively low magnitude and limited variability of these errors indicate that foliage was identified reliably regardless of forest type, species composition, or acquisition platform.
3.6. Quantitative Analysis Across Forest Vertical Strata
Section 3.4 demonstrated overall PT wood-foliar semantic segmentation performance, which is the widely used technique in DL framework evaluations. Nevertheless, aggregate statistics do not reveal where within the canopy profile these errors occurred. Given that wood-foliar semantics exhibit complex vertical stratification in forest ecosystems, segmentation performance was further evaluated as a function of relative canopy height of plots and individual tree benchmarks.
Vertical performance profiles revealed consistent height-dependent trends across all benchmark datasets (Figure 12). Segmentation accuracy generally increased from lower canopy layers toward the mid-canopy region, where maximum performance was observed, before progressively declining toward the overstory. The Tropical tree and LeWoS Trees datasets exhibited the most stable vertical responses, maintaining mIoU, WF1, WP, and WR values above approximately 0.80 throughout much of the canopy profile (Figure 12c, d). TLS plots displayed a similar pattern but with a more pronounced reduction in performance above approximately 0.80 relative height (Figure 12a), whereas Lin3D maintained high WP throughout most canopy layers but exhibited a marked decline in WR within overstory regions (Figure 12b).
PT preserved the vertical distribution of wood throughout the 3-D fuel continuum (Figure 13). The background shading represents the relative abundance of wood (brown) and leaf (green) points within each benchmark dataset, providing ecological context for interpreting prediction behavior across contrasting forest structures. The reference woody profile represents the benchmark-derived vertical distribution of woody points, whereas the predicted woody profile denotes the corresponding distribution predicted by PT. The woody agreement profile quantifies the proportion of points simultaneously classified as woody by both the benchmark and PT, while predicted woody where the reference leaf identifies benchmark-labelled leaf points that were assigned woody labels by PT.
Substantial differences in vertical wood-foliar semantic composition were evident among the benchmark datasets (Figure 13). TLS plots exhibited the strongest leaf dominance, with foliage comprising most canopy layers (Figure 13a). In contrast, Lin3D, Tropical Tree, and LeWoS contained substantially larger woody fractions throughout much of their vertical domains, reflecting the predominance of stems and branches and the reduced influence of understory vegetation and surface fuels (Figure 13b–d). Across all benchmarks, PT closely reproduced the dominant vertical distribution of woody material. Predicted woody fractions closely followed the benchmark-derived profiles, while woody agreement remained high throughout most height intervals. The strongest correspondence was observed for the Tropical Tree and LeWoS benchmarks, where predicted and reference woody profiles were nearly coincident across extensive portions of the canopy (Figure 13c,d). Likewise, the major transitions between wood-dominated and leaf-dominated strata were consistently preserved across all datasets, demonstrating that PT effectively reconstructed the overall vertical organization of forest fuels despite substantial differences in canopy architecture and structural complexity.
The predicted woody component, where the reference leaf profile provides additional insight into the origin of prediction disagreement. Across all benchmarks, this component remained comparatively small throughout most height intervals, indicating that woody predictions assigned to benchmark-labelled leaf regions constituted only a minor fraction of the total point distribution. Localized departures from this near-zero baseline were primarily confined to canopy transition zones, particularly within TLS plots, the Tropical Tree, and parts of the Lin3D benchmarks, where predicted woody fractions exceeded the reference profile.
3.7. Species-Specific Quantitative Analysis
Species-specific evaluation revealed consistently balanced wood-foliar semantics across six benchmark tree species/genera, although measurable differences were observed among species (Figure 14). OA remained remarkably stable, ranging from 0.91 to 0.95, while MF1 varied between 0.84 and 0.91. Similarly, mIoU ranged from 0.74 to 0.84, indicating relatively consistent performance despite substantial variation in species composition, canopy structure, and wood–foliar distributions. The uniformly high OA and LF1 values across all species further demonstrate that the PT generalized effectively across diverse temperate forest conditions.
Among the evaluated species, SMaple achieved the highest overall performance, with OA, MF1, and mIoU values of 95.5, 90.6, and 83.5, respectively (Figure 14e). SMaple also produced the highest LF1 value (97.4) while maintaining strong wood-specific performance (WF1 = 83.8, WP = 82.0, WR = 85.7) and the highest MCC (81.2) among all species. LPine exhibited comparable performance, achieving OA of 90.6, mIoU of 79.7, WF1 of 83.6, and MCC of 77.1 (Figure 14a). RPine and SPine similarly maintained high overall performance, with OA values of 92.6 and 91.0, mIoU values of 79.4 and 77.6, and MCC values of 76.1 and 74.2, respectively (Figure 14b,c). These results indicate that PT remained highly effective across multiple conifer species despite differences in canopy organization and branching patterns.
Greater variability was observed within wood-specific metrics than in overall accuracy metrics. NSpruce and TAspen produced the lowest mIoU values (75.0 and 73.6, respectively) and correspondingly lower wood-specific performance (Figure 14d,f). For NSpruce, both WP (72.6) and WR (77.3) were reduced relative to the other species, resulting in a WF1 of 74.9 and an MCC of 69.8. TAspen exhibited the lowest overall wood performance, with WP, WR, and WF1 declining to 73.4, 73.1, and 73.3, respectively, together with the lowest MCC (67.6). In contrast, LPine, SPine, and SMaple maintained comparatively high WR values (85.6, 86.0, and 85.7, respectively), indicating strong recovery of wood structures. Notably, SPine exhibited relatively high WR (86.0) but lower WP (74.1), suggesting that wood structures were frequently detected but accompanied by increased commission errors. Conversely, RPine showed slightly higher WP (82.0) than WR (79.3), indicating a more conservative classification pattern.
3.8. Quantitative Analysis Across Species Vertical Stratum
To further assess framework robustness across contrasting canopy architectures, species-specific vertical performance profiles and wood agreement distributions were evaluated for all six TLS benchmark species (Figure 15). Across species, performance showed a consistent height-dependent pattern, increasing rapidly from lower canopy regions, peaking within lower- to mid-canopy strata, and declining toward canopy tops. WF1, WP, and WR generally exceeded 0.80 across most of the canopy profile, indicating robust wood–leaf separation across diverse crown architectures. Similar to the overall benchmark-level analysis (Figure 12), the largest performance reductions occurred in upper-canopy regions where fine branches and dense foliage increased structural ambiguity.
Species-level differences were primarily expressed in the magnitude of upper-canopy degradation. SMaple maintained the most stable performance throughout the canopy profile (Figure 15e), whereas LPine, RPine, and SPine showed strong lower- and mid-canopy agreement followed by moderate declines above ~0.75 relative height (Figure 15a–c). In contrast, NSpruce and TAspen exhibited the strongest upper-canopy reductions, particularly in wood recall above ~0.70–0.80 relative height (Figure 15d, f). Across all species, the divergence between wood precision and recall increased toward canopy tops, indicating that performance reductions were primarily driven by reduced recovery of fine wood components rather than increased commission errors. Overall, these results demonstrate strong cross-species transferability, with most performance differences confined to structurally complex upper-canopy environments.
The genus-specific wood agreement profiles further evaluated the ability of PT to preserve the vertical distribution of wood material across contrasting canopy architectures (Figure 16). Consistent with the benchmark-level analysis (Figure 13), the predicted wood profiles closely followed the reference wood distributions across all species, indicating that the dominant vertical organization of wood material was largely preserved. The strongest agreement generally occurred within canopy regions containing the highest wood abundance, where the reference, predicted, and agreement profiles remained tightly aligned. Species differed primarily in the shape and vertical extent of their wood distributions. LPine and RPine showed pronounced wood peaks concentrated in lower- to mid-canopy strata, whereas SPine and TAspen exhibited broader wood distributions extending across larger portions of the canopy profile (Figure 16a–c, f). In contrast, NSpruce and SMaple maintained comparatively lower wood fractions throughout most height intervals, although the agreement between prediction and reference remained consistently high (Figure 16d, e).
Disagreement profiles remained comparatively small across all species and were largely confined to localized canopy regions rather than distributed systematically throughout the profile. These departures were most evident where predicted wood fractions exceeded reference wood fractions while maintaining strong overall agreement, suggesting that a portion of the mismatch may reflect localized benchmark labeling uncertainty or conservative annotation of fine wood components rather than persistent model overprediction.
3.9. Cross-Dataset Transferability and Structural Validation
The vertical performance profiles (Figure 12) are strongly supported by the qualitative assessment of benchmark vs. PT wood-foliar semantics (Figure 17, Figure 18 and Figure 19), revealing how segmentation behavior changes along the canopy profile and across structural complexity gradients. In the tropical benchmark (Figure 17), PT maintained consistently high wood recall (WR > 0.80) through most of the canopy (Figure 12c), which is visually evident from the strong preservation of internal branch architecture and continuous wood skeletons in both lateral and bottom-up views (Figure 17b, e). The probability maps further show high confidence across crown interiors, indicating that most wood elements, including fine branches, were successfully retained (Figure 17c, f). However, the moderate decline in wood WP and WF1 in the upper crown corresponds to regions where the model recovered additional fine wood structures that appear absent or incompletely annotated in the benchmark reference, suggesting that part of the apparent error may reflect annotation incompleteness (see white square-boxes in Figure 17a-f) rather than model inability to segment the wood and leaf in particular performance differences with lower validation metrics in extreme lower i.e., surface wood and top of the canopy are indicative the human labelling in these regions found to be challenging and model performed better than labelling efforts.
A similar trend is observed in the LeWoS benchmark (Figure 18), where PT reproduced the dominant trunk and major branch framework with strong structural continuity. This agrees with the relatively stable WF1 and WR profiles up to approximately 80% relative height (Figure 12d). The bottom-up views particularly reveal denser and more connected branch networks in the predictions compared with the benchmark annotations, especially in inner crown regions where occlusion and fine twig complexity are greatest (Figure 18 e-h). The sharper decline in WP near the uppermost canopy aligns with these visually recovered fine branches, again indicating that additional predicted wood structures may exceed the annotation granularity of the reference data. For that reason, overall predicted wood semantics often overestimated wood compared with the reference wood profile (Figure 13). Collectively, the vertical profiles and visual inspections suggest that PT preserves wood continuity across the full vertical fuel profile while exhibiting greater sensitivity to small-diameter branches and internal crown wood elements than the benchmark annotations.
The vertical performance profiles of the Lin3D benchmark (Figure 12b) are strongly supported by the qualitative comparison between benchmark and PT semantics (Figure 19), revealing how segmentation behavior changes across canopy strata and structural complexity gradients. PT maintained consistently high wood recall (WR > 0.80) and wood precision (WP > 0.80) throughout most of the vertical profile, while wood F1 and mIoU remained above 0.80 over a large portion of the canopy (Figure 12b). This strong agreement is qualitatively evident, where the dominant stems, major branches, and canopy foliage are consistently preserved (Figure 19a,b).
In contrast, performance degradation was concentrated within the lower understory and upper-canopy transition zones. The reduction in mIoU, WF1, and WR above approximately 80% relative height (Figure 12b) coincides with highly fragmented branch networks and dense crown interfaces, where fine woody structures become increasingly sparse. Similarly, lower agreement within the near-ground region corresponds to understory vegetation, woody shrubs, and surface fuels, where semantic boundaries between wood, foliage, and lower objects become inherently ambiguous. These patterns are clearly illustrated in (Figure 19c, d), where PT consistently identifies woody structures within regions annotated as lower objects or foliage in the benchmark dataset (black circles).
Importantly, the localized disagreement observed in Figure 19 is not uniformly distributed throughout the canopy but is concentrated within structurally complex transition zones. The simultaneous decline in wood precision and recall in these regions suggests that part of the apparent segmentation error originates from semantic ambiguity and annotation uncertainty rather than systematic model failure.
3.10. Qualitative Assessment of Transferability Across Heterogeneous Forest Ecosystems
To further evaluate the qualitative performance of the proposed framework, the PT was applied to a large registered multi-scan TLS dataset acquired in an Australian eucalypt forest (Figure 20). The complete 180 × 160 m plot (Figure 20a) demonstrates successful semantic segmentation over a large forest scene, while the extracted transect (Figure 20b) provides a continuous side view extending from the plot center toward the outer boundary. Enlarged examples from the high-density central region (Figure 20c), intermediate region (Figure 20d), and lower-density outer edge (Figure 20e) show that the model consistently preserved the principal stems, branches, and foliar components throughout the plot. Although fine-scale structural detail gradually decreased toward the plot boundary where point density was substantially reduced, the overall wood–leaf semantics remained spatially coherent across the registered multi-scan dataset, demonstrating stable performance under substantial spatial variations in sampling density.
Qualitative comparison with the BlueCat dataset further illustrates systematic differences between the manually annotated labels and the PT semantics (Figure 21). Relative to the reference labels (Figure 21a), the PT identified substantially more woody points throughout the forest scene, particularly within tree crowns, fine branches, and understory vegetation (Figure 21c). Enlarged canopy regions (Figure 21b,d) show that many fine branches labeled as foliage in reference were predicted as wood by the PT, resulting in a denser and more continuous woody representation. Similar differences are evident within the understory (Figure 21e, f), where a substantially greater number of fine-scale branches of seedlings and saplings were detected by PT (Figure 21e) compared with benchmark annotations (Figure 21f). Further enlargement (Figure 21g, h) highlights these differences at the individual branch level. The corresponding leaf-probability map (Figure 21i) demonstrates that the additional woody predictions are accompanied by consistently low leaf probabilities, indicating that these predictions were produced with high model confidence.
The Wytham Woods (UK) TLS dataset (Figure 22) provided an additional qualitative assessment under a leaf-off condition [37]. Leaf-off phenology exposed densely interconnected wood architecture while substantially reducing foliar returns, resulting in a strongly wood-dominated class distribution that has long been recognized as challenging for LiDAR-based forest segmentation because intertwined branches increase structural ambiguity and reduce separability [84].
Despite the substantial structural variation and pronounced class imbalance, with woody components dominating the Wytham Woods (Figure 22a) in contrast to the foliar-dominated training dataset (Figure 4a,b), PT consistently identified stems, major branches, and fine woody structures while simultaneously preserving the limited remaining foliar semantic class (Figure 22a,b). This result indicates that the learned geometric representations remained robust under contrasting seasonal and phenological conditions. The enlarged views further demonstrate coherent delineation of intricate branch networks and clear separation between wood-foliar semantics, with minimal evidence of semantic confusion despite the sparse leaf cover (Figure 22c). In particular, PT successfully recovered fine branches and crown connectivity that remained visually distinct from the residual foliage, as shown for understory leaf-on and leaf-off seedlings and saplings (see square boxes in Figure 22c). This shows that model transferability was not compromised by the substantial seasonal shift in canopy composition and class proportions on which the PT was trained (Figure 4).
The Wytham Woods dataset was completely excluded from both training and validation, providing an independent qualitative assessment of model transferability under leaf-off conditions. Wytham Woods benchmark has extensively been evaluated for instance segmentation and largely remained unexplored for semantic segmentation [37,75,76].
3.11. 3D Fuels Wildfire Fuel Mapping
The PT wood–foliar semantics were subsequently processed using a geometric post-processing framework, termed “Points2woodyseg”, to derive wildland fuel-oriented classification (Figure 23). Points2WoodySeg is presented only to demonstrate the downstream applicability of the proposed DL wood-foliar semantic segmentation framework; its methodology is beyond the scope of the present study.
Points2woodyseg – the algorithm operates on the structurally simplified wood and ground components (Figure 23a), where the wood points are first normalized relative to the ground and then used for stem detection. Once stem structures are identified, the algorithm uses the geometric relationships between ground and stems as reference constraints to further decompose the remaining wood points into ecologically relevant classes such as stem, branches, leaf, surface wood debris, and surface foliage (Figure 23b). This hierarchical strategy leverages the stable geometric properties of wood structures as a foundation for downstream structural decomposition, thereby reducing semantic complexity and providing an alternative pathway to conventional end-to-end multi-class DL segmentation (Figure 23b).
3.11.1. Multi-Class Fuel Decomposition Benchmark Assessment
To further evaluate whether the wood-foliar semantics retained sufficient structural fidelity for ecologically meaningful fuel decomposition, the wood predictions generated by PT (Figure 23a) were subsequently processed using the Points2woodyseg geometric algorithm (Figure 23b) and evaluated against an independently annotated benchmark (Table 2) containing stem, branch, and leaf classes (Figure 24).
The vertical class profiles revealed strong overall correspondence between predicted and reference structural distributions throughout the canopy following PT-based wood–leaf segmentation and subsequent geometric decomposition (Figure 24a,b). Predicted class fractions closely followed the benchmark distributions across both wood and foliar semantics. The strongest agreement occurred within the lower and middle canopy, where stems and major branch structures dominate, whereas all class fractions progressively declined toward the upper crown where foliage became increasingly dominant. These decomposition patterns remain consistent with the wood–foliar semantics segmentation performance observed across the benchmark evaluations in Section 3.5, Section 3.6 and Section 3.7.
Stem segmentation achieved the highest overall performance, with P = 0.96, R = 0.99, F1 = 0.98, and IoU = 0.96, demonstrating near-complete detection of stems by the geometric framework (Points2woodyseg). Leaf segmentation also remained robust, with P = 0.91, R = 0.93, F1 = 0.92, and IoU = 0.85. In contrast, branch segmentation showed substantially lower agreement (P = 0.54, R = 0.51, F1 = 0.52, IoU = 0.36), indicating that branch-level lower accuracy is associated with the combined effect of uncertainty in benchmark annotations (Figure 25) and PT wood-foliar semantics (Figure 24a).
The omission and commission analysis further supports this pattern (Figure 24c, d). Importantly, the near-symmetrical branch omission (0.49) and commission (0.46) errors, together with the localized vertical offsets between predicted and reference branch fractions in the mid-crown transition zone (black-box region in Figure 24a), indicate that the total branch point budget remained broadly comparable but differed in its precise spatial allocation. Collectively, these results indicate that branch disagreement largely reflects fine-scale spatial ambiguity in wood–leaf semantics rather than Points2woodyseg algorithm failure.
4. Discussion
4.1. Probabilistic-Based Qualitative Evaluation of Model Error Propagation
We thoroughly investigated the disagreement between benchmark annotations and PT wood- leaf semantics using leaf continuous probabilistic maps generated by PT. Figure 26 provides additional insight into the nature of the remaining discrepancies between benchmark annotations and PT semantics. Unlike traditional segmentation, continuous leaf-probability predictions preserve semantic confidence information, allowing semantic uncertainty to be ascertained beyond the threshold-based binary wood-foliar semantics (Figure 26b,g). Across BlueCat and TUWIEN datasets, disagreement was highly localized rather than randomly distributed, occurring predominantly within densely occluded understories, canopy interiors, and fine-scale branch networks (Figure 26c–j). In these regions, the model consistently assigned low leaf probabilities to visually continuous fine branches that were annotated as foliage or remained unlabeled in the benchmark datasets (Figure 26, d, e, i, j). On the contrary, disagreement was insignificant for stems and larger branches, where predictions and reference annotations showed almost complete agreement (Figure 26, d, e). Similar relationships were observed in the BlueCat, where the wood–foliar semantics revealed additional fine branches, seedlings, and saplings that were absent from the benchmark annotations (Figure 26b,d,e–h). Comparable observations were evident for the Tropical Tree and LeWoS datasets, where PT consistently recovered more intertwined fine-scale branch architecture, particularly within densely obscured inner canopies (Figure 17 and Figure 18).
These qualitative observations closely correspond with the quantitative height-dependent analyses presented in Figure 12 and Figure 15. Across all benchmark datasets, segmentation performance declined primarily toward the lower understory and upper canopy extremes, whereas the mid-canopy remained comparatively stable for overall assessment (Figure 12) and genus-specific analyses (Figure 15). The height intervals coincide with regions exhibiting the greatest structural complexity, strongest obstruction, and highest abundance of fine-scale branches. Notably, the corresponding probability maps frequently retain coherent confidence patterns along visually continuous branch networks, suggesting that the remaining disagreement cannot be attributed exclusively to model failure (Figure 21 g-h). Instead, the combined qualitative and quantitative evidence indicates that part of the measured reduction in benchmark performance originated from the practical limitations of manually annotating point clouds of complex forest environments. Exhaustive point-wise delineation of every small branch is inherently labor-intensive and requires subjective interpretation where wood-foliar semantics are densely intertwined, making some degree of annotation unreachable or significantly challenging (see Figure 17, Figure 18 and Figure 19 and 21).
Owing to space limitations, additional qualitative transferability examples are provided in the Supplementary Material (Figures S1–S3). These include independent inference on the Robson Creek (Figure S1), Plot 2 of the SegmentedForests European beech, MLS point clouds (Figure S2), and the NIBIO MLS dataset (Figure S3), thereby extending the evaluation across contrasting forest ecosystems, stand structures, and terrestrial LiDAR systems (Table 3). Particularly, the SegmentedForests Plot 2 example demonstrates that PT preserves the complex wood-foliar semantics while recovering visually continuous fine branches that are annotated as foliar components in the benchmark. Similarly, the NIBIO MLS probability exhibits spatially coherent confidence patterns with disagreement largely confined to structurally ambiguous wood–foliar transition zones, further supporting the robustness and transferability of the proposed geometry-only framework across independent datasets and MLS acquisitions.
Furthermore, a qualitative example demonstrating the transferability of Points2WoodySeg is provided in the Supplementary Material (Figure S4). Building upon the multi-class decomposition presented in Figure 23, Figure S4 illustrates the application of the framework to Plot 13 of the SegmentedForests benchmark (Oregon, USA), a structurally complex Pinus ponderosa forest characterized by mature trees, dense understory, and complex branch morphologies [68]. Despite these challenging conditions, the framework consistently transformed PT wood–foliar semantics into coherent multi-class representations of stems, branches, leaves, surface foliage, surface woody debris, and woody shrubs, preserving tree architecture and structural continuity of the complete 3-D fuel continuum (Figure 23).
These findings have broader implications for the development of future terrestrial LiDAR benchmarks. Continuous probability predictions provide substantially richer information than hard semantic labels alone by identifying regions of persistent semantic ambiguity while simultaneously highlighting high-confidence predictions (Figure 26 g-i, Figure 26, d, e, i, j). Nevertheless, relying exclusively on explicit manual annotation, probability-guided interactive labeling could concentrate expert review on uncertain regions while accepting high-confidence predictions elsewhere. Such a human-in-the-loop workflow has the potential to substantially reduce annotation effort, improve labeling consistency for fine intertwined branches (Figure 26 d-e), and facilitate the development of larger, more reliable state-of-the-art benchmark datasets for transferable forest LiDAR semantics.
4.2. Comparative Assessment
Recent advances in DL have substantially improved semantic segmentation of forest LiDAR point clouds through increasingly sophisticated network architectures and learning strategies [25,36,79,81]. However, direct comparison of wood-foliar semantics (our study) and published studies remains inherently challenging because benchmark datasets differ in semantic taxonomies, training, evaluation protocols, and annotation strategies [36,37]. Consequently, reported performance reflects not only network capability but also the degree of benchmark-specific optimization and characteristics of reference annotations. To provide a rigorous and unbiased comparison, the present assessment was restricted to overlapping benchmark datasets (Lin3D, Tropical Trees, LeWoS Trees, genus-specific investigations – TLS plots) for quantitative assessment. For that reason, extensive sets of evaluation metrics were derived (Section 2.5.6) and compared with metrics reported by the original authors.
The Tropical Tree benchmark [28] provides the most direct comparison with KPConv, RandLANet, PT, the leaf-wood separation (LeWoS), and graph-based leaf-wood separation (GBS), which adopted identical wood–leaf semantics of trees (n = 148) and were explicitly optimized for the target dataset (Table 6).
Table 6 demonstrates the progressive improvement in wood–foliar semantics on the Tropical Tree benchmark from the traditional GBS (OA = 91.9, mIoU = 79.0), through the LeWoS parametric algorithms (OA = 93.7, mIoU = 82.9) and point-based DL architectures, including RandLA-Net (OA = 95.2, mIoU = 87.9), KPConv (OA = 96.2, mIoU = 89.7), and PT (OA = 96.5, mIoU = 90.7). Nevertheless, the PT (ours) was not trained, validated, or adapted using the Tropical Tree benchmark. Instead, it was evaluated exclusively through frozen cross-dataset inference and achieved OA = 94.09, LeIoU = 92.72, WIoU = 76.11, and mIoU = 84.41 on the unseen Tropical Tree benchmark. On the completely unseen Tropical Tree benchmark, PT outperformed the traditional GBS and LeWoS approaches while maintaining competitive performance relative to DL frameworks. These findings suggest that a substantial proportion of the remaining performance gap reflects differences in evaluation protocol and target-domain optimization rather than limitations of the PT, as target-domain optimized DL frameworks perform better in localized context with limited transferability to an entirely different forest ecosystem.
Lin3D represents a complementary validation scenario by evaluating generalization to independent spatial hold-out plots (Table 7). In comparison, multi-platform synergistic training (MST) [37] addressed the four-class Lin3D semantic taxonomy (ground, lower objects, wood, and foliage), whereas the present study adopted wood–foliar semantics specifically designed to improve semantic consistency across forest ecosystems [36]. Unlike PT, which used only Plot 1 during training (without ground and understory) and evaluated transferability on independent spatial hold-out plots (Plots 2–6), the MST framework followed the original Lin3D v0.1 benchmark split, which includes three training plots, one validation plot, and two test plots [37]. Therefore, the reported metrics should be interpreted descriptively rather than as direct performance rankings because both the semantic taxonomy and evaluation protocols differ substantially. In particular, the proposed PT performed wood–foliar segmentation on complete forest plots containing canopy, understory, and transitional vegetation layers, which constitutes a more demanding task than the simplified four-class segmentation framework illustrated in Figure 19c–d. Despite these differences, PT achieved a lower OA (91.82 vs. 94.76) but higher mean accuracy (90.01 vs. 85.59) and mean Intersection over Union (83.40 vs. 79.48) than MST (Table 7). It is important to note that the original study reported only a limited set of evaluation metrics for the TLS-based Lin3D v0.1 benchmark, with particular emphasis placed on Lin3D v0.2, which consists of unpiloted laser scanning (ULS) data [37]. Nevertheless, the class-level confusion metric reported for Lin3D v0.1 reveals substantial variability among semantic categories, with IoU values of 95.91 for ground, 49.70 for lower objects, 84.28 for wood, and 88.02 for foliage. Furthermore, Sen-Net [36] employed an evaluation strategy similar to MST but focused primarily on the Lin3D v0.2, which consists of ULS data. As the present study evaluates transferable wood–foliar semantics on the TLS-based Lin3D v0.1 benchmark, a direct comparison is not feasible because of differences in acquisition platform and assessment protocol.
More importantly, the present study extends beyond benchmark-level aggregate metrics on entire datasets by quantifying metrics of vertical stratification (Figure 12b) and investigating semantic uncertainty using probabilistic wood–foliar distributions, thereby providing insights into the origin and spatial distribution of residual errors that were not examined by Sen-Net and MST [36,37].
The LeWoS benchmark provides an additional individual tree-level evaluation on highly complex crown architecture (Table 8). Despite the absence of benchmark-specific optimization, the PT achieved higher OA (93.75 vs. 91.0) together with balanced wood recall WR (93.11) and wood specificity (94.02), demonstrating effective transfer to structurally complex forest ecosystems.
4.3. The Rationale of Wood-Foliar Semantic vs. Multi-Class Segmentation
Terrestrial LiDAR semantic segmentation has traditionally relied on multi-class taxonomies that partition forest scenes into categories such as ground, lower vegetation, shrubs, stems, branches, foliage, and CWD [64,81]. Although these taxonomies provide detailed ecological descriptions, they remain benchmark dependent because class definitions, annotation protocols, and ecological objectives differ substantially among datasets [68]. Consequently, identical 3-D structures may receive different semantic labels across benchmarks, limiting direct comparison and reducing transferability.
Evidence from recent DL studies consistently demonstrates that this limitation is concentrated within intermediate structural classes rather than the overall segmentation task [36]. This pattern is well evident in published multi-class semantic investigations in previous studies. For example, on the FOR-Instance benchmark, Xiang et al. (2024) reported that ForAINet achieved a confusion matrix between five semantic categories with 85.6 for low vegetation, 89.2 for ground, 55.3 for stems, 98.3 for live branches (a combined class comprising both woody branches and foliage), and 68.4 for dead branches, i.e., branches without foliage points [79]. Using the Lin3D and similar semantic taxonomy, Lu et al. (2025) reported confusion metrics of 82.1 for low vegetation, 96.2 for ground, 88.0 for wood (stem and branches collectively), and 99.6 for foliage [36]. In the same study, the confusion matrix of the five semantic categories on the FOR-Instance benchmark was ground (87.9), low vegetation (94.9), stem (53.2), live branches (99.5), and woody branches (85.2). The authors attributed this substantially lower accuracy to the strong geometric continuity and spatial proximity between lower objects and the ground surface, making their semantic boundaries inherently ambiguous [36]. The six-class HeliALS benchmark presented by Takhtkeshha et al. (2025) provides an even stronger illustration of this limitation [64]. Using geometric coordinates alone, KPConv achieved confusion matrices of 97.7 for ground and 99.7 for foliage, whereas low vegetation (95.1), trunks (77.7), branches (34.6), and woody debris (92.4). The authors attributed this poor performance to the increasing structural complexity, geometric similarity, and annotation uncertainty associated with progressively smaller branch hierarchies [86].
The proposed wood–foliar formulation therefore does not merely simplify a multi-class problem; it separates physically persistent foliage from application-specific structural interpretations. All woody points are assigned to wood, while photosynthetically active vegetation is assigned to foliage, avoiding the need to impose uncertain boundaries between stems, branch orders, standing deadwood, CWD, FWD, woody shrubs and ladder fuels during DL inference. This rationale is supported by Hanousek et al. (2025), who removed CWD from a pretrained four-class taxonomy because lower branches were frequently confused with CWD or ground and subsequently achieved 96.3 overall accuracy and 97.05 wood-class accuracy using ground–wood–foliage labels [87]. Wood–foliar semantics can thus serve as a transferable intermediate representation, with ecologically specific stems, branches and fuel classes subsequently derived through hierarchical geometric and topological decomposition.
Importantly, the proposed wood–foliar abstraction should not be interpreted as a simplification that sacrifices ecological information. Rather, it establishes a transferable intermediate representation from which higher-order structural classes can subsequently be recovered through geometry-driven post-processing (Objective 3; Figure 23 and Figures 23 and S4). We showed that with PT wood-foliar semantics, the continuous woody skeleton can be hierarchically decomposed into stems, branches, foliage, woody shrubs, coarse and fine woody classes without requiring the DL multi-class semantics to solve an increasingly ambiguous multi-class problem directly (Figure 23 and Figures 23 and S4). This decoupling of semantic recognition from structural decomposition enables the network to learn transferable material classes while deterministic geometric algorithms exploit spatial topology to derive application-specific structural products. Consequently, the framework provides a unified semantic foundation for wildfire fuel characterization, quantitative structural modeling (QSM), AGB estimation, forest inventory, and leaf-off structural analysis across diverse forest ecosystems.
Recent studies have demonstrated that terrestrial TLS LiDAR point clouds can be voxelized and converted into 3-D fuel semantics suitable for physics-based fire behavior models, including the Wildland–Urban Interface Fire Dynamics Simulator (WFDS), QUIC-Fire, and the Fire Dynamics Simulator (FDS), thereby enabling explicit characterization of fuel continuity and vertical fuel structure [85]. However, the semantic decomposition required to distinguish surface, ladder, canopy, woody, and foliar fuels remains a major bottleneck for operational fire simulations [68,88].
Previous studies have highlighted that semantic segmentation of forest point clouds is fundamentally constrained by structural overlap, occlusion, and semantic ambiguity among lower vegetation, woody debris, branches, and understory [88,89,90]. Consequently, most existing studies remain limited to laboratory settings [91], individual trees, or simplified fuel representations [92], restricting the applicability of TLS-based fire simulations to larger and more heterogeneous forest environments [88]. By preserving transferable wood–foliar semantics and geometric-based decomposition to fuel relevant classes across complete forest plots and diverse forest ecosystems (see Figure 23), the present study provides an important step toward scalable 3-D fuel characterization for next-generation wildfire behavior models [85].
5. Conclusions
This study developed and evaluated a sensor-agnostic DL framework for wood–foliar semantics of terrestrial LiDAR point clouds using harmonized benchmark datasets spanning diverse forest ecosystems, terrestrial LiDAR platforms, acquisition conditions, and structural complexities. By simplifying forest vegetation into two wood-foliar semantics, the proposed framework reduced semantic complexity while preserving the 3-D organization of complex wood-foliar semantics. Among the evaluated architectures, Point Transformer consistently achieved the most accurate and transferable performance across independent benchmark datasets without benchmark-specific optimization, demonstrating robust transferability under cross-dataset inference.
The combined quantitative and qualitative analyses demonstrated that geometry-only DL effectively generalized across multiple forest ecosystems, terrestrial LiDAR platforms, species compositions, and seasonal leaf-on and leaf-off conditions without requiring radiometric, multispectral, or color information. Although performance declined within densely occluded understories, hidden canopy interiors, and fine branch networks, probability-based confidence analyses indicated that a substantial proportion of the remaining disagreement was associated with annotation uncertainty rather than systematic model failure. These findings further demonstrate the value of continuous probability predictions for interpreting semantic uncertainty and improved semantic segmentation. Beyond wood-foliar semantic segmentation, the proposed framework established an effective foundation for hierarchical structural fuel characterization. Binary wood–foliar predictions preserved sufficient geometric information for subsequent decomposition into stems, branches, canopy foliage, woody debris, and surface fuels while avoiding the complexity associated with direct multi-class semantic segmentation. Collectively, these findings establish binary wood–foliar semantic segmentation as a robust and transferable representation for terrestrial LiDAR analysis and provide a practical pathway toward operational 3-D wildfire fuel mapping, structural fuel continuity assessment, forest inventory, AGB estimation, and broader digital forestry applications.
Supplementary Materials
The following supporting information can be downloaded at: Preprints.org.
Author Contributions
Conceptualization, N.F.; methodology, N.F.; software, N.F.; validation, N.F.; formal analysis, N.F.; investigation, N.F.; resources, S.J.P. and C.A.S.; data curation, N.F., S.J.P., and C.A.S.; writing—original draft preparation, N.F.; writing—review and editing, A.J.G., S.J.P., A.T.J., C.A.S., J.X., and C.I.A.D.; visualization, N.F. and J.X.; supervision, C.A.S. and S.J.P.; project administration, C.A.S.; funding acquisition, S.J.P. and, C.A.S. All authors have read and agreed to the published version of the manuscript.
Funding
This research was funded by the Strategic Environmental Research and Development Program (SERDP) and the Environmental Security Technology Certification Program (ESTCP) – FuelsCraft: An innovative wildland fuel mapping tool for prescribed fire decision support on Department of Defense (DoD) military installations (#RC23-7779).
Data Availability Statement
Data will be made available upon request from the corresponding author.
Conflicts of Interest
The authors declare no conflict of interest. The funders had no role in the design of the study; analysis or interpretation of data; in the writing of the manuscript; or in the decision to publish the results.
Acknowledgments
Generative AI: ChatGPT (https://chatgpt.com/, accessed on 15 July 2026) and Perplexity AI (https://www.perplexity.ai/, accessed on 15 July 2026) were used to validate open-access datasets, acronyms, and referenced articles. Grammarly (https://app.grammarly.com/, accessed on 15 July 2026) was used to fix typographical and grammatical errors.
References
- Hartley, R.J.L.; Jayathunga, S.; Morgenroth, J.; Pearse, G.D. Tree Branch Characterisation from Point Clouds: a Comprehensive Review. Curr. For. Rep. 2024, 10, 360–385. [Google Scholar] [CrossRef]
- Alonso-Rego, C.; Arellano-Pérez, S.; Cabo, C.; Ordoñez, C.; Álvarez-González, J.G.; Díaz-Varela, R.A.; Ruiz-González, A.D. Estimating Fuel Loads and Structural Characteristics of Shrub Communities by Using Terrestrial Laser Scanning. Remote Sens. 2020, 12. [Google Scholar] [CrossRef]
- Kulicki, M.; Cabo, C.; Trzcinski, T.; Bedkowski, J.; Sterenczak, K. Artificial Intelligence and Terrestrial Point Clouds for Forest Monitoring. Curr. Rep. 2025, 11, 5. [Google Scholar] [CrossRef] [PubMed]
- Zhao, C.; Fei, S.; Habib, A. Integrated scan simultaneous trajectory enhancement and mapping (IS2-TEAM) for fine resolution forest inventory using backpack LiDAR. Remote Sens. Environ. 2026, 334. [Google Scholar] [CrossRef]
- Shao, J.; Lin, Y.-C.; Wingren, C.; Shin, S.-Y.; Fei, W.; Carpenter, J.; Habib, A.; Fei, S. Large-scale inventory in natural forests with mobile LiDAR point clouds. Sci. Remote Sens. 2024, 10. [Google Scholar] [CrossRef]
- Kaijaluoto, R.; Kukko, A.; El Issaoui, A.; Hyyppä, J.; Kaartinen, H. Semantic segmentation of point cloud data using raw laser scanner measurements and deep neural networks. ISPRS Open J. Photogramm. Remote Sens. 2022, 3, 100011. [Google Scholar] [CrossRef]
- Wilson, N.; Bradstock, R.; Bedward, M. Influence of fuel structure derived from terrestrial laser scanning (TLS) on wildfire severity in logged forests. J. Env. Manag. 2022, 302, 114011. [Google Scholar] [CrossRef] [PubMed]
- Rowell, E.; Loudermilk, E.L.; Hawley, C.; Pokswinski, S.; Seielstad, C.; Queen, L.; O’Brien, J.J.; Hudak, A.T.; Goodrick, S.; Hiers, J.K. Coupling terrestrial laser scanning with 3D fuel biomass sampling for advancing wildland fuels characterization. For. Ecol. Manag. 2020, 462. [Google Scholar] [CrossRef]
- Xi, Z.; Chasmer, L.; Hopkinson, C. Delineating and Reconstructing 3D Forest Fuel Components and Volumes with Terrestrial Laser Scanning. Remote Sens. 2023, 15. [Google Scholar] [CrossRef]
- Hall, S.A.; Burke, I.C. Considerations for characterizing fuels as inputs for fire behavior models. For. Ecol. Manag. 2006, 227, 102–114. [Google Scholar] [CrossRef]
- Hui, Z.; Jin, S.; Xia, Y.; Wang, L.; Yevenyo Ziggah, Y.; Cheng, P. Wood and leaf separation from terrestrial LiDAR point clouds based on mode points evolution. ISPRS J. Photogramm. Remote Sens. 2021, 178, 219–239. [Google Scholar] [CrossRef]
- Ruoppa, L.; Oinonen, O.; Taher, J.; Lehtomäki, M.; Takhtkeshha, N.; Kukko, A.; Kaartinen, H.; Hyyppä, J. Unsupervised deep learning for semantic segmentation of multispectral LiDAR forest point clouds. ISPRS J. Photogramm. Remote Sens. 2025, 228, 694–722. [Google Scholar] [CrossRef]
- Xu, X.; Iuricich, F.; Calders, K.; Armston, J.; De Floriani, L. Topology-based individual tree segmentation for automated processing of terrestrial laser scanning point clouds. Int. J. Appl. Earth Obs. Geoinf. 2023, 116. [Google Scholar] [CrossRef]
- Wilkes, P.; Disney, M.; Armston, J.; Bartholomeus, H.; Bentley, L.; Brede, B.; Burt, A.; Calders, K.; Chavana-Bryant, C.; Clewley, D.; et al. TLS2trees: A scalable tree segmentation pipeline forTLSdata. Methods Ecol. Evol. 2023, 14, 3083–3099. [Google Scholar] [CrossRef]
- Xi, Z.; Hopkinson, C.; Chasmer, L. Supervised terrestrial to airborne laser scanner model calibration for 3D individual-tree attribute mapping using deep neural networks. ISPRS J. Photogramm. Remote Sens. 2024, 209, 324–343. [Google Scholar] [CrossRef]
- Grilli, E.; Menna, F.; Remondino, F. A review of point clouds segmentation and classification algorithms. Int. Arch. Photogramm. Remote Sens. Spat. Inf. Sci. 2017, 42, 339–344. [Google Scholar] [CrossRef]
- Fareed, N.; Silva, C.A.; Numata, I.; Flores, J.P. Interdisciplinary Applications of LiDAR in Forest Studies: Advances in Sensors, Methods, and Cross-Domain Metrics. Remote Sens. 2026, 18, 219. [Google Scholar] [CrossRef]
- Viedma, O.; Moreno, J.M. Impact of LiDAR pulse density on forest fuels metrics derived using LadderFuelsR. Ecol. Inform. 2025, 88. [Google Scholar] [CrossRef]
- Wan, P.; Shao, J.; Jin, S.; Wang, T.; Yang, S.; Yan, G.; Zhang, W. A novel and efficient method for wood–leaf separation from terrestrial laser scanning point clouds at the forest plot level. Methods Ecol. Evol. 2021, 12, 2473–2486. [Google Scholar] [CrossRef]
- Ferrara, R.; Virdis, S.G.P.; Ventura, A.; Ghisu, T.; Duce, P.; Pellizzaro, G. An automated approach for wood-leaf separation from terrestrial LIDAR point clouds using the density based clustering algorithm DBSCAN. Agric. For. Meteorol. 2018, 262, 434–444. [Google Scholar] [CrossRef]
- Vicari, M.B.; Disney, M.; Wilkes, P.; Burt, A.; Calders, K.; Woodgate, W.; Freckleton, R. Leaf and wood classification framework for terrestrial LiDAR point clouds. Methods Ecol. Evol. 2019, 10, 680–694. [Google Scholar] [CrossRef]
- Xia, J.; Martin, T.A.; Peter, G.F.; Brock, K.M.; Atkins, J.W.; Gitzendanner, M.A.; Bueno, I.; Calders, K.; Corte, A.P.D.; Hudak, A.T.; et al. Combined impact of semantic segmentation and quantitative structure modelling of Southern pine trees using terrestrial laser scanning. Sci. Rep. 2025, 15, 24427. [Google Scholar] [CrossRef] [PubMed]
- Wang, D. Unsupervised semantic and instance segmentation of forest point clouds. ISPRS J. Photogramm. Remote Sens. 2020, 165, 86–97. [Google Scholar] [CrossRef]
- Chen, S.; Verbeeck, H.; Terryn, L.; Van den Broeck, W.A.J.; Vicari, M.B.; Disney, M.; Origo, N.; Wang, D.; Xi, Z.; Hopkinson, C.; et al. The impact of leaf-wood separation algorithms on aboveground biomass estimation from terrestrial laser scanning. Remote Sens. Environ. 2025, 318. [Google Scholar] [CrossRef]
- Xi, Z.; Hopkinson, C.; Rood, S.B.; Peddle, D.R. See the forest and the trees: Effective machine and deep learning algorithms for wood filtering and tree species classification from terrestrial laser scanning. ISPRS J. Photogramm. Remote Sens. 2020, 168, 1–16. [Google Scholar] [CrossRef]
- Dong, Y.; Ma, Z.; Xu, F.; Chen, F. Unsupervised Semantic Segmenting TLS Data of Individual Tree Based on Smoothness Constraint Using Open-Source Datasets. IEEE Trans. Geosci. Remote Sens. 2022, 60, 1–15. [Google Scholar] [CrossRef]
- Esmorís, A.M.; Weiser, H.; Winiwarter, L.; Cabaleiro, J.C.; Höfle, B. Deep learning with simulated laser scanning data for 3D point cloud classification. ISPRS J. Photogramm. Remote Sens. 2024, 215, 192–213. [Google Scholar] [CrossRef]
- Van den Broeck, W.A.J.; Terryn, L.; Chen, S.; Cherlet, W.; Cooper, Z.T.; Calders, K. Pointwise deep learning for leaf-wood segmentation of tropical tree point clouds from terrestrial laser scanning. ISPRS J. Photogramm. Remote Sens. 2025, 227, 366–382. [Google Scholar] [CrossRef]
- Wang, P.; Yao, W.; Shao, J.; He, Z. Test-time adaptation for geospatial point cloud semantic segmentation with distinct domain shifts. ISPRS J. Photogramm. Remote Sens. 2025, 229, 422–435. [Google Scholar] [CrossRef]
- Pehkonen, M.; Vastaranta, M.; Hyyppä, J.; Pyörälä, J. Segmentation of living and dead tree crowns using terrestrial laser scanning and deep learning. Ecol. Inform. 2026, 95, 103750. [Google Scholar] [CrossRef]
- Xiang, B.; Wielgosz, M.; Puliti, S.; Král, K.; Krůček, M.; Missarov, A.; Astrup, R. Forestformer3d: A unified framework for end-to-end segmentation of forest lidar 3d point clouds. In Proceedings of the Proceedings of the IEEE/CVF International Conference on Computer Vision, 2025; pp. 24717–24727. [Google Scholar]
- Terryn, L.; Calders, K.; Åkerblom, M.; Bartholomeus, H.; Disney, M.; Levick, S.; Origo, N.; Raumonen, P.; Verbeeck, H. Analysing individual 3D tree structure using the R package ITSMe. Methods Ecol. Evol. 2022, 14, 231–241. [Google Scholar] [CrossRef]
- Luo, X.; Tian, X.; Liang, X.; Mokros, M.; Chai, G.; Li, Z.; Guo, Y.; Yang, Y.; Pang, Y.; Wang, Y.; et al. Cognition-inspired multimodal attention fusion of close-range laser scanning data for globally representative tree species classification. Remote Sens. Environ. 2026, 335, 115269. [Google Scholar] [CrossRef]
- Van den Broeck, W.A.J.; Terryn, L.; Cherlet, W.; Cooper, Z.T.; Calders, K. Three-Dimensional Deep Learning for Leaf-Wood Segmentation of Tropical Tree Point Clouds. Int. Arch. Photogramm. Remote Sens. Spat. Inf. Sci. 2023, XLVIII-1/W2-2023, 765–770. [Google Scholar] [CrossRef]
- Krisanski, S.; Taskhiri, M.S.; Gonzalez Aracil, S.; Herries, D.; Muneri, A.; Gurung, M.B.; Montgomery, J.; Turner, P. Forest Structural Complexity Tool—An Open Source, Fully-Automated Tool for Measuring Forest Point Clouds. Remote Sens. 2021, 13, 4677. [Google Scholar] [CrossRef]
- Lu, H.; Li, B.; Yang, G.; Fan, G.; Wang, H.; Pang, Y.; Wang, Z.; Lian, Y.; Xu, H.; Huang, H. Towards a point cloud understanding framework for forest scene semantic segmentation across forest types and sensor platforms. Remote Sens. Environ. 2025, 318. [Google Scholar] [CrossRef]
- Jiang, J.; Shen, Y.; Wang, J.; Kissling, W.D.; Hollaus, M.; Su, H.; Wang, J.; Ferreira, V.; Pfeifer, N. Cross-platform forest understanding: A multi-platform synergistic training framework for generalized forest point cloud segmentation. Remote Sens. Environ. 2026, 342, 115467. [Google Scholar] [CrossRef]
- Oviedo de la Fuente, M.; Cabo, C.; Roca-Pardiñas, J.; Loudermilk, E.L.; Ordóñez, C. 3D Point Cloud Semantic Segmentation Through Functional Data Analysis. J. Agric. Biol. Environ. Stat. 2023, 29, 723–744. [Google Scholar] [CrossRef]
- Cherlet, W.; Dayal, K.; Chen, S.; Cooper, Z.; Disney, M.; Hanzl, A.; Levick, S.; Nightingale, J.; Origo, N.; Senf, C.; et al. Benchmarking tree instance segmentation of terrestrial laser scanning point clouds. ISPRS J. Photogramm. Remote Sens. 2026, 231, 230–247. [Google Scholar] [CrossRef]
- Arrizza, S.; Marras, S.; Ferrara, R.; Pellizzaro, G. Terrestrial Laser Scanning (TLS) for tree structure studies: a review of methods for wood-leaf classifications from 3D point clouds. Remote Sens. Appl. Soc. Environ. 2024, 36. [Google Scholar] [CrossRef]
- Comesaña-Cebral, L.; Martínez-Sánchez, J.; Suárez-Fernández, G.; Arias, P. Wildfire response of forest species from multispectral LiDAR data. A deep learning approach with synthetic data. Ecol. Inform. 2024, 81. [Google Scholar] [CrossRef]
- Brown, L.A.; Kadhim, I.; Danson, F.M. Leaf-wood classification of terrestrial laser scanning data with co-registered near-infrared photography. Methods Ecol. Evol. 2025, 16, 1425–1436. [Google Scholar] [CrossRef]
- Dai, W.; Jiang, Y.; Zeng, W.; Chen, R.; Xu, Y.; Zhu, N.; Xiao, W.; Dong, Z.; Guan, Q. MDC-Net: a multi-directional constrained and prior assisted neural network for wood and leaf separation from terrestrial laser scanning. Int. J. Digit. Earth 2023, 16, 1224–1245. [Google Scholar] [CrossRef]
- Ottmar, R.D.; Sandberg, D.V.; Prichard, S.J.; Riccardi, C.L. Fuel characteristic classification system. In Proceedings of the Presentation at the 2nd International Wildland Fire Ecology and Fire Management Congress, 2003; Available online: http://ams.
- Scott, J.H. Assessing crown fire potential by linking models of surface and crown fire behavior; US Department of Agriculture, Forest Service, Rocky Mountain Research Station, 2001. [Google Scholar]
- Lefsky, M.A.; Cohen, W.B.; Parker, G.G.; Harding, D.J. Lidar Remote Sensing for Ecosystem Studies: Lidar, an emerging remote sensing technology that directly measures the three-dimensional distribution of plant canopies, can accurately estimate vegetation structural attributes and should be of particular interest to forest, landscape, and global ecologists. BioScience 2002, 52, 19–30. [Google Scholar] [CrossRef]
- Le Toan, T.; Quegan, S.; Davidson, M.W.J.; Balzter, H.; Paillou, P.; Papathanassiou, K.; Plummer, S.; Rocca, F.; Saatchi, S.; Shugart, H.; et al. The BIOMASS mission: Mapping global forest biomass to better understand the terrestrial carbon cycle. Remote Sens. Environ. 2011, 115, 2850–2860. [Google Scholar] [CrossRef]
- Jucker, T.; Gosper, C.R.; Wiehl, G.; Yeoh, P.B.; Raisbeck-Brown, N.; Fischer, F.J.; Graham, J.; Langley, H.; Newchurch, W.; O’Donnell, A.J.; et al. Using multi-platform LiDAR to guide the conservation of the world’s largest temperate woodland. Remote Sens. Environ. 2023, 296. [Google Scholar] [CrossRef]
- Wilson, N.; Bradstock, R.; Bedward, M. Detecting the effects of logging and wildfire on forest fuel structure using terrestrial laser scanning (TLS). For. Ecol. Manag. 2021, 488. [Google Scholar] [CrossRef]
- Forbes, B.; Reilly, S.; Clark, M.; Ferrell, R.; Kelly, A.; Krause, P.; Matley, C.; O’Neil, M.; Villasenor, M.; Disney, M.; et al. Comparing Remote Sensing and Field-Based Approaches to Estimate Ladder Fuels and Predict Wildfire Burn Severity. Front. For. Glob. Change 2022, Volume 5 - 2022. [Google Scholar] [CrossRef]
- Yépez-Rincón, F.D.; Luna-Mendoza, L.; Ramírez-Serrato, N.L.; Hinojosa-Corona, A.; Ferriño-Fierro, A.L. Assessing vertical structure of an endemic forest in succession using terrestrial laser scanning (TLS). Case study: Guadalupe Island. Remote Sens. Environ. 2021, 263. [Google Scholar] [CrossRef]
- Brown, J.K. Handbook for inventorying downed woody material. In Gen. Tech. Rep. INT-16.; US Department of Agriculture, Forest Service, Intermountain Forest and Range Experiment Station: Ogden, UT, 1974; Volume 16. [Google Scholar]
- Monsanto, P.G.; Agee, J.K. Long-term post-wildfire dynamics of coarse woody debris after salvage logging and implications for soil heating in dry forests of the eastern Cascades, Washington. For. Ecol. Manag. 2008, 255, 3952–3961. [Google Scholar] [CrossRef]
- Lydersen, J.M.; Collins, B.M.; Coppoletta, M.; Jaffe, M.R.; Northrop, H.; Stephens, S.L. Fuel dynamics and reburn severity following high-severity fire in a Sierra Nevada, USA, mixed-conifer forest. Fire Ecol. 2019, 15, 43. [Google Scholar] [CrossRef]
- Prichard, S.J.; O’Neill, S.M.; Eagle, P.; Andreu, A.G.; Drye, B.; Dubowy, J.; Urbanski, S.; Strand, T.M. Wildland fire emission factors in North America: synthesis of existing data, measurement needs and management applications. Int. J. Wildland Fire 2020, 29, 132–147. [Google Scholar] [CrossRef]
- Brown, J.K. Coarse woody debris: managing benefits and fire hazard in the recovering forest; US Department of Agriculture, Forest Service, Rocky Mountain Research Station, 2003. [Google Scholar]
- Loudermilk, E.L.; Pokswinski, S.; Hawley, C.M.; Maxwell, A.; Gallagher, M.R.; Skowronski, N.S.; Hudak, A.T.; Hoffman, C.; Hiers, J.K. Terrestrial Laser Scan Metrics Predict Surface Vegetation Biomass and Consumption in a Frequently Burned Southeastern U.S. Ecosystem. Fire 2023, 6, 151. [Google Scholar] [CrossRef]
- Parresol, B.R.; Blake, J.I.; Thompson, A.J. Effects of overstory composition and prescribed fire on fuel loading across a heterogeneous managed landscape in the southeastern USA. For. Ecol. Manag. 2012, 273, 29–42. [Google Scholar] [CrossRef]
- Laino, D.; Cabo, C.; Ordóñez, C.; Bolanos, R.; Janvier, R.; Giulioni, F.; Herrmann, M.; Hudak, A.; Parsons, R.; Santin, C. SegmentedForests: a labelled dataset of terrestrial LiDAR point clouds for semantic segmentation of forests. For. An. Int. J. For. Res. 2026, 99, cpaf062. [Google Scholar] [CrossRef]
- Keane, R.E. Wildland fuel fundamentals and applications; Springer, 2015. [Google Scholar]
- Che, E.; Olsen, M.J. Fast ground filtering for TLS data via Scanline Density Analysis. ISPRS J. Photogramm. Remote Sens. 2017, 129, 226–240. [Google Scholar] [CrossRef]
- Qin, N.; Tan, W.; Guan, H.; Wang, L.; Ma, L.; Tao, P.; Fatholahi, S.; Hu, X.; Li, J. Towards intelligent ground filtering of large-scale topographic point clouds: A comprehensive survey. Int. J. Appl. Earth Obs. Geoinf. 2023, 125. [Google Scholar] [CrossRef]
- Hillman, S.; Wallace, L.; Reinke, K.; Jones, S. A comparison between TLS and UAS LiDAR to represent eucalypt crown fuel characteristics. ISPRS J. Photogramm. Remote Sens. 2021, 181, 295–307. [Google Scholar] [CrossRef]
- Takhtkeshha, N.; Bocaux, L.; Ruoppa, L.; Remondino, F.; Mandlburger, G.; Kukko, A.; Hyyppä, J. 3D Forest Semantic Segmentation Using Multispectral LiDAR and 3D Deep Learning. PFG – J. Photogramm. Remote Sens. Geoinf. Sci. 2025, 94, 377–397. [Google Scholar] [CrossRef]
- Zhang, F.; Chancia, R.; Clapp, J.; Hassanzadeh, A.; Dera, D.; MacKenzie, R.; van Aardt, J. Through the perspective of LiDAR: A feature-enriched and uncertainty-aware annotation pipeline for terrestrial point cloud segmentation. ISPRS J. Photogramm. Remote Sens. 2026, 236, 141–161. [Google Scholar] [CrossRef]
- Weiser, H.; Ulrich, V.; Winiwarter, L.; Pena, A.M.E.; Höfle, B. Manually labeled terrestrial laser scanning point clouds of individual trees for leaf-wood separation; heiDATA, 2019. [Google Scholar]
- Plot-level semantically labelled terrestrial laser scanning point clouds. Anonymous. 2024. [CrossRef]
- Laino, D.; Cabo, C.; Ordóñez, C.; Bolanos, R.; Janvier, R.; Giulioni, F.; Herrmann, M.; Hudak, A.; Parsons, R.; Santin, C.; et al. SegmentedForests: a labelled dataset of terrestrial LiDAR point clouds for semantic segmentation of forests. For. An. Int. J. For. Res. 2026, 99. [Google Scholar] [CrossRef]
- Weiser, H.; Schäfer, J.; Winiwarter, L.; Krašovec, N.; Fassnacht, F.E.; Höfle, B. Individual tree point clouds and tree measurements from multi-platform laser scanning in German forests. Earth Syst. Sci. Data 2022, 14, 2989–3012. [Google Scholar] [CrossRef]
- Liu, J.; Wang, D.; Gong, H.; Wang, C.; Zhu, J.; Wang, D. A synthetic data generation framework for deep learning-based LiDAR forest structure analysis. Remote Sens. Environ. 2026, 341, 115436. [Google Scholar] [CrossRef]
- Xi, Z.; Hopkinson, C. Terrestrial Laser Scanning (TLS) plot scans from varying natural forest environments. 2022. [Google Scholar] [PubMed]
- Xi, Z.; Hopkinson, C. Detecting Individual-Tree Crown Regions from Terrestrial Laser Scans with an Anchor-Free Deep Learning Model. Can. J. Remote Sens. 2021, 47, 228–242. [Google Scholar] [CrossRef]
- Wang, D.; Momo Takoudjou, S.; Casella, E. LeWoS: A universal leaf-wood classification method to facilitate the 3D modelling of large tropical trees using terrestrial LiDAR. Methods Ecol. Evol. 2020, 11, 376–389. [Google Scholar] [CrossRef]
- Liang, X.; Qi, H.; Deng, X.; Chen, J.; Cai, S.; Zhang, Q.; Wang, Y.; Kukko, A.; Hyyppä, J. ForestSemantic: a dataset for semantic learning of forest from close-range sensing. Geo-Spat. Inf. Sci. 2025, 28, 185–211. [Google Scholar] [CrossRef]
- Wielgosz, M.; Puliti, S.; Xiang, B.; Schindler, K.; Astrup, R. SegmentAnyTree: A sensor and platform agnostic deep learning model for tree segmentation using laser scanning data. Remote Sens. Environ. 2024, 313. [Google Scholar] [CrossRef]
- Henrich, J.; van Delden, J.; Seidel, D.; Kneib, T.; Ecker, A.S. TreeLearn: A deep learning method for segmenting individual trees from ground-based LiDAR forest point clouds. Ecol. Inform. 2024, 84, 102888. [Google Scholar] [CrossRef]
- Federal, P. 3D Fuels: Hierarchically scaled datasets for three-dimensional wildland fuel characterization. 2024. [Google Scholar]
- Zhong, Y.; Liu, S.; Sun, H. A 3D point cloud instance segmentation network for extracting individual trees from complex forest scenes. Comput. Electron. Agric. 2026, 242, 111333. [Google Scholar] [CrossRef]
- Xiang, B.; Wielgosz, M.; Kontogianni, T.; Peters, T.; Puliti, S.; Astrup, R.; Schindler, K. Automated forest inventory: Analysis of high-density airborne LiDAR point clouds with 3D deep learning. Remote Sens. Environ. 2024, 305, 114078. [Google Scholar] [CrossRef]
- Zhang, Q.; Cai, S.; Liang, X. Individual tree segmentation in occluded complex forest stands through ellipsoid directional searching and point compensation. For. Ecosyst. 2024, 11, 100238. [Google Scholar] [CrossRef]
- Krisanski, S.; Taskhiri, M.S.; Gonzalez Aracil, S.; Herries, D.; Turner, P. Sensor Agnostic Semantic Segmentation of Structurally Diverse and Complex Forest Point Clouds Using Deep Learning. Remote Sens. 2021, 13. [Google Scholar] [CrossRef]
- Kaijaluoto, R.; Kukko, A.; El Issaoui, A.; Hyyppä, J.; Kaartinen, H. Semantic segmentation of point cloud data using raw laser scanner measurements and deep neural networks. ISPRS Open J. Photogramm. Remote Sens. 2022, 3. [Google Scholar] [CrossRef]
- Holvoet, J.; Eichhorn, M.P.; Giannetti, F.; Kükenbrink, D.; Liang, X.; Mokroš, M.; Novotný, J.; Pitkänen, T.P.; Puliti, S.; Skudnik, M.; et al. Terrestrial and mobile laser scanning for national forest inventories: From theory to implementation. Remote Sens. Environ. 2025, 329. [Google Scholar] [CrossRef]
- Lu, X.; Guo, Q.; Li, W.; Flanagan, J. A bottom-up approach to segment individual deciduous trees using leaf-off lidar point cloud data. ISPRS J. Photogramm. Remote Sens. 2014, 94, 1–12. [Google Scholar] [CrossRef]
- Tutland, N.J.; Wion, A.P.; May, C.J.; Hutchings, G.C.; Nowak, H.A.; Gattiker, J.R.; Hiers, J.K.; Linn, R.R.; Pokswinski, S.M.; Margolis, E.Q. Representing 3-dimensional fuels for physics-based fire behavior models: a general framework and case study in a type-converted post-fire shrubfield. Fire Ecol. 2025, 21, 43. [Google Scholar] [CrossRef]
- Krisanski, S.; Taskhiri, M.S.; Gonzalez Aracil, S.; Herries, D.; Turner, P. Sensor Agnostic Semantic Segmentation of Structurally Diverse and Complex Forest Point Clouds Using Deep Learning. Remote Sens. 2021, 13, 1413. [Google Scholar] [CrossRef]
- Hanousek, T.; Novotný, J.; Navrátilová, B.; Švik, M.; Krejza, J.; Janoutová, R. Complete workflow for detailed 3D forest reconstruction: from terrestrial laser scanning to complex 3D radiative transfer modelling. Silico Plants 2025, 7. [Google Scholar] [CrossRef]
- Bester, M.S. The Burning Bush: Linking LiDAR-derived Shrub Architecture to Flammability; West Virginia University, 2022. [Google Scholar]
- Cova, G.R.; Prichard, S.J.; Rowell, E.; Drye, B.; Eagle, P.; Kennedy, M.C.; Nemens, D.G. Evaluating Close-Range Photogrammetry for 3D Understory Fuel Characterization and Biomass Prediction in Pine Forests. Remote. Sens. 2023, 15, 4837. [Google Scholar] [CrossRef]
- Hudak, A.T.; Kato, A.; Bright, B.C.; Loudermilk, E.L.; Hawley, C.; Restaino, J.C.; Ottmar, R.D.; Prata, G.A.; Cabo, C.; Prichard, S.J.; et al. Towards Spatially Explicit Quantification of Pre- and Postfire Fuels and Fuel Consumption from Traditional and Point Cloud Measurements. For. Sci. 2020, 66, 428–442. [Google Scholar] [CrossRef]
- Marcozzi, A.A.; Johnson, J.V.; Parsons, R.A.; Flanary, S.J.; Seielstad, C.A.; Downs, J.Z. Application of LiDAR Derived Fuel Cells to Wildfire Modeling at Laboratory Scale. Fire 2023, 6, Medium, X 2023-2011-2021. [Google Scholar] [CrossRef]
- Rowell, E.; Loudermilk, E.L.; Seielstad, C.; O’Brien, J.J. Using Simulated 3D Surface Fuelbeds and Terrestrial Laser Scan Data to Develop Inputs to Fire Behavior Models. Can. J. Remote Sens. 2016, 42, 443–459. [Google Scholar] [CrossRef]
Figure 1.
Representative wood–leaf organization across globally distributed forest ecosystems – Mathow from the United States of America (USA), Robson Creek, and Litchfield from Australia. Wood is shown in red and foliage green. Ground points were removed to highlight the 3-D distribution of vegetation across canopy, ladder, understory, and near-surface fuel strata using fastgc (https://pypi.org/project/fastgc/) – developed by the corresponding author.
Figure 1.
Representative wood–leaf organization across globally distributed forest ecosystems – Mathow from the United States of America (USA), Robson Creek, and Litchfield from Australia. Wood is shown in red and foliage green. Ground points were removed to highlight the 3-D distribution of vegetation across canopy, ladder, understory, and near-surface fuel strata using fastgc (https://pypi.org/project/fastgc/) – developed by the corresponding author.
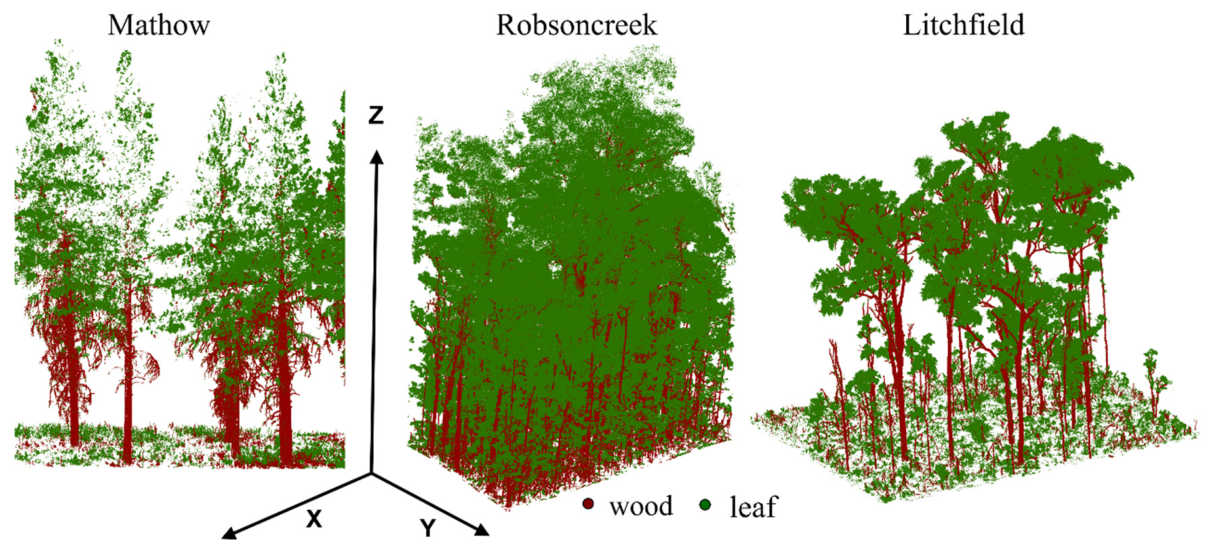
Figure 2.
Representative examples of the labeled terrestrial LiDAR datasets used for training the wood–leaf segmentation framework. (a) Plot-level tree datasets containing only tree structures after removal of ground, understory, and surface fuel components. (b) Complete forest-plot datasets representing the full 3-D fuel continuum from surface fuels to canopy foliage. (c) Individual-tree datasets with detailed wood-leaf annotations. Insets (1–5) show representative examples from the corresponding datasets and demonstrate variability in branching architecture, crown complexity, vegetation density, understory structure, and fuel organization. Red points represent wood, and green points represent foliar labeled point clouds.
Figure 2.
Representative examples of the labeled terrestrial LiDAR datasets used for training the wood–leaf segmentation framework. (a) Plot-level tree datasets containing only tree structures after removal of ground, understory, and surface fuel components. (b) Complete forest-plot datasets representing the full 3-D fuel continuum from surface fuels to canopy foliage. (c) Individual-tree datasets with detailed wood-leaf annotations. Insets (1–5) show representative examples from the corresponding datasets and demonstrate variability in branching architecture, crown complexity, vegetation density, understory structure, and fuel organization. Red points represent wood, and green points represent foliar labeled point clouds.
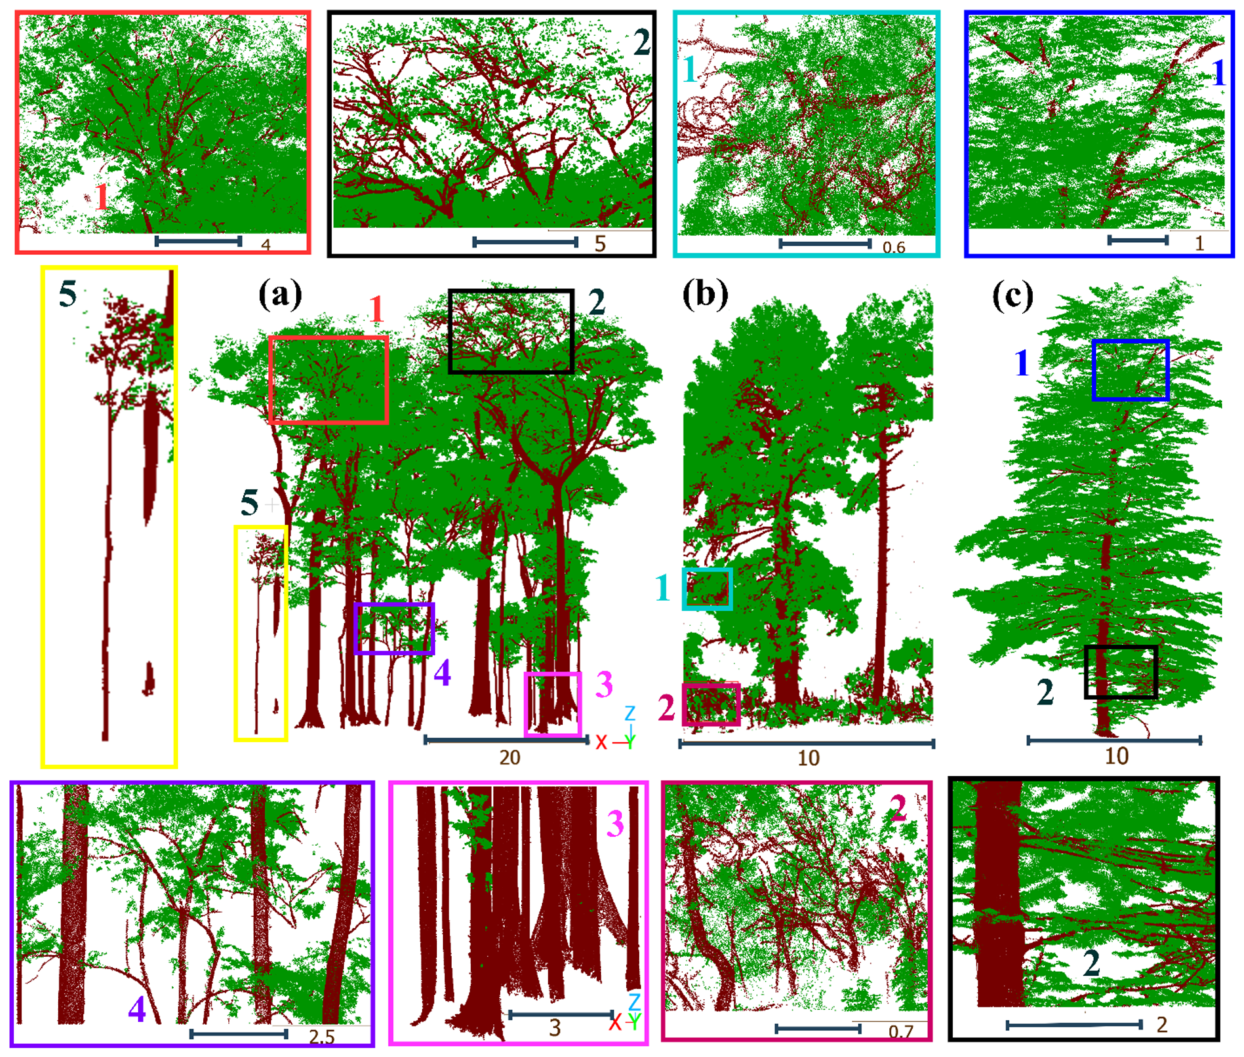
Figure 3.
Harmonization of the SegmentedForests [68] multi-class benchmark into wood–foliar annotation used in this study. Panels (a) and (c) present the original semantic labels comprising ground and surface vegetation (blue), stems (brown), shrubs (red), understory vegetation (green), fine branches and foliage (pink). Panels (b) and (d) show the harmonized annotations after semantic aggregation and manual refinement, where all woody structures were merged into a single wood class ( brown), all foliage-bearing vegetation into a foliar class (green), and ground into a grey class.
Figure 3.
Harmonization of the SegmentedForests [68] multi-class benchmark into wood–foliar annotation used in this study. Panels (a) and (c) present the original semantic labels comprising ground and surface vegetation (blue), stems (brown), shrubs (red), understory vegetation (green), fine branches and foliage (pink). Panels (b) and (d) show the harmonized annotations after semantic aggregation and manual refinement, where all woody structures were merged into a single wood class ( brown), all foliage-bearing vegetation into a foliar class (green), and ground into a grey class.
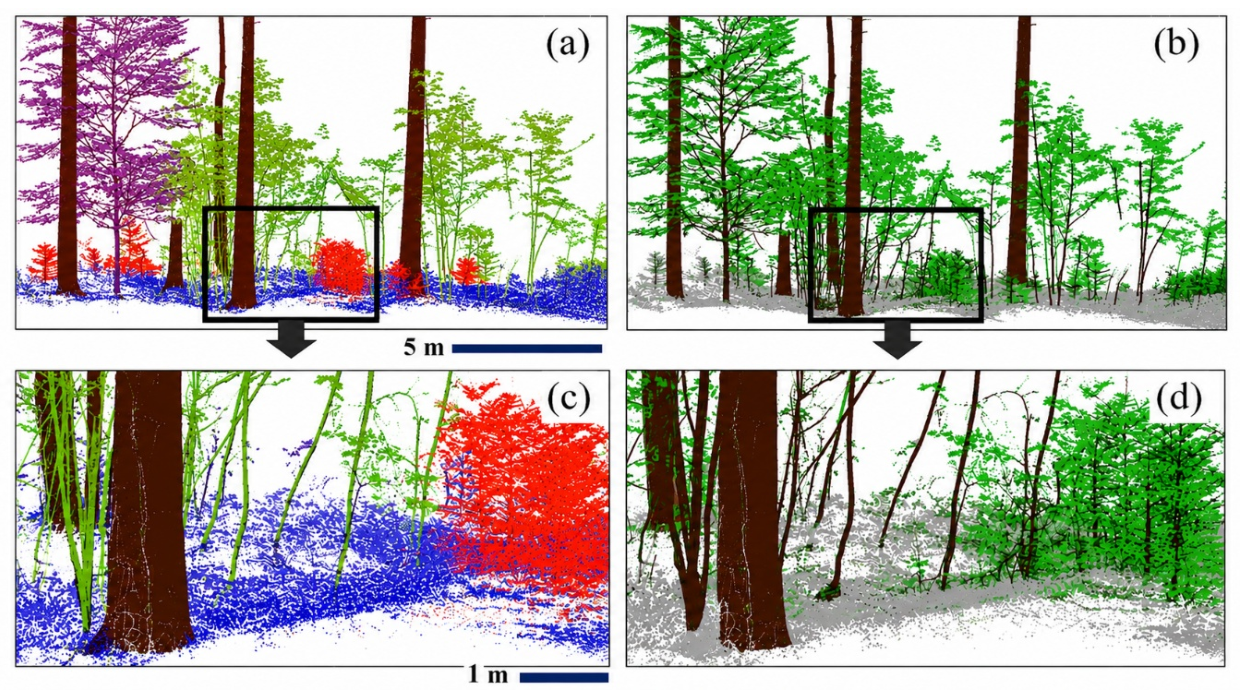
Figure 4.
Structural and acquisition diversity of the labeled training datasets used for binary wood–foliar semantic segmentation. (a) Within-scan woody and foliar class composition for all plot-level and individual-tree point clouds ranked by total labeled points. (b) Distribution of wood and foliar class proportions across datasets. (c) Variation in class composition across a broad gradient of point densities, representing heterogeneous terrestrial LiDAR acquisitions. Point size is proportional to the total number of labeled points within each scan. (d) Variation in class composition across forest stands spanning contrasting vertical structural complexity, illustrating the broad structural domain.
Figure 4.
Structural and acquisition diversity of the labeled training datasets used for binary wood–foliar semantic segmentation. (a) Within-scan woody and foliar class composition for all plot-level and individual-tree point clouds ranked by total labeled points. (b) Distribution of wood and foliar class proportions across datasets. (c) Variation in class composition across a broad gradient of point densities, representing heterogeneous terrestrial LiDAR acquisitions. Point size is proportional to the total number of labeled points within each scan. (d) Variation in class composition across forest stands spanning contrasting vertical structural complexity, illustrating the broad structural domain.
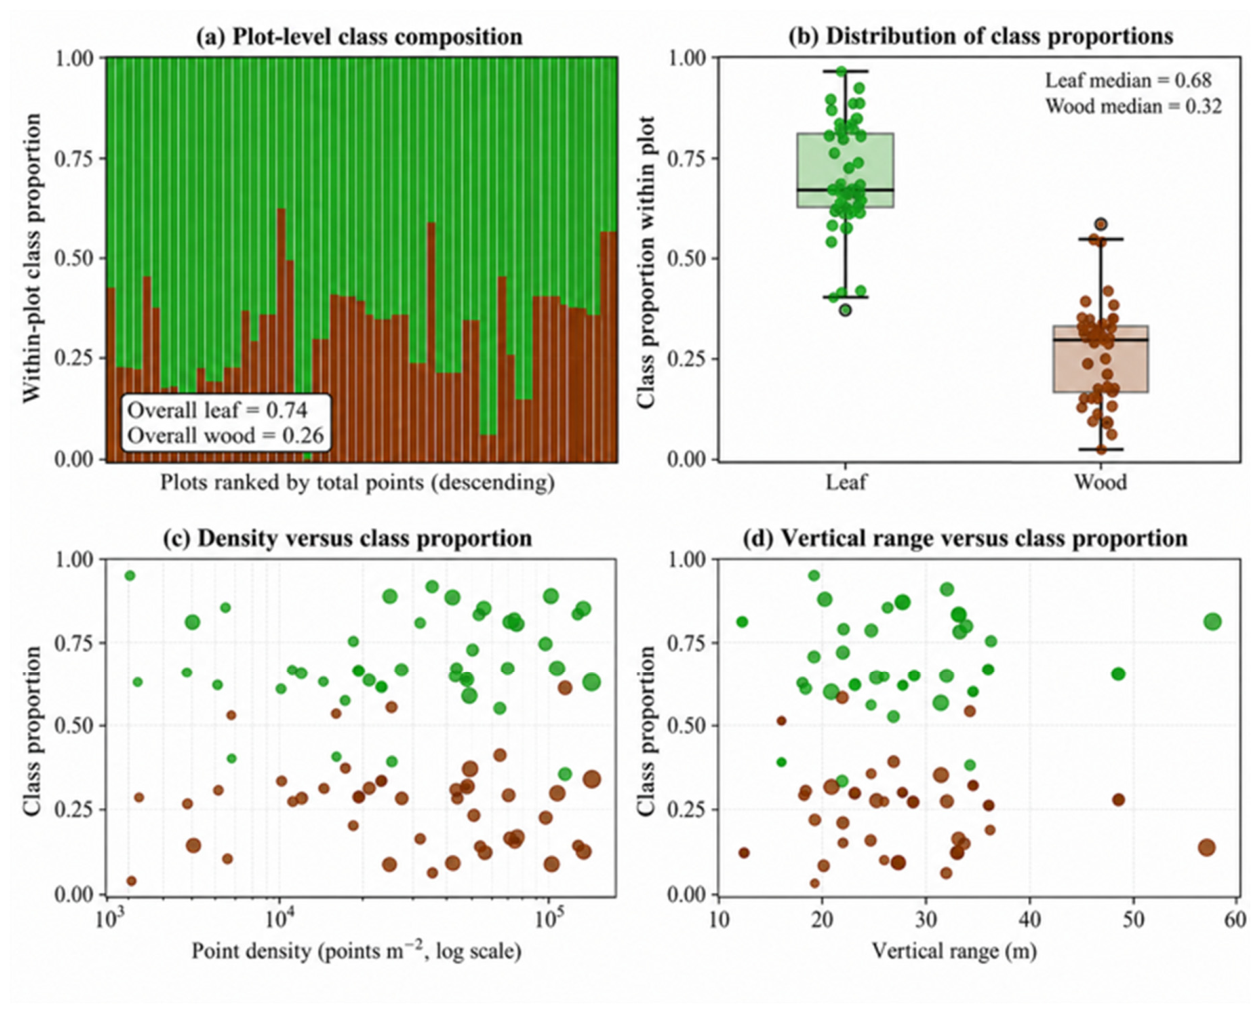
Figure 5.
Independent benchmark datasets used for quantitative evaluation of wood–foliar semantic segmentation. The benchmarks comprise (a–c) complete forest plots, (d) plot-level tree datasets without understory and ground, and (e–f) individual-tree datasets. Red points denote wood components and green points denote foliar vegetation.
Figure 5.
Independent benchmark datasets used for quantitative evaluation of wood–foliar semantic segmentation. The benchmarks comprise (a–c) complete forest plots, (d) plot-level tree datasets without understory and ground, and (e–f) individual-tree datasets. Red points denote wood components and green points denote foliar vegetation.
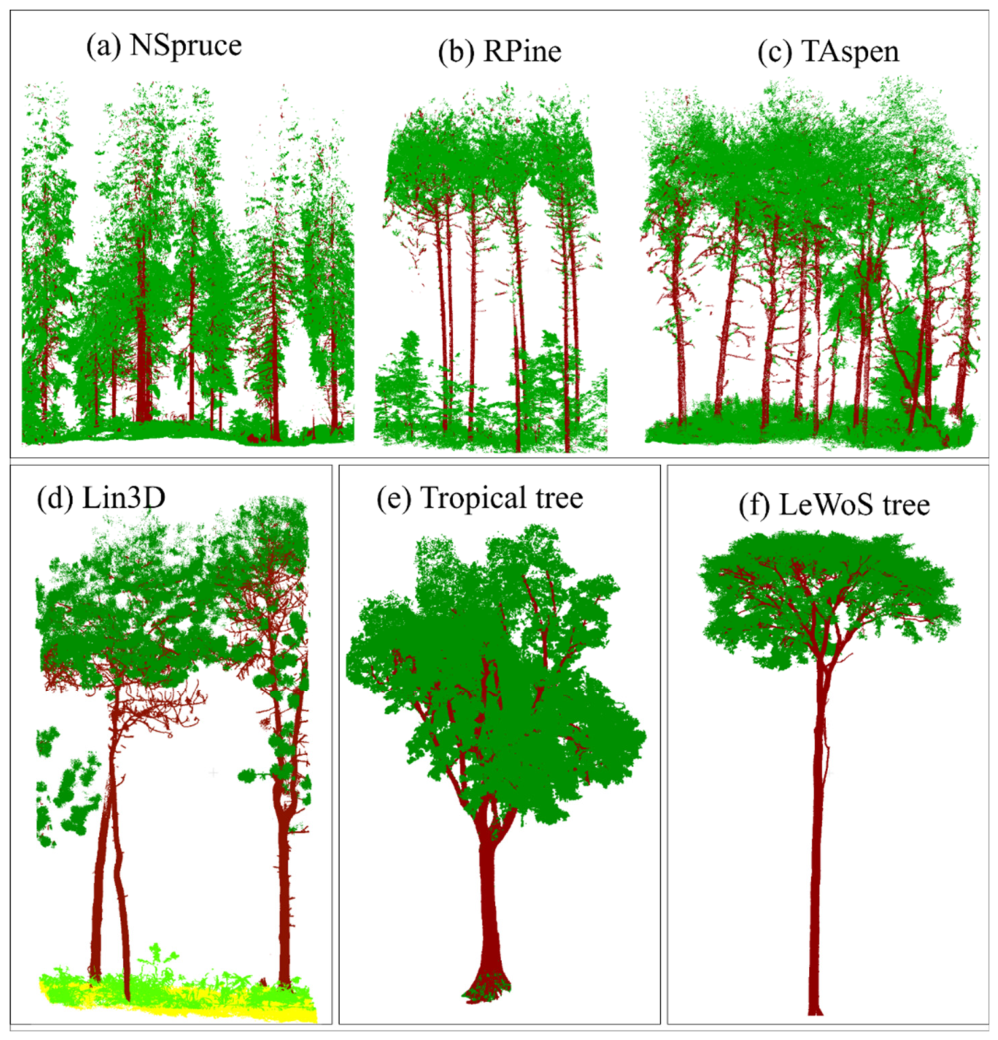
Figure 6.
Conceptual workflow of the proposed points2SBL framework for wood–leaf semantic segmentation of terrestrial LiDAR point clouds. Raw multi-platform near-ground LiDAR data (a) are partitioned into overlapping spatial blocks (b), represented using local geometric descriptors derived from neighborhood covariance structure (c), and processed using a point-based deep learning architecture (d). Classification outputs are aggregated through tiled multi-vote inference (e) and refined using geometric post-processing operations (f) to produce final wood and foliar semantic classes (g). The workflow is designed to support transferable segmentation across diverse forest ecosystems, canopy architectures, and terrestrial LiDAR acquisition platforms.
Figure 6.
Conceptual workflow of the proposed points2SBL framework for wood–leaf semantic segmentation of terrestrial LiDAR point clouds. Raw multi-platform near-ground LiDAR data (a) are partitioned into overlapping spatial blocks (b), represented using local geometric descriptors derived from neighborhood covariance structure (c), and processed using a point-based deep learning architecture (d). Classification outputs are aggregated through tiled multi-vote inference (e) and refined using geometric post-processing operations (f) to produce final wood and foliar semantic classes (g). The workflow is designed to support transferable segmentation across diverse forest ecosystems, canopy architectures, and terrestrial LiDAR acquisition platforms.
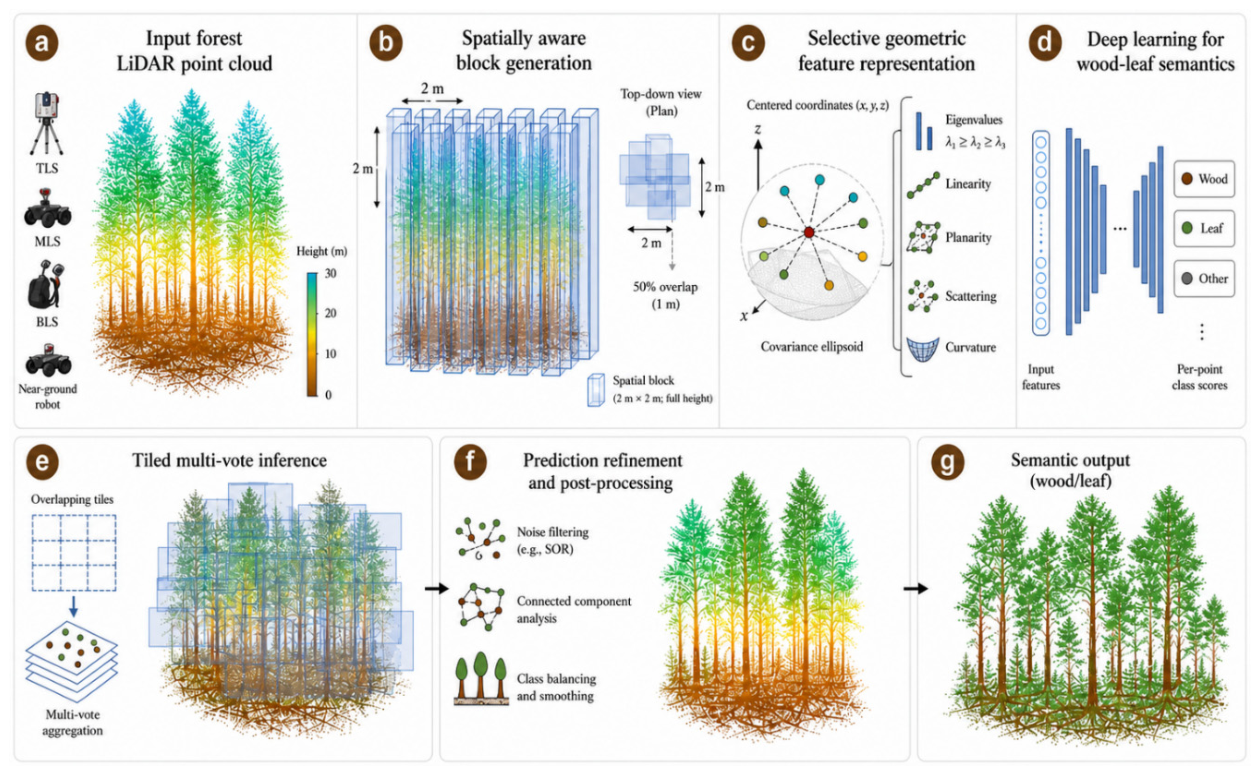
Figure 7.
Comparison of training convergence and validation performance for PT, PointNet++ (PN++), and PointNeXt (PNx). Panels show (a) training loss, (b) validation loss, (c) overall accuracy (OA), (d) mean intersection over union (mIoU), (e) macro F1-score (MF1), (f) weighted F1-score (WF1), (g) leaf F1-score (LF1), and (h) balanced accuracy (BA) over 40 training epochs. All models reached stable convergence within 40 epochs, after which no meaningful improvement in training or validation performance was observed.
Figure 7.
Comparison of training convergence and validation performance for PT, PointNet++ (PN++), and PointNeXt (PNx). Panels show (a) training loss, (b) validation loss, (c) overall accuracy (OA), (d) mean intersection over union (mIoU), (e) macro F1-score (MF1), (f) weighted F1-score (WF1), (g) leaf F1-score (LF1), and (h) balanced accuracy (BA) over 40 training epochs. All models reached stable convergence within 40 epochs, after which no meaningful improvement in training or validation performance was observed.
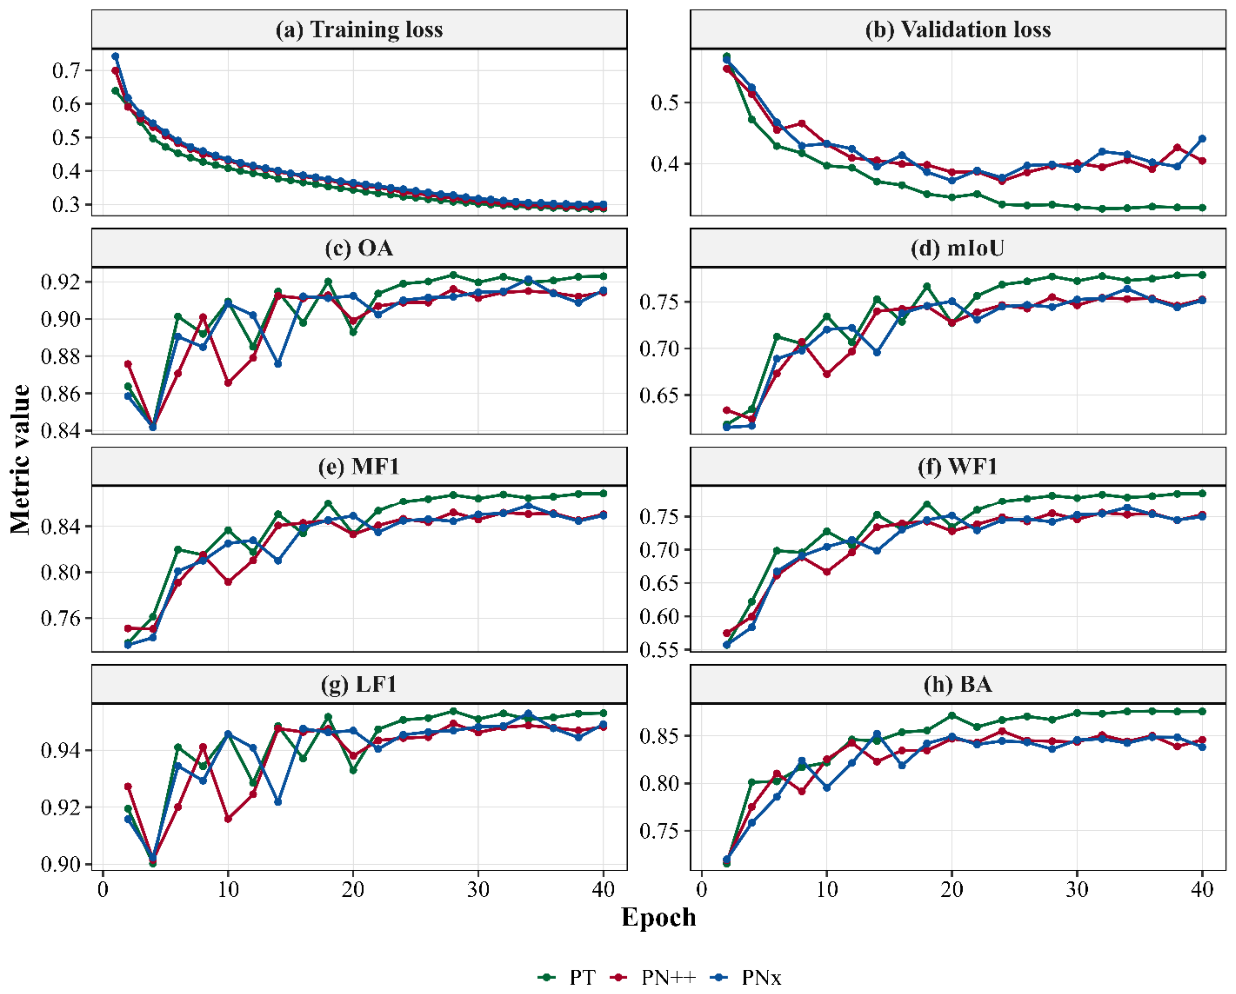
Figure 8.
Performance change after optional post-processing refinement for PNx, PN++, and PT. Heatmap values show the percentage-point (pp) difference between refined and raw predictions across all evaluation metrics. Positive values indicate performance gains, while negative values indicate reductions. Refinement yielded the most consistent improvements for PT, whereas PNx and PN++ showed increased WP but reduced WR, reflecting greater sensitivity to over-smoothing of ambiguous local predictions.
Figure 8.
Performance change after optional post-processing refinement for PNx, PN++, and PT. Heatmap values show the percentage-point (pp) difference between refined and raw predictions across all evaluation metrics. Positive values indicate performance gains, while negative values indicate reductions. Refinement yielded the most consistent improvements for PT, whereas PNx and PN++ showed increased WP but reduced WR, reflecting greater sensitivity to over-smoothing of ambiguous local predictions.
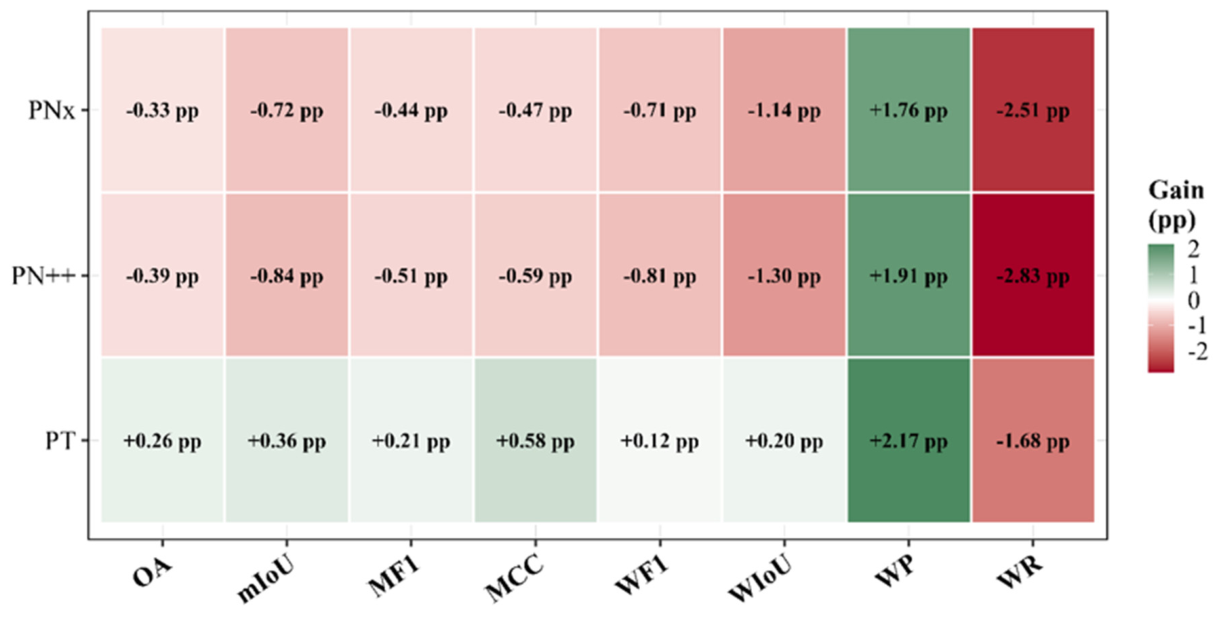
Figure 9.
Distribution of segmentation metrics across five spatially held-out Lin3D plots for Point Transformer (PT), PointNet++ (PN++), and PointNeXt (PNx). Boxplots summarize mean Intersection over Union (mIoU), macro F1-score (MF1), wood F1-score (WF1), wood Intersection over Union (WIoU), Matthew’s correlation coefficient (MCC), and overall accuracy (OA). Black points represent individual plot-level results. PT achieved the highest median performance across most metrics, indicating stronger cross-plot generalization within the Lin3D benchmark.
Figure 9.
Distribution of segmentation metrics across five spatially held-out Lin3D plots for Point Transformer (PT), PointNet++ (PN++), and PointNeXt (PNx). Boxplots summarize mean Intersection over Union (mIoU), macro F1-score (MF1), wood F1-score (WF1), wood Intersection over Union (WIoU), Matthew’s correlation coefficient (MCC), and overall accuracy (OA). Black points represent individual plot-level results. PT achieved the highest median performance across most metrics, indicating stronger cross-plot generalization within the Lin3D benchmark.
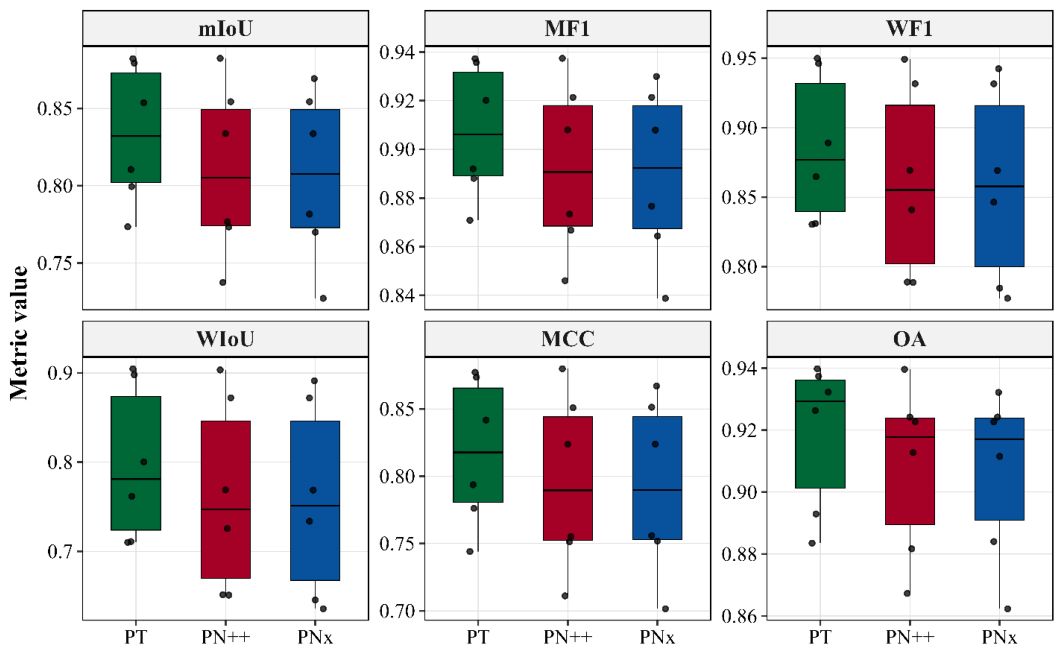
Figure 10.
Relative composition of confusion matrix outcomes across the four independent benchmark datasets: (a) TLS plots, (b) Lin3D, (c) Tropical tree, and (d) LeWoS Trees. Stacked bars show the proportions of TN, TP, FP, and FN expressed as percentages of the total number of benchmark points.
Figure 10.
Relative composition of confusion matrix outcomes across the four independent benchmark datasets: (a) TLS plots, (b) Lin3D, (c) Tropical tree, and (d) LeWoS Trees. Stacked bars show the proportions of TN, TP, FP, and FN expressed as percentages of the total number of benchmark points.
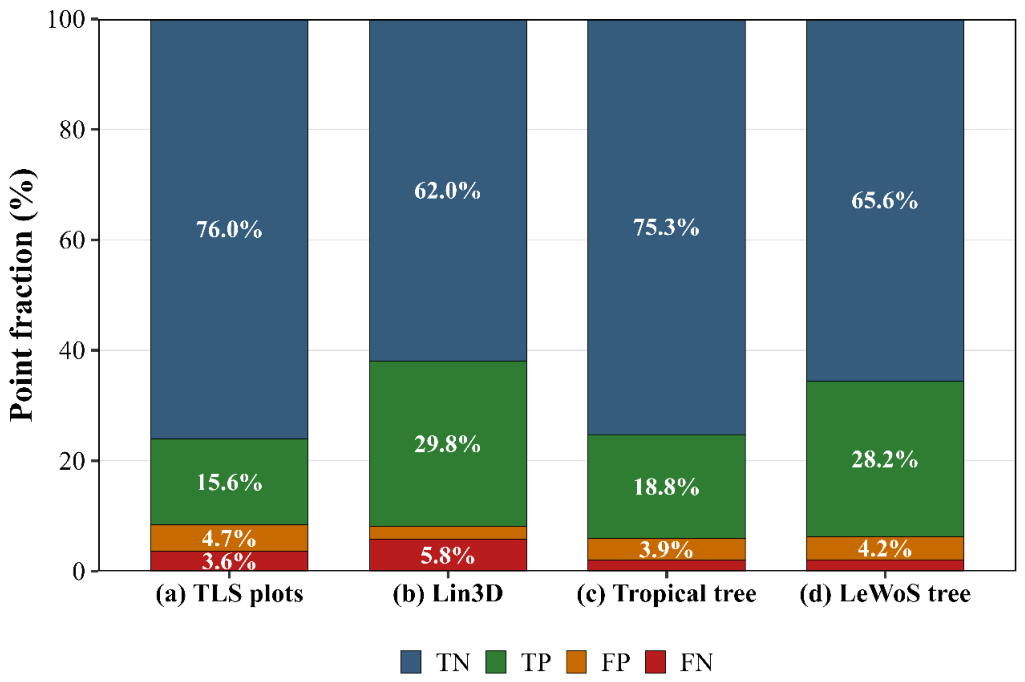
Figure 11.
Class-specific error decomposition for the four benchmark datasets. Wood and leaf omission and commission errors are shown for (a) TLS plots, (b) Lin3D, (c) Tropical tree, and (d) LeWoS Trees. The profiles summarize the distribution of segmentation errors and facilitate comparison of class-specific uncertainty among benchmark datasets.
Figure 11.
Class-specific error decomposition for the four benchmark datasets. Wood and leaf omission and commission errors are shown for (a) TLS plots, (b) Lin3D, (c) Tropical tree, and (d) LeWoS Trees. The profiles summarize the distribution of segmentation errors and facilitate comparison of class-specific uncertainty among benchmark datasets.
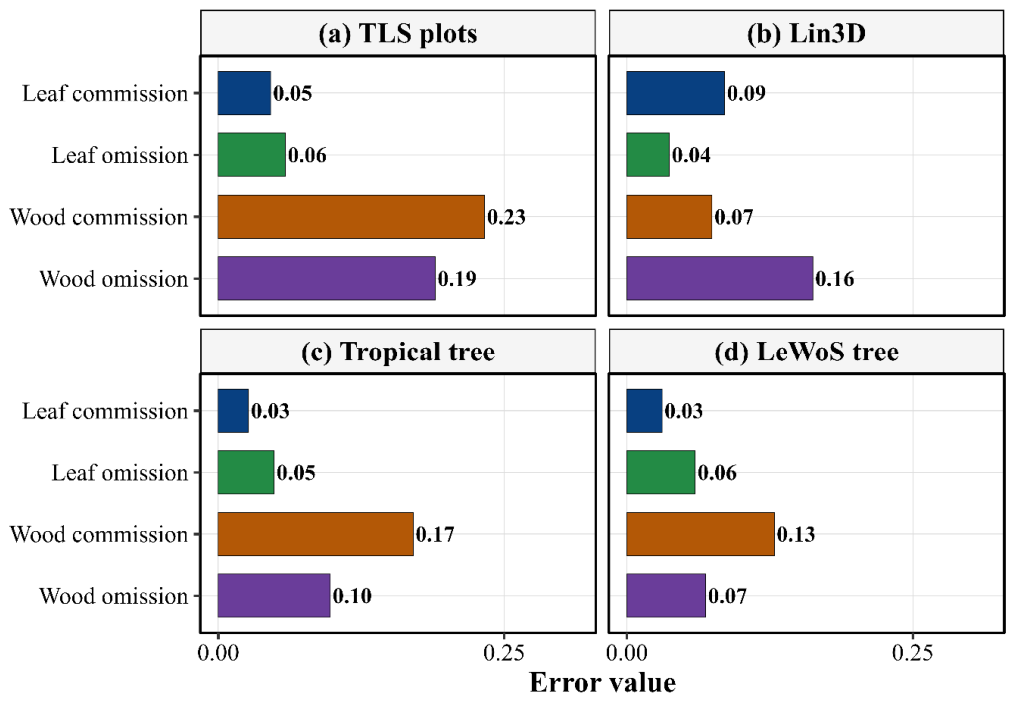
Figure 12.
Vertical performance profiles of PT across the four benchmark datasets. mIoU, WF1, WP, and WR are plotted as a function of relative height for (a) TLS plots, (b) Lin3D, (c) Tropical tree, and (d) LeWoS Trees. Dashed reference lines indicate a metric value of 0.80 and a relative height of 0.80. The profiles illustrate height-dependent variation in wood segmentation performance throughout the canopy.
Figure 12.
Vertical performance profiles of PT across the four benchmark datasets. mIoU, WF1, WP, and WR are plotted as a function of relative height for (a) TLS plots, (b) Lin3D, (c) Tropical tree, and (d) LeWoS Trees. Dashed reference lines indicate a metric value of 0.80 and a relative height of 0.80. The profiles illustrate height-dependent variation in wood segmentation performance throughout the canopy.
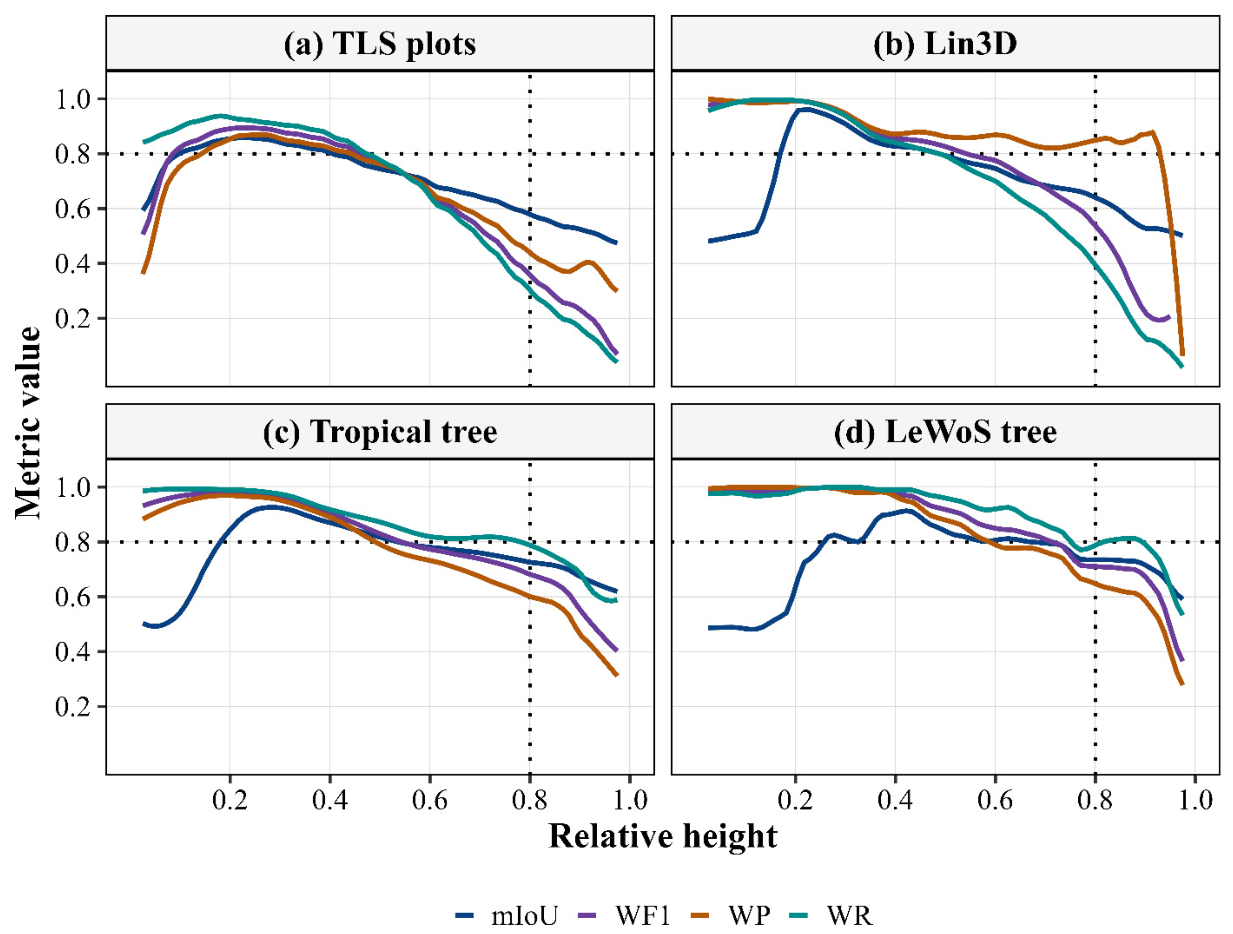
Figure 13.
Vertical wood distribution and agreement profiles across the four benchmark datasets. The shaded background represents the relative abundance of wood and leaf points along the normalized canopy profile, while the curves depict the reference wood fraction (brown), predicted wood fraction (dark red), wood agreement (green), and predicted wood where reference leaf (orange) fraction. Results are shown for four benchmark datasets: (a) TLS plots, (b) Lin3D, (c) Tropical Tree, and (d) LeWoS Trees.
Figure 13.
Vertical wood distribution and agreement profiles across the four benchmark datasets. The shaded background represents the relative abundance of wood and leaf points along the normalized canopy profile, while the curves depict the reference wood fraction (brown), predicted wood fraction (dark red), wood agreement (green), and predicted wood where reference leaf (orange) fraction. Results are shown for four benchmark datasets: (a) TLS plots, (b) Lin3D, (c) Tropical Tree, and (d) LeWoS Trees.
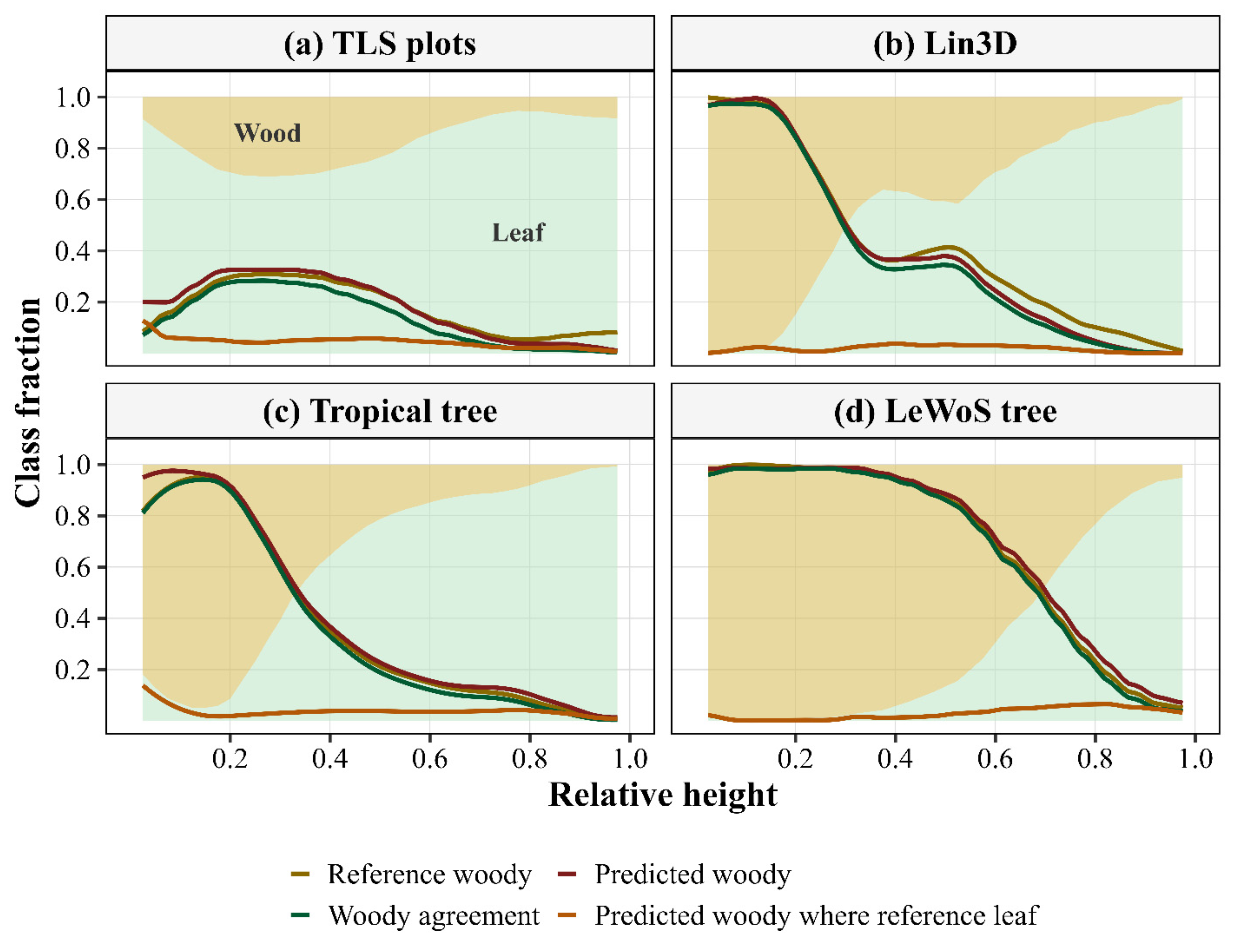
Figure 14.
Species-level semantic segmentation performance of the PT across six TLS benchmark species. Overall Accuracy (OA), Macro F1-score (MF1), mean Intersection over Union (mIoU), Leaf F1-score (LF1), Wood F1-score (WF1), Wood Precision (WP), Wood Recall (WR), and Matthews Correlation Coefficient (MCC) are shown for (a) LPine, (b) RPine, (c) SPine, (d) NSpruce, (e) SMaple, and (f) TAspen, illustrating species-specific variation in semantic segmentation performance across contrasting canopy architectures, branching structures, and wood–foliar structural complexity.
Figure 14.
Species-level semantic segmentation performance of the PT across six TLS benchmark species. Overall Accuracy (OA), Macro F1-score (MF1), mean Intersection over Union (mIoU), Leaf F1-score (LF1), Wood F1-score (WF1), Wood Precision (WP), Wood Recall (WR), and Matthews Correlation Coefficient (MCC) are shown for (a) LPine, (b) RPine, (c) SPine, (d) NSpruce, (e) SMaple, and (f) TAspen, illustrating species-specific variation in semantic segmentation performance across contrasting canopy architectures, branching structures, and wood–foliar structural complexity.
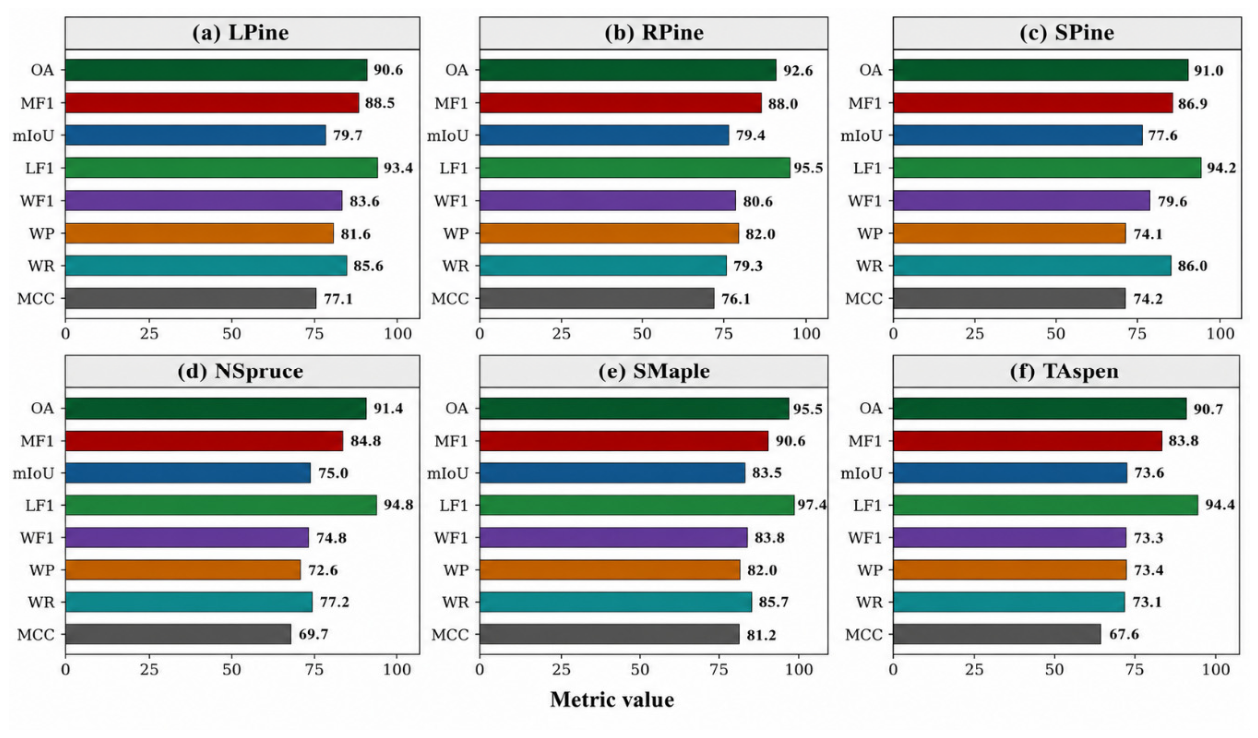
Figure 15.
Species-specific vertical segmentation performance profiles for the six TLS benchmark species. Curves show mIoU, WF1, WP, and WR as a function of relative tree height for (a) LPine, (b) RPine, (c) SPine, (d) NSpruce, (e) SMaple, and (f) TAspen. The horizontal dashed line indicates a metric value of 0.80, and the vertical dashed line marks 0.80 relative height. The figure illustrates species-level variation in segmentation performance throughout the canopy profile and highlights the increasing difficulty of detecting fine wood structures within upper crown regions.
Figure 15.
Species-specific vertical segmentation performance profiles for the six TLS benchmark species. Curves show mIoU, WF1, WP, and WR as a function of relative tree height for (a) LPine, (b) RPine, (c) SPine, (d) NSpruce, (e) SMaple, and (f) TAspen. The horizontal dashed line indicates a metric value of 0.80, and the vertical dashed line marks 0.80 relative height. The figure illustrates species-level variation in segmentation performance throughout the canopy profile and highlights the increasing difficulty of detecting fine wood structures within upper crown regions.
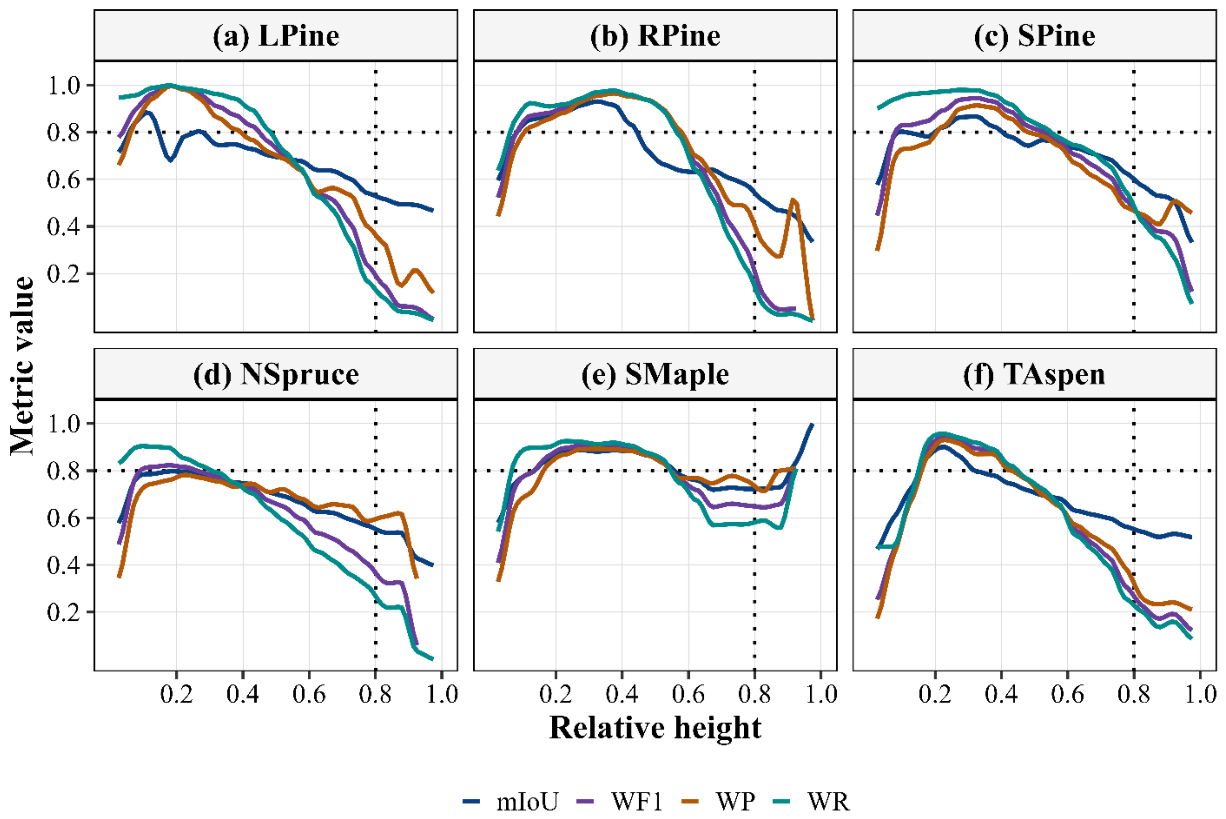
Figure 16.
Species-specific vertical wood agreement profiles for the six TLS benchmark species. Shaded backgrounds indicate the benchmark-derived vertical distributions of wood and leaf points. Curves show the reference wood fraction, predicted wood fraction, wood agreement, and predicted wood where reference leaf as a function of relative tree height for (a) LPine, (b) RPine, (c) SPine, (d) NSpruce, (e) SMaple, and (f) TAspen. The figure illustrates the ability of the PT to preserve species-specific vertical wood structure and identifies canopy regions where disagreement between predictions and benchmark annotations is concentrated.
Figure 16.
Species-specific vertical wood agreement profiles for the six TLS benchmark species. Shaded backgrounds indicate the benchmark-derived vertical distributions of wood and leaf points. Curves show the reference wood fraction, predicted wood fraction, wood agreement, and predicted wood where reference leaf as a function of relative tree height for (a) LPine, (b) RPine, (c) SPine, (d) NSpruce, (e) SMaple, and (f) TAspen. The figure illustrates the ability of the PT to preserve species-specific vertical wood structure and identifies canopy regions where disagreement between predictions and benchmark annotations is concentrated.
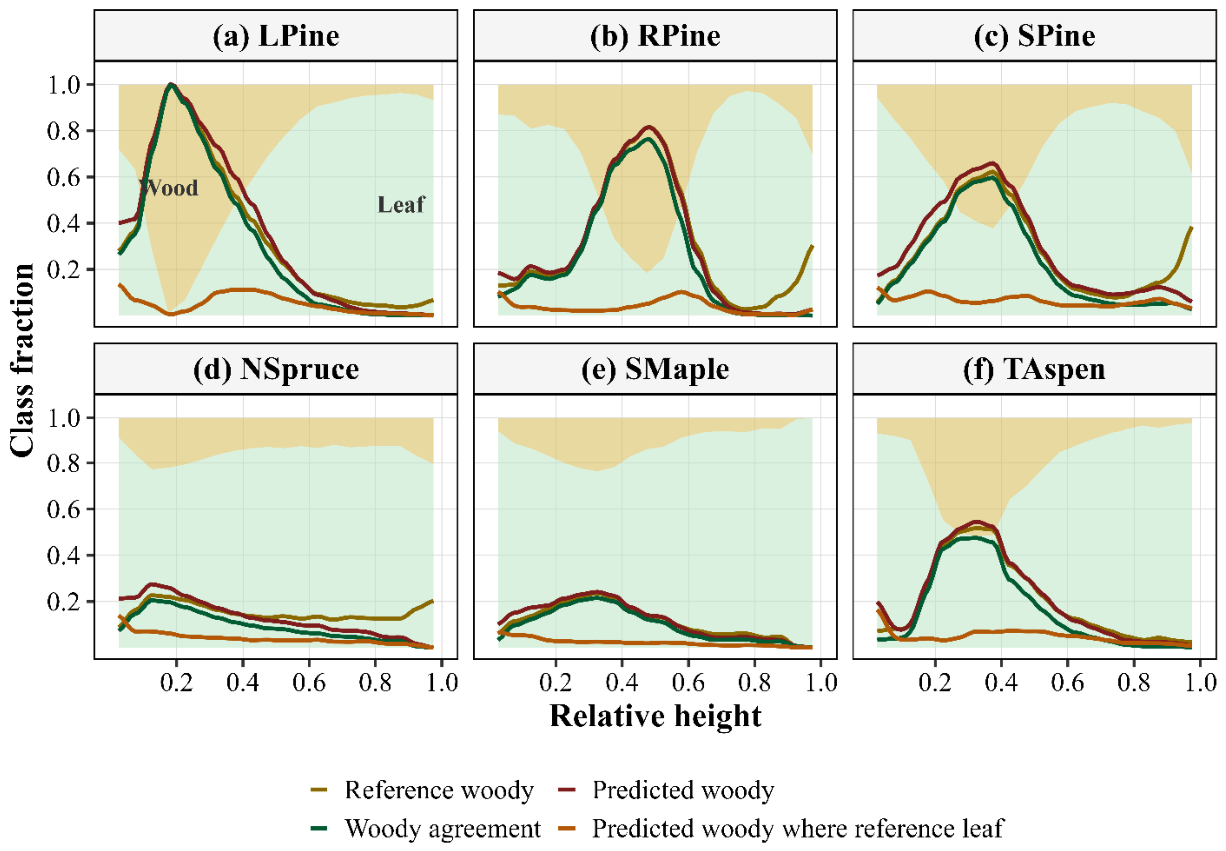
Figure 17.
Qualitative assessment of PT (PT) predictions on a representative tree from the Tropical Tree benchmark dataset. Panels (a) and (d) show the benchmark wood–leaf annotations from lateral and bottom-up views, respectively; (b) and (e) present the corresponding PT predictions, and (c) and (f) show the predicted leaf probability maps (0–1). Insets highlight representative stem and crown regions for detailed visual comparison. Wood is shown in brown, foliage in green, and prediction confidence is represented by the probability color scale.
Figure 17.
Qualitative assessment of PT (PT) predictions on a representative tree from the Tropical Tree benchmark dataset. Panels (a) and (d) show the benchmark wood–leaf annotations from lateral and bottom-up views, respectively; (b) and (e) present the corresponding PT predictions, and (c) and (f) show the predicted leaf probability maps (0–1). Insets highlight representative stem and crown regions for detailed visual comparison. Wood is shown in brown, foliage in green, and prediction confidence is represented by the probability color scale.
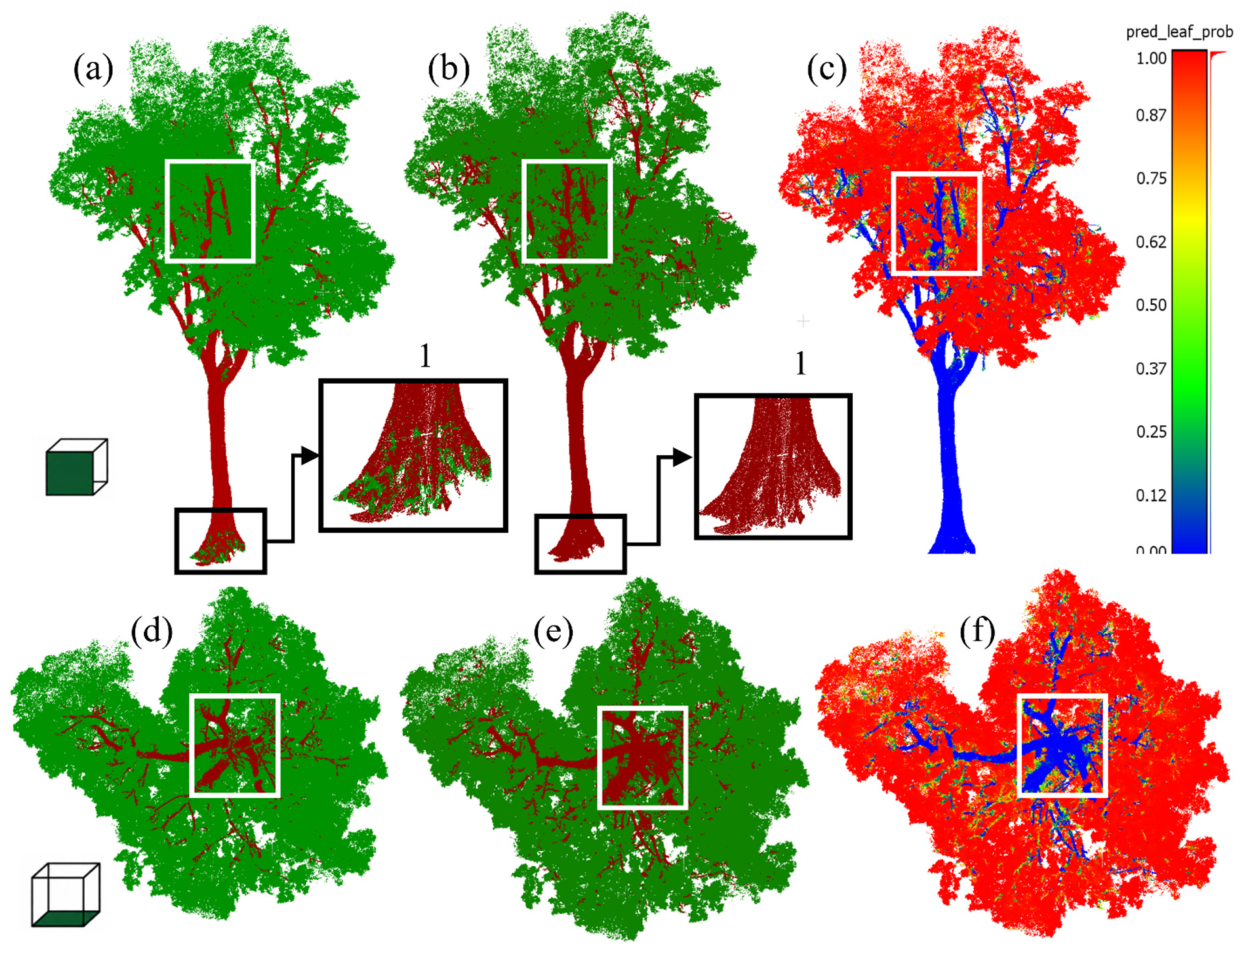
Figure 18.
Qualitative assessment of wood–leaf semantic segmentation using two representative trees from the LeWoS benchmark. Panels (a) and (c) show the benchmark wood–leaf annotations, and panels (b) and (d) present the corresponding semantics from lateral views. Panels (e) and (g) show the benchmark annotations from bottom-up views, whereas panels (f) and (h) present the corresponding PT semantics. Wood is shown in brown and foliage in green.
Figure 18.
Qualitative assessment of wood–leaf semantic segmentation using two representative trees from the LeWoS benchmark. Panels (a) and (c) show the benchmark wood–leaf annotations, and panels (b) and (d) present the corresponding semantics from lateral views. Panels (e) and (g) show the benchmark annotations from bottom-up views, whereas panels (f) and (h) present the corresponding PT semantics. Wood is shown in brown and foliage in green.
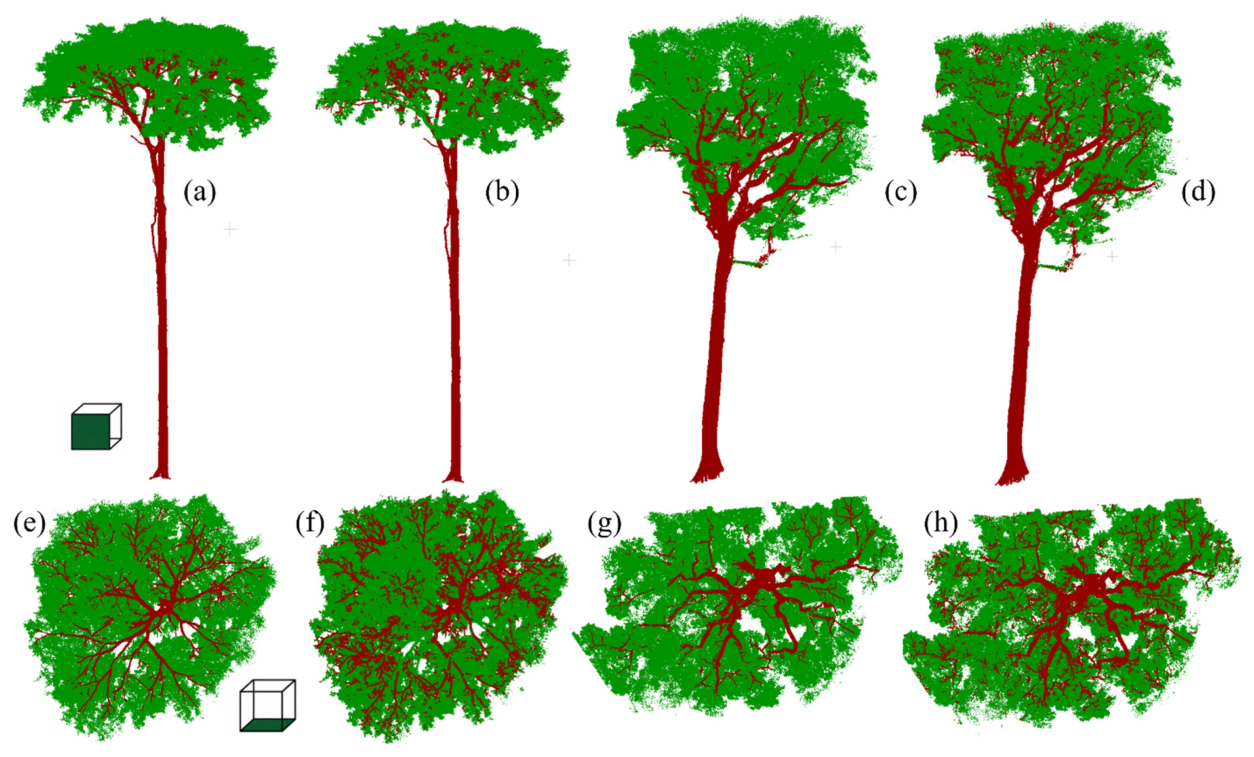
Figure 19.
Representative examples of semantic segmentation discrepancies between reference labels and model predictions in complex forest scenes. Panels (a) and (b) show the same plot-level Lin3D point cloud from two perspectives, highlighting differences in the assignment of wood and foliar components, particularly surface and understory regions. Panels (c) and (d) illustrate plot-level examples where understory vegetation and near-ground wood structures exhibit substantial labeling ambiguity compared to PT (black circle).
Figure 19.
Representative examples of semantic segmentation discrepancies between reference labels and model predictions in complex forest scenes. Panels (a) and (b) show the same plot-level Lin3D point cloud from two perspectives, highlighting differences in the assignment of wood and foliar components, particularly surface and understory regions. Panels (c) and (d) illustrate plot-level examples where understory vegetation and near-ground wood structures exhibit substantial labeling ambiguity compared to PT (black circle).
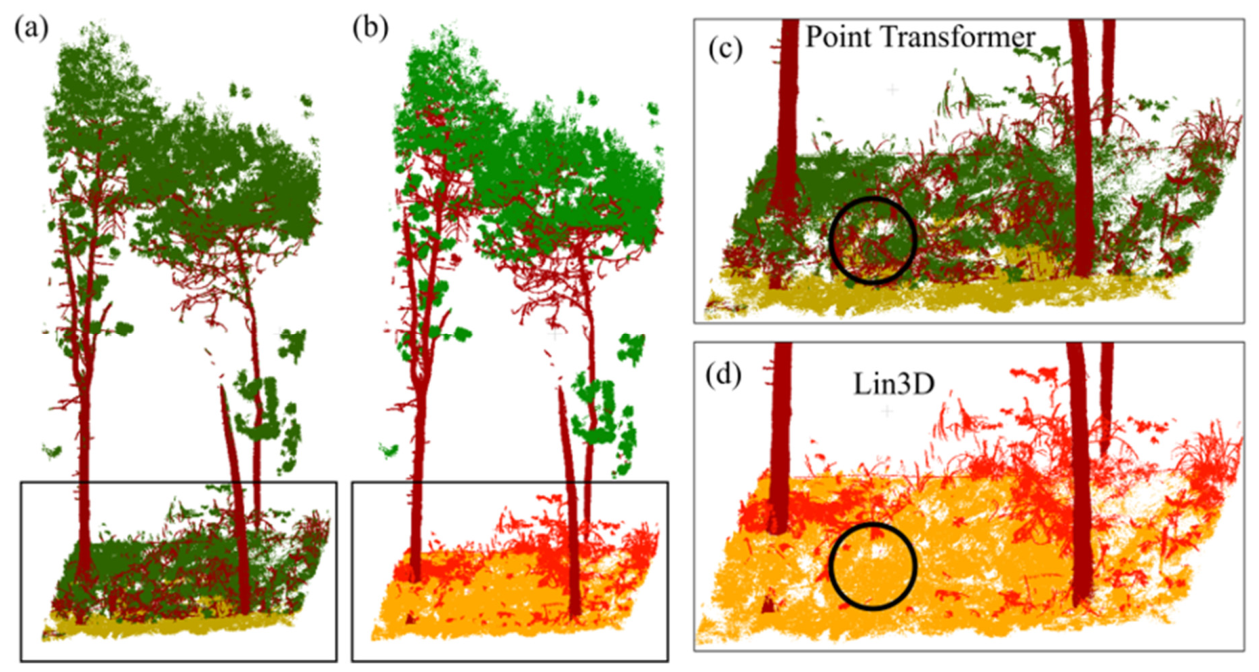
Figure 20.
PT semantic segmentation of a large, registered multi-scan TLS dataset acquired in an Australian eucalypt forest. (a) Top-down view of the complete 180 × 160 m plot; the black rectangle identifies the transect displayed in (b). (b) Side view of the selected transect, with colored bounding boxes indicating the regions enlarged in (c–e). These regions extend from the relatively high-density plot center toward the lower-density outer edge, illustrating segmentation performance under spatially variable sampling density. Wood and foliage are shown in red and green, respectively.
Figure 20.
PT semantic segmentation of a large, registered multi-scan TLS dataset acquired in an Australian eucalypt forest. (a) Top-down view of the complete 180 × 160 m plot; the black rectangle identifies the transect displayed in (b). (b) Side view of the selected transect, with colored bounding boxes indicating the regions enlarged in (c–e). These regions extend from the relatively high-density plot center toward the lower-density outer edge, illustrating segmentation performance under spatially variable sampling density. Wood and foliage are shown in red and green, respectively.
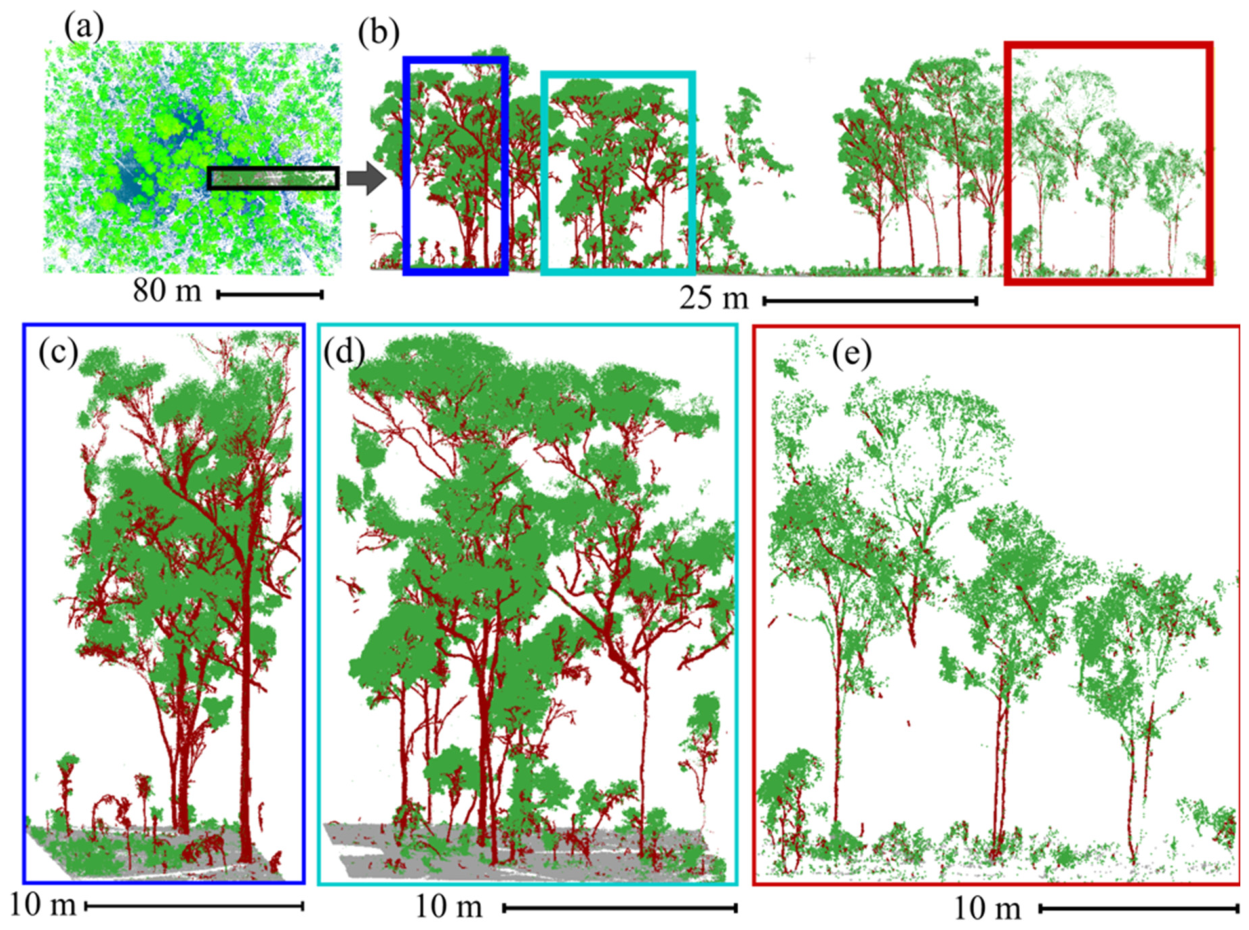
Figure 21.
Comparison of manually annotated reference labels and PT semantic segmentation for the BlueCat dataset. Panels (a) and (c) show the reference labels and corresponding PT predictions, respectively. Blue and yellow boxes indicate representative regions enlarged in (b–d) and (e–f). The black boxes in (e) and (f) are further enlarged in (g–i), where (g) and (h) show the reference labels and PT predictions, respectively. Panel (i) presents the corresponding PT leaf-probability map, demonstrating confidence estimates that are consistent with the predicted semantic labels in (h).
Figure 21.
Comparison of manually annotated reference labels and PT semantic segmentation for the BlueCat dataset. Panels (a) and (c) show the reference labels and corresponding PT predictions, respectively. Blue and yellow boxes indicate representative regions enlarged in (b–d) and (e–f). The black boxes in (e) and (f) are further enlarged in (g–i), where (g) and (h) show the reference labels and PT predictions, respectively. Panel (i) presents the corresponding PT leaf-probability map, demonstrating confidence estimates that are consistent with the predicted semantic labels in (h).
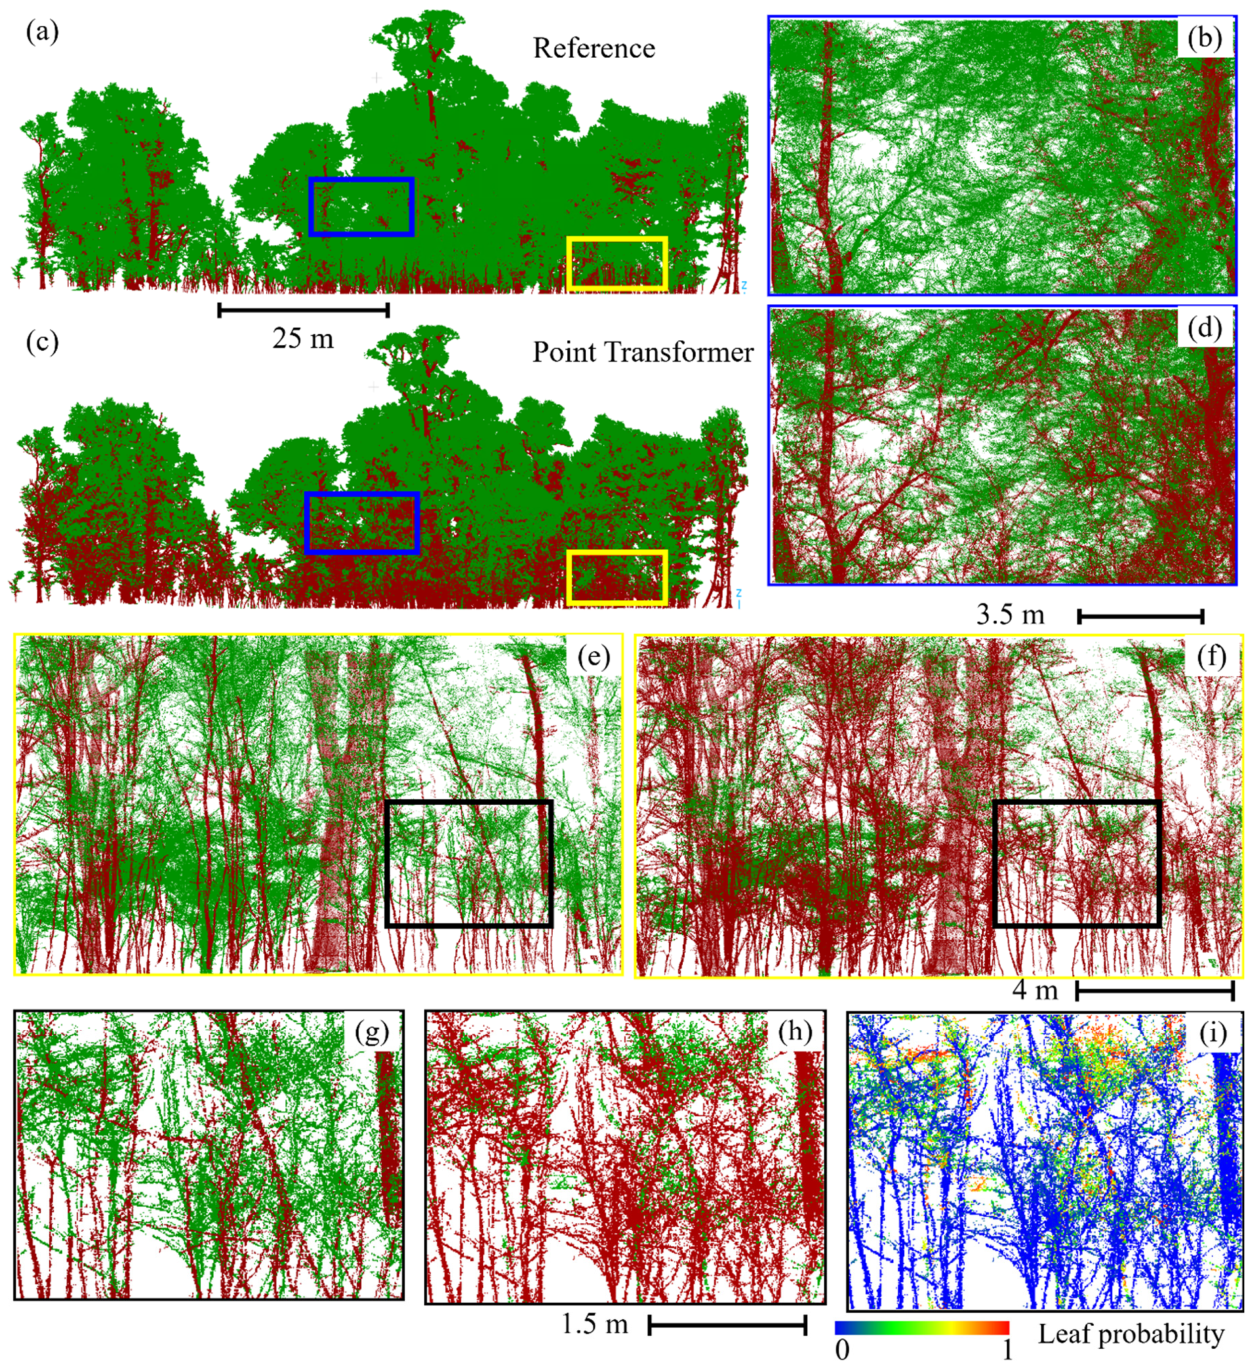
Figure 22.
Qualitative assessment of the proposed PT framework on the independent leaf-off Wytham Woods (UK) terrestrial LiDAR dataset. (a) Oblique view of the predicted wood-foliar semantics. (b) Top-down view showing the region selected for detailed inspection. (c) Enlarged view illustrating semantic predictions under leaf-off conditions, where extensive leaf abscission resulted in a strongly woody-dominated forest structure. This independent dataset demonstrates the robustness of the proposed framework under contrasting seasonal class distributions.
Figure 22.
Qualitative assessment of the proposed PT framework on the independent leaf-off Wytham Woods (UK) terrestrial LiDAR dataset. (a) Oblique view of the predicted wood-foliar semantics. (b) Top-down view showing the region selected for detailed inspection. (c) Enlarged view illustrating semantic predictions under leaf-off conditions, where extensive leaf abscission resulted in a strongly woody-dominated forest structure. This independent dataset demonstrates the robustness of the proposed framework under contrasting seasonal class distributions.
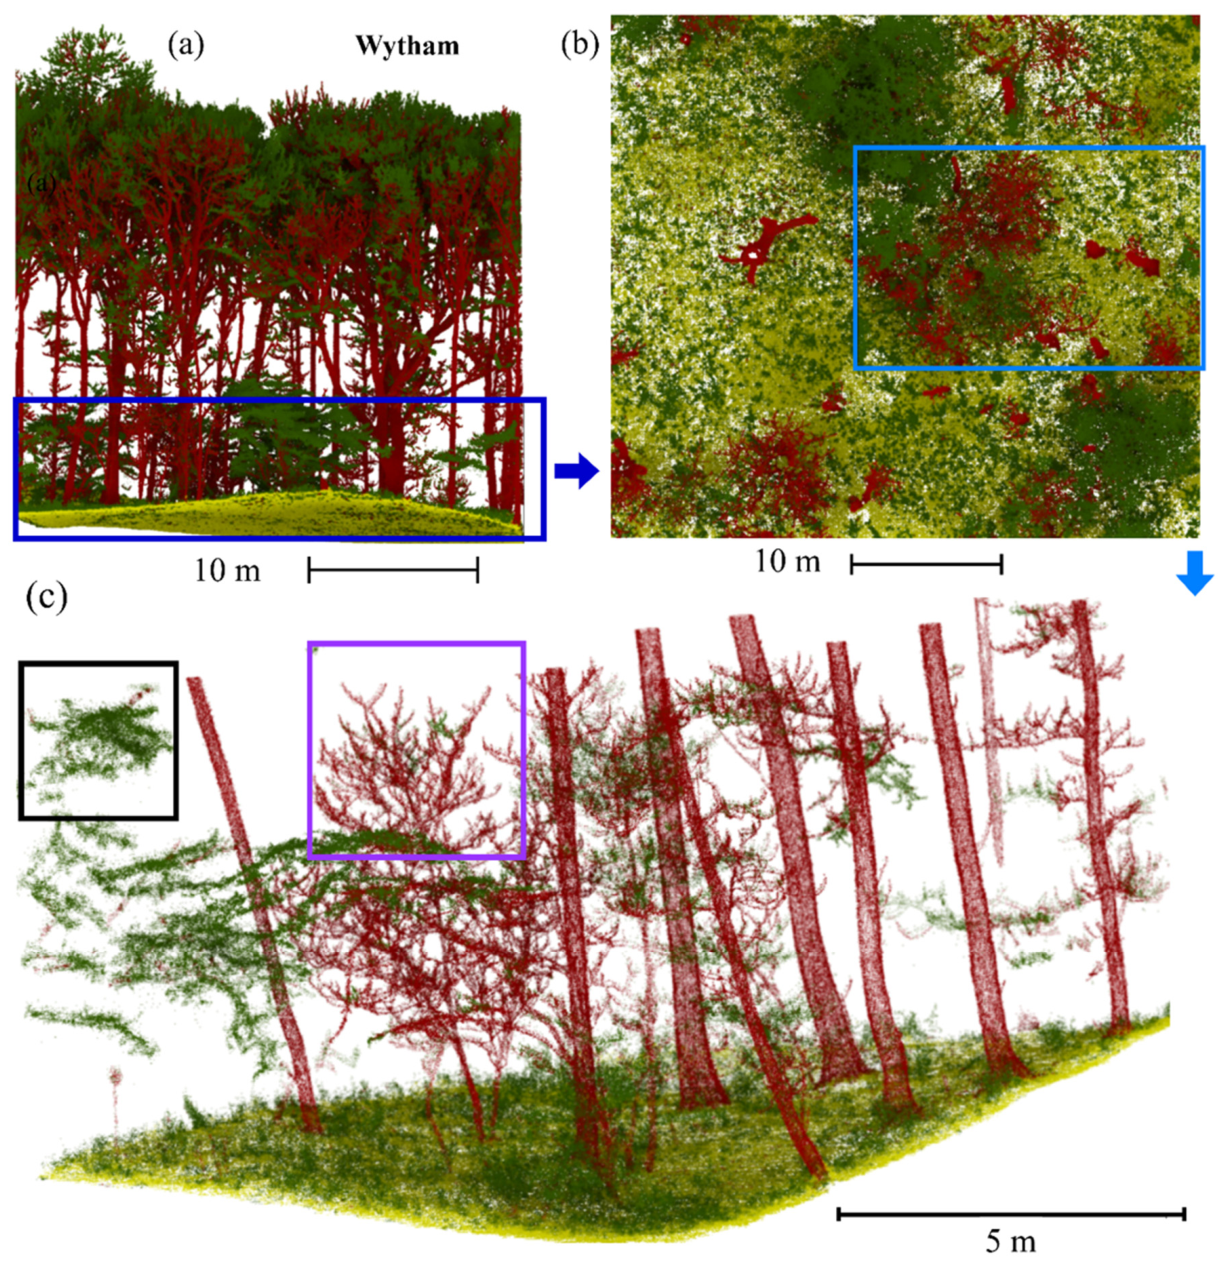
Figure 23.
Example of the proposed hierarchical fuel characterization workflow. (a) Wood-foliar semantics produced by PT, with ground (gray) classified by FAST-GC, wood (red), and foliage (green). (b) Geometric decomposition of the binary wood–foliar predictions using Points2WoodySeg into stems (red), branches (yellow), canopy foliage (green), surface foliage (light green), and woody shrubs and woody debris (blue). The multi-class decomposition presented in (b) is useful for next generation fire behavior models [85].
Figure 23.
Example of the proposed hierarchical fuel characterization workflow. (a) Wood-foliar semantics produced by PT, with ground (gray) classified by FAST-GC, wood (red), and foliage (green). (b) Geometric decomposition of the binary wood–foliar predictions using Points2WoodySeg into stems (red), branches (yellow), canopy foliage (green), surface foliage (light green), and woody shrubs and woody debris (blue). The multi-class decomposition presented in (b) is useful for next generation fire behavior models [85].
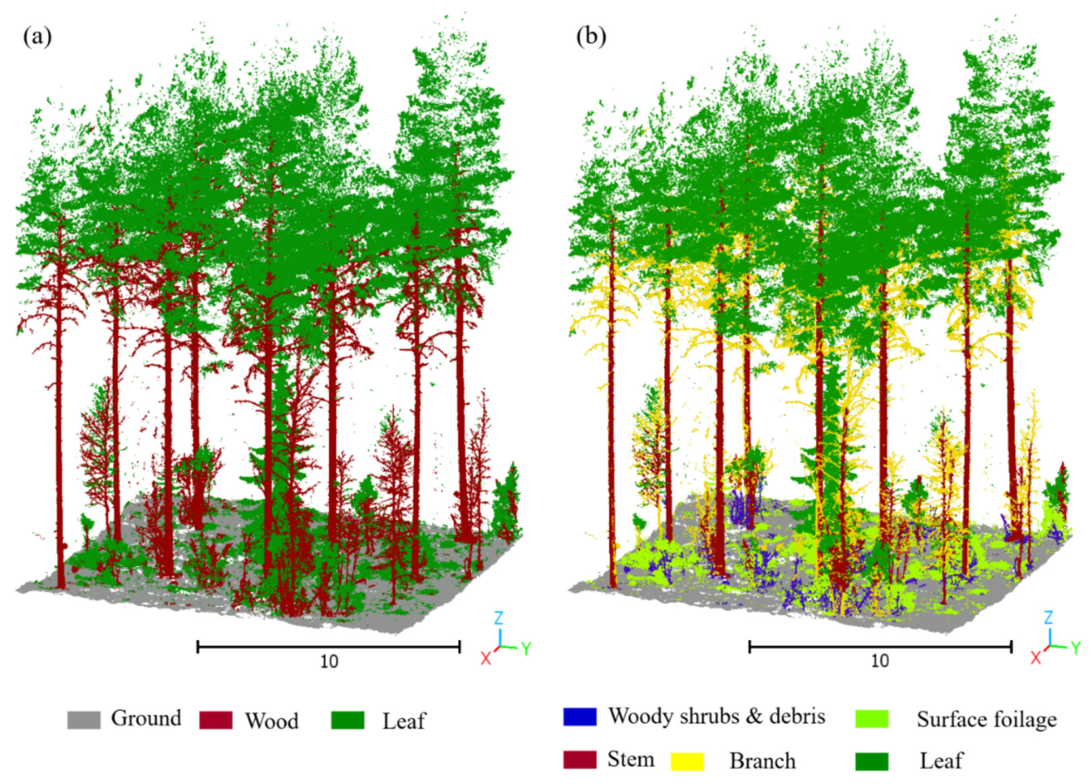
Figure 24.
Performance assessment of the Points2WoodySeg structural decomposition framework for stem, branch, and leaf segmentation derived from PT wood–leaf predictions (Figure 23a). (a) Vertical distribution of reference, predicted, and agreeing class fractions along normalized canopy height of PT wood-foliar semantics (Figure 23a). The boxed region (1) highlights localized branch–leaf disagreement within the mid-canopy transition zone (see representative examples in Figure 25). (b) Normalized confusion matrix between predicted and reference structural classes. (c) Class-specific Precision (P), Recall (R), F1-score (F1), and Intersection over Union (IoU). (d) Omission and commission errors for each structural class decomposition using the Points2woodyseg algorithm.
Figure 24.
Performance assessment of the Points2WoodySeg structural decomposition framework for stem, branch, and leaf segmentation derived from PT wood–leaf predictions (Figure 23a). (a) Vertical distribution of reference, predicted, and agreeing class fractions along normalized canopy height of PT wood-foliar semantics (Figure 23a). The boxed region (1) highlights localized branch–leaf disagreement within the mid-canopy transition zone (see representative examples in Figure 25). (b) Normalized confusion matrix between predicted and reference structural classes. (c) Class-specific Precision (P), Recall (R), F1-score (F1), and Intersection over Union (IoU). (d) Omission and commission errors for each structural class decomposition using the Points2woodyseg algorithm.
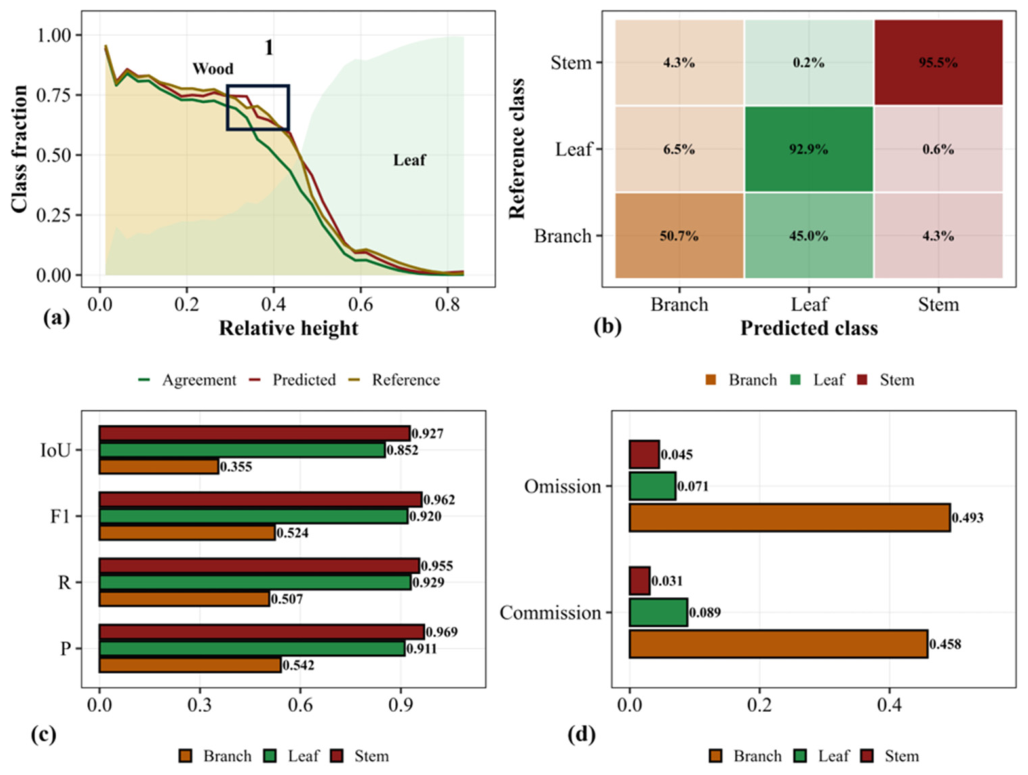
Figure 25.
Visual comparison between (a) manually annotated ForestSemantic benchmark labels and (b) PT wood–foliar semantics. Wood points are shown in red and leaf points in green. Insets highlight representative regions of disagreement. Subset 1 illustrates differences at occluded outer crown margins, whereas subset 2 shows additional fine wood structures identified by PT within the understory that were not assigned as wood in the benchmark annotations. These examples illustrate the uncertainty associated with manual wood–leaf annotation in a structurally complex understory.
Figure 25.
Visual comparison between (a) manually annotated ForestSemantic benchmark labels and (b) PT wood–foliar semantics. Wood points are shown in red and leaf points in green. Insets highlight representative regions of disagreement. Subset 1 illustrates differences at occluded outer crown margins, whereas subset 2 shows additional fine wood structures identified by PT within the understory that were not assigned as wood in the benchmark annotations. These examples illustrate the uncertainty associated with manual wood–leaf annotation in a structurally complex understory.
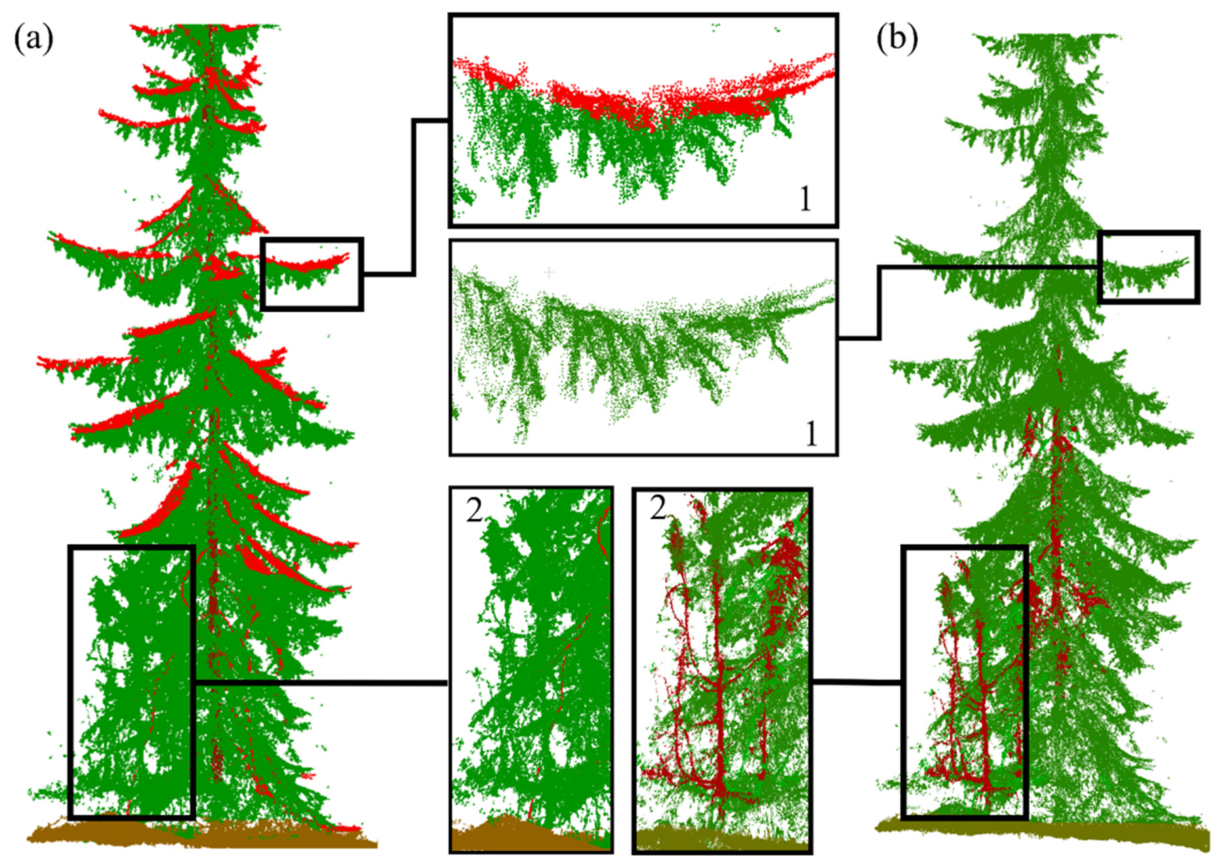
Figure 26.
Qualitative comparison of benchmark annotations and PT predictions for the BlueCat and TUWIEN. (a, f) Reference wood–leaf annotations (wood: red; foliage: green). (b, g) PT continuous leaf probability confidence – 0 lowest (blue), and 1 highest (yellow). (c, h) Spatial probability disagreement between the reference annotations and model predictions ( blue: lowest (0), and red: highest (1)). Enlarged views (d–e, i–j) highlight representative canopy regions where localized discrepancies occur. Although disagreement is concentrated within dense crowns (blue and white square-boxes in i and j) and fine woody structures (pink and white rectangles in c, e), the probability maps indicate consistent geometric representations (b, d, g, i).
Figure 26.
Qualitative comparison of benchmark annotations and PT predictions for the BlueCat and TUWIEN. (a, f) Reference wood–leaf annotations (wood: red; foliage: green). (b, g) PT continuous leaf probability confidence – 0 lowest (blue), and 1 highest (yellow). (c, h) Spatial probability disagreement between the reference annotations and model predictions ( blue: lowest (0), and red: highest (1)). Enlarged views (d–e, i–j) highlight representative canopy regions where localized discrepancies occur. Although disagreement is concentrated within dense crowns (blue and white square-boxes in i and j) and fine woody structures (pink and white rectangles in c, e), the probability maps indicate consistent geometric representations (b, d, g, i).
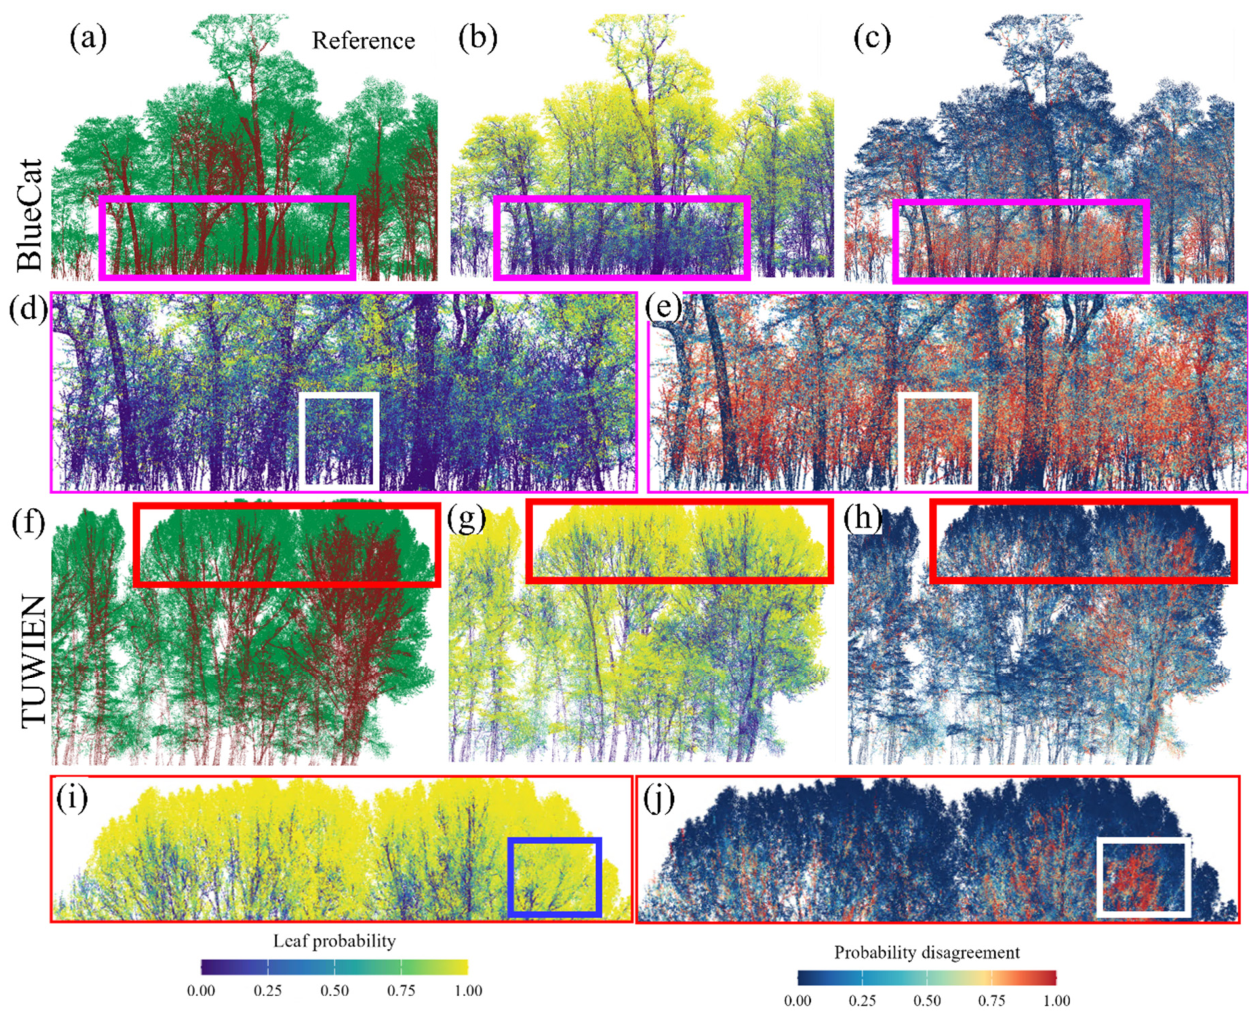

Table 1.
Summary of the main characteristics of open-source terrestrial LiDAR point clouds used in the DL framework’s training and validation.
Table 1.
Summary of the main characteristics of open-source terrestrial LiDAR point clouds used in the DL framework’s training and validation.
| Dataset | Country | Data type | Total | Sensor | labels |
| Lin3D [36] | China | Plot | 1 | TLS | Ground, understory, wood, leaf |
| SYSSIFOSS [66] | Germany | Individual trees | 11 | SLAM | Wood, leaf |
| SegmentedForest [59] | Austria | Plot | 5 | MLS | *Multi-class |
| USA | Plot | 3 | TLS | *Multi-class | |
| Plot-semantics [67] | Cameroon | plot | 1 | TLS | Wood, leaf |
| Finland | plot | 4 | TLS | Wood, leaf | |
| Spain | plot | 3 | TLS | Wood, leaf | |
| Poland | plot | 4 | TLS | Wood, leaf |
* Multi-class: Semantic labels comprising 16 manually annotated vegetation and non-vegetation categories, including ground and ground vegetation, shrubs, understory and lower-canopy trees, stems, branches and foliage, down wood, stumps, ivy, and ancillary non-vegetation objects (e.g., rocks, stakes, and people), following the SegmentedForests annotation scheme [68].
Table 2.
Summary of main characteristics of open-source benchmark terrestrial LiDAR point clouds used for generalization and transferability assessment of the development of a DL framework.
Table 2.
Summary of main characteristics of open-source benchmark terrestrial LiDAR point clouds used for generalization and transferability assessment of the development of a DL framework.
| Dataset | Country | Type | Total | labels |
| TLS [71,72] | Finland and Canada | plot | 12 | Leaf-wood |
| Lin3D [36] | China | plot | 5 | Ground, understory, wood, leaf |
| Tropical [28] | Australia | Individual tree | 147 | Wood-leaf |
| LeWOS [73] | Cameroon | Individual tree | 61 | Wood-leaf |
| ForestSemantic [74] | Finland | plot | 1 | Ground, understory, stem, branches, leaf |
Table 3.
Summary of main characteristics of open-source global terrestrial LiDAR point clouds used for transferability assessment across diverse global forest ecosystems.
Table 3.
Summary of main characteristics of open-source global terrestrial LiDAR point clouds used for transferability assessment across diverse global forest ecosystems.
| Dataset | Country | Type | Total | Sensor |
| SegmentedForest [59] | Spain, Austria, UK, USA | Plot | 14 | TLS, MLS |
| Wytham woods [31,39] | UK | Plot | 1 | TLS |
| BlueCat [31] | Czech Republic | Plot | 1 | TLS |
| Robson Creek [39] | Australia | Plot | 1 | TLS |
| Ofental [39] | Germany | Plot | 1 | TLS |
| Australia | Australia | Plot | 1 | TLS |
| Mathow [77] | USA | Plot | 1 | TLS |
| Litchfield [39] | Australia | Plot | 1 | TLS |
| TUWIEN [78] | Austria | Plot | 1 | ULS |
| NIBIO_MLS | Austria | Plot | 1 | MLS |
Table 4.
Performance of the evaluated DL architectures on five spatially held-out Lin3D plots excluded from model training and validation. Metrics include overall accuracy (OA), mean Intersection over Union (mIoU), macro F1-score (MF1), Matthew’s correlation coefficient (MCC), wood F1-score (WF1), wood Intersection over Union (WIoU), wood precision (WP), wood recall (WR), and leaf F1-score (LF1). All values are reported as percentages.
Table 4.
Performance of the evaluated DL architectures on five spatially held-out Lin3D plots excluded from model training and validation. Metrics include overall accuracy (OA), mean Intersection over Union (mIoU), macro F1-score (MF1), Matthew’s correlation coefficient (MCC), wood F1-score (WF1), wood Intersection over Union (WIoU), wood precision (WP), wood recall (WR), and leaf F1-score (LF1). All values are reported as percentages.
| Model | OA | mIoU | MF1 | MCC | WF1 | WIoU | WP | WR | LF1 |
| PT | 92.35 | 85.12 | 91.93 | 84.08 | 90.09 | 81.97 | 94.11 | 86.41 | 93.77 |
| PointNet++ | 91.33 | 83.09 | 90.71 | 82.27 | 88.31 | 79.07 | 96.62 | 81.32 | 93.11 |
| PointNeXt | 91.13 | 82.71 | 90.48 | 81.89 | 87.99 | 78.56 | 96.73 | 80.70 | 92.97 |
Table 5.
Overall dataset-level semantic segmentation performance across the evaluated benchmark datasets. Performance is summarized using Overall Accuracy (oACC), mean Accuracy (mACC), Balanced Accuracy (BA), mean Intersection over Union (mIoU), Macro F1-score (MF1), and Matthews Correlation Coefficient (MCC). Higher values indicate better classification performance for all evaluation metrics.
Table 5.
Overall dataset-level semantic segmentation performance across the evaluated benchmark datasets. Performance is summarized using Overall Accuracy (oACC), mean Accuracy (mACC), Balanced Accuracy (BA), mean Intersection over Union (mIoU), Macro F1-score (MF1), and Matthews Correlation Coefficient (MCC). Higher values indicate better classification performance for all evaluation metrics.
| Dataset | Total Pts (million) | oACC | mACC | BA | mIoU | MF1 | MCC | WF1 | WP | WR |
| TLS plots | 133.71 | 91.63 | 87.60 | 87.57 | 77.57 | 86.80 | 73.65 | 78.82 | 76.72 | 81.04 |
| Tropical Tree | 43.37 | 94.09 | 92.66 | 92.66 | 84.41 | 91.33 | 82.78 | 86.44 | 82.97 | 90.21 |
| LeWoS Trees | 183.89 | 93.75 | 93.57 | 93.57 | 86.57 | 92.73 | 85.57 | 90.01 | 87.11 | 93.11 |
Table 6.
Comparative assessment of wood–foliar semantics on the Tropical Tree benchmark. Performance is summarized using Overall Accuracy (OA), Leaf Intersection over Union (LeIoU), Wood Intersection over Union (WIoU), and mean Intersection over Union (mIoU). Higher values indicate better segmentation performance.
Table 6.
Comparative assessment of wood–foliar semantics on the Tropical Tree benchmark. Performance is summarized using Overall Accuracy (OA), Leaf Intersection over Union (LeIoU), Wood Intersection over Union (WIoU), and mean Intersection over Union (mIoU). Higher values indicate better segmentation performance.
| Model | Train/test/validate split? | Evaluation protocol | OA | LeIoU | WIoU | mIoU |
| GBS | Yes | Same-dataset held-out test | 91.90 | 90.20 | 67.80 | 79.00 |
| LeWoS | Yes | Same-dataset held-out test | 93.70 | 92.30 | 73.60 | 82.90 |
| RandLA-Net | Yes | Same-dataset held-out test | 95.20 | 93.90 | 81.80 | 87.90 |
| KPConv | Yes | Same-dataset held-out test | 96.20 | 95.20 | 84.20 | 89.70 |
| PT | Yes | Same-dataset held-out test | 96.50 | 95.60 | 85.80 | 90.70 |
| PT (ours) | No | cross-dataset inference | 94.09 | 92.72 | 76.11 | 84.41 |
Table 7.
Comparative assessment of semantic segmentation on the Lin3D v0.1 (TLS) benchmark. Performance of the original Multi-platform Synergistic Training (MST) framework and the PT under their respective evaluation protocols. Performance is summarized using Overall Accuracy (OA), mean Accuracy (mACC), mean Intersection over Union (mIoU), Leaf Intersection over Union (LeIoU), and Wood Intersection over Union (WIoU).
Table 7.
Comparative assessment of semantic segmentation on the Lin3D v0.1 (TLS) benchmark. Performance of the original Multi-platform Synergistic Training (MST) framework and the PT under their respective evaluation protocols. Performance is summarized using Overall Accuracy (OA), mean Accuracy (mACC), mean Intersection over Union (mIoU), Leaf Intersection over Union (LeIoU), and Wood Intersection over Union (WIoU).
| Model | Train/test/validate split? | OA (%) | mACC (%) | mIoU (%) |
| MST [37] | Yes | 94.76 | 85.59 | 79.48 |
| PT (Ours) | spatial hold-out | 91.82 | 90.01 | 83.40 |
Table 8.
Comparative assessment of wood–foliar semantic segmentation performance on the LeWoS benchmark. The original LeWoS framework was evaluated using the published tree-level protocol, whereas the proposed Point Transformer (PT) was evaluated using aggregate point-wise inference. Performance is reported using Overall Accuracy (OA), Wood Recall (WR), and Wood Specificity (WS). Higher values indicate better segmentation performance.
Table 8.
Comparative assessment of wood–foliar semantic segmentation performance on the LeWoS benchmark. The original LeWoS framework was evaluated using the published tree-level protocol, whereas the proposed Point Transformer (PT) was evaluated using aggregate point-wise inference. Performance is reported using Overall Accuracy (OA), Wood Recall (WR), and Wood Specificity (WS). Higher values indicate better segmentation performance.
| Model | Train/validation/test split? | Evaluation protocol | OA (%) | WR (%) | Wood Specificity (%) |
| LeWoS | Yes | Tree-level mean ± SD | 91.0 ± 3.0 | 92.0 ± 4.0 | 89.0 ± 6.0 |
| PT (ours) | No | Aggregate point-wise evaluation | 93.75 | 93.11 | 94.02 |
Disclaimer/Publisher’s Note: The statements, opinions and data contained in all publications are solely those of the individual author(s) and contributor(s) and not of MDPI and/or the editor(s). MDPI and/or the editor(s) disclaim responsibility for any injury to people or property resulting from any ideas, methods, instructions or products referred to in the content. |
© 2026 by the authors. Licensee MDPI, Basel, Switzerland. This article is an open access article distributed under the terms and conditions of the Creative Commons Attribution (CC BY) license.
Copyright: This open access article is published under a Creative Commons CC BY 4.0 license, which permit the free download, distribution, and reuse, provided that the author and preprint are cited in any reuse.