
Submitted:
08 August 2026
Posted:
11 August 2026
You are already at the latest version
Abstract
Background/Objectives: Mean arterial pressure (MAP) is an incomplete surrogate of systemic perfusion: cardiac index (CI) and MAP can become dissociated. Recent cardiac surgery studies report that the burden of low CI during normotensive periods is associated with acute kidney injury (AKI). Whether this pressure--flow dissociation occurs in major aortic surgery and is modulated by the choice of arterial-pressure-derived monitoring strategy (FloTrac vs Acumen IQ/Hypotension Prediction Index, HPI) is unknown. Methods: CI-focused secondary analysis of 100 major aortic surgery patients from a prior MAP-based cohort. Continuous CI signals were newly extracted from the original HemoSphere exports. The primary metric was the percentage of monitoring time with CI<2.2L/min/m2 during MAP\(\geq\) 65mmHg; the primary outcome was AKI by KDIGO criteria. Multivariable logistic regression adjusted for baseline demographics, comorbidities, preoperative MAP, surgery duration, and monitoring strategy, with Holm–Bonferroni correction within test families. Reported per STROBE. Results: Pressure–flow dissociation was frequent: low CI during normotension occurred in 94% of patients at CI<2.5 (median burden 27%). The HPI group had numerically lower low-CI burden and higher mean MAP (87 vs 84mmHg, \(p_{\mathrm{raw}} = 0.008\)). AKI occurred in 34/99 evaluable patients (FloTrac 19/49, 38.8%; HPI 15/50, 30.0%). AKI patients did not have higher low CI burden than no-AKI patients (median 5.2% vs 7.6%, \(p = 0.73\)). In multivariable regression, neither low CI burden (adjusted OR 0.88 per 10-pp increase, 95% CI 0.67–1.12, \(p = 0.33\)) nor HPI assignment (adjusted OR 0.57, 95% CI 0.20--1.53, \(p = 0.27\)) was associated with AKI. Sensitivity, time-to-event, and heart rate × CI interaction analyses yielded uniformly null findings.Conclusions: Pressure–flow dissociation is frequent in major aortic surgery, and HPI monitoring modifies the haemodynamic pattern. However, neither the low CI burden nor the choice of monitoring strategy was associated with postoperative AKI, suggesting a boundary condition on the generalisability of recent cardiac surgery CI–AKI associations. Definitive evidence requires prospective randomised evaluation (HYPE-AORTA, NCT07510451).
Keywords:
intraoperative haemodynamics
; cardiac index
; Hypotension Prediction Index
; FloTrac
; aortic surgery
; acute kidney injury
; pressure-flow dissociation
1. Introduction
Intraoperative hypotension during major non-cardiac surgery is associated with postoperative acute kidney injury (AKI), myocardial injury, and increased mortality, with risk proportional to depth and duration of mean arterial pressure (MAP) < 65 mmHg [1,2,3]. However, MAP is an incomplete surrogate of systemic perfusion: because oxygen delivery depends largely on cardiac output [8], and because MAP reflects the interaction between cardiac output and systemic vascular resistance [7], preserved arterial pressure may coexist with low-flow states [4,5]. Organ-specific autoregulation, however, may buffer this dissociation: renal blood flow and glomerular filtration rate are maintained over a wide range of perfusion pressure (approximately 80–180 mmHg) by intrarenal myogenic and tubuloglomerular feedback mechanisms [6].
Two recent cardiac surgery studies suggest that this pressure–flow dissociation has clinical consequences. Goeddel et al. reported in 101 coronary artery bypass patients that low cardiac index (< 2 L/min/m2) occurred for a mean of 87 min per case, two-thirds of which coincided with normal MAP, and that cumulative duration of low CI was associated with AKI [10]. Demirjian et al. showed in 40,426 cardiac surgery patients that CI, heart rate, central venous pressure (CVP), and MAP were each independent predictors of AKI in multivariable models, with clinically important heart rate × CI and CVP × MAP interactions [13]. Whether these observations extend to major aortic surgery—a fundamentally different physiology without cardiopulmonary bypass, dominated by aortic cross-clamping and declamping insults—is unknown.
Our group recently reported a MAP-focused comparison of HPI vs FloTrac monitoring in 100 patients undergoing major aortic surgery [9]. The primary endpoint (time-weighted MAP < 65 mmHg) did not differ, but HPI use was associated with significantly increased hypertensive exposure (), suggesting algorithm-driven over-correction. The question of whether HPI monitoring modulates cardiac index (CI) behaviour—particularly during normotensive periods—was not addressed.
We hypothesised that in major aortic surgery: (1) pressure–flow dissociation is common; (2) HPI-guided management is associated with a lower burden of low CI during normotension than FloTrac; and (3) this burden is associated with postoperative AKI. To test these hypotheses, we performed a complementary CI-focused analysis of the cohort previously reported by Szrama et al. [9] using continuous CI signals newly extracted from the original HemoSphere exports.
2. Materials and Methods
2.1. Study Design and Ethical Approval
This is a complementary, cardiac-index-focused secondary analysis of the retrospective single-centre cohort of patients undergoing major aortic surgery in the First Department of Anaesthesiology and Intensive Care of the Medical University Hospital in Poznan, Poland, between 1 January 2023 and 30 June 2025, previously reported by Szrama et al. [9]. The original study was approved by the Bioethics Committee of the Poznan University of Medical Sciences (protocol number 409/25, date of approval 28 May 2025), and the Institutional Review Board waived the requirement for informed consent because of the retrospective design. The continuous cardiac index signals analysed here were newly extracted from the original HemoSphere monitoring exports collected under that approval and were not analysed or reported in the prior publication; no additional patient data were collected for the present analysis. The study is reported in accordance with the STROBE statement for cohort studies.
2.2. Study Population
We included consecutive patients (≥ 18 years, ASA III or IV) who underwent elective major aortic surgery (open or endovascular repair of abdominal aortic aneurysm, Leriche syndrome, or related vascular pathologies) between 1 January 2023 and 30 June 2025. All patients had received continuous intraoperative haemodynamic monitoring using either the FloTrac sensor (Edwards Lifesciences, Irvine, CA, USA) for arterial pressure-derived cardiac output, or the Acumen IQ sensor (Edwards Lifesciences), which additionally provides the Hypotension Prediction Index (HPI). Sensor selection in this retrospective cohort was based on clinical preference and device availability; no formal randomisation was performed. Patients without complete HemoSphere data export or without baseline clinical metadata were excluded.
A complementary randomised controlled trial (HYPE-AORTA, ClinicalTrials.gov NCT07510451) is concurrently underway at the same centre; the retrospective cohort reported here is distinct from the RCT population.
Relationship to Prior Publication Using the Same Cohort
The patient cohort overlaps with that reported by Szrama et al. [9], which examined mean arterial pressure (MAP)-derived endpoints (time-weighted average MAP < 65 mmHg as the primary endpoint, plus hypertension exposure as a safety endpoint). The present analysis addresses a distinct research question (pressure–flow dissociation, defined as low CI co-occurring with preserved MAP, and its association with AKI), uses a different primary exposure variable (CI-based metrics rather than MAP-based metrics), and reports a multivariable AKI-prediction analysis not undertaken in the prior publication. The continuous CI signals analysed here required de novo extraction from the original HemoSphere export files and were not analysed or reported by Szrama et al.; the demographic, intraoperative, and outcome data were re-used to link CI metrics to outcomes. We disclose this overlap in accordance with ICMJE recommendations on overlapping publications and explicitly note that no CI-based metric or AKI prediction analysis from the present manuscript has been reported elsewhere.
2.3. Haemodynamic Data Acquisition
All patients were monitored using the HemoSphere advanced monitoring platform (Edwards Lifesciences) connected to a radial arterial line. Cardiac index (CI) and mean arterial pressure (MAP) were continuously recorded at approximately 20-second intervals throughout the intraoperative period; the HPI score was additionally recorded in the Acumen IQ arm. Data were exported to per-patient Excel (XML SpreadsheetML) files via the HemoSphere export feature.
2.4. Data Extraction and Processing
Intraoperative haemodynamic data were exported from the HemoSphere platform and processed using Acumen Analytics Software (Edwards Lifesciences Corp., Irvine, CA, USA), as previously described [9]. For the present CI-focused analysis, continuous CI and MAP time-series (sampled at ∼20-second intervals from the same arterial waveform) and demographic metadata were extracted from the original HemoSphere export files of the prior cohort. HemoSphere files were matched 1:1 to clinical records by date, age, and body surface area, with manual review of any ambiguous matches; full computational details of the extraction pipeline are available from the corresponding authors on reasonable request.
2.5. Definitions
- Normotensive period: any monitoring interval with MAP ≥ 65 mmHg.
- Hypotensive period: any monitoring interval with MAP < 65 mmHg.
- Low CI during normotension (pressure–flow dissociation): any interval where CI falls below a specified threshold (2.0, 2.2, or 2.5 L/min/m2) while MAP is simultaneously ≥ 65 mmHg. The CI signal was continuously displayed on the bedside HemoSphere monitor throughout each procedure; the phenomenon therefore reflects clinically visible but unaddressed low flow, not hidden physiology.
- Burden of low CI during normotension: percentage of total monitoring time meeting the above definition. The primary analytic threshold was CI < 2.2 L/min/m2. A stricter CI < 2.0 L/min/m2 threshold was evaluated as a sensitivity definition, aligning with the absolute low-CI threshold used by Goeddel et al. [10].
- Time-weighted CI deficit during normotension: the area between the CI curve and the threshold (time-integral of ) restricted to normotensive periods.
2.6. Outcomes
Postoperative outcomes were extracted from the clinical database: AKI (per KDIGO criteria, based on serial postoperative serum creatinine measurements); myocardial injury after non-cardiac surgery (MINS)—defined operationally as at least one postoperative high-sensitivity cardiac troponin value above the assay-specific 99th percentile upper reference limit within 30 days after surgery, irrespective of ischaemic symptoms or electrocardiographic changes, consistent with the parent cohort definition [9]; in-hospital mortality; postoperative circulatory failure; postoperative respiratory failure; stroke; and reoperation within the index admission.
AKI verification against KDIGO criteria. AKI assignments were verified against serial postoperative serum creatinine trajectories using KDIGO Stage 1 or higher criteria, defined as a ≥1.5-fold increase from baseline within 7 days or an absolute increase of ≥26.5 mol/L within 48 h. One patient with missing AKI adjudication was excluded, reducing the FloTrac denominator to 49; the resulting AKI counts (FloTrac 19/49, HPI 15/50; total 34) match those reported by Szrama et al. [9].
2.7. Statistical Analysis
Patient characteristics are reported as median (interquartile range) for continuous variables and count (percentage) for categorical variables. Between-group comparisons (FloTrac vs HPI) used the Mann–Whitney U test for continuous variables and the chi-square test for categorical variables, matching the test choices in the parent publication [9].
The primary analytic monitoring metric was the burden of low CI < 2.2 L/min/m2 during normotensive periods (% of monitoring time). The primary analytic outcome was AKI. Secondary analyses examined burden of low CI at thresholds 2.0 and 2.5 L/min/m2 and other secondary outcomes (MINS, mortality, respiratory/circulatory failure).
The Holm–Bonferroni step-down procedure was applied within each family of inferential comparisons: (i) the 12 monitoring metrics in Table 2; (ii) the 5 secondary outcomes; and (iii) the sensitivity analyses across CI and MAP thresholds. The primary monitoring metric and the primary outcome were each tested in a single confirmatory analysis without further multiplicity adjustment. No adjustment for multiple comparisons was applied to baseline characteristics (Table 1), as these are descriptive and reported per CONSORT/STROBE convention to flag potential confounders for inclusion in multivariable models on the basis of clinical reasoning rather than statistical significance alone.
Multivariable logistic regression for AKI adjusted for candidate clinical covariates that included the identified baseline imbalances: age, BSA, hypertension, coronary artery disease, heart failure, prior myocardial infarction, diabetes mellitus, preoperative MAP, surgery duration, and monitoring strategy (HPI vs FloTrac). Sensitivity analyses repeated the primary group comparison across four MAP thresholds (60, 65, 70, 75 mmHg) and three CI thresholds. Two-sided p-values < 0.05 were considered statistically significant. Analyses were performed in Python 3.14.6 (pandas 2.3.3, numpy 2.3.4, scipy 1.17.1, statsmodels 0.14.6) and R 4.6.0 (tidyverse 2.0.0, survival 3.8-6, patchwork 1.3.2).
2.8. Data and Code Availability
The de-identified analytic dataset (100 patients × 71 variables) and complete reproducible analysis pipeline (Python preprocessing scripts and R analysis code) are archived at Zenodo under Restricted Access: https://doi.org/10.5281/zenodo.20747122. Access requests are reviewed by the corresponding authors in accordance with the Poznań University of Medical Sciences Bioethics Committee approval (protocol 409/25) and applicable institutional and GDPR data-sharing requirements. Raw HemoSphere exports, original patient identifiers, and admission/surgery dates are not redistributed and remain at the institution.
3. Results
3.1. Patient Population and Data Availability
We retrieved 105 intraoperative monitoring exports from the institutional archive covering January 2023 to June 2025. After removal of duplicate exports and retention of the most complete file for each patient, 100 unique patients were available and matched to the parent cohort reported by Szrama et al. [9]. The analytic cohort comprised 50 patients monitored with FloTrac (including three with the earlier-generation EV1000 platform) and 50 with the Acumen IQ/HPI sensor. Cardiac index and MAP were extracted from continuous arterial waveform-derived monitoring at approximately 20-second intervals.
Baseline characteristics of the 100 patients are presented in Table 1. The HPI group had higher prevalence of heart failure (30% vs 10%, ) and CAD (48% vs 26%, ), with a trend toward more prior MI (24% vs 10%, ); these imbalances justified multivariable adjustment. Median monitoring duration was 195 min (FloTrac) vs 178 min (HPI), corresponding to ∼600 measurements per patient.

Table 1.
Baseline characteristics of the cohort (). Continuous variables: median (IQR); Mann–Whitney U. Categorical: n (%); chi-square test. No adjustment for multiple comparisons (descriptive).
Table 1.
Baseline characteristics of the cohort (). Continuous variables: median (IQR); Mann–Whitney U. Categorical: n (%); chi-square test. No adjustment for multiple comparisons (descriptive).
| Variable | FloTrac () | HPI () | p |
|---|---|---|---|
| Age, years | 69 (66–75) | 70 (65–73) | 0.85 |
| Sex (male), n (%) | 37 (74) | 40 (80) | 0.476 |
| Body surface area, m2 | 1.8 (1.7–1.9) | 1.9 (1.7–2.0) | 0.36 |
| Preoperative MAP, mmHg | 100 (88–112) | 102 (92–110) | 0.59 |
| Surgery duration, min | 145 (115–179) | 140 (101–185) | 0.40 |
| Blood loss, mL | 700 (500–1075) | 700 (325–1000) | 0.86 |
| Comorbidities, n (%) | |||
| Hypertension | 43 (86) | 39 (78) | 0.298 |
| Heart failure | 5 (10) | 15 (30) | 0.012 * |
| Coronary artery disease | 13 (26) | 24 (48) | 0.023 * |
| Prior myocardial infarction | 5 (10) | 12 (24) | 0.062 |
| Diabetes mellitus | 10 (20) | 11 (22) | 0.806 |
| Chronic kidney disease | 11 (22) | 10 (20) | 0.806 |
| COPD | 7 (14) | 5 (10) | 0.538 |
| Smoking | 38 (76) | 38 (76) | 1.000 |
| Peripheral arterial disease | 47 (94) | 46 (92) | 0.695 |
* Statistically significant at uncorrected (descriptive, no multiplicity adjustment).
3.2. Primary Group Comparison—Burden of Low CI during Normotensive Periods
Low CI during normotensive periods was nearly universal: 94/100 (94%) had at least some time at CI < 2.5, 86/100 (86%) at CI < 2.2, and 78/100 (78%) at CI < 2.0.
The primary analytic metric (burden of low CI < 2.2 L/min/m2 during normotensive periods) was numerically lower in the HPI group than FloTrac (median 4.3% [IQR 0.8–17.5] vs 8.8% [IQR 1.3–30.4]; Mann–Whitney U ; Figure 1A), but this difference did not reach statistical significance and did not survive Holm–Bonferroni correction within the family of 12 monitoring metrics (). At the more liberal threshold of CI < 2.5, the HPI group had numerically lower burden (median 19.1% vs 29.7%, ), also not significant after correction. The most pronounced between-group difference was in mean MAP (FloTrac 83.5 vs HPI 87.2 mmHg; , ), although this did not remain statistically significant after Holm–Bonferroni adjustment. This is consistent with the higher mean MAP and greater hypertensive exposure previously reported by Szrama et al. in this cohort [9]. Selected monitoring metrics are shown in Table 2; Holm–Bonferroni adjustment was applied across the prespecified family of 12 metrics.
Table 2.
Selected intraoperative monitoring metrics by group (7 of 12 metrics in the prespecified family shown; full table in Supplementary Material). Median (IQR), Mann–Whitney U. Holm–Bonferroni adjustment was applied across the full family of 12 metrics; values reflect that family-wise correction.
Table 2.
Selected intraoperative monitoring metrics by group (7 of 12 metrics in the prespecified family shown; full table in Supplementary Material). Median (IQR), Mann–Whitney U. Holm–Bonferroni adjustment was applied across the full family of 12 metrics; values reflect that family-wise correction.
| Metric | FloTrac () | HPI () | ||
|---|---|---|---|---|
| Monitoring duration, min | 195 (152–230) | 178 (150–225) | 0.46 | 1.00 |
| Mean CI, L/min/m2 | 2.58 (2.37–2.83) | 2.73 (2.42–3.06) | 0.20 | 1.00 |
| Mean MAP, mmHg | 83.5 (78.9–87.6) | 87.2 (82.6–91.7) | 0.008 | 0.093 |
| % time MAP < 65 mmHg (hypotension) | 5.8 (3.2–9.1) | 4.3 (1.8–6.6) | 0.12 | 1.00 |
| % time CI < 2.5 & MAP ≥ 65 | 29.7 (12.5–60.7) | 19.1 (5.0–48.5) | 0.19 | 1.00 |
| % time CI < 2.2 & MAP ≥ 65 (primary) | 8.8 (1.3–30.4) | 4.3 (0.8–17.5) | 0.26 | 1.00 |
| % time CI < 2.0 & MAP ≥ 65 | 3.2 (0.2–10.5) | 1.6 (0.2–7.1) | 0.36 | 1.00 |
The proportion of time with overt hypotension (MAP < 65 mmHg) did not differ significantly between groups (median 4.3% vs 5.8%, ), confirming that the burden of low CI during normotension was not explained by between-group differences in hypotension exposure.
3.3. Sensitivity Analyses
The HPI < FloTrac direction was consistent across all 12 combinations of MAP thresholds (60, 65, 70, 75 mmHg) and CI thresholds (2.0, 2.2, 2.5 L/min/m2); median HPI/FloTrac ratios ranged from 0.31× to 0.65×, with uncorrected p-values 0.14–0.30. No sensitivity comparison survived Holm–Bonferroni correction.
3.4. Association with Postoperative Outcomes
AKI occurred in 34/99 evaluable patients (FloTrac 19/49, 38.8%; HPI 15/50, 30.0%; absolute difference 8.8 pp; relative risk 0.77, 95% CI 0.45–1.34), consistent with Szrama et al. [9]. MINS occurred in 17/100 (17%); in-hospital death in 6/100 (6%); respiratory failure in 9/100; circulatory failure in 19/100.
Contrary to our hypothesis, AKI patients did not have a higher burden of low CI during normotensive periods (median 5.2% [IQR 1.1–21.6] vs 7.6% [IQR 1.1–25.8]; ; Figure 1B). For other secondary outcomes, median low-CI burden during normotension was consistently numerically lower among patients with events than among those without events, opposite to the hypothesised direction (MINS 1.2% vs 7.6%, , ; death 2.5% vs 7.1%, ; circulatory failure 4.2% vs 7.6%, ; respiratory failure 0.7% vs 7.2%, ). None of these associations survived Holm–Bonferroni correction within the family of five outcomes.
3.5. Univariable and Multivariable Logistic Regression for AKI
In univariate logistic regression, the burden of low CI < 2.2 during normotension was not associated with AKI (OR 0.96 per 10-pp increase, 95% CI 0.76–1.17, ). In multivariable regression (Table 3), neither low-CI burden (adjusted OR 0.88 per 10-pp increase, 95% CI 0.67–1.12, ) nor HPI assignment (adjusted OR 0.57, 95% CI 0.20–1.53, ) was independently associated with AKI. The low-CI burden point estimate was opposite to the hypothesised direction, whereas the HPI point estimate was numerically toward lower AKI odds; however, wide confidence intervals were consistent with the null for both estimates. Coronary artery disease (adjusted OR 3.94, 95% CI 1.15–14.4, ) and surgery duration (adjusted OR 1.01 per minute, ) were associated with AKI in the full exploratory model.
Sensitivity analyses (Figure 2; Supplementary Table S1): reduced-predictor multivariable models yielded uniformly null findings (HPI OR 0.50–0.62 with ; low CI burden OR 0.88–0.91 with across three specifications). The null findings are not dependent on the choice of covariate set.
In an exploratory external comparison using a Goeddel-like joint hypotension/low-CI exposure definition (MAP < 65 mmHg and CI ≤ 2.0 L/min/m2; full AKI-evaluable cohort , 34 AKI events; Supplementary Section S4), the adjusted odds ratio per additional 5 min of joint exposure was 1.34 (95% CI 0.82–2.24, )—directionally consistent with the recent cardiac surgery cohort of Goeddel et al. [15] (adjusted OR 1.11 per 5 min, 95% CI 1.02–1.22) but statistically inconclusive. Hypotension alone was likewise not associated with AKI (adjusted OR per 5 min 1.09, 95% CI 0.86–1.40, ).
3.6. Exploratory Time-to-Event Analysis
As an exploratory analysis, we constructed Kaplan–Meier curves and Cox proportional hazards models for time to acute kidney injury, time to hospital discharge, and time to a composite organ-injury endpoint (Supplementary Material, Section S2, Figure S1). The time-to-event analyses were directionally consistent with the binary-endpoint analyses and did not support an HPI–outcome association: the adjusted hazard ratio for HPI vs FloTrac was 0.73 (95% CI 0.36–1.48, ) for time to AKI, 0.69 (0.44–1.09, ) for time to hospital discharge, and 0.86 (0.45–1.63, ) for the composite endpoint. Because the day of AKI onset was estimated from incomplete serial creatinine measurements (with imputation for cases lacking a clear KDIGO trigger day), we present this time-to-event analysis as exploratory rather than confirmatory.
3.7. Summary of the Multiple-Comparisons Framework
Holm–Bonferroni corrections were applied within each test family (12 monitoring metrics; 5 secondary outcomes; sensitivity analyses). Apart from an unadjusted difference in mean MAP (, , borderline), no inferential comparison remained significant after correction. The multivariable regression for AKI was likewise null. The principal interpretation is therefore one of negative results: pressure-flow dissociation is frequent in major aortic surgery, but in this retrospective cohort we did not detect an association with postoperative AKI, nor a difference in AKI rates between monitoring strategies.
4. Discussion
4.1. Principal Findings
We report three principal findings. First, pressure-flow dissociation was a frequent intraoperative phenomenon: low CI during normotensive periods occurred in 94% of patients at the CI < 2.5 threshold, with a median burden of ∼27% of monitoring time, despite continuous bedside CI display—extending to major aortic surgery the descriptive observation reported by Goeddel et al. in cardiac surgery [10]. Second, the choice of monitoring strategy modestly modified the haemodynamic pattern but did not change overall AKI rates: the HPI group had a numerically lower low-CI burden (∼40–50% lower median) and a higher mean MAP (87.2 vs 83.5 mmHg, , borderline after Holm–Bonferroni), but unadjusted AKI rates were similar (FloTrac 38.8%; HPI 30.0%; absolute difference 8.8 percentage points; RR 0.77). Third, and most importantly, we did not detect an association between the burden of low CI during normotension and postoperative AKI, contrary to our a priori hypothesis: AKI patients did not have a higher burden than no-AKI patients (median 5.2% vs 7.6%, ), and the multivariable adjusted OR was 0.88 per 10-percentage-point increase (95% CI 0.67–1.12, ). HPI assignment was likewise not independently associated with AKI (adjusted OR 0.57, 95% CI 0.20–1.53, ); the point estimate was numerically toward lower AKI odds but the wide confidence interval was consistent with the null. Sensitivity analyses with reduced-predictor models and an exploratory time-to-event analysis yielded uniformly null findings. Across secondary outcomes (MINS, in-hospital mortality, postoperative circulatory failure, and postoperative respiratory failure), the direction of unadjusted median differences did not support the hypothesis that greater low-CI burden during normotension was associated with worse postoperative outcomes.
4.2. Comparison with Prior Literature: A Boundary Condition for Cardiac Surgery Findings
Goeddel et al. [10] reported in 101 coronary artery bypass patients an exploratory association between low CI duration and AKI, and Demirjian et al. [13] showed in 40,426 cardiac surgery patients that CI, heart rate, CVP, and MAP were each independent AKI predictors, with a heart rate × CI interaction. We did not detect either the CI–AKI association or the heart rate × CI interaction in our cohort (exploratory analysis detailed in Supplementary Section S3: interaction ; no association of low CI burden with AKI in either HR stratum). The exploratory analysis was further limited by the absence of true CVP measurements in our HemoSphere exports (default constant 5 mmHg), precluding renal perfusion pressure analysis.
A coordinated programme of fine-mapping work in cardiac surgery has progressively refined this framework: from narrow-range MAP and CVP exposure mapping [14] to the recent joint MAP×CI analysis in CABG patients [15], in which the joint exposure to arterial hypotension and low cardiac index—but neither hypotension alone nor low CI alone—was associated with AKI (adjusted OR per 5 min = 1.11, 95% CI 1.02–1.22, ). Applying a simplified Goeddel-like joint exposure endpoint in our cohort yielded a point estimate that was directionally consistent but statistically inconclusive (adjusted OR per 5 min = 1.34, 95% CI 0.82–2.24, ; Supplementary Section S4). The analysis is, however, not methodologically harmonised with Goeddel et al. (whose specification entered all eight time-in-cell variables from a fully crossed MAP×CI quartile categorisation simultaneously, was restricted to pre- and post-cardiopulmonary-bypass periods, and adjusted for a broader covariate set; see Supplementary Section S4 for details). In keeping with the Goeddel 2026 pattern, hypotension alone was also not associated with AKI in our adjusted models. Taken together, these observations support the broader concept that pressure and flow are best interpreted jointly rather than as isolated targets.
These negative findings may indicate a clinically meaningful boundary condition on the generalisability of the cardiac surgery observations. Plausible explanations include: (i) the unique haemodynamic challenges of major aortic surgery (aortic cross-clamping, declamping, reperfusion) generating large transients that dominate over background CI fluctuations; (ii) the absence of cardiopulmonary bypass, which differs fundamentally from the post-CPB physiology studied in cardiac surgery; (iii) sample size and event count limitations (34 AKI events) underpowering main effects and especially HR–CI interaction, in a population where overt tachycardia was uncommon (median 3.5% time HR > 90 bpm, plausibly reflecting prevalent chronic beta-blocker therapy [9]); (iv) a true population-specific absence of association; and (v) intact intrarenal autoregulation, which maintains renal blood flow and glomerular filtration rate over a wide range of perfusion pressure (approximately 80–180 mmHg) via myogenic and tubuloglomerular feedback responses [6]—thereby buffering the kidney from transient systemic flow variability when MAP remains within the autoregulatory range, as it did for the majority of intraoperative time in our cohort. Renal autoregulation can be attenuated in chronic hypertension, diabetes, and chronic kidney disease [6], which may help explain why CI–AKI associations have been more readily detectable in the post-cardiopulmonary-bypass cardiac surgery population [10,13] than in our off-pump aortic cohort. These findings are also consistent with Maheshwari et al., who reported that the association between intraoperative MAP and postoperative complications was largely independent of cardiac index in major abdominal surgery [5]. The HPI algorithm itself integrates arterial waveform features and may prompt earlier intervention [11,12], consistent with our observed higher mean CI and lower low-CI burden in the HPI arm; however, this physiological surrogate difference did not translate into a measurable AKI difference, consistent with the broader literature in which surrogate-driven monitoring strategies frequently fail to demonstrate organ-protective effects [8].
4.3. Clinical Implications and Relationship to Prior MAP-Based Analysis
This analysis complements our group’s prior MAP-focused report in the same 100-patient cohort [9], which found no significant reduction in MAP-derived hypotension burden with HPI but observed significantly more hypertensive exposure (). Together with the present null CI findings, these results provide a converging signal: in this single-centre retrospective cohort, the choice of arterial-pressure-derived monitoring strategy modifies haemodynamic patterns at the margin but does not appear to translate into measurable differences in postoperative organ injury. Three clinical implications follow. First, our results argue against routine use of low CI burden as a clinical decision threshold in major aortic surgery without further evidence. Second, although HPI modifies the haemodynamic pattern, our data do not support organ-protective claims in this population. Third, definitive evidence requires prospective randomised evaluation; the HYPE-AORTA trial (NCT07510451) is currently enrolling at our centre, with planned protocol amendment to include low CI during normotension as a secondary endpoint.
4.4. Strengths and Limitations
Strengths include high per-patient density of monitoring data (∼600 measurements over 3 h), continuous CI alongside MAP from the same monitor, and prespecified multiple sensitivity analyses (Supplementary Material).
Limitations: (1) Single-centre, retrospective, non-randomised; HPI patients had a worse baseline cardiovascular risk profile, addressed by multivariable adjustment but with residual confounding possible. (2) Sample size limitations: 34 AKI events leave us underpowered to detect effects of the magnitude reported in larger cardiac surgery cohorts; wide 95% confidence intervals are consistent with both clinically meaningful effects and the null. Absence of evidence of association in our cohort is not evidence of absence in the broader population. (3) CVP was not available in our retrospective dataset, precluding renal perfusion pressure analysis. (4) The CI < 2.2 L/min/m2 threshold was operational and clinically familiar but has not been specifically validated as an AKI risk threshold in major aortic surgery. (5) Multiple thresholds and outcomes were examined, with Holm–Bonferroni correction within test families. (6) The primary multivariable model had ∼3 events per variable, below the conventional ≥10 EPV rule; reduced-predictor sensitivity models (Supplementary Table S1) yielded uniformly null findings, so null results are not dependent on covariate set. (7) Outcome ascertainment was not blinded. (8) Postoperative outcomes were extracted from the clinical database rather than formally adjudicated; MINS was defined operationally using postoperative high-sensitivity troponin elevation alone and was not centrally adjudicated for ischaemic versus non-ischaemic aetiology, so some events may represent postoperative myocardial injury not strictly attributable to ischaemia. (9) The day of AKI onset used in the exploratory time-to-event analysis was estimated from serial creatinine measurements that were sparse beyond postoperative day 3. (10) AKI was defined using KDIGO creatinine-based criteria relative to the preoperative baseline creatinine; patients with chronic kidney disease were therefore eligible for AKI diagnosis as AKI-on-CKD, but pre-existing renal dysfunction may increase susceptibility to postoperative creatinine changes and may contribute to residual confounding.
4.5. Conclusions
Pressure-flow dissociation is a frequent intraoperative phenomenon in major aortic surgery, and HPI monitoring modifies the haemodynamic pattern (higher mean MAP, numerically lower low-CI burden). However, in this retrospective cohort neither the burden of low CI during normotension nor the choice of monitoring strategy was associated with postoperative AKI. These findings suggest a boundary condition on the generalisability of the cardiac surgery CI–AKI association [10,13]. Definitive evidence in major aortic surgery requires prospective randomised evaluation (HYPE-AORTA, NCT07510451).
Supplementary Materials
The following supporting information can be downloaded at the website of this paper posted on Preprints.org, Supplement.pdf: Section S1: Sensitivity analyses of the multivariable logistic regression for AKI; Section S2: Exploratory time-to-event analysis (Kaplan–Meier and Cox proportional hazards); Section S3: Exploratory Demirjian-style heart-rate × low-CI interaction analysis; Section S4: Exploratory external comparison with Goeddel-like joint hypotension and low-CI exposure.
Author Contributions
Conceptualization, M.G., Ł.Ż., J.S. and P.S.; methodology, M.G., Ł.Ż. and J.S.; software, M.G.; validation, M.G., Ł.Ż., J.S. and P.S.; formal analysis, M.G., Ł.Ż. and J.S.; investigation, M.G., Ł.Ż. and K.K.; resources, M.G., J.S. and P.S.; data curation, M.G., Ł.Ż. and K.K.; writing—original draft preparation, M.G., Ł.Ż. and J.S.; writing—review and editing, M.G., Ł.Ż., J.S. and P.S.; visualization, M.G.; supervision, P.S.; project administration, M.G., J.S. and P.S. M.G. and Ł.Ż. contributed equally to this work and share first authorship. All authors have read and agreed to the published version of the manuscript.
Funding
This research received no external funding.
Institutional Review Board Statement
The study was conducted in accordance with the Declaration of Helsinki. The original protocol was approved by the Bioethics Committee of the Poznan University of Medical Sciences (protocol number 409/25, date of approval 28 May 2025).
Informed Consent Statement
The Institutional Review Board waived the requirement for informed consent because of the retrospective design of the original study.
Data Availability Statement
The de-identified analytic dataset (100 patients × 71 variables) and complete reproducible analysis pipeline (Python preprocessing scripts and R analysis code) are archived at Zenodo under Restricted Access: https://doi.org/10.5281/zenodo.20747122. Access requests are reviewed by the corresponding authors in accordance with the Poznań University of Medical Sciences Bioethics Committee approval (protocol 409/25) and applicable institutional and GDPR data-sharing requirements. Raw HemoSphere exports, original patient identifiers, and admission/surgery dates are not redistributed and remain at the institution.
Conflicts of Interest
The authors declare no conflicts of interest.
Acknowledgments
The authors thank Michał Gajda (First Department of Anaesthesiology and Intensive Care, Medical University Hospital in Poznan, Poland) for his contribution to perioperative data collection in the parent cohort study (Szrama et al., J. Clin. Med. 2025, 14, 8791), the source of monitoring data re-analysed here. The authors also thank the broader clinical staff at the First Department of Anaesthesiology and Intensive Care for their cooperation throughout the data collection period. The authors used large language model (LLM) tools, including Claude (Anthropic), during manuscript preparation to assist with language editing, drafting of methodological and statistical text, and scripting of data extraction and statistical analysis pipelines (Python and R). LLM tools were not used to generate study data, to make methodological or analytical decisions, or to draw scientific conclusions; all such decisions were made by the human authors. All AI-assisted text and analysis code were critically reviewed and verified by the human authors, who take full responsibility for the content.
Abbreviations
The following abbreviations are used in this manuscript:
| AKI | Acute Kidney Injury |
| BSA | Body Surface Area |
| CABG | Coronary Artery Bypass Graft |
| CAD | Coronary Artery Disease |
| CI | Cardiac Index |
| CPB | Cardiopulmonary Bypass |
| CVP | Central Venous Pressure |
| EPV | Events Per Variable |
| GDT | Goal-Directed Therapy |
| HPI | Hypotension Prediction Index |
| IQR | Interquartile Range |
| KDIGO | Kidney Disease: Improving Global Outcomes |
| MAP | Mean Arterial Pressure |
| MINS | Myocardial Injury after Non-cardiac Surgery |
| OR | Odds Ratio |
| STROBE | Strengthening the Reporting of Observational Studies in Epidemiology |
| TWA | Time-Weighted Average |
References
- Wesselink, E.M.; Kappen, T.H.; Torn, H.M.; Slooter, A.J.; van Klei, W.A. Intraoperative hypotension and the risk of postoperative adverse outcomes: A systematic review. Br. J. Anaesth. 2018, 121, 706–721. [Google Scholar] [CrossRef] [PubMed]
- Sessler, D.I.; Khanna, A.K. Perioperative myocardial injury and the contribution of hypotension. Intensive Care Med. 2018, 44, 811–822. [Google Scholar] [CrossRef] [PubMed]
- Salmasi, V.; Maheshwari, K.; Yang, D.; Mascha, E.J.; Singh, A.; Sessler, D.I.; Kurz, A. Relationship between Intraoperative Hypotension, Defined by Either Reduction from Baseline or Absolute Thresholds, and Acute Kidney and Myocardial Injury after Noncardiac Surgery: A Retrospective Cohort Analysis. Anesthesiology 2017, 126, 47–65. [Google Scholar] [CrossRef] [PubMed]
- Kouz, K.; Bergholz, A.; Timmermann, L.M.; et al. The Relation Between Mean Arterial Pressure and Cardiac Index in Major Abdominal Surgery Patients: A Prospective Observational Cohort Study. Anesth. Analg. 2022, 134, 322–329. [Google Scholar] [CrossRef] [PubMed]
- Maheshwari, K.; Pu, X.; Rivas, E.; et al. Association between intraoperative mean arterial pressure and postoperative complications is independent of cardiac index in patients undergoing noncardiac surgery. Br. J. Anaesth. 2021, 127, e102–e104. [Google Scholar] [CrossRef] [PubMed]
- Carlström, M.; Wilcox, C.S.; Arendshorst, W.J. Renal autoregulation in health and disease. Physiol. Rev. 2015, 95, 405–511. [Google Scholar] [CrossRef] [PubMed]
- Skowno, J.J.; Broadhead, M. Cardiac output measurement in pediatric anesthesia. Paediatr. Anaesth. 2008, 18, 1019–1028. [Google Scholar] [CrossRef] [PubMed]
- Mehta, N.; Fernandez-Bustamante, A.; Seres, T. A Review of Intraoperative Goal-Directed Therapy Using Arterial Waveform Analysis for Assessment of Cardiac Output. Sci. World J. 2014, 2014, 702964. [Google Scholar] [CrossRef] [PubMed]
- Szrama, J.; Gezela, M.; Żurański, Ł.; Kulas, K.; Gajda, M.; Smuszkiewicz, P.; Sobczyński, P. Hypotension Prediction Index Software Compared with Standard Advanced Haemodynamic Monitoring in Patients Undergoing Major Aortic Surgery: A Retrospective Study. J. Clin. Med. 2025, 14, 8791. [Google Scholar] [CrossRef] [PubMed]
- Goeddel, L.A.; Koffman, L.; Hernandez, M.; et al. Occurrence of Low Cardiac Index During Normotensive Periods in Cardiac Surgery: A Prospective Cohort Study Using Continuous Noninvasive Cardiac Output Monitoring. Anesth. Analg. 2025, 140, 77–86. [Google Scholar] [CrossRef] [PubMed]
- Hatib, F.; Jian, Z.; Buddi, S.; et al. Machine-learning Algorithm to Predict Hypotension Based on High-fidelity Arterial Pressure Waveform Analysis. Anesthesiology 2018, 129, 663–674. [Google Scholar] [CrossRef] [PubMed]
- Tsoumpa, M.; Kyttari, A.; Matiatou, S.; et al. The Use of the Hypotension Prediction Index Integrated in an Algorithm of Goal Directed Hemodynamic Treatment during Moderate and High-Risk Surgery. J. Clin. Med. 2021, 10, 5884. [Google Scholar] [CrossRef] [PubMed]
- Demirjian, S.; Bakaeen, F.; Tang, W.H.W.; Donaldson, C.; Taliercio, J.; Huml, A.; Gadegbeku, C.A.; Gillinov, A.M.; Insler, S. Hemodynamic Determinants of Cardiac Surgery-Associated Acute Kidney Injury. Crit. Care Explor. 2024, 6, e1063. [Google Scholar] [CrossRef] [PubMed]
- Goeddel, L.A.; Hernandez, M.; Koffman, L.; Murphy, Z.; Khanna, A.K.; Robich, M.; Whitman, G.; Zhou, X.; Bandeen-Roche, K.; Muschelli, J.; Parikh, C.R.; Lima, J.A.C.; Crainiceanu, C.M.; Brown, C.; Faraday, N. Fine-Mapping the Association of Acute Kidney Injury with Mean Arterial and Central Venous Pressures During Coronary Artery Bypass Surgery. Anesth. Analg. 2025, 140, 1439–1449. [Google Scholar] [CrossRef] [PubMed]
- Goeddel, L.A.; Koffman, L.; Zhou, X.; Hernandez, M.; Zhao, A.; Pasrija, C.; Saha, A.K.; Muschelli, J.; Parikh, C.R.; Crainiceanu, C.M.; Brown, C.; Khanna, A.K.; Faraday, N. Low cardiac index during periods of arterial hypotension and risk of acute kidney injury in cardiac surgery. Br. J. Anaesth. 2026. [Google Scholar] [CrossRef] [PubMed]
Figure 1.
Burden of low cardiac index during normotensive periods was not associated with postoperative AKI. (A) Distribution of low CI burden (% of monitoring time with CI < 2.2 L/min/m2 and MAP ≥ 65 mmHg) by monitoring strategy. The HPI group had a numerically lower median burden but the difference was not statistically significant. (B) Distribution of low CI burden by postoperative AKI outcome. Contrary to our hypothesis, patients who developed AKI did not have a higher burden of low CI during normotension; the directional pattern was opposite to that anticipated. Violin plots show distribution density with overlaid box plots (median and IQR) and individual data points. Panel A: ; Panel B: AKI-evaluable (1 patient excluded due to incomplete AKI adjudication).
Figure 1.
Burden of low cardiac index during normotensive periods was not associated with postoperative AKI. (A) Distribution of low CI burden (% of monitoring time with CI < 2.2 L/min/m2 and MAP ≥ 65 mmHg) by monitoring strategy. The HPI group had a numerically lower median burden but the difference was not statistically significant. (B) Distribution of low CI burden by postoperative AKI outcome. Contrary to our hypothesis, patients who developed AKI did not have a higher burden of low CI during normotension; the directional pattern was opposite to that anticipated. Violin plots show distribution density with overlaid box plots (median and IQR) and individual data points. Panel A: ; Panel B: AKI-evaluable (1 patient excluded due to incomplete AKI adjudication).
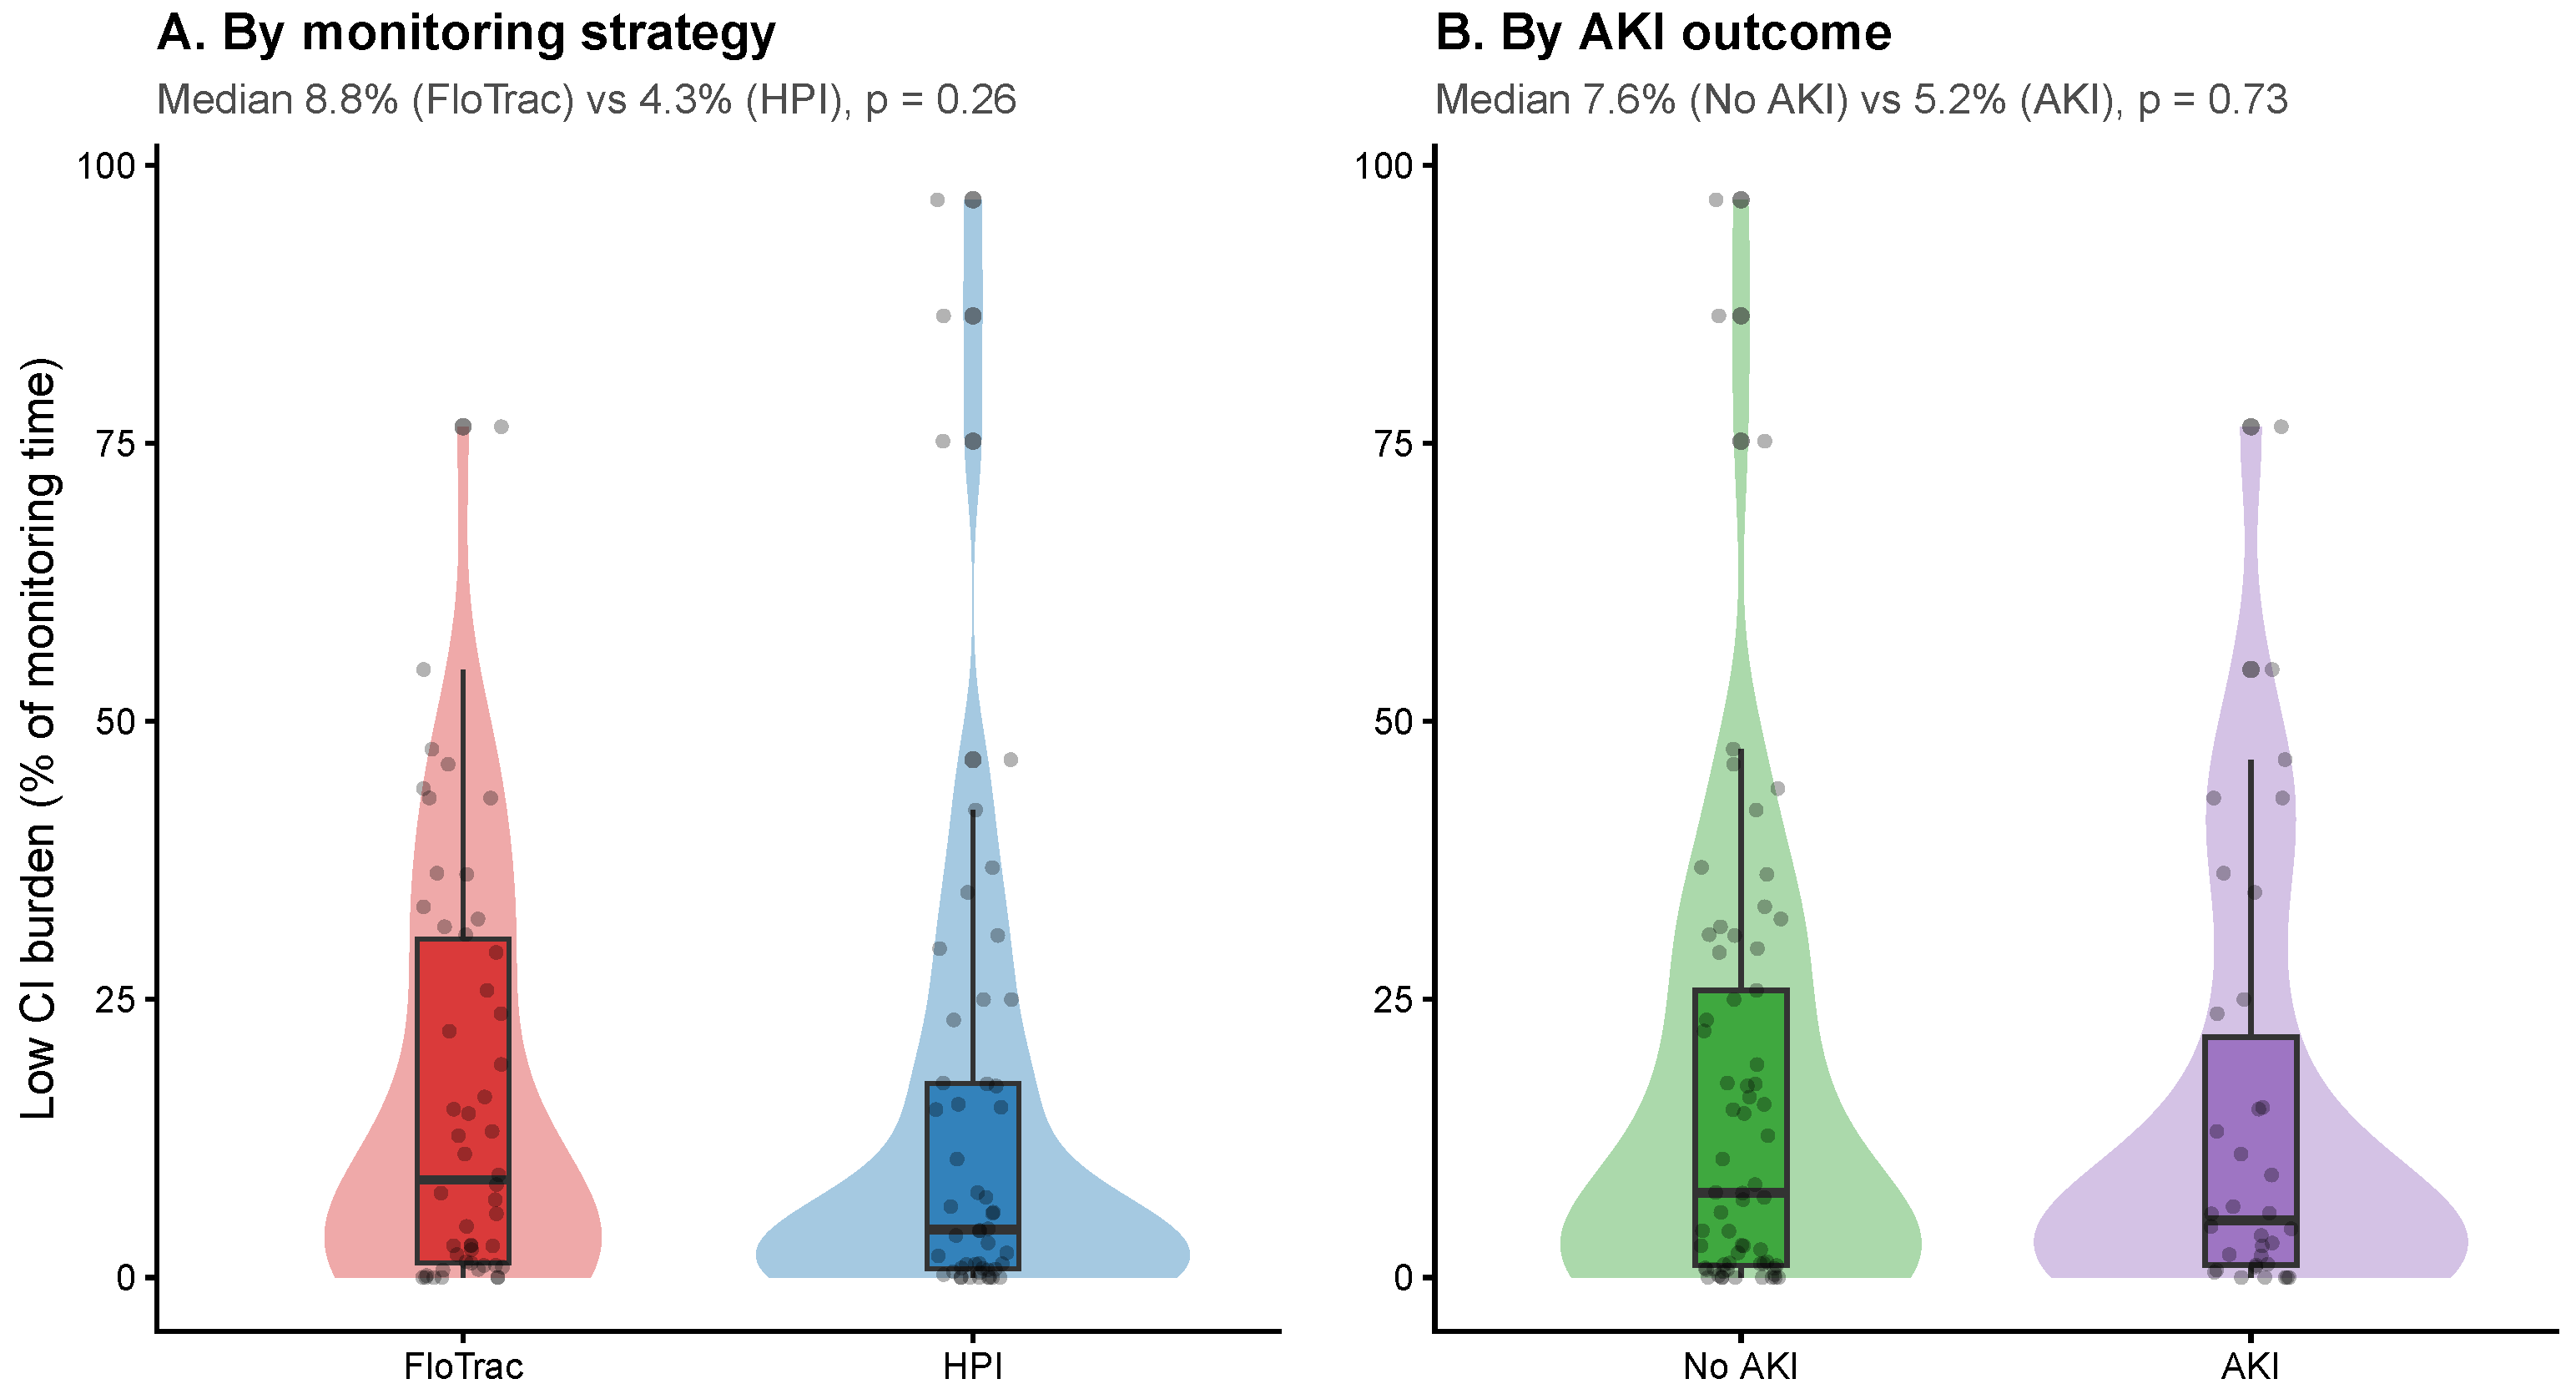
Figure 2.
Adjusted odds ratios for postoperative AKI from sensitivity models. Adjusted odds ratios (95% confidence intervals) for HPI vs FloTrac monitoring strategy and for low CI burden (per 10-percentage-point increase) from the primary model (Model 3, 11 predictors) and two reduced-predictor sensitivity models (Model 1: minimal, 4 predictors; Model 2: clinical, 6 predictors). EPV = events per variable. Model details and event counts in Supplementary Table S1. AKI-evaluable patients, 34 AKI events (1 patient excluded due to incomplete AKI adjudication).
Figure 2.
Adjusted odds ratios for postoperative AKI from sensitivity models. Adjusted odds ratios (95% confidence intervals) for HPI vs FloTrac monitoring strategy and for low CI burden (per 10-percentage-point increase) from the primary model (Model 3, 11 predictors) and two reduced-predictor sensitivity models (Model 1: minimal, 4 predictors; Model 2: clinical, 6 predictors). EPV = events per variable. Model details and event counts in Supplementary Table S1. AKI-evaluable patients, 34 AKI events (1 patient excluded due to incomplete AKI adjudication).
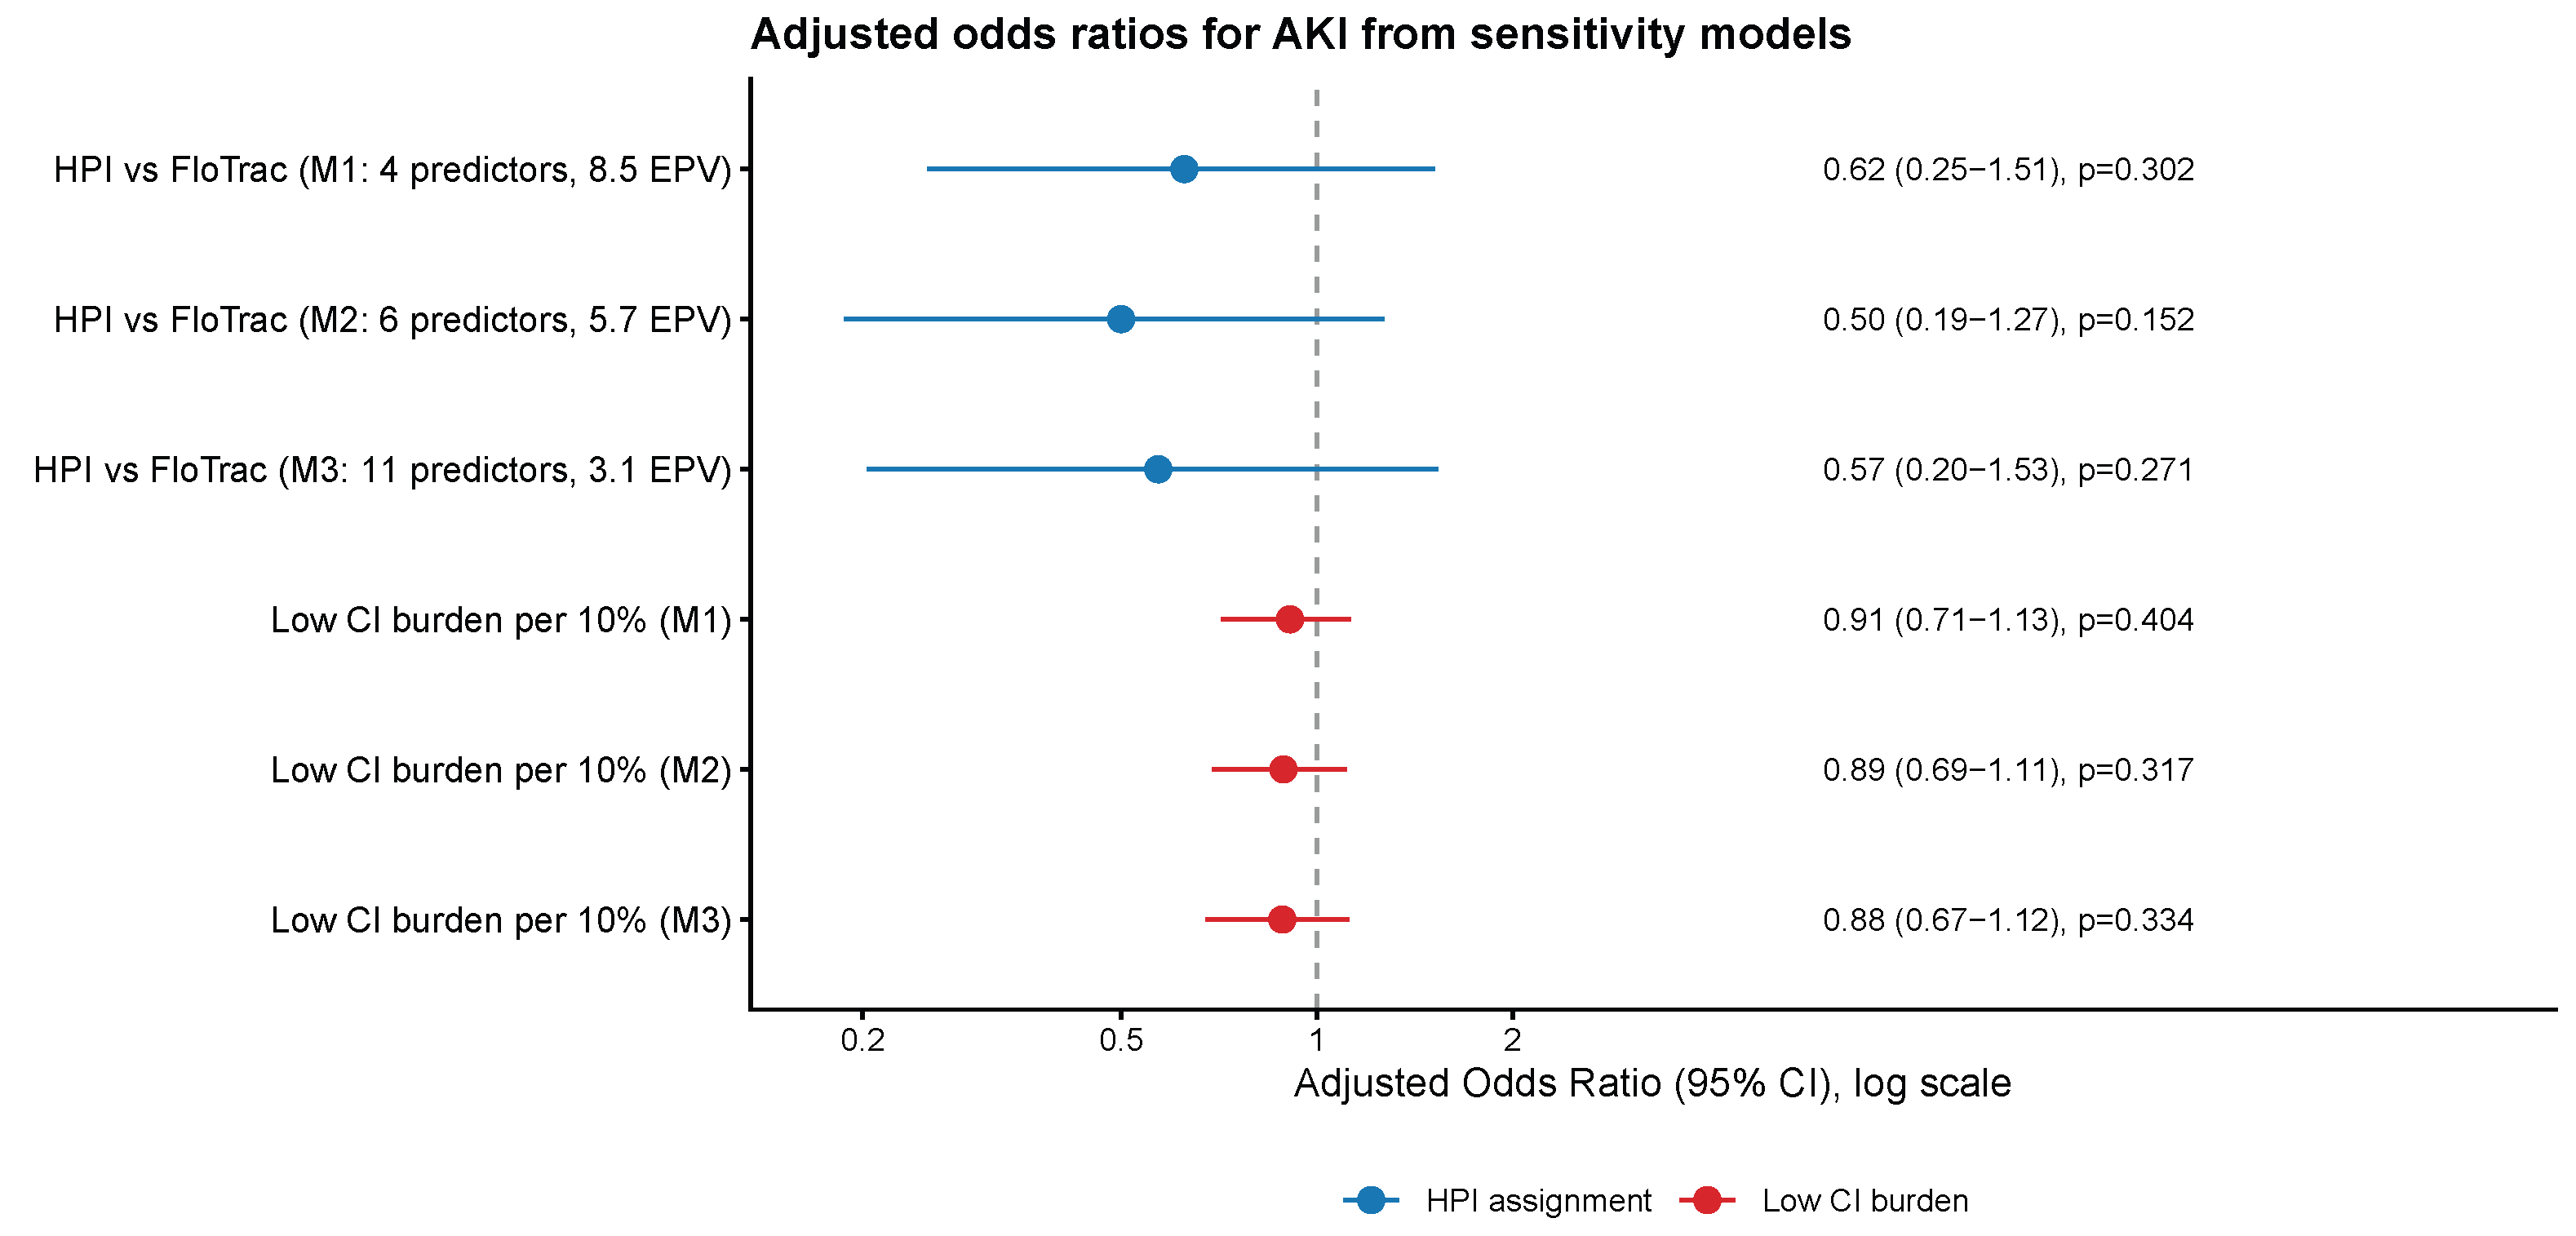
Table 3.
Multivariable logistic regression for AKI (primary model, evaluable, 34 events). Adjusted odds ratios with 95% confidence intervals.
Table 3.
Multivariable logistic regression for AKI (primary model, evaluable, 34 events). Adjusted odds ratios with 95% confidence intervals.
| Predictor | Adjusted OR | 95% CI | p |
|---|---|---|---|
| Low CI < 2.2 & MAP ≥ 65, per 10% increase | 0.88 | 0.67–1.12 | 0.33 |
| HPI vs FloTrac | 0.57 | 0.20–1.53 | 0.27 |
| Age, per year | 1.06 | 0.99–1.14 | 0.12 |
| Body surface area, per m2 | 0.24 | 0.02–2.29 | 0.22 |
| Hypertension | 1.76 | 0.45–8.82 | 0.44 |
| Coronary artery disease | 3.94 | 1.15–14.36 | 0.031 * |
| Heart failure | 0.87 | 0.22–3.40 | 0.84 |
| Prior myocardial infarction | 0.72 | 0.17–2.90 | 0.64 |
| Diabetes mellitus | 0.80 | 0.23–2.53 | 0.71 |
| Preoperative MAP, per mmHg | 1.02 | 0.98–1.05 | 0.39 |
| Surgery duration, per minute | 1.01 | 1.00–1.01 | 0.049 * |
* Statistically significant at uncorrected. Full model, 11 predictors; EPV ≈ 3.1 (exploratory—see Supplementary Table S1 for reduced-predictor sensitivity models).
Disclaimer/Publisher’s Note: The statements, opinions and data contained in all publications are solely those of the individual author(s) and contributor(s) and not of MDPI and/or the editor(s). MDPI and/or the editor(s) disclaim responsibility for any injury to people or property resulting from any ideas, methods, instructions or products referred to in the content. |
© 2026 by the authors. Licensee MDPI, Basel, Switzerland. This article is an open access article distributed under the terms and conditions of the Creative Commons Attribution (CC BY) license (http://creativecommons.org/licenses/by/4.0/).
Copyright: This open access article is published under a Creative Commons CC BY 4.0 license, which permit the free download, distribution, and reuse, provided that the author and preprint are cited in any reuse.


