
Submitted:
10 August 2026
Posted:
11 August 2026
You are already at the latest version
Abstract
Modern electronic assembly manufacturing relies on complex global supply chains, making it increasingly important to verify that every assembled component is authentic, expected, and consistent with the intended design. Existing automated inspection approaches typically formulate this problem as a classification task, providing limited insight into the physical evidence supporting their conclusions and often failing to distinguish expected manufacturing variation from genuine hardware integrity events. This paper presents a scenario-based method for hardware integrity verification that formulates component verification as an evidence-based reasoning process. Independent semantic observations and learned visual evidence are extracted from standard manufacturing images and evaluated against the expected observations associated with candidate manufacturing and hardware integrity scenarios, including normal production evolution, approved AVL substitutions, unexpected component changes, and counterfeit-related events. The method was developed using more than 6.5 billion component images collected from high-volume SMT manufacturing and enables transparent, explainable hardware integrity assessments. Representative examples demonstrate that the proposed methodology distinguishes expected manufacturing changes from hardware integrity violations using only standard production images. By automatically inspecting, identifying, verifying, and documenting every component assembled on every PCB, the proposed methodology establishes a practical foundation for component-level hardware assurance. The resulting digital record provides traceable forensic evidence for every assembled component, enabling scalable hardware integrity verification throughout the electronic assembly manufacturing process.
Keywords:
hardware integrity verification
; hardware assurance
; electronic assembly manufacturing
; forensic reasoning
; component authentication
; explainable inspection
; visual evidence
; SMT inspection
1. Introduction
Electronic assemblies increasingly rely on complex global supply chains involving multiple component manufacturers, distributors, contract manufacturers, and logistics providers [1,2]. As a result, verifying that every assembled component is authentic, approved, and consistent with the intended design has become an essential aspect of electronic assembly manufacturing [3,4,5,6,7]. Hardware integrity violations may arise from counterfeit components, unauthorized substitutions, remarked devices, recycled parts, supply chain mix-ups, manufacturing errors, storage conditions, or other events that cause the assembled hardware to differ from its intended manufacturing specification [8,9,10,11]. Figure 1 summarizes the proposed concept. Similar visual evidence may support different conclusions depending on the expected manufacturing scenario. Instead of searching for anomalies alone, the framework evaluates which hardware integrity scenario is most consistent with the observed evidence.
Current approaches to hardware integrity verification combine documentation, supply chain traceability, electrical testing, destructive analysis, and forensic inspection. International standards, including SAE AS6171 and SAE AS5553 [10,11,12] for counterfeit detection, define structured inspection procedures for evaluating suspect components. These procedures are fundamentally hypothesis driven. Rather than prescribing a single inspection method, they collect different forms of evidence depending on the suspected scenario [12,13,14]. For example, resurfacing may be investigated using solvent testing, die replacement through decapsulation, and unauthorized substitutions through comparison with authentic reference devices. The objective is not simply to classify a component as authentic or counterfeit, but to determine which explanation is most consistent with the available evidence.
Although these inspection techniques differ considerably, much of the required evidence originates from the external appearance of the component. Manufacturing processes produce characteristic signatures in package geometry, body morphology, lead finish, logos, marking implementation, font characteristics, Pin-1 indicators, and other physical attributes. Likewise, resurfacing, remarking, refurbishment, unauthorized replacement, and environmental degradation frequently alter one or more of these visual signatures. Consequently, manufacturing images already contain a substantial portion of the information required for hardware integrity assessment [15,16,17].
This work is based on the hypothesis that hardware integrity verification can be formulated as an evidence-based reasoning problem operating on manufacturing images. Rather than attempting to directly classify components as authentic or counterfeit, the proposed framework extracts multiple independent pieces of forensic visual evidence, each describing a different physical characteristic of the component. These observations are then evaluated against the expectations associated with candidate hardware integrity scenarios, in a manner analogous to forensic inspection. Figure 2 illustrates the relationship between conventional forensic inspection and the proposed methodology.
The proposed method consists of three principal stages. First, independent virtual sensors extract semantic observations and learned visual evidence from standard manufacturing images. Second, the extracted evidence is evaluated against the expected observations associated with candidate hardware integrity scenarios, including normal manufacturing evolution, approved supply chain changes, manufacturing process events, and hardware integrity violations. Finally, the accumulated evidence is integrated into an explainable hardware integrity assessment that identifies both the most consistent scenario and the supporting physical observations.
2. Scenario-Based Hardware Integrity Assessment
Hardware integrity verification is fundamentally a process of evaluating competing explanations for the observed hardware [16,17,18,19]. Rather than determining whether a component is simply authentic or counterfeit, the objective is to identify the scenario that best explains its observed physical characteristics. While counterfeit detection is an important application, most components inspected during production are expected to be correct. The verification process must therefore distinguish between normal manufacturing variation, expected supply chain changes, manufacturing process events, and genuine hardware integrity violations.
Each hardware integrity scenario defines a characteristic set of expected observations. Components originating from the same reel are expected to exhibit nearly identical package geometry, package body characteristics, manufacturer signatures, marking style, Pin-1 implementation, lead geometry, and marking content. In contrast, the introduction of a new manufacturing lot is expected to preserve most physical characteristics while changing only specific marking fields, such as the lot number or date code. Similarly, an approved AVL substitution introduces manufacturer-specific differences while maintaining compatibility with the approved package and manufacturing specification. Hardware integrity violations, including unauthorized substitutions, resurfaced packages, remarked devices, refurbished components, and counterfeit parts, produce different combinations of expected observations reflecting their underlying physical modifications.
Unlike conventional classification approaches, the proposed method evaluates whether the collected evidence is consistent with the expectations associated with each candidate scenario. Every evidence item therefore supports, contradicts, or remains neutral with respect to a given hypothesis. Hardware integrity assessment is obtained by combining these independent observations to identify the scenario that best explains the observed component.
Representative scenarios and their expected observations are summarized in Table 1. Individual observations are rarely sufficient to confirm or reject a scenario. Instead, the assessment relies on the combined consistency of multiple independent sources of visual evidence.
3. Visual Evidence Extraction
Hardware integrity assessment requires observations describing different physical characteristics of each component. Rather than representing a component using a single feature vector or classification model, the proposed framework decomposes visual inspection into a collection of independent evidence extraction modules. Each module analyzes a specific physical characteristic and produces an observation that is subsequently evaluated against the expectations associated with candidate hardware integrity scenarios.
The evidence extraction models were developed using a dataset of more than 6.5 billion component images collected from Pick-and-Place and Automated Optical Inspection (AOI) systems operating on high-volume electronic assembly production lines. The images were grouped and labeled according to the physical characteristics represented by each evidence category, enabling each model to learn the normal variability associated with a specific visual attribute rather than complete component identities. To ensure deployment across different manufacturing environments, the models were trained to be robust to variations introduced by different machine vendors, imaging systems, optical configurations, and production conditions [15,16,17,20].
This modular organization follows the methodology used during forensic inspection, where different physical characteristics are examined independently before reaching an overall conclusion. Separating the evidence sources also improves interpretability, allowing each observation to support or contradict a scenario independently rather than contributing to an opaque classification score.
The method operates on standard manufacturing images acquired during electronic assembly production, including images from Pick-and-Place systems, Automated Optical Inspection (AOI), incoming inspection, or similar imaging equipment. Following image normalization, individual evidence modules analyze different physical characteristics of the component. The principal categories of evidence are summarized in Table 2.
Each evidence module operates independently and produces an observation that remains interpretable throughout the reasoning process. New evidence sources can therefore be incorporated without modifying the overall scenario evaluation framework, making the methodology readily extensible as additional inspection capabilities become available.
4. Scenario Evaluation
The extracted visual evidence is evaluated against the expectations associated with each candidate hardware integrity scenario. Since every scenario defines a different set of expected observations, the same evidence may support one scenario while contradicting another. For example, a change in the date code is expected when a new manufacturing lot is introduced but is inconsistent with the Same Reel scenario. Likewise, a different manufacturer signature is expected for an approved AVL substitution but would contradict both the Same Reel and New Manufacturing Lot scenarios.
The scenario evaluation therefore consists of comparing the complete set of extracted observations with the expected evidence pattern associated with each candidate scenario. Hardware integrity is determined by identifying the scenario whose expected observations are most consistent with the collected evidence. Because each evidence source remains independent throughout the evaluation, the resulting assessment is inherently explainable and identifies which observations support or contradict the final conclusion. Representative expectations for several common scenarios are summarized in Table 3.
The scenario evaluation process is independent of the algorithms used to generate the individual evidence. Any image analysis, measurement, or future sensing technology capable of producing interpretable observations can be incorporated into the framework, provided that its outputs can be compared with the expectations associated with the evaluated scenarios.
5. Method
The proposed framework separates evidence generation from hardware integrity reasoning. Each evidence extraction module produces a standardized representation describing a single physical characteristic of the component. These representations are subsequently evaluated by the scenario-based reasoning framework described in Section 4.
Two complementary forms of evidence are employed throughout the framework. Physical attributes that can be directly interpreted, such as marking text, manufacturer identity, package family, date codes, and lot identifiers, are represented as semantic evidence. Visual characteristics that cannot be adequately described using predefined labels are represented using learned evidence embeddings.
5.1. Semantic Evidence
Semantic evidence represents structured information that can be interpreted directly without comparison. Examples include optical character recognition (OCR) results, manufacturer part numbers (MPNs), manufacturer identity, package family, date codes, lot identifiers, and country of origin.
These observations are evaluated directly against the expectations associated with each hardware integrity scenario. Depending on the evaluated scenario, identical values may be required, expected to change, or permitted to differ.
5.2. Learned Evidence Embeddings
Many categories of forensic evidence cannot be represented reliably using predefined measurements or discrete labels. Characteristics such as package body appearance, molding signatures, marking morphology, manufacturer fingerprints, Pin-1 implementation, lead appearance, and other manufacturing signatures are inherently visual. These characteristics are therefore represented using learned evidence embeddings.
Each evidence module transforms its corresponding image region into a compact numerical representation describing a single physical characteristic. Rather than representing an entire component using one feature vector, the proposed framework maintains an independent embedding space for each evidence category. This separation enables every embedding to specialize in a specific forensic observation while avoiding interference from unrelated visual information.
The embedding models are trained using billions of component images collected during normal SMT manufacturing. Instead of learning component identities or counterfeit classes, components are grouped according to the physical characteristic represented by each evidence category. Consequently, each embedding learns to preserve manufacturing consistency while separating meaningful physical differences relevant to its assigned observation. Because the training data originates from large-scale production environments, the learned representations naturally capture normal variation across manufacturing lines, suppliers, production lots, imaging systems, and package revisions.
Hardware integrity assessment is not performed directly from the embeddings themselves. Instead, similarity measures quantify the consistency between corresponding evidence embeddings and provide observations that are subsequently evaluated by the scenario reasoning framework. This separation between evidence generation and evidence interpretation enables the same embedding representations to support multiple hardware integrity scenarios without modification.
6. Experimental Validation
The proposed framework was evaluated using production images acquired during standard SMT manufacturing. The dataset consists of billions of component images collected in-line from Pick-and-Place and Automated Optical Inspection (AOI) systems across multiple manufacturing sites, customers, component manufacturers, package families, and production lots. Rather than relying on curated benchmark datasets, both training and validation were performed using naturally occurring manufacturing populations representative of normal electronic assembly production.
The evaluation included representative scenarios encountered during manufacturing, including expected production evolution (same reel, new manufacturing lot, approved AVL substitution), manufacturing process events (mixed reels and incorrect feeder loading), and hardware integrity violations such as unauthorized substitutions, resurfaced packages, remarked devices, refurbished components, and counterfeit parts.
The following examples illustrate the operation of the proposed framework for representative hardware integrity scenarios.
6.1. Expected Manufacturing Evolution
Figure 3 presents a component originating from a new manufacturing lot. The framework identifies that only the manufacturing date code differs from the reference population, while all remaining evidence remains consistent. The observations therefore support the New Manufacturing Lot scenario and do not indicate a hardware integrity violation.
6.2. Approved Manufacturer Substitution
Figure 4 illustrates an approved AVL substitution. Manufacturer-specific characteristics differ from the reference population, while package compatibility and the remaining evidence remain consistent with the approved manufacturing specification. The framework therefore identifies the observation as an expected supply-chain event rather than a hardware integrity violation.
6.3. Counterfeit Component
Figure 5 shows a representative counterfeit evaluation. The unit under test is compared with a reference population and each evidence category is evaluated independently. While several characteristics remain consistent with the reference population, multiple independent mismatches are observed across manufacturer-specific visual signatures, package appearance, marking morphology, logo identity, and lead characteristics. The accumulated evidence cannot be explained by expected manufacturing scenarios and therefore supports the counterfeit scenario.
6.4. Unexpected Component Substitution
Figure 6 illustrates a component for which the manufacturer identity remains consistent with the reference population, but the identified MPN differs from the approved reference device. Unlike a new manufacturing lot, where only manufacturing information such as the date or lot code is expected to change, an MPN change indicates that a different component has been assembled. Such substitutions have become increasingly common during recent component shortages, where alternate devices were frequently introduced to maintain production continuity. While some substitutions may be formally approved through the AVL process, unexpected MPN changes can also indicate inventory errors, feeder mix-ups, or the installation of devices with different electrical or reliability characteristics. The proposed framework identifies these substitutions by combining semantic information extracted from the marking with the remaining visual evidence, enabling the specific nature of the change to be understood rather than simply reporting a generic mismatch.
7. Discussion
The proposed method reformulates hardware integrity verification as an evidence-based reasoning problem rather than a component classification task. Instead of attempting to determine whether a component belongs to a predefined category, the methodology evaluates whether the observed physical evidence is consistent with the expectations associated with a candidate hardware integrity scenario. This formulation more closely reflects established forensic inspection practice, where conclusions are derived from the combined interpretation of multiple independent observations rather than from a single measurement.
This modular organization allows additional evidence sources to be incorporated without modifying the overall reasoning framework. Although this work focuses on manufacturing images, future evidence sources such as X-ray inspection, acoustic microscopy, electrical testing, material characterization, or supply chain documentation can be integrated naturally as additional evidence modules.
The method also extends hardware integrity verification beyond counterfeit detection. Most inspected components encountered during manufacturing represent expected production events, including new manufacturing lots, approved AVL substitutions, package revisions, or normal process variation. Evaluating these scenarios within the same reasoning framework enables expected manufacturing evolution to be distinguished from conditions requiring further investigation, reducing unnecessary false alarms while preserving explainability.
The proposed methodology is nevertheless limited by the information contained in the available evidence. Hardware modifications that produce no observable differences in any measured modality cannot be identified through visual inspection alone. Certain assessments may therefore require complementary evidence obtained from electrical measurements, destructive analysis, or other inspection techniques. The framework should therefore be viewed as an extensible evidence integration methodology rather than a replacement for existing hardware assurance practices.
8. Conclusion
This paper presented a scenario-based method for hardware integrity verification using visual evidence extracted from standard electronic assembly manufacturing images. Rather than treating hardware integrity as a binary classification problem, the proposed methodology evaluates multiple independent observations against the expectations associated with candidate manufacturing and hardware integrity scenarios, providing transparent and explainable assessments.
The method combines semantic observations with learned evidence embeddings while maintaining a clear separation between evidence generation and scenario evaluation. This enables the same evidence to support a broad range of manufacturing scenarios, including expected production evolution, approved supply chain substitutions, and hardware integrity violations such as counterfeit, unauthorized replacement, and remarking.
More importantly, the proposed methodology enables, for the first time, fully automated component-level hardware assurance at manufacturing scale. Every component assembled on every PCB can be automatically inspected, identified, interpreted, assessed, and permanently documented as part of the normal production process. Instead of relying on sample-based inspection or post-failure analysis, manufacturers can establish a complete digital record describing the actual hardware that was assembled, together with the forensic evidence supporting its integrity.
By continuously verifying that every component is known, expected, and consistent with the intended design or approved manufacturing changes, the method provides the evidence required to establish component-level hardware assurance across the entire production population. Unexpected substitutions, counterfeit components, unauthorized modifications, manufacturing deviations, and other hardware integrity events become automatically detectable, explainable, and fully traceable. This capability transforms standard manufacturing images from a quality inspection resource into the foundation of scalable, automated hardware assurance for electronic assemblies.
For the first time, every component assembled on every PCB can be automatically verified and permanently documented as part of the manufacturing process, establishing the evidence required for scalable component-level hardware assurance.
References
- Chen, R.; Chen, X.; Wang, L.; Li, J. ACM Trans. Manag. Inf. Syst. 2023, 13, 1.
- Wiklund, J.; Karakoç, A.; Palko, T.; Yiğitler, H.; Ruttik, K.; Jäntti, R.; Paltakari, J. J. Manuf. Mater. Process. 2021, 5, 89.
- Razak, G. M.; Hendry, L. C.; Stevenson, M. Prod. Plan. Control 2023, 34, 1114.
- Ford, M.; Triggs, J. D. Intell. Prod. Mach. Syst. 2006, 656.
- Rosales, P. 2021.
- Schuitemaker, R.; Xu, X. Procedia CIRP; Elsevier B.V., 2020; pp. 700–705. [Google Scholar]
- Shearon, C. E. 2018 Pan Pacific Microelectronics Symposium (Pan Pacific); IEEE, 2018; pp. 1–3. [Google Scholar]
- E. Components. 2013.
- Component, C. E. 1 2013. [CrossRef]
- Azarian, M. H. ISTFA 2018: Proceedings from the 44th International Symposium for Testing and Failure Analysis. 2018; ASM International. [Google Scholar]
- SAE; International Standards-AS5553 and AS5553A Counterfeit Electronic Parts; Avoidance, Detection, Mitigation and Disposition. 2013.
- Poncheri, in Counterfeit Electronics Symposium (Surface Mount Technology Association. 2012.
- Richman, D. R.; Azarian, M. H.; Das, D.; Pecht, M. IEEE Access 2025, 13, 7691.
- Tehranipoor, M.; Guin, U.; Forte, D. Counterfeit Integrated Circuits: Detection and Avoidance; Springer, 2015; pp. 75–93. [Google Scholar]
- Weiss, E. SMTA; 2021. [Google Scholar]
- Packaging Manuf. Technol.; Weiss, E.; IEEE, Translators; 2024; p. 1. [Google Scholar]
- Weiss, E. J. Hardw. Syst. Secur. 2026, 10, 3.
- Tehranipoor, M.; Pundir, N.; Vashistha, N.; Farahmandi, F. Hardware Security Primitives; Springer, 2023. [Google Scholar]
- Asadizanjani, N.; Xi, C.; Tehranipoor, M. M. Materials for Electronics Security and Assurance; Elsevier, 2024. [Google Scholar]
- Weiss, E. 2024, 13, 3707.
Figure 1.
Scenario-based interpretation of manufacturing images. Rather than detecting anomalies alone, the proposed methodology determines which manufacturing or hardware integrity scenario best explains the observed visual evidence, enabling component-level hardware assurance.
Figure 1.
Scenario-based interpretation of manufacturing images. Rather than detecting anomalies alone, the proposed methodology determines which manufacturing or hardware integrity scenario best explains the observed visual evidence, enabling component-level hardware assurance.
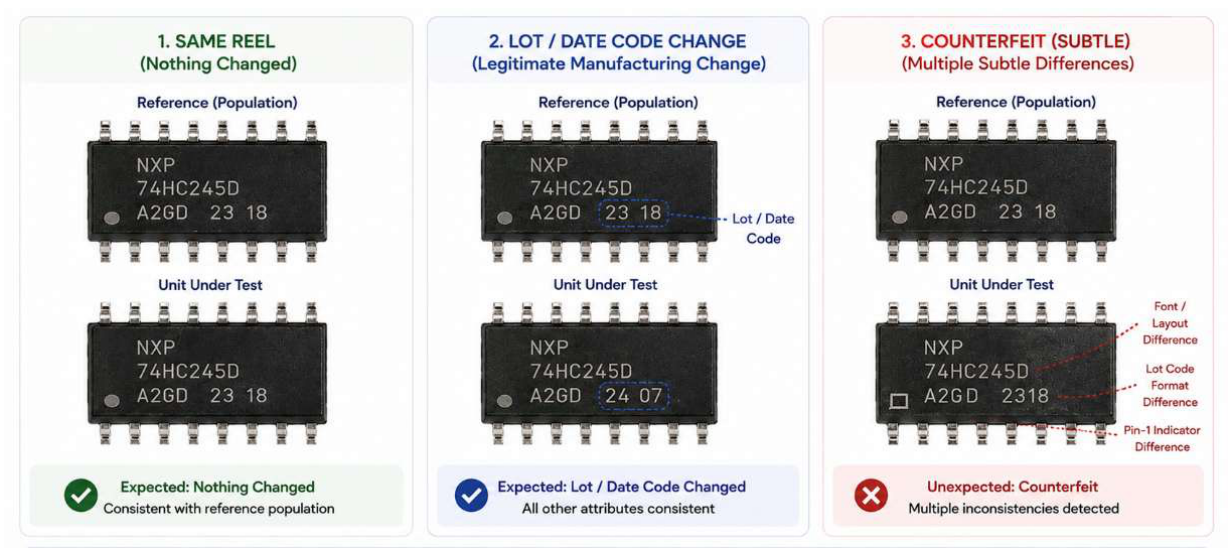
Figure 2.
Comparison between conventional forensic inspection and the proposed method. Both approaches evaluate hardware integrity by collecting multiple independent observations and assessing their consistency with candidate hardware integrity scenarios. The proposed method automates evidence generation on all components on the board while preserving and automating the forensic reasoning process.
Figure 2.
Comparison between conventional forensic inspection and the proposed method. Both approaches evaluate hardware integrity by collecting multiple independent observations and assessing their consistency with candidate hardware integrity scenarios. The proposed method automates evidence generation on all components on the board while preserving and automating the forensic reasoning process.
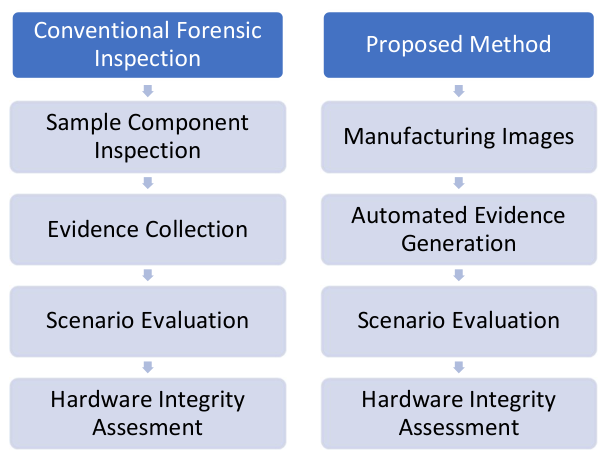
Figure 3.
Example of a component belonging to a new manufacturing lot. The framework identifies that only the manufacturing date code differs from the reference population, while all remaining evidence remains consistent. The observations therefore support the "New Manufacturing Lot" scenario rather than indicating a hardware integrity violation.
Figure 3.
Example of a component belonging to a new manufacturing lot. The framework identifies that only the manufacturing date code differs from the reference population, while all remaining evidence remains consistent. The observations therefore support the "New Manufacturing Lot" scenario rather than indicating a hardware integrity violation.
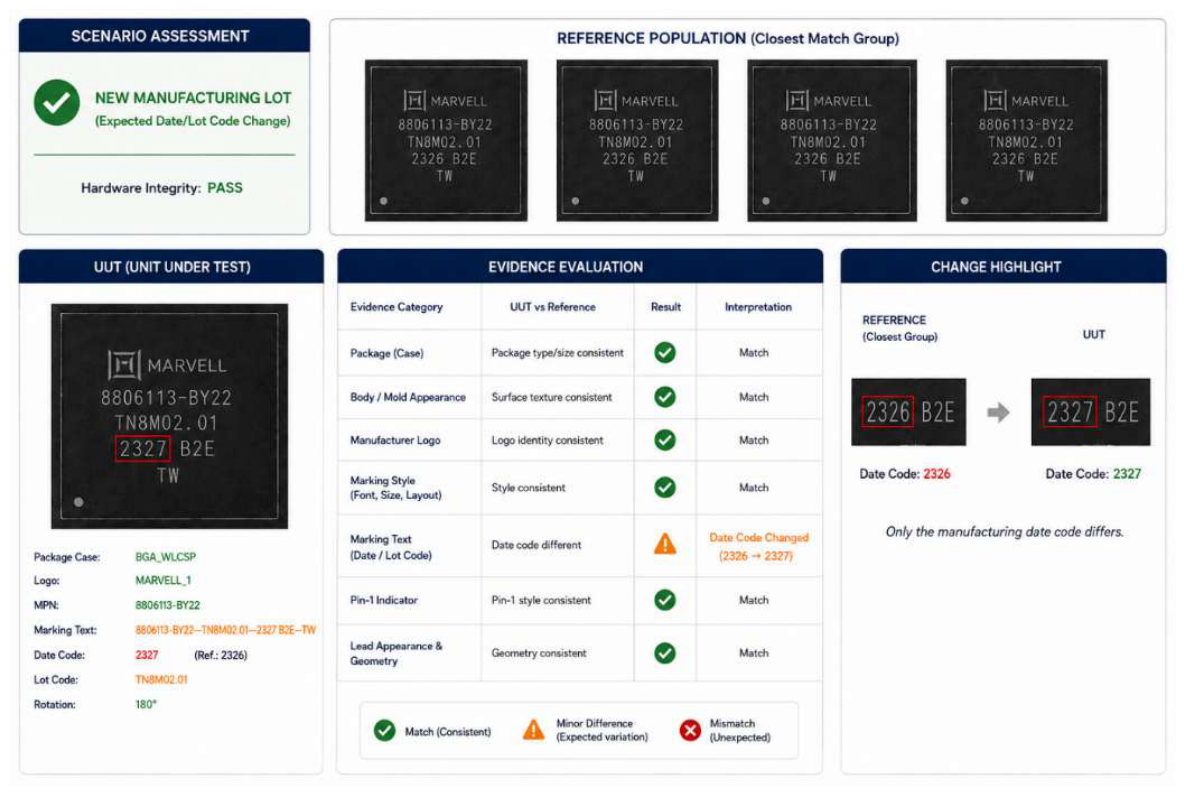
Figure 4.
Example of an approved AVL replacement. The manufacturer and MPN differ from the reference population, while the remaining evidence is consistent with an approved alternate component. The method recognizes the substitution as an expected supply-chain event rather than a hardware integrity violation.
Figure 4.
Example of an approved AVL replacement. The manufacturer and MPN differ from the reference population, while the remaining evidence is consistent with an approved alternate component. The method recognizes the substitution as an expected supply-chain event rather than a hardware integrity violation.
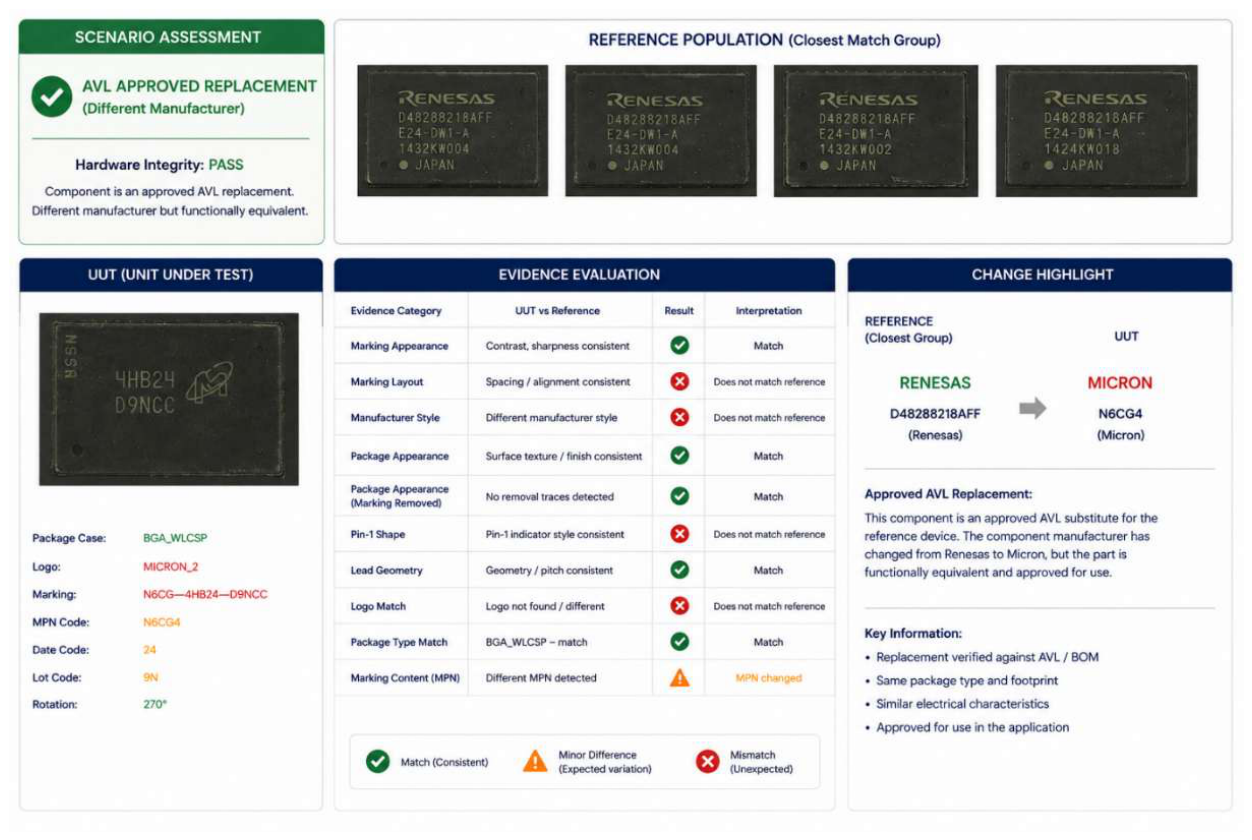
Figure 5.
Representative counterfeit evaluation. The framework compares the unit under test with a reference population and independently evaluates multiple evidence categories. Although several characteristics remain consistent with the reference population, multiple independent mismatches indicate that the observed evidence is inconsistent with expected manufacturing variation, resulting in a counterfeit hardware integrity assessment.
Figure 5.
Representative counterfeit evaluation. The framework compares the unit under test with a reference population and independently evaluates multiple evidence categories. Although several characteristics remain consistent with the reference population, multiple independent mismatches indicate that the observed evidence is inconsistent with expected manufacturing variation, resulting in a counterfeit hardware integrity assessment.
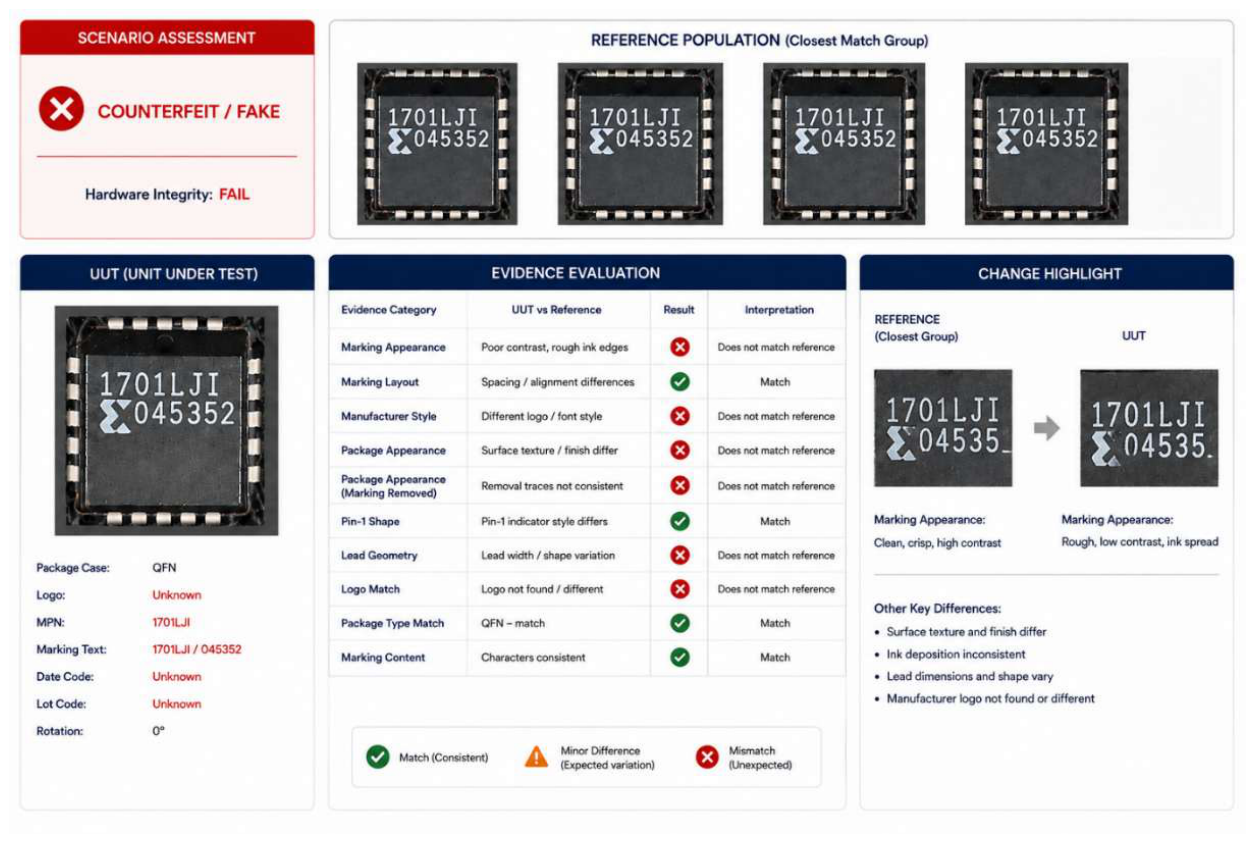
Figure 6.
Scenario-based evaluation of an unexpected MPN change. The package, manufacturer identity, and manufacturing signatures remain consistent with the reference population, indicating that the component originates from the same manufacturer. However, the detected MPN differs from the expected device, suggesting a possible inventory mix-up, unauthorized substitution, or use of an alternate component requiring verification.
Figure 6.
Scenario-based evaluation of an unexpected MPN change. The package, manufacturer identity, and manufacturing signatures remain consistent with the reference population, indicating that the component originates from the same manufacturer. However, the detected MPN differs from the expected device, suggesting a possible inventory mix-up, unauthorized substitution, or use of an alternate component requiring verification.
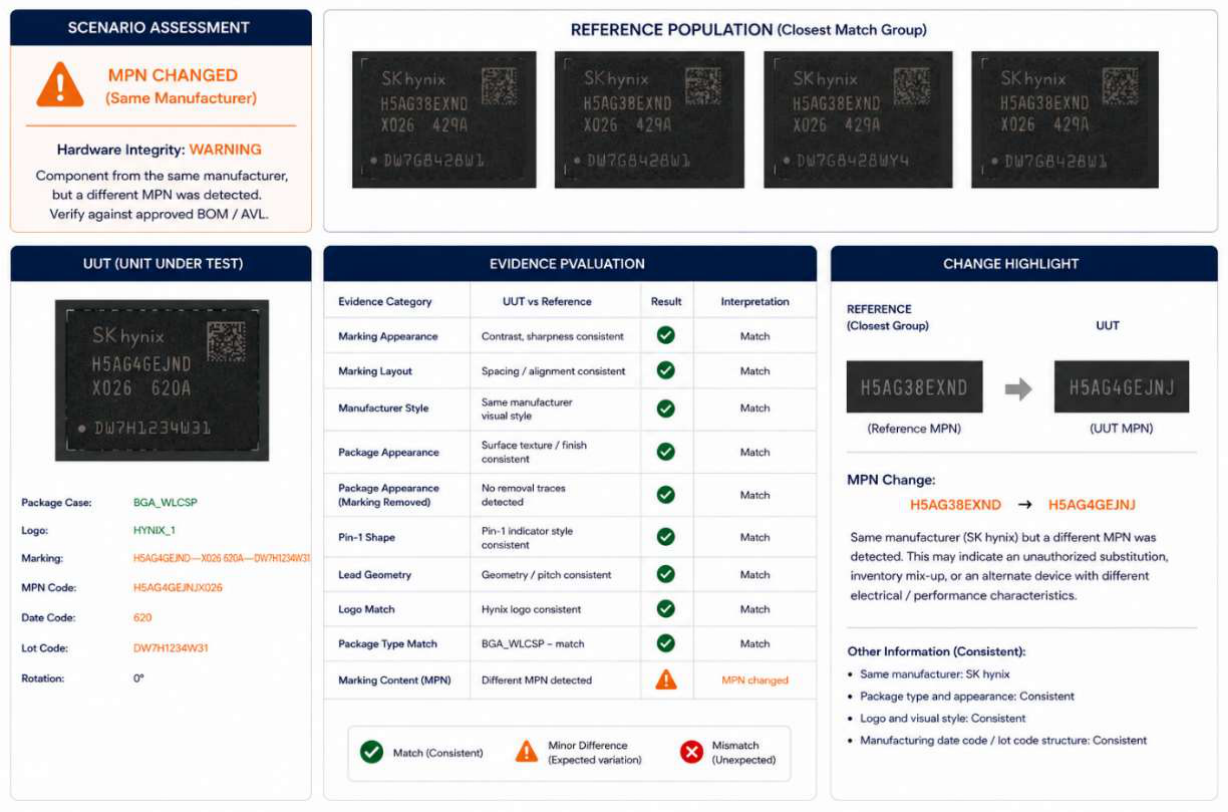

Table 1.
Representative hardware integrity scenarios and their expected visual observations.
| Scenario | Expected to Remain Consistent | Expected to Change |
|---|---|---|
| Same reel | Package, body fingerprint, manufacturer fingerprint, logo, marking style, font, pin-1, leads, surface texture, lot code, date code | None (except minor manufacturing variation) |
| New manufacturing lot | Package, body fingerprint, manufacturer fingerprint, logo, marking style, font, pin-1, leads | Lot code, possibly date code |
| New date code | All physical characteristics | Date code only |
| Approved AVL substitution | Package compatibility, functional characteristics | Manufacturer logo, manufacturer fingerprint, body morphology, marking implementation |
| Package revision | Functionality, manufacturer identity | Package geometry, body morphology, pin configuration |
| Mixed reel | Multiple internally consistent populations | Unexpected coexistence of different visual populations within the same reel |
| Incorrect feeder / wrong component | Placement location | Package, markings, manufacturer, geometry inconsistent with expectation |
| Remarked component | Package geometry, manufacturer body characteristics | Marking text, font, alignment, engraving or printing characteristics |
| Resurfaced / blacktopped component | Internal package geometry | Surface texture, reflectance, marking quality |
| Refurbished component | Package identity | Lead condition, oxidation, scratches, solder residue |
| Counterfeit / unauthorized substitution | Varies depending on mechanism | Multiple inconsistencies across package, markings, manufacturer signatures, and production characteristics |
Table 2.
Visual evidence categories extracted from manufacturing images.
| Evidence Category | Representative Observations | Typical Supported Scenarios |
|---|---|---|
| Package Geometry | Package dimensions, aspect ratio, pin count, package family | Package substitution, feeder errors, package revisions |
| Package Body Characteristics | Surface texture, molding signatures, cavity marks, body morphology | Manufacturer identification, counterfeit, package replacement |
| Manufacturer Signatures | Logos, proprietary markings, manufacturer-specific visual characteristics | AVL substitutions, unauthorized manufacturer changes |
| Marking Morphology | Font, layout, spacing, engraving or printing characteristics | Remarking, manufacturing variation |
| Marking Content | MPN, date code, lot code, country of origin | New lots, date-code changes, traceability |
| Pin-1 Characteristics | Location, geometry, manufacturing style, surface appearance | Package authentication, resurfacing, remarking |
| Lead Characteristics | Shape, finish, oxidation, scratches, deformation, solder residue | Refurbishment, degradation, reuse |
| Population Consistency | Similarity across components from the same production population | Same reel, mixed reels, counterfeit, unexpected variation |
Table 3.
Illustration representative expectations for several common scenarios.
| Evidence | Same Reel | New Lot |
|---|---|---|
| Package Geometry | Match | Match |
| Manufacturer Identity | Match | Match |
| Package Body Fingerprint | Match | Match |
| Marking Style | Match | Match |
| Marking Text | Match | Lot/Date Change |
| Pin-1 Characteristics | Match | Match |
| Lead Characteristics | Match | Match |
| Population Consistency | High | High (except lot/date) |
Disclaimer/Publisher’s Note: The statements, opinions and data contained in all publications are solely those of the individual author(s) and contributor(s) and not of MDPI and/or the editor(s). MDPI and/or the editor(s) disclaim responsibility for any injury to people or property resulting from any ideas, methods, instructions or products referred to in the content. |
© 2026 by the authors. Licensee MDPI, Basel, Switzerland. This article is an open access article distributed under the terms and conditions of the Creative Commons Attribution (CC BY) license (http://creativecommons.org/licenses/by/4.0/).
Copyright: This open access article is published under a Creative Commons CC BY 4.0 license, which permit the free download, distribution, and reuse, provided that the author and preprint are cited in any reuse.