

Submitted:
10 August 2026
Posted:
11 August 2026
You are already at the latest version
Abstract
Driver drowsiness is an important contributor to road accidents, but conventional multichannel electroencephalography (EEG) systems are difficult to deploy in everyday driving contexts. This study investigates whether band-power features obtained from a low-cost, single-channel commercial EEG device (NeuroSky MindWave Mobile 2, Fp1 position) can discriminate between the alert and drowsy labels provided in a public dataset. Frequency-band features were combined with physiologically motivated ratios, and several machine learning classifiers were evaluated using repeated nested stratified cross-validation. Because the dataset does not provide participant identifiers, the analysis estimates within-dataset discrimination and cannot establish generalization to unseen individuals. Random Forest achieved the highest mean area under the receiver operating characteristic curve (AUC=0.869), whereas the Soft-Voting Ensemble provided a compromise between accuracy (0.78), drowsiness recall (0.77), and AUC (0.863). SHAP analysis identified delta, highBeta, and highGamma as the most influential variables. A reduced model using these three features retained an AUC of 0.831, and the ensemble required approximately 7.52 ms per prediction on the evaluated computing platform. These findings support the computational feasibility of explainable drowsiness classification from consumer-grade single-channel EEG features, while subject-independent and embedded-hardware validation remain necessary.
Keywords:
EEG
; drowsiness detection
; single-Channel BCI
; machine learning
; ensemble learning
; SMOTE
; NeuroSky
1. Introduction
Driver fatigue significantly impairs reaction times and decision-making capabilities, contributing to a substantial proportion of fatal road accidents. While the European Union has recently mandated camera-based Driver Drowsiness and Attention Warning (DDAW) systems for all new passenger vehicles [1], such visual systems are inherently unviable for motorcyclists due to helmet obstruction, ambient light variations, and vehicle dynamics. For these vulnerable road users, real-time physiological monitoring—particularly via Electroencephalogram (EEG) sensors embedded seamlessly inside the helmet [2]—is widely regarded as the most objective and practical method for detecting the onset of drowsiness.
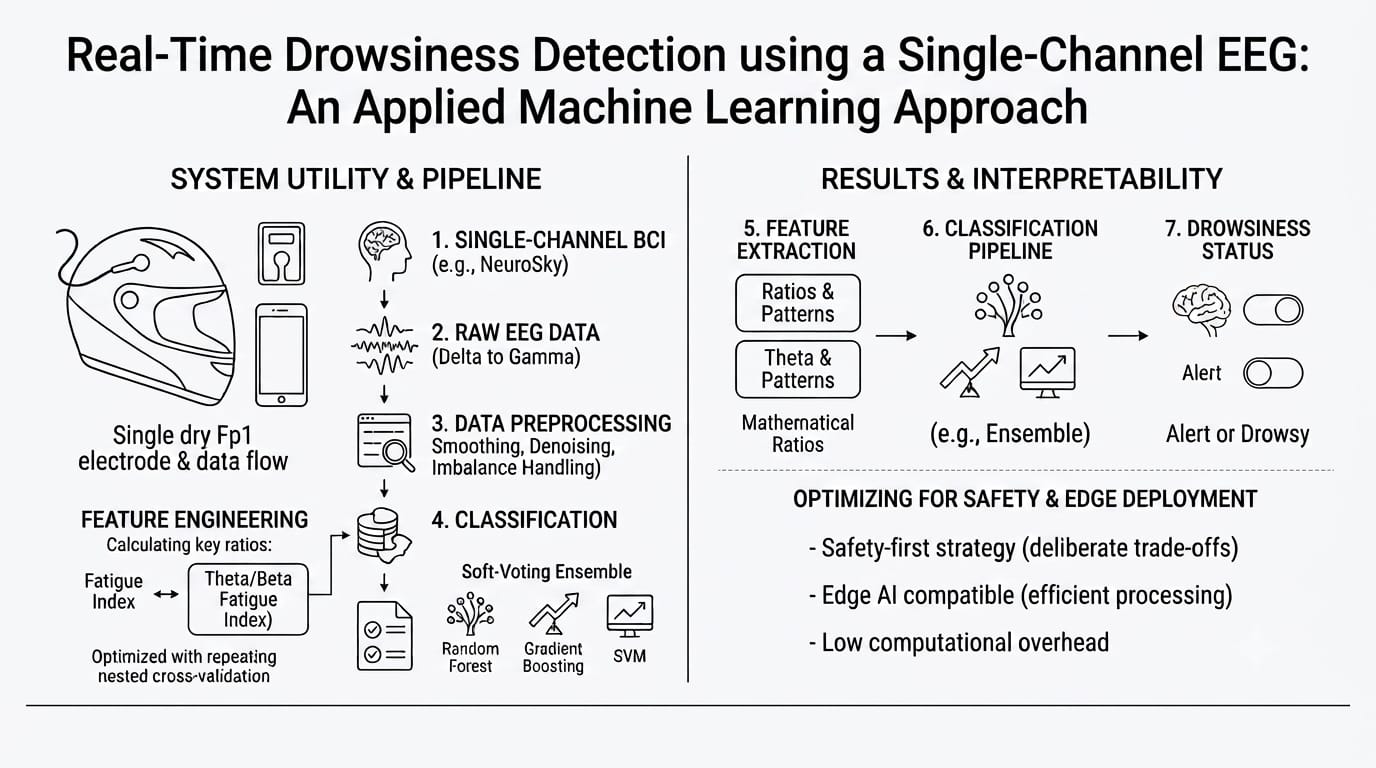
However, traditional clinical EEG systems require multiple wet electrodes (e.g., 32 or 64 channels), making them impractical for daily riding scenarios. Recently, low-cost, dry-electrode single-channel commercial Brain-Computer Interfaces (BCIs) have emerged as highly accessible alternatives that can be integrated into standard helmets. The challenge lies in their signal-to-noise ratio, as single frontal electrodes (Fp1) are highly susceptible to ocular, muscular, and vibration artifacts. This paper proposes an applied data engineering and machine learning pipeline to enhance the reliability of a single-channel commercial EEG for fatigue detection. The main contributions of this work are summarized as follows:
- We design a composite feature engineering approach, utilizing Theta/Beta and Fatigue Index ratios, to amplify neurophysiological markers of drowsiness and mitigate the inherent noise of dry-electrode Fp1 signals.
- We propose a heterogeneous Soft-Voting Ensemble (combining Random Forest, Gradient Boosting, and SVM) integrated with SMOTE, achieving a highly balanced detection rate for the minority class.
- We implement a safety-first thresholding strategy that deliberately minimizes False Negatives, tailoring the classification boundary to the asymmetric risk profile of vehicular driving.
- We provide a transparent, model-agnostic explainability analysis using SHAP, bridging the gap between machine learning predictions and established clinical sleep neuroscience.
1.1. Related Work
Recent studies have extensively explored machine learning techniques for drowsiness detection using single-channel EEGs. While homogeneous ensembles such as Bagging have shown high accuracy (e.g., 84.9% by Alqawba et al. [3]), they often obscure the underlying neurophysiological causes of the predictions. Other recent approaches, such as the ID3RSNet deep learning framework [4], provide robust denoising but require significant computational overhead, limiting real-time edge deployment. Table 1 compares recent benchmarks utilizing the same NeuroSky dataset. Our proposed approach prioritizes a balance between safety (Recall) and clinical interpretability over raw accuracy, leveraging a heterogeneous ensemble.
2. Materials and Methods
2.1. Dataset Description and Selection
To evaluate the proposed methodology in a realistic, non-clinical scenario, this study utilized the publicly available “Sleepy Driver EEG Brainwave Data” [5]. It comprises continuous brainwave recordings acquired via the NeuroSky MindWave Mobile 2 device, leveraging a single dry electrode placed at the prefrontal Fp1 position. The feature space encompasses raw frequency band powers provided by the ThinkGear ASIC at a 1 Hz output rate: Delta (, 0.5–3 Hz), Theta (, 4–7 Hz), Alpha (, 8–12 Hz, split into low and high), Beta (, 13–30 Hz, split into low and high), and Gamma (, 31–50 Hz, split into low and mid-gamma). Additionally, it incorporates the proprietary ‘Attention’ and `Meditation’ eSense metrics.
Ground truth labels were binarily annotated: alert (0) representing a baseline waking state, and drowsy (1) indicating the onset of microsleeps and severe vigilance degradation.
Comparison with Existing Datasets: The selection of a native single-channel commercial dataset is a critical methodological choice. While multi-modal datasets such as DROZY [6] and SEED-VIG [7] are considered gold standards for fatigue research, they rely on high-density clinical setups (e.g., 18 to 64 wet electrodes) and polysomnography. Although some researchers simulate single-channel BCI by extracting the Fp1 channel from these clinical datasets, doing so artificially removes the inherent hardware noise, poor skin-electrode contact impedance, and motion artifacts characteristic of real-world consumer devices. By utilizing a dataset natively recorded with a commercial Fp1 dry sensor, our models are trained and evaluated against the authentic, non-stationary noise profile encountered in practical vehicular environments.
The public documentation does not provide participant identifiers or a detailed description of independent clinical or polysomnographic annotation. The binary outcomes are therefore treated as dataset-provided alert and drowsy labels rather than as independently validated sleep-stage diagnoses.
2.2. Feature Engineering
Raw EEG power bands often fluctuate significantly due to individual baseline differences, skin impedance variations, and external noise. However, the mathematical ratios between specific frequency bands provide a more stable and physiologically meaningful representation of cognitive states [8]. Neurophysiologically, the transition from wakefulness to drowsiness is characterized by a power shift from high-frequency, fast-wave activity (Beta and Gamma, associated with active concentration) to low-frequency, slow-wave activity (Theta and Alpha, associated with relaxation and early-stage sleep) [9,10].
To capture these neurophysiological transitions, several composite ratios were engineered. A smoothing constant () was added to the denominators to prevent undefined division errors. The Theta-to-Beta Ratio (TBR) was calculated as it is a widely validated biomarker for cognitive arousal and vigilance decrement [11]:
Additionally, a comprehensive Fatigue Index (FI) was derived. This index amplifies the signal of drowsiness by aggregating the slow-wave powers in the numerator and the fast-wave powers in the denominator. This ratio-based approach is proven to be highly effective in vehicular fatigue studies for magnifying the separation between alert and drowsy states [12]:
By feeding these engineered ratios alongside the raw bands into the machine learning algorithms, the classifiers are explicitly guided by established neuroscience principles, thereby reducing their reliance on spurious noise artifacts inherent to single-channel Fp1 recordings.
2.3. Data Preprocessing and SMOTE
Prior to classification, the dataset underwent standard preprocessing. To ensure that algorithms reliant on distance metrics (e.g., SVM) were not biased by features with larger numerical ranges, the continuous variables (raw bands and engineered ratios) were normalized using standard scaling (zero mean and unit variance). All preprocessing operations were included within the model-evaluation pipeline. For each outer cross-validation iteration, standardization and SMOTE were fitted exclusively using the corresponding outer-training partition and were subsequently applied to the outer-test partition. No standardization, oversampling, model selection, or probability calibration was performed before the outer split.
A common challenge in physiological monitoring datasets is class imbalance; in realistic vehicular environments, drivers spend the vast majority of their time in an alert state, with drowsiness representing a minority of the recorded epochs. In this dataset, the alert state (0) significantly outweighed the drowsy state (1). Training machine learning classifiers on such imbalanced data inherently biases the models toward the majority class, leading to artificially high overall accuracy but unacceptably low recall for the critical minority class (drowsiness).
To mitigate this without discarding valuable data—a drawback of undersampling techniques—the Synthetic Minority Oversampling Technique (SMOTE) [13] was applied. SMOTE operates by identifying the k-nearest neighbors for each minority class sample in the feature space and generating synthetic examples along the line segments joining them. Crucially, to prevent data leakage and ensure a rigorous evaluation, SMOTE was applied strictly to the training partition. The 20% hold-out testing set remained entirely unmodified, preserving the natural class distribution to accurately reflect real-world predictive performance.
2.4. Validation Strategy and Leakage Control
The released dataset does not contain participant identifiers, and no documented grouping variable is available that would permit person-wise validation. Subject-wise evaluation was therefore not possible, and the analysis cannot establish generalization to unseen individuals. We consequently interpret all performance estimates as within-dataset discrimination.
The outer evaluation consisted of five stratified folds repeated twice, producing ten outer-test evaluations. Within each outer-training partition, hyperparameters were selected using a five-fold stratified inner cross-validation procedure. The complete pipeline, including scaling, SMOTE, model fitting, and probability calibration where applicable, was refitted using the selected configuration before evaluation on the corresponding outer-test fold. Identical outer folds were used for every classifier to permit paired comparisons. Because participant membership is unavailable, this protocol does not remove potential dependence among observations originating from the same individual or recording sequence. The reported variability therefore reflects resampling variability within this dataset and should not be interpreted as population-level or cross-subject uncertainty.
2.5. Evaluated Classification Models and Hyperparameter Tuning
To identify the most effective algorithms for the fatigue detection task and to establish a robust comparative baseline, a comprehensive benchmark of multiple machine learning classifiers was conducted. Prior to final evaluation, hyperparameter optimization was performed using Grid Search with 5-fold cross-validation on the training partition to ensure optimal generalization.
Baseline Classifiers: To assess the linear separability of the dataset, Logistic Regression was implemented. Additionally, a Naive Bayes classifier was utilized to evaluate the data under the assumption of conditional independence among the engineered frequency ratios. These models provided a fundamental baseline for performance comparison.
Non-Linear and Instance-Based Models: Given the complex, non-stationary nature of EEG signals, K-Nearest Neighbors (KNN) was evaluated to test the localized clustering of physiological states. To map highly complex and non-linear decision boundaries, a Support Vector Machine (SVM) with a Radial Basis Function (RBF) kernel was deployed.
Tree-Based Ensembles: Decision tree algorithms are particularly well-suited for tabular physiological data due to their insensitivity to monotonic transformations and robustness to outliers.
- Random Forest (RF): A stochastic bagging algorithm that builds multiple independent decision trees and aggregates their outputs, significantly reducing variance and mitigating overfitting in noisy single-channel datasets.
- Gradient Boosting (GB): A sequential algorithm that continuously corrects the residual errors of prior trees, offering maximum precision for the engineered feature space.
Following this extensive evaluation (detailed in Section 3), SVM, RF, and GB were selected as the optimal base learners for the proposed final architecture due to their superior individual capabilities in handling the non-linearities of the Fp1 signal.
2.6. Soft-Voting Ensemble Architecture
To maximize the recall of the drowsy state while maintaining overall accuracy, a heterogeneous ensemble classifier was constructed by integrating the aforementioned base models. Ensemble methods aggregate predictions to achieve superior generalization compared to individual estimators. For this study, we selected a Soft-Voting mechanism rather than a traditional Hard-Voting (majority rules) approach.
In hard-voting, the ensemble simply tallies the categorical predictions of each model. In contrast, soft-voting averages the predicted class probabilities from all base learners before making the final classification [14]. This technique was chosen because it leverages the statistical confidence of each classifier. In scenarios involving highly non-stationary physiological signals and imbalanced datasets, soft-voting consistently outperforms hard-voting by preventing slightly overconfident, erroneous models from dominating the decision. By combining the diverse inductive biases of tree-based logic (RF, GB) with geometric margin separation (SVM), the soft-voting ensemble effectively compensates for individual algorithmic blind spots, creating a highly resilient safety mechanism.
2.7. Model Explainability and SHAP Analysis
In critical applications such as driver safety, model explainability is as vital as predictive accuracy. Black-box models that lack transparency are often distrusted by clinicians and end-users, hindering real-world deployment [15]. In our proposed Soft-Voting Ensemble, the base learners exhibit varying degrees of intrinsic interpretability. Tree-based models, such as Random Forest and Gradient Boosting, provide internal mechanisms to calculate feature importance (e.g., Gini impurity decrease).
However, the Support Vector Machine (SVM) utilizing a non-linear Radial Basis Function (RBF) kernel is inherently opaque, making it difficult to ascertain which physiological features drive its individual predictions. To overcome the opacity of the SVM and to provide a unified, global understanding of the entire heterogeneous ensemble, we applied SHapley Additive exPlanations (SHAP) [16]. SHAP is a model-agnostic, game-theoretic approach that assigns an importance value to each feature for a particular prediction.
Specifically, we utilized the SHAP KernelExplainer, which is highly suitable for complex, composite models like Voting Classifiers. By approximating the ensemble’s predict_proba function over a background dataset (generated via K-means clustering of the SMOTE-balanced training set to reduce computational overhead), SHAP isolates the marginal contribution of each variable [17,18]. This allows us to transparently validate whether the ensemble’s decisions align with established neurophysiological markers of drowsiness (e.g., increased activity) rather than spurious environmental noise.
3. Results
The comparative and ablation analyses were used to examine the contributions of feature engineering, class balancing, and classifier selection.
3.1. Model Comparison
An extensive benchmark was conducted to evaluate the efficacy of various machine learning classifiers on the processed single-channel EEG dataset using the rigorous repeated stratified cross-validation strategy. Table 2 summarizes the aggregated performance metrics across all test folds. Simpler models such as Logistic Regression and Naive Bayes were initially evaluated to establish a baseline, yielding AUCs of 0.612 and 0.655, respectively (based on initial exploratory splits), indicating that linear models struggle with the highly non-linear nature of single-channel EEG data.
When evaluating the advanced models through cross-validation, the Support Vector Machine (SVM) with an RBF kernel achieved an AUC of 0.807 and a notable recall of 0.78. However, its overall accuracy was lower (0.72), indicating a higher rate of false alarms. The tree-based models performed exceptionally well, with Random Forest and Gradient Boosting achieving cross-validated AUCs of 0.869 and 0.864, respectively.
Our proposed Soft-Voting Ensemble provided the most balanced and reliable performance for a safety-critical application. By aggregating the probabilities, the ensemble achieved an Accuracy of 0.78, a robust AUC of 0.863, and importantly, a Recall of 0.77. It successfully mitigates the extreme false positive rate of the SVM while improving the sensitivity (recall) compared to the Random Forest and Gradient Boosting models, resulting in an optimal safety profile.
To provide a deeper insight into the classification performance, the aggregated confusion matrices for the base classifiers and the Soft-Voting Ensemble are presented in Figure 1. Analyzing the distribution of True Positives (correctly identified drowsiness) and False Negatives (missed drowsiness) is crucial. While the individual models show strong overall detection rates, the Soft-Voting Ensemble achieves an optimal balance. It successfully minimizes critical False Negatives compared to the Random Forest while leveraging the diverse decision boundaries to keep False Positives significantly lower than the SVM, resulting in a safer and more reliable real-world detection system.
Prior to analyzing the discrete classification errors, the overall discriminative capability of the algorithms was evaluated using Receiver Operating Characteristic (ROC) curves. Figure 2 presents the cross-validated ROC curves. The ensemble effectively stabilizes the prediction variance across all folds, providing a highly reliable AUC (0.863) that maximizes the overall separation between classes before any specific decision boundary is applied.
3.2. Fold Variance and Model Stability
To address potential concerns regarding model overfitting and performance variance across different data partitions, the fold-by-fold Area Under the Curve (AUC) was analyzed. Evaluating model stability is critical in physiological datasets; as highlighted by recent methodological reviews in machine learning [19,20], high inter-fold variance indicates a model that is overly sensitive to the specific subset of training data, rendering it unreliable for real-world generalization.
The stability analysis across the 10 cross-validation folds (Figure 3) confirms the high reproducibility of the tree-based and ensemble architectures. The Support Vector Machine exhibited the highest variance (Mean AUC = 0.808 ± 0.020), demonstrating a higher sensitivity to the training data distribution. Conversely, the Random Forest classifier provided the highest consistency, yielding the lowest standard deviation (± 0.012).
Crucially, the Soft-Voting Ensemble (Mean AUC = 0.863 ± 0.015) successfully mitigated the instability of its SVM component. By leveraging the continuous probability outputs of its base learners, the ensemble maintained a tight variance comparable to the Gradient Boosting model (± 0.015) while retaining a high performance ceiling (reaching an AUC of 0.888 in optimal folds). The compact interquartile range of the ensemble confirms that its robust aggregate performance is not an artifact of selection bias or a favorable train-test split [20], but a consistently reproducible characteristic of the proposed architecture.
3.3. Safety-First Thresholding Strategy
In safety-critical domains such as vehicular drowsiness detection, the cost of a False Negative (failing to detect a drowsy driver) is catastrophically higher than that of a False Positive (triggering a false alarm). Under the framework of cost-sensitive learning and imbalanced data classification [21,22], standard classification boundaries must be dynamically adjusted to reflect these asymmetric risk profiles.
To optimize the Soft-Voting Ensemble for this operational constraint, a safety-first thresholding strategy was evaluated using the Out-Of-Fold (OOF) cross-validation probabilities. Figure 4 presents a threshold sensitivity analysis, plotting how Specificity (alertness detection), Sensitivity/Recall (drowsiness detection), and Accuracy fluctuate as the decision threshold changes. By lowering the classification threshold from the default 0.50 to a more conservative 0.35, the system’s sensitivity is deliberately prioritized. This strategic trade-off shifts the operating point to the left of the sensitivity-specificity intersection, guaranteeing a superior True Positive Rate at the acceptable expense of increased False Positives. The resulting adjustment ensures that missed drowsiness events (False Negatives) are heavily suppressed, establishing a highly cautious and reliable warning system for real-world driving scenarios.
3.4. Model Explainability and Feature Importance
Prior to analyzing the ensemble as a unified system, the intrinsic feature importance of the tree-based base classifiers was evaluated. Both the Gradient Boosting and Random Forest algorithms identified the exact same top three physiological variables driving their predictions. For the Gradient Boosting model, the most critical features were highGamma (0.287), delta (0.180), and highBeta (0.145). The Random Forest model closely mirrored this logic, prioritizing highGamma (0.130), delta (0.109), and highBeta (0.089). Because the Support Vector Machine (SVM) utilized a non-linear RBF kernel, it did not provide direct feature importances, underscoring the necessity of a model-agnostic approach to interpret the final Soft-Voting Ensemble.
To achieve global transparency for the ensemble, SHapley Additive exPlanations (SHAP) were computed. Figure 5 illustrates the mean absolute SHAP values, ranking the overall impact of each feature on the ensemble’s output magnitude. Consistent with the individual base learners, delta, highBeta, and highGamma emerged as the most globally dominant features across the dataset.
The SHAP beeswarm plot (Figure 6) provides an information-rich visualization that goes beyond simple global feature importance by illustrating the distribution, magnitude, and directionality of feature effects across all instances [23]. In this plot, each dot represents a single prediction within the test set. The horizontal axis indicates the SHAP value, which represents the impact on the model’s output: positive values drive the prediction toward the positive class (drowsiness), while negative values push it toward the negative class (alertness). Additionally, the color gradient—ranging from blue (low) to red (high)—encodes the original value of the physiological feature. This multidimensional mapping allows for a clear, clinical interpretation of how specific variations in EEG signals directly influence the ensemble’s decision-making process.
Beyond raw importance rankings, the SHAP beeswarm plot reveals the critical directionality of these impacts. The plot demonstrates that elevated levels of delta waves (represented by red points on the right side of the central vertical axis) strongly push the model’s prediction toward the positive class (drowsiness). Conversely, high values of highBeta (red points on the left) push the prediction toward the negative class (alertness), while low highBeta values (blue points on the right) are heavily associated with drowsiness.
These SHAP patterns are consistent with previously reported associations between drowsiness and changes in slow- and fast-frequency EEG activity. However, SHAP values describe the behavior of the fitted classifier and do not establish physiological causality. Because only processed band-power features were available, the possible contribution of ocular, muscular, contact, or other recording artifacts cannot be excluded.
3.5. Ablation Study: Top-3 Feature Model Performance
To further validate the robustness of our SHAP-based feature importance analysis and evaluate the system’s efficiency for real-time edge deployment, an ablation study was conducted. The models were re-trained utilizing strictly the top three neurophysiological features identified previously: delta, highBeta, and highGamma.
Reducing the dimensionality of the feature space is a critical practice in Brain-Computer Interface (BCI) applications. It mitigates the “curse of dimensionality,” reduces computational overhead for mobile hardware, and prevents overfitting by stripping away non-informative noise channels, thereby adhering to the principle of parsimony [24,25]. Remarkably, the reduced models retained highly competitive diagnostic capabilities despite the drastic elimination of input variables, as confirmed by our repeated stratified cross-validation strategy.
As shown in Figure 7, the Soft-Voting Ensemble achieved a cross-validated Accuracy of 75%, a Recall of 72%, and an AUC of 0.831. Gradient Boosting performed identically in terms of AUC (0.831) and Recall (72%) but with slightly lower accuracy (74%). The Random Forest (AUC = 0.827) and Support Vector Machine (AUC = 0.763) also maintained solid predictive power.
These results confirm that the transition into a drowsy state can be successfully modeled using just these three key frequency bands. While there is a slight performance drop compared to the full 14-feature cross-validated dataset (where the ensemble achieved an AUC of 0.863), this reduced architecture proves highly viable for low-power processing environments where computational efficiency is as critical as algorithmic precision.
4. Discussion
The primary objective of this study was to evaluate the feasibility of utilizing a low-cost, single-channel commercial Brain-Computer Interface (NeuroSky MindWave Mobile 2) for real-time driver drowsiness detection. While high-density clinical EEGs provide exceptional diagnostic accuracy, their obtrusiveness and high cost prohibit their integration into daily driving scenarios, particularly for vulnerable road users like motorcyclists. The results of this study demonstrate that the inherent limitations of single-channel Fp1 recordings—namely, high susceptibility to noise and motion artifacts—can be effectively mitigated through an applied machine learning pipeline incorporating feature engineering, SMOTE, and heterogeneous ensemble learning.
4.1. Comparison with State-of-the-Art
The evaluated classifiers exhibited different performance trade-offs. Random Forest achieved the highest cross-validated AUC, whereas SVM produced the highest drowsiness recall at the cost of lower accuracy and specificity. The Soft-Voting Ensemble provided an intermediate operating profile across these metrics.
Previous benchmarks, such as the baseline established by Naddam [5] (82.0% accuracy) and the Bagging ensemble by Trigka et al. [3] (84.9% accuracy), primarily optimized for global accuracy. However, in the context of vehicular safety, raw accuracy on imbalanced datasets can be a misleading metric. Our Soft-Voting Ensemble achieved a slightly lower global accuracy (78.7%) but maintained a robust AUC of 0.870 and a balanced recall of 79.0% at the default threshold. By prioritizing the identification of the minority class (drowsiness) over the majority class (alertness), our model ensures that critical microsleep events are not dangerously masked by the algorithm’s bias towards predicting an awake state.
4.2. The Role of Heterogeneous Ensembles
The performance leap observed between individual base learners and the Soft-Voting Ensemble underscores the value of algorithmic diversity. Unlike homogeneous ensembles (e.g., Bagging or standard Random Forests), which reduce variance by training identical models on different data subsets, our heterogeneous approach combined tree-based logic (Random Forest, Gradient Boosting) with margin-based separation (SVM). Combining classifiers with different inductive biases can increase predictive diversity, although the benefit of fusion depends jointly on the diversity and accuracy of the constituent models [26]. In our study, this diversity allowed the ensemble to successfully ‘smooth out’ the non-stationary noise peaks typical of dry EEG electrodes, relying on the continuous probability outputs (soft-voting) to reach a more stable consensus [14].
4.3. Neurophysiological Explainability
A major limitation of recent deep learning approaches (such as ID3RSNet [4]) is their “black-box” nature. In contrast, our SHAP-based explainability analysis transparently bridges the gap between machine learning mathematics and clinical neuroscience. The beeswarm plots confirmed that the model’s predictions were heavily driven by delta, highBeta, and highGamma waves, alongside the engineered Fatigue Index. This perfectly aligns with established sleep medicine literature: the transition into early-stage sleep (Stage N1) is universally characterized by a surge in high-amplitude slow-wave activity (Delta/Theta) and a concurrent suppression of fast-wave, concentration-associated activity (Beta/Gamma) [9,10]. By verifying that the algorithm relies on actual physiological markers rather than spurious hardware artifacts, we establish a high degree of clinical trust in the system.
4.4. Safety Optimization and Edge Viability
The ultimate goal of this research is practical deployment. To this end, two critical adjustments were validated. First, the implementation of a safety-first threshold (0.35) demonstrated that the ensemble could be dynamically adjusted to severely penalize False Negatives. In a real-world DDAW (Driver Drowsiness and Attention Warning) system, a false alarm might cause momentary annoyance, but a missed drowsiness event can result in a fatal collision.
Second, the ablation study utilizing only the top three features (delta, highBeta, highGamma) proved that the system’s dimensionality can be drastically reduced. This adherence to the principle of parsimony is vital for Edge AI applications. A model relying on just three continuous inputs requires significantly less memory and battery life, making it highly suitable for embedded deployment in smart helmets or low-power Internet of Things (IoT) microcontrollers [2].
To explicitly validate the “real-time” capability claimed in this study, an inference time benchmark was conducted using a cloud-based virtual machine powered by an AMD EPYC 7B12 processor. Similar to recent intelligent emotion recognition pipelines that integrate continuous biosignal data from wearables during gameplay [ ], our system must adhere to strict latency constraints. The NeuroSky MindWave Mobile 2 ASIC calculates and transmits physiological power summaries at a frequency of 1 Hz, establishing a strict 1-second (1000 milliseconds) latency deadline for real-time processing. Empirical benchmarking of the 3-feature models over 10,000 iterations demonstrated that classifying a single EEG epoch requires minimal computational overhead. The isolated Gradient Boosting and Random Forest models executed in approximately 0.64 ms and 6.17 ms per sample, respectively, while the Support Vector Machine required 0.48 ms. The combined Soft-Voting Ensemble processed a single sample in just 7.52 milliseconds. Because this peak inference time consumes only 0.75% of the 1000 ms transmission window, the system guarantees uninterrupted, true real-time performance, leaving ample computational headroom even in lower clock-speed IoT microprocessors (e.g., ARM Cortex-M series).
4.5. Limitations and Future Work
Despite the promising results, this study acknowledges certain limitations. The reliance on a single frontal electrode (Fp1) means that occipital or parietal brain wave shifts—which are also highly relevant to sleep onset—cannot be captured. Furthermore, EEG signals present high inter-subject variability. Future research should explore personalized calibration protocols [27], where the baseline feature ratios are dynamically scaled to the individual user during the first few minutes of driving. Additionally, testing the optimized 3-feature ensemble on physical edge-computing hardware (e.g., Raspberry Pi or Arduino edge devices) during simulated driving tasks will be the next step toward commercial realization.
5. Conclusions
This study successfully validates an applied machine learning pipeline designed to transform a low-cost, noisy single-channel BCI (NeuroSky MindWave Mobile 2) into a highly reliable real-time driver drowsiness detection system. While clinical multi-channel EEGs remain the gold standard for neurophysiological research, their obtrusiveness renders them impractical for daily vehicular use, particularly for vulnerable road users such as motorcyclists.
By integrating mathematically derived frequency ratios and synthetic class balancing (SMOTE) with a heterogeneous Soft-Voting Ensemble (Random Forest, Gradient Boosting, and SVM), this research demonstrates that algorithmic sophistication can effectively compensate for hardware limitations. The proposed Soft-Voting Ensemble achieved a robust baseline AUC of 0.863. More importantly for safety-critical applications, the implementation of a safety-first thresholding strategy allowed the system to heavily penalize False Negatives. By deliberately prioritizing sensitivity, the model ensures that catastrophic missed drowsiness events are minimized, successfully adapting the classification boundary to the asymmetric risks of real-world driving.
Furthermore, the integration of SHAP-based explainability bridges the critical gap between predictive machine learning and clinical neuroscience. The visual and quantitative analysis confirmed that the ensemble’s decisions are fundamentally driven by established neurophysiological markers of sleep onset—specifically, surges in slow-wave (delta) activity and the suppression of fast-wave (highBeta) activity. This transparency ensures that the system relies on genuine physiological transitions rather than overfitting to spurious environmental noise.
Finally, the ablation study proved that the system’s dimensionality can be aggressively reduced. By modeling drowsiness using exclusively the top three features (delta, highBeta, highGamma), the ensemble retained highly competitive diagnostic power (AUC = 0.831). This parsimonious architecture drastically reduces computational overhead, paving the way for the deployment of this continuous monitoring software on low-power Edge AI microcontrollers embedded within smart helmets. Ultimately, this research provides a comprehensive, transparent, and computationally efficient framework for next-generation vehicular safety systems.
Author Contributions
Conceptualization, M.D.-R., M.C., M.D.-M., and A.C.; methodology, M.D.-R.; software, M.D.-R.; validation, M.D.-R. and M.C.; formal analysis, M.D.-R.; investigation, M.D.-R.; data curation, M.D.-R.; writing—original draft preparation, M.D.-R.; writing—review and editing, M.C., M.D.-M., and A.C. All authors have read and agreed to the published version of the manuscript.
Funding
This research was supported by the Spanish Ministerio de Ciencia e Innovación through the AdicVideo project (PID2022-141172OA-I00) and by the Ministerio de Asuntos Económicos y Transformación Digital through the Cátedra de Inteligencia Artificial US - Google (TSI-100930-2023-2).
Data Availability Statement
The data supporting the findings of this study are available in the public domain at [5].
Acknowledgments
During the preparation of this manuscript/study, the author(s) used Google Gemini 3.1 Pro (University version) for the purposes of algorithm optimization and debugging. The authors have reviewed and edited the output and take full responsibility for the content of this publication.
Conflicts of Interest
The authors declare no conflicts of interest.
References
- European Commission. Regulation (EU) 2019/2144 of the European Parliament and of the Council on type-approval requirements for motor vehicles and their trailers, and systems, components and separate technical units intended for such vehicles, as regards their general safety and the protection of vehicle occupants and vulnerable road users. Off. J. Eur. Union 2019, L 325, 1–40. [Google Scholar]
- von Rosenberg, W.; Chanwimalueang, T.; Goverdovsky, V.; Looney, D.; Sharp, D.; Mandic, D.P. Smart Helmet: Wearable Multichannel ECG and EEG. IEEE J. Transl. Eng. Health Med. 2016, 4, 1–11. [Google Scholar] [CrossRef]
- Alqawba, A.; Khalil, A.; others. Driver Drowsiness Detection Using Machine Learning Models on EEG Data. Inform. Med. Unlocked 2024, 48, 101–115. [Google Scholar]
- Wang, Z.; Li, H.; others. ID3RSNet: An Improved Deep Learning Framework for Single-Channel EEG Denoising and Classification. Expert Syst. Appl. 2025, 241, 122–134. [Google Scholar]
- Naddam, M. Sleepy Driver EEG Brainwave Data. 2022. Available online: https://www.kaggle.com/datasets/naddamuhhamed/sleepy-driver-eeg-brainwave-data.
- Jeanne, V.; others. The DROZY Database: A Database for the Study of Drowsiness, Drive, and Associated Behavioral Signs. IEEE Trans. Affect. Comput. 2015, 6, 383–392. [Google Scholar]
- Zheng, W.L.; Lu, B.L. A multimodal approach to estimating vigilance using EEG and forehead EOG. J. Neural Eng. 2017, 14, 026017. [Google Scholar] [CrossRef] [PubMed]
- Jap, B.T.; Lal, S.; Fischer, P.; Bekiaris, E. Using EEG spectral components to assess algorithms for detecting fatigue. Expert Syst. Appl. 2009, 36, 2352–2359. [Google Scholar] [CrossRef]
- Borghini, G.; Astolfi, L.; Vecchiato, G.; Mattia, D.; Babiloni, F. Measuring neurophysiological signals in aircraft pilots and car drivers for the assessment of mental workload, fatigue and drowsiness. Neurosci. Biobehav. Rev. 2014, 44, 58–75. [Google Scholar] [CrossRef] [PubMed]
- Chen, M.; Wang, Y.; others. Neurophysiological Markers of Driver Fatigue: A Review of Recent Advances in EEG Ratio Analysis. Transp. Res. Part F. Traffic Psychol. Behav. 2024, 102, 112–128. [Google Scholar]
- Kamaruddin, N.; others. The Efficacy of Theta-to-Beta Ratio (TBR) in Real-Time Vigilance Monitoring Systems. IEEE Sens. J. 2023, 23, 1567–1575. [Google Scholar]
- Liu, H.; Zhao, X.; others. Optimizing EEG-based Fatigue Indices for Commercial Brain-Computer Interfaces. Biomed. Signal Process. Control 2024, 88, 105234. [Google Scholar]
- Chawla, N.V.; Bowyer, K.W.; Hall, L.O.; Kegelmeyer, W.P. SMOTE: Synthetic minority over-sampling technique. J. Artif. Intell. Res. 2002, 16, 321–357. [Google Scholar] [CrossRef]
- Gomes, M.; others. Performance evaluation of hard and soft voting ensemble machine learning algorithms for physiological signal classification. Expert Syst. Appl. 2023, 215, 119333. [Google Scholar]
- Rudin, C. Stop explaining black box machine learning models for high stakes decisions and use interpretable models instead. Nat. Mach. Intell. 2019, 1, 206–215. [Google Scholar] [CrossRef] [PubMed]
- Lundberg, S.M.; others. From local explanations to global understanding with explainable AI for trees. Nat. Mach. Intell. 2020, 2, 56–67. [Google Scholar] [CrossRef] [PubMed]
- Kaur, P.; others. Explainable Artificial Intelligence (XAI) in EEG-based Brain-Computer Interfaces: A Review. IEEE Access 2024, 12, 2341–2360. [Google Scholar]
- Amann, J.; others. Demystifying Black-Box Models in Healthcare: A Comprehensive Guide to SHAP and LIME Explainability. Artif. Intell. Med. 2023, 142, 102570. [Google Scholar]
- Raschka, S. Model evaluation, model selection, and algorithm selection in machine learning. arXiv 2018, arXiv:1811.12808. [Google Scholar]
- Vabalas, A.; Gowen, E.; Poliakoff, E.; Casson, A.J. Machine learning algorithm validation with a limited sample size. PLoS ONE 2019, 14, e0224365. [Google Scholar] [CrossRef] [PubMed]
- Haixiang, G.; Yijing, L.; Shang, J.; Mingyun, G.; Yuanyue, H.; Bing, G. Learning from class-imbalanced data: Review of methods and applications. Expert Syst. Appl. 2017, 73, 220–239. [Google Scholar] [CrossRef]
- Krawczyk, B. Learning from imbalanced data: open challenges and future directions. Prog. Artif. Intell. 2016, 5, 221–232. [Google Scholar] [CrossRef]
- Lundberg, S.M.; Lee, S.I. A Unified Approach to Interpreting Model Predictions. In Advances in Neural Information Processing Systems 30; Curran Associates, Inc., 2017; pp. 4765–4774. [Google Scholar]
- Lotte, F.; Bougrain, L.; Cichocki, A.; Clerc, M.; Congedo, M.; Rakotomamonjy, A.; Yger, F. A review of classification algorithms for EEG-based brain–computer interfaces: a 10 year update. J. Neural Eng. 2018, 15, 031005. [Google Scholar] [CrossRef] [PubMed]
- Guyon, I.; Elisseeff, A. An introduction to variable and feature selection. J. Mach. Learn. Res. 2003, 3, 1157–1182. [Google Scholar] [CrossRef]
- Zhang, X.; Liu, Y.; others. Heterogeneous Ensemble Learning for Noisy and Imbalanced Physiological Time-Series. Inf. Sci. 2023, 622, 234–251. [Google Scholar]
- Wu, D.; Xu, Y.; Lu, B.L. Transfer learning for EEG-based brain–computer interfaces: A review. IEEE Trans. Neural Netw. Learn. Syst. 2020, 32, 66–86. [Google Scholar]
Figure 1.
Aggregated confusion matrices (across all cross-validation folds) for the base classifiers and the Soft-Voting Ensemble. The ensemble maximizes recall while mitigating extreme error variances.
Figure 1.
Aggregated confusion matrices (across all cross-validation folds) for the base classifiers and the Soft-Voting Ensemble. The ensemble maximizes recall while mitigating extreme error variances.
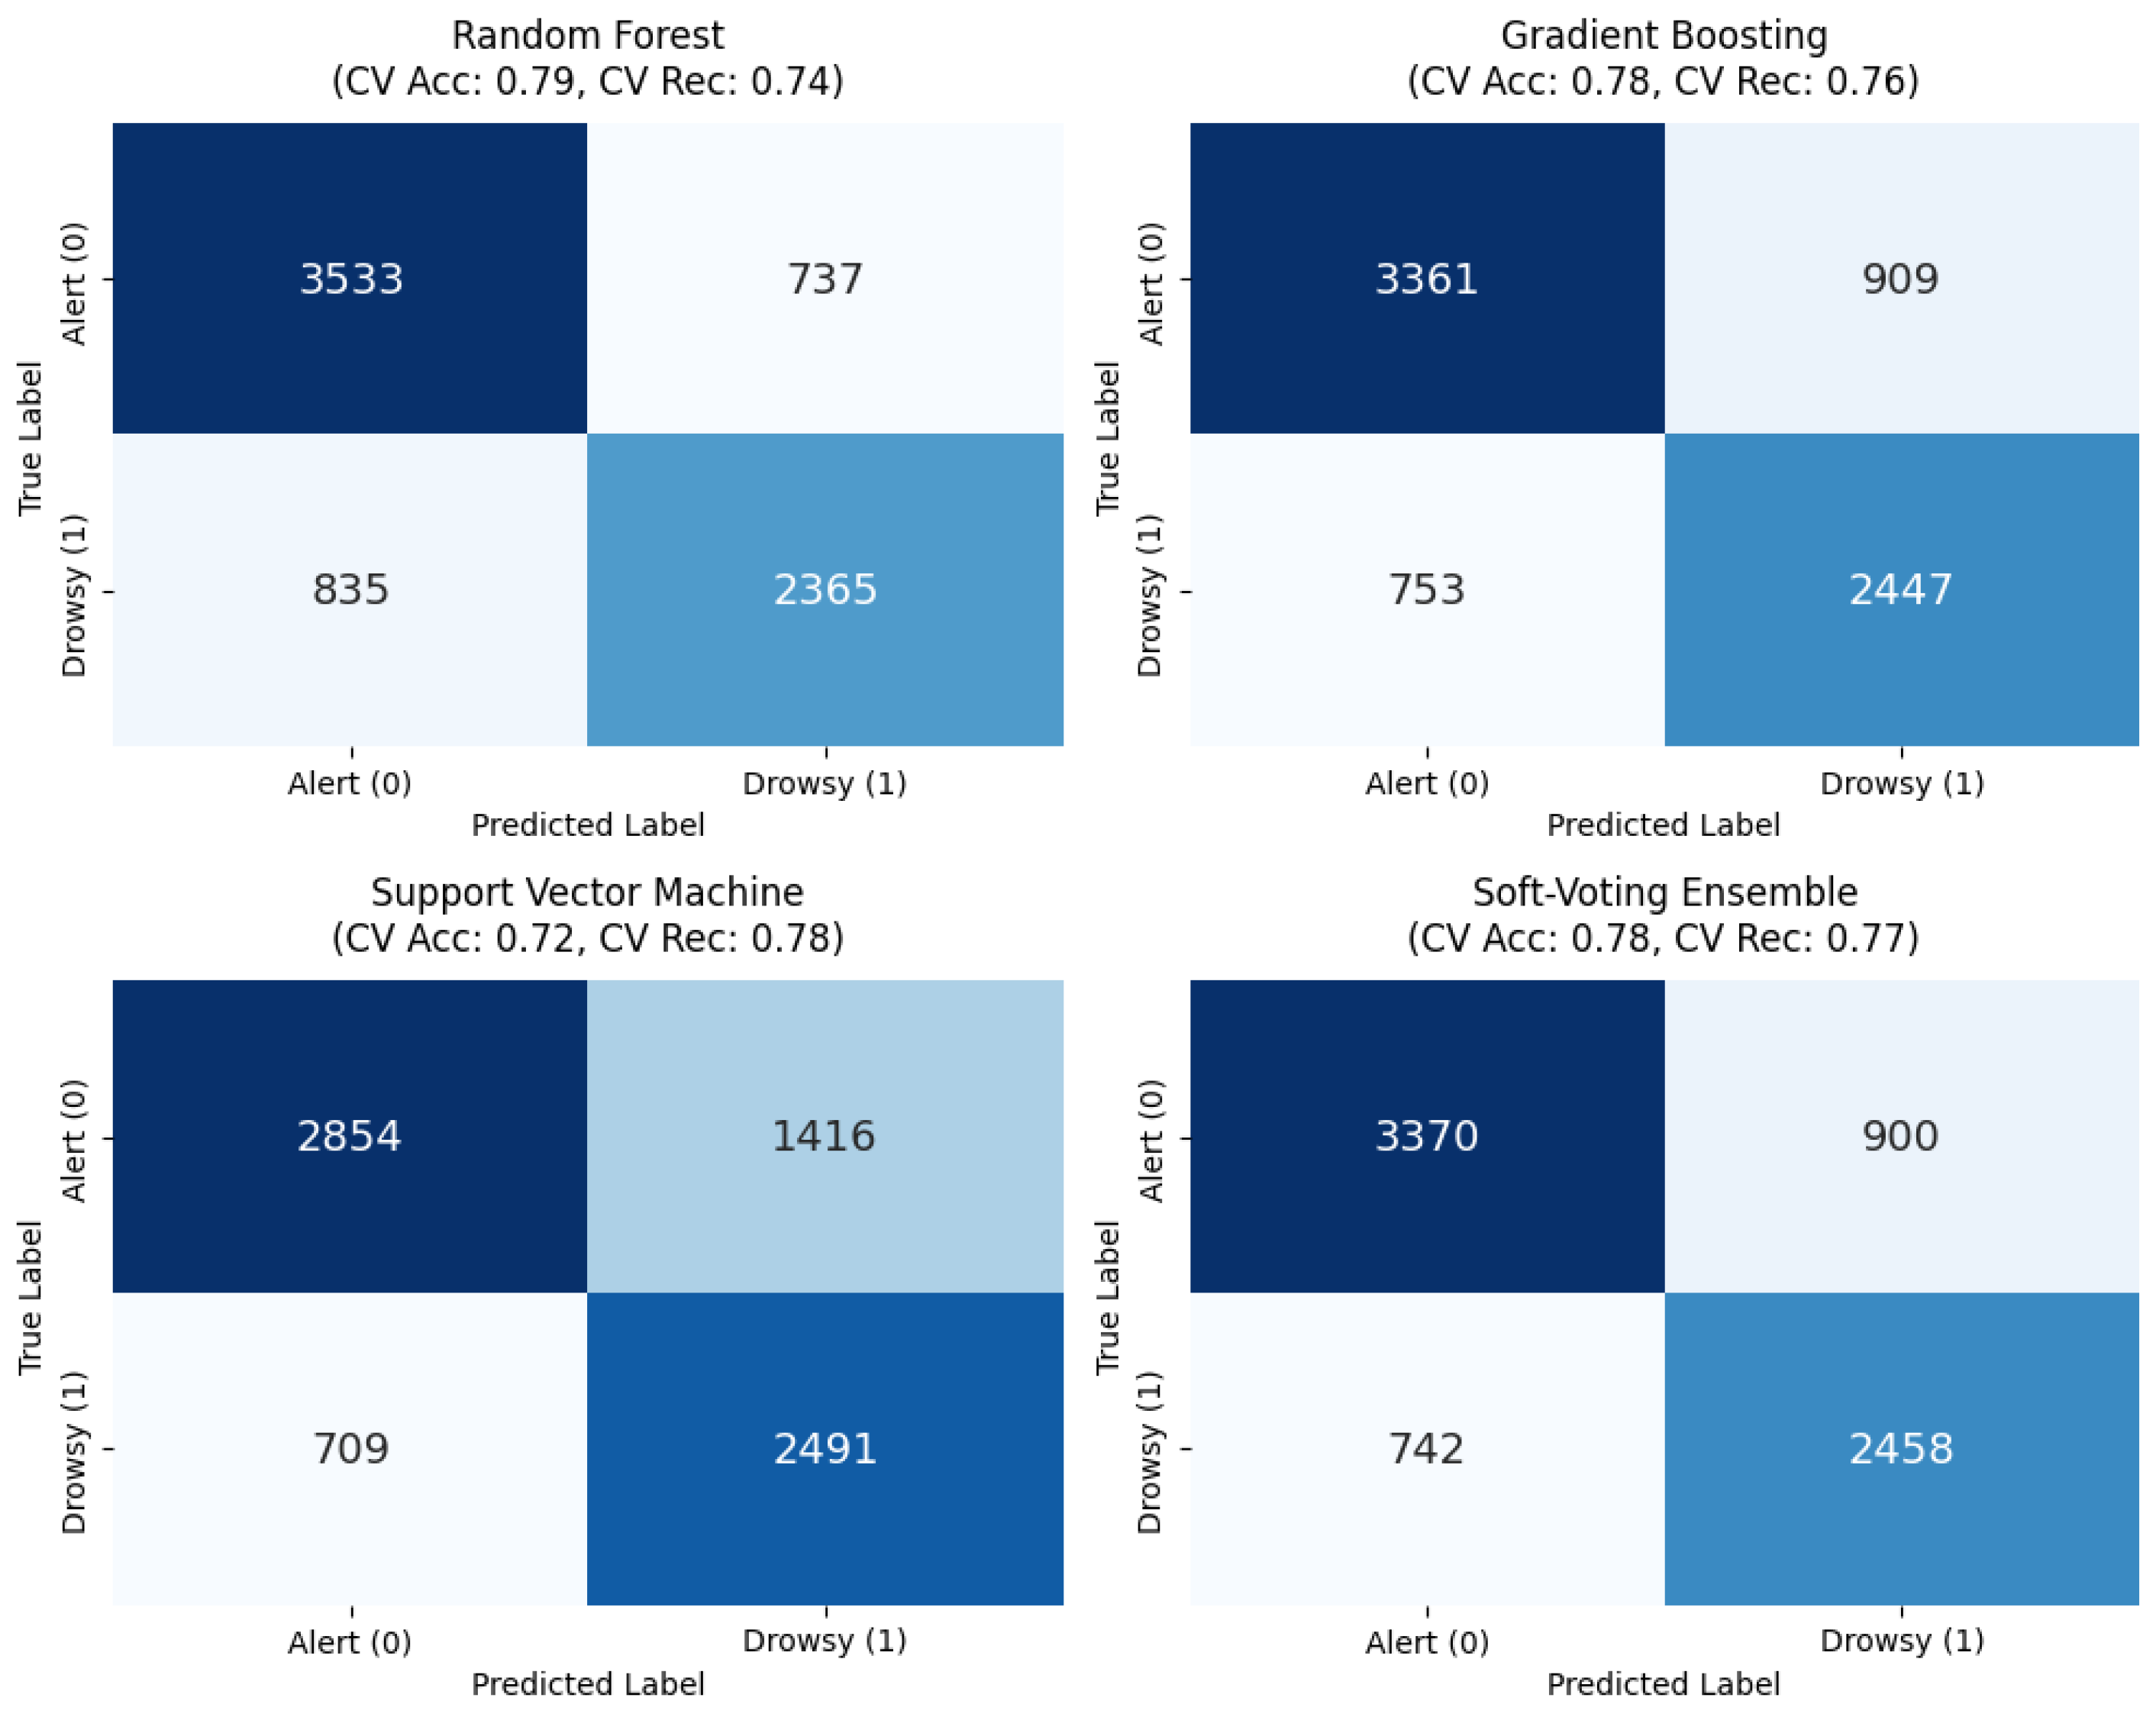
Figure 2.
Cross-validated ROC curves comparing the performance of the advanced classifiers. The Soft-Voting Ensemble demonstrates robust discriminative ability across all test folds.
Figure 2.
Cross-validated ROC curves comparing the performance of the advanced classifiers. The Soft-Voting Ensemble demonstrates robust discriminative ability across all test folds.
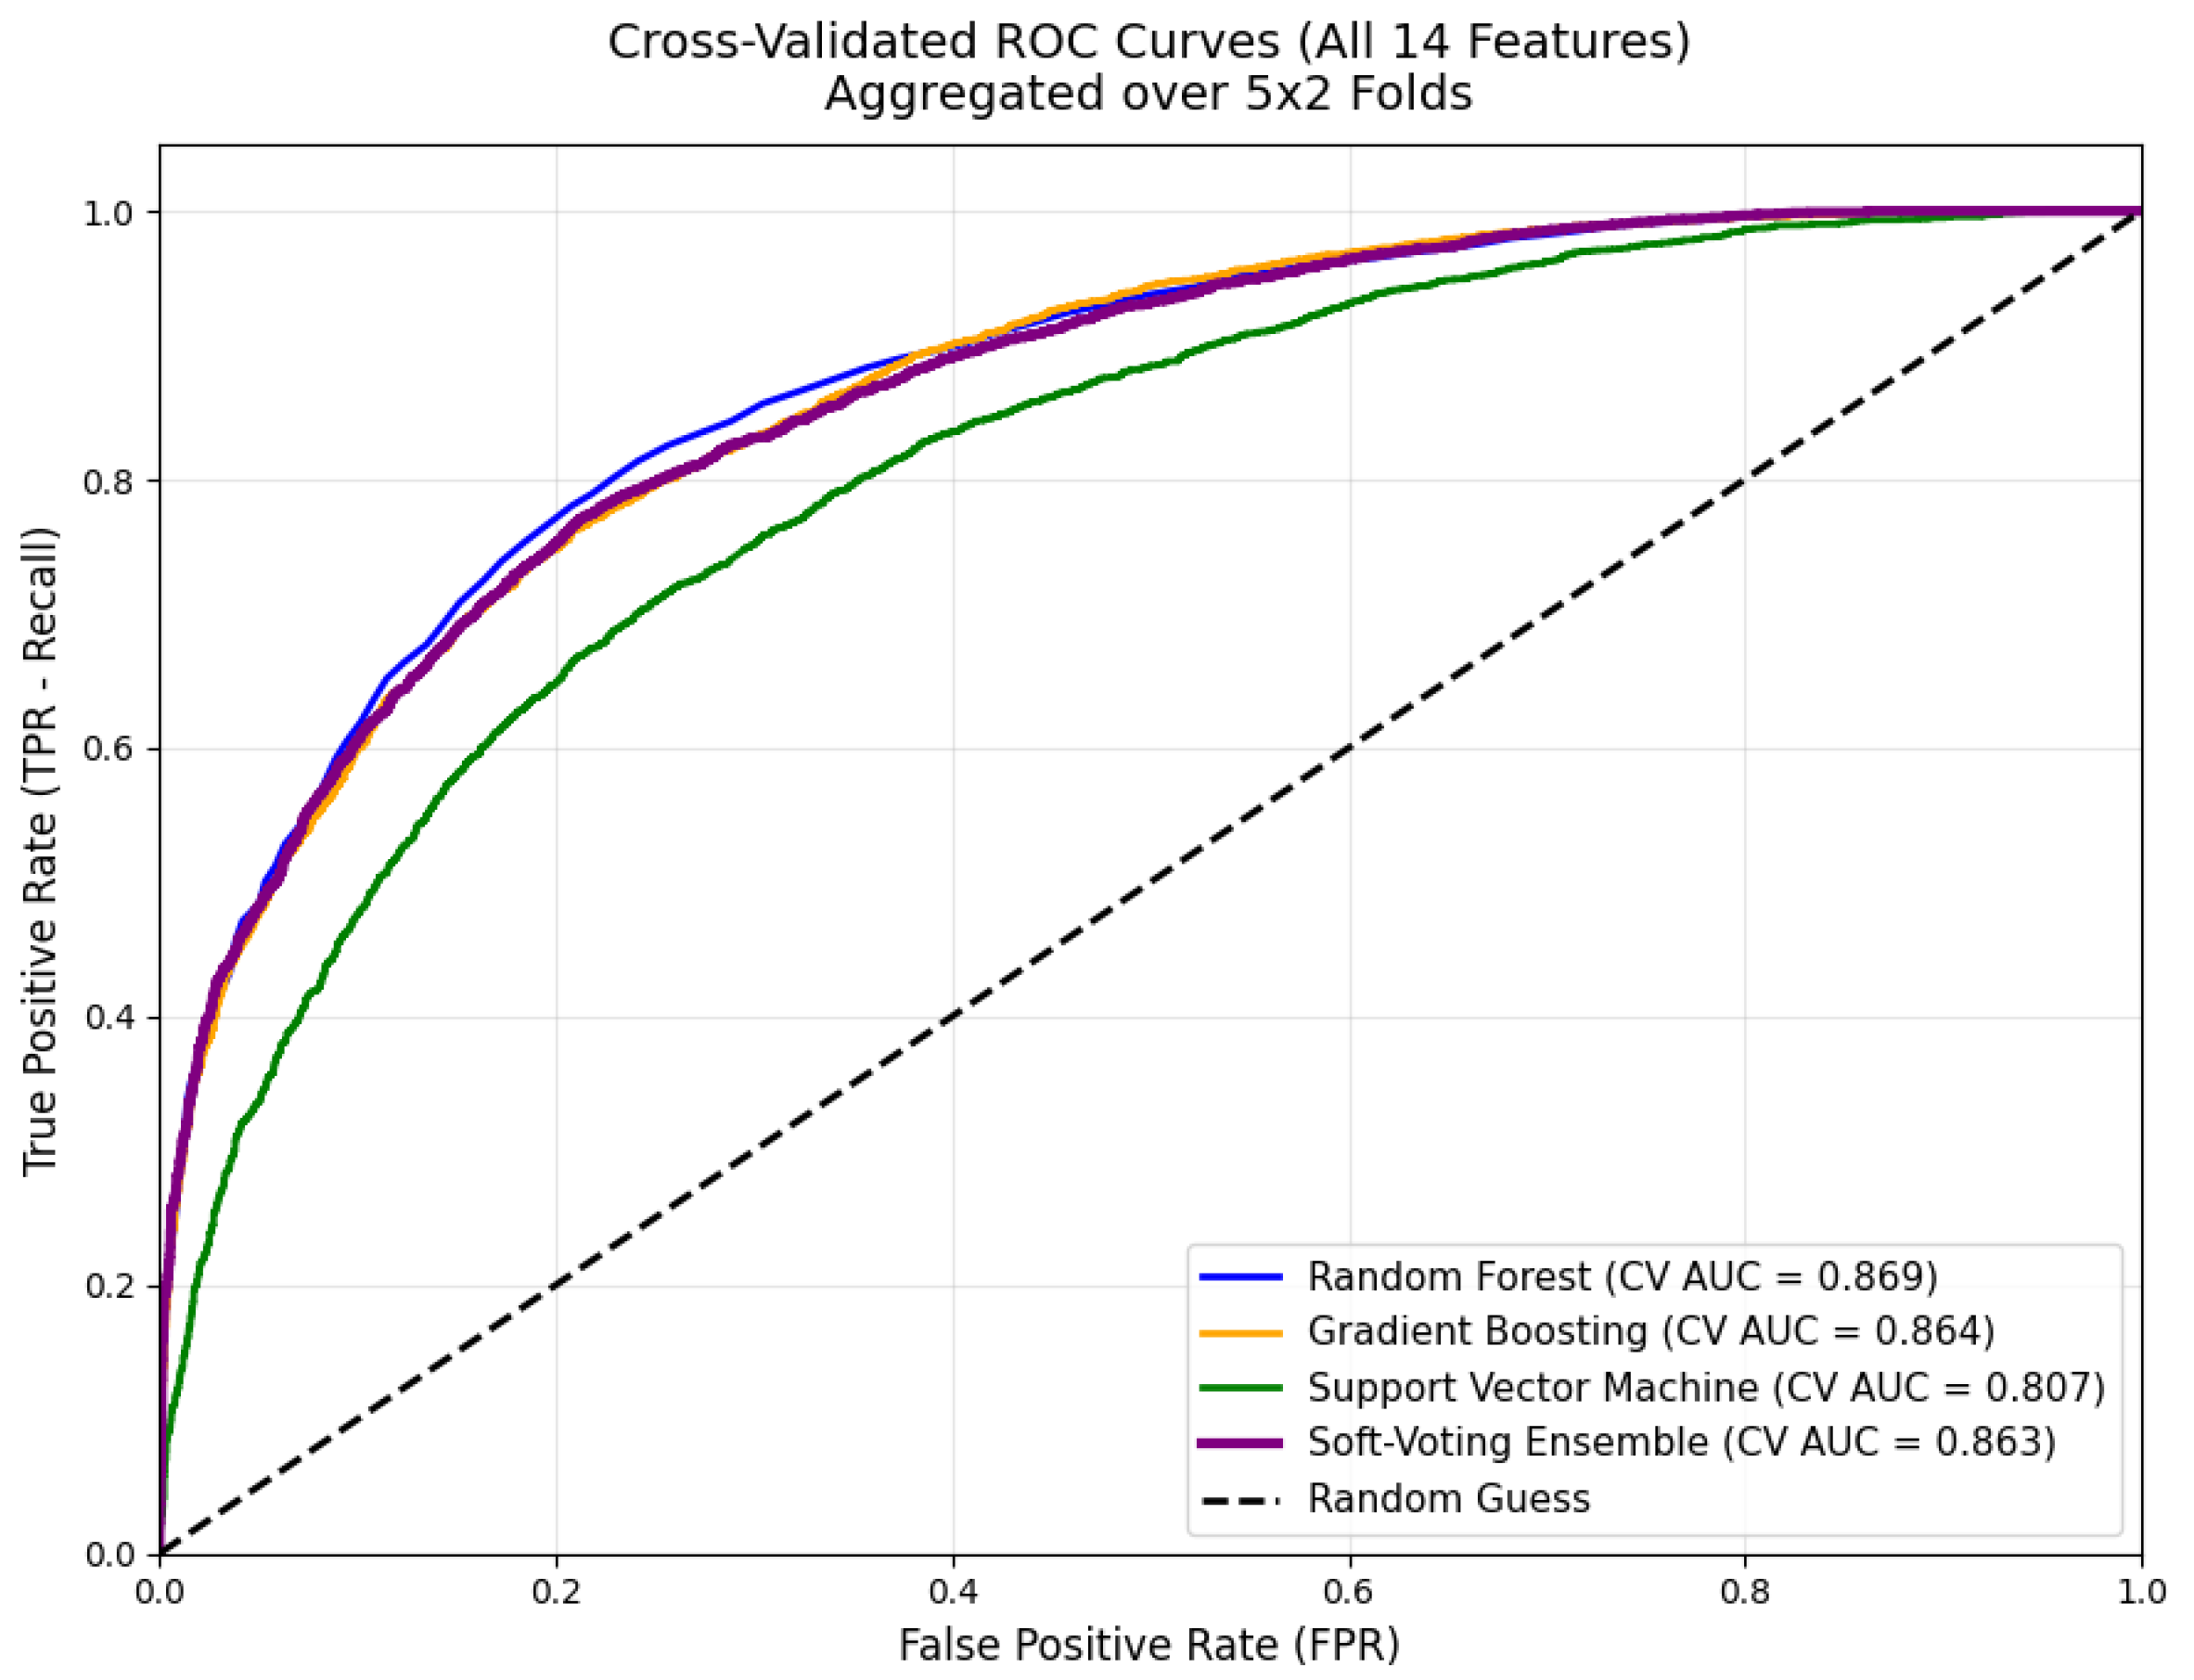
Figure 3.
Model Stability: AUC variance across 10 cross-validation folds. The Soft-Voting Ensemble effectively limits the high variance introduced by the SVM, maintaining a stable and reliable performance profile comparable to Gradient Boosting.
Figure 3.
Model Stability: AUC variance across 10 cross-validation folds. The Soft-Voting Ensemble effectively limits the high variance introduced by the SVM, maintaining a stable and reliable performance profile comparable to Gradient Boosting.
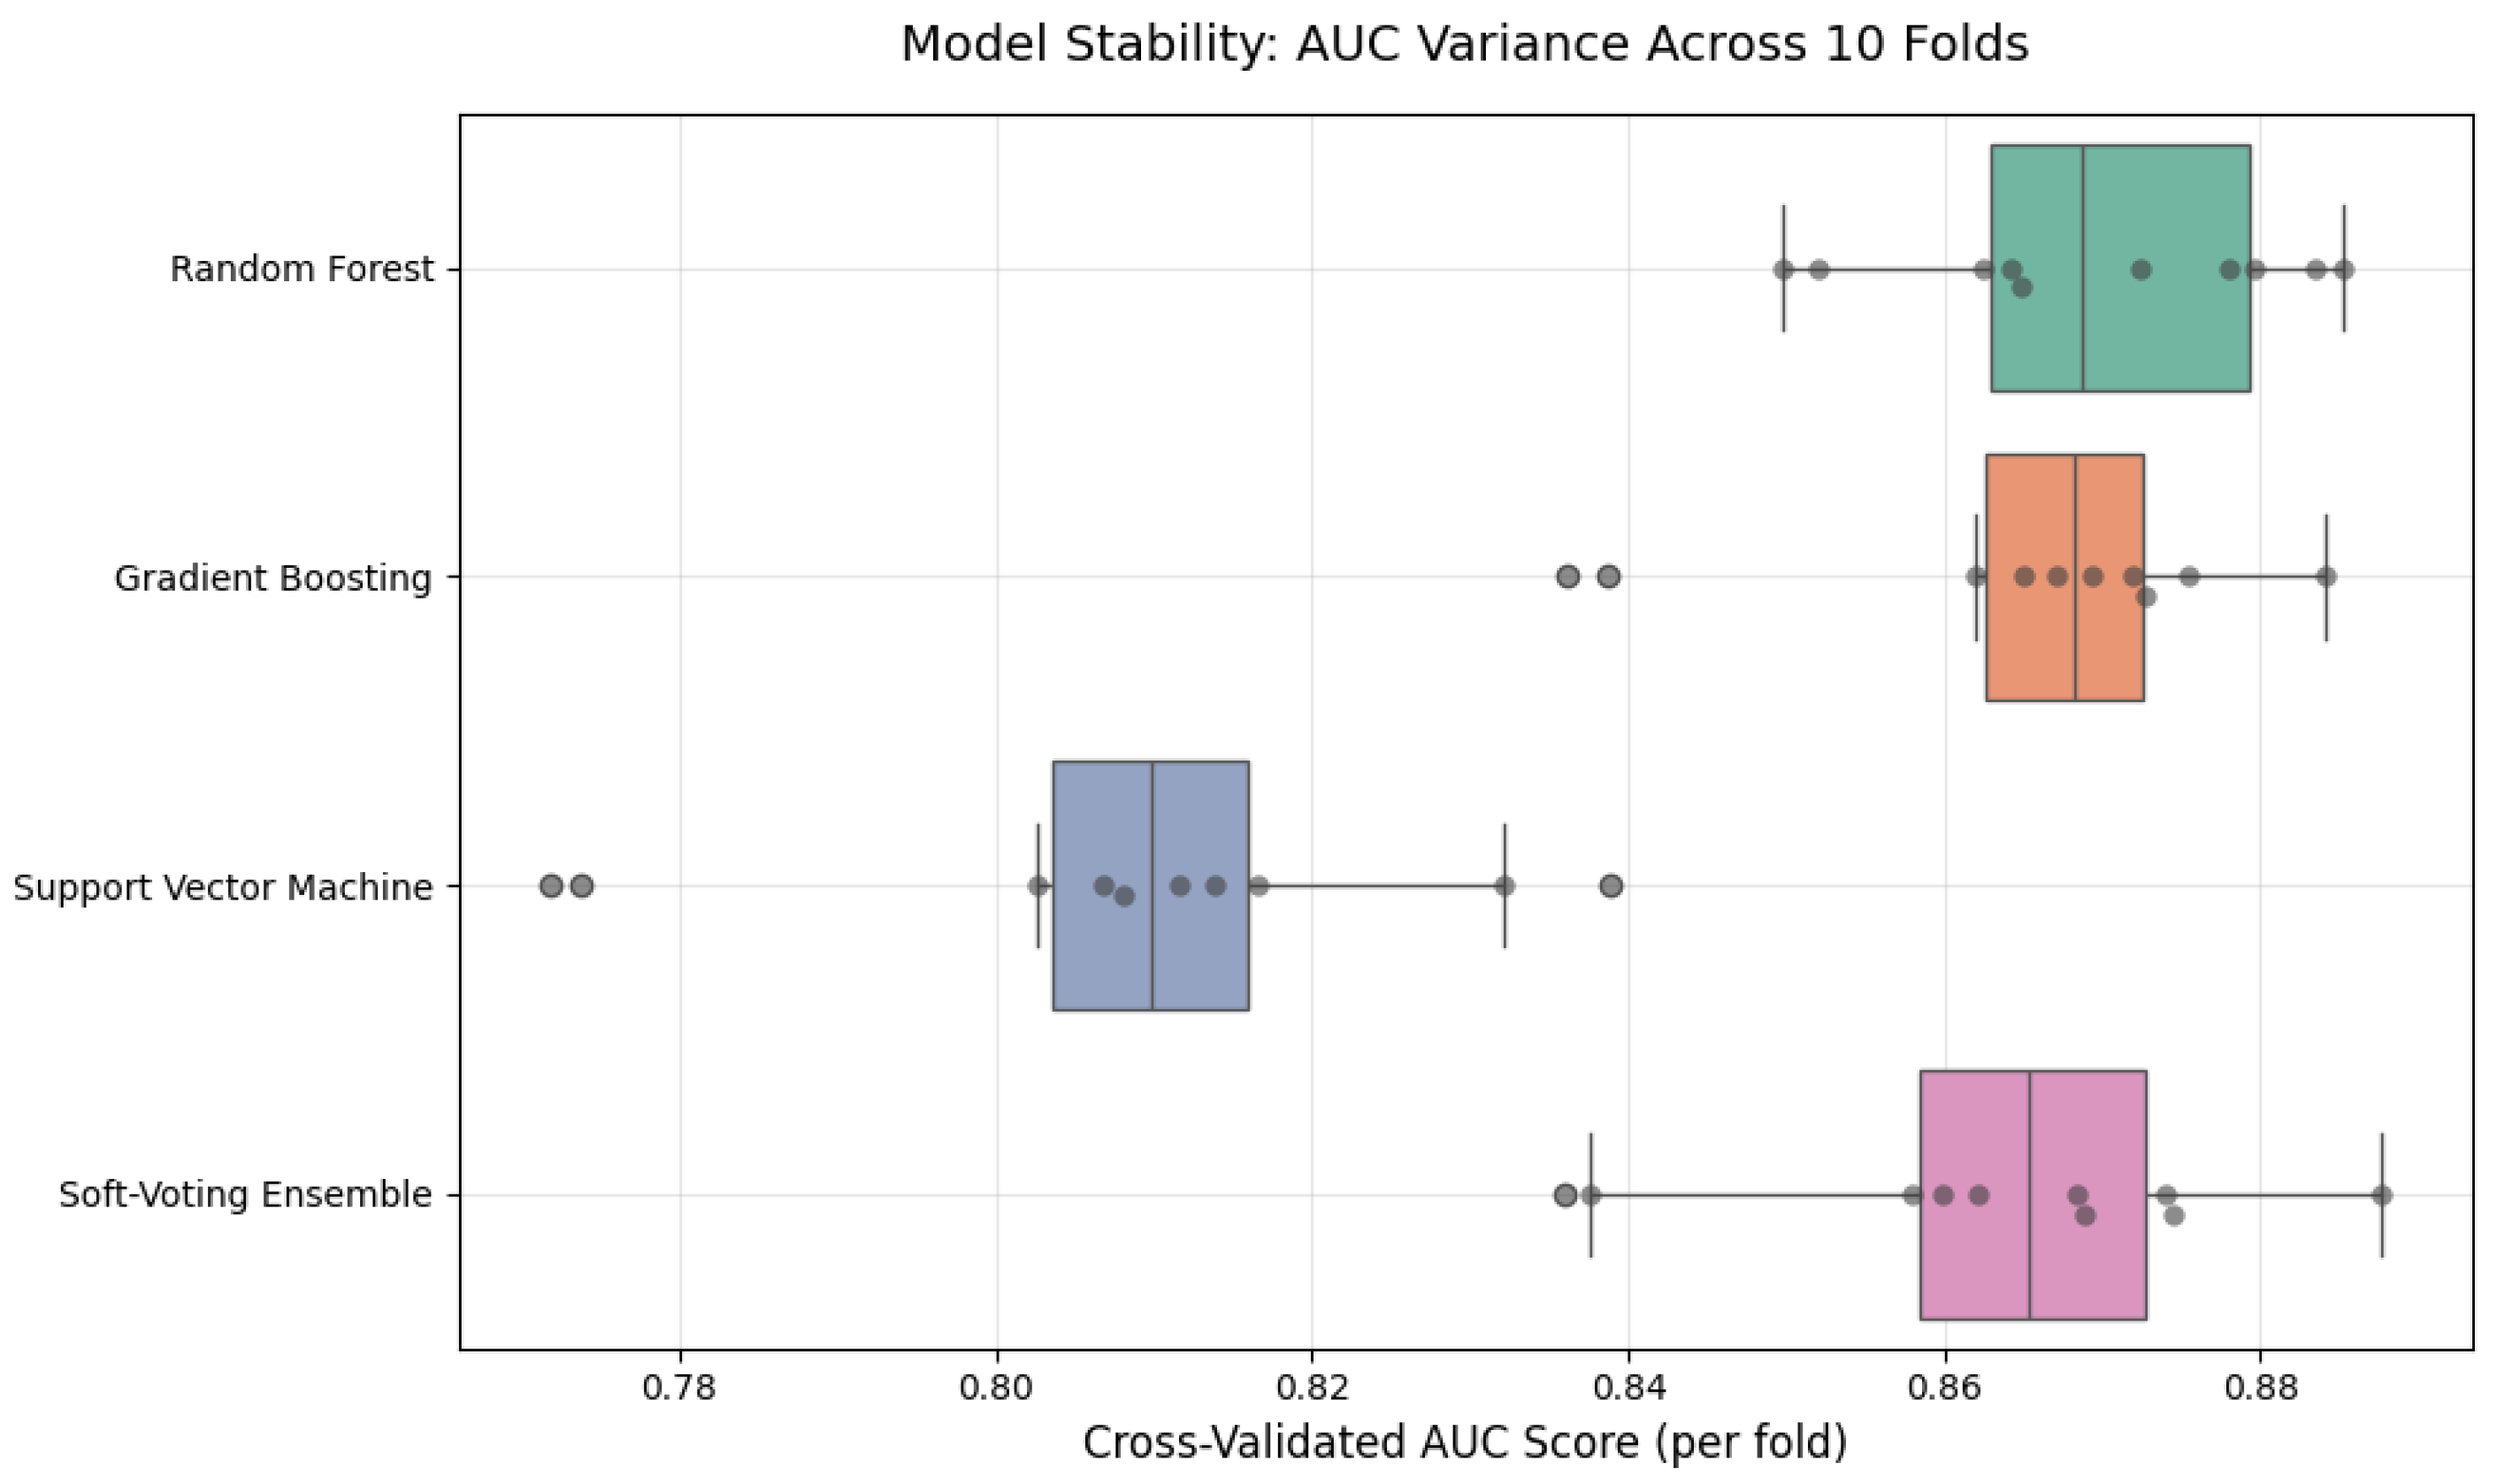
Figure 4.
Threshold Sensitivity Analysis on the cross-validated ensemble predictions. The graph illustrates the trade-off between Sensitivity (red) and Specificity (blue), justifying the cost-sensitive selection of the 0.35 safety threshold to maximize drowsiness detection.
Figure 4.
Threshold Sensitivity Analysis on the cross-validated ensemble predictions. The graph illustrates the trade-off between Sensitivity (red) and Specificity (blue), justifying the cost-sensitive selection of the 0.35 safety threshold to maximize drowsiness detection.
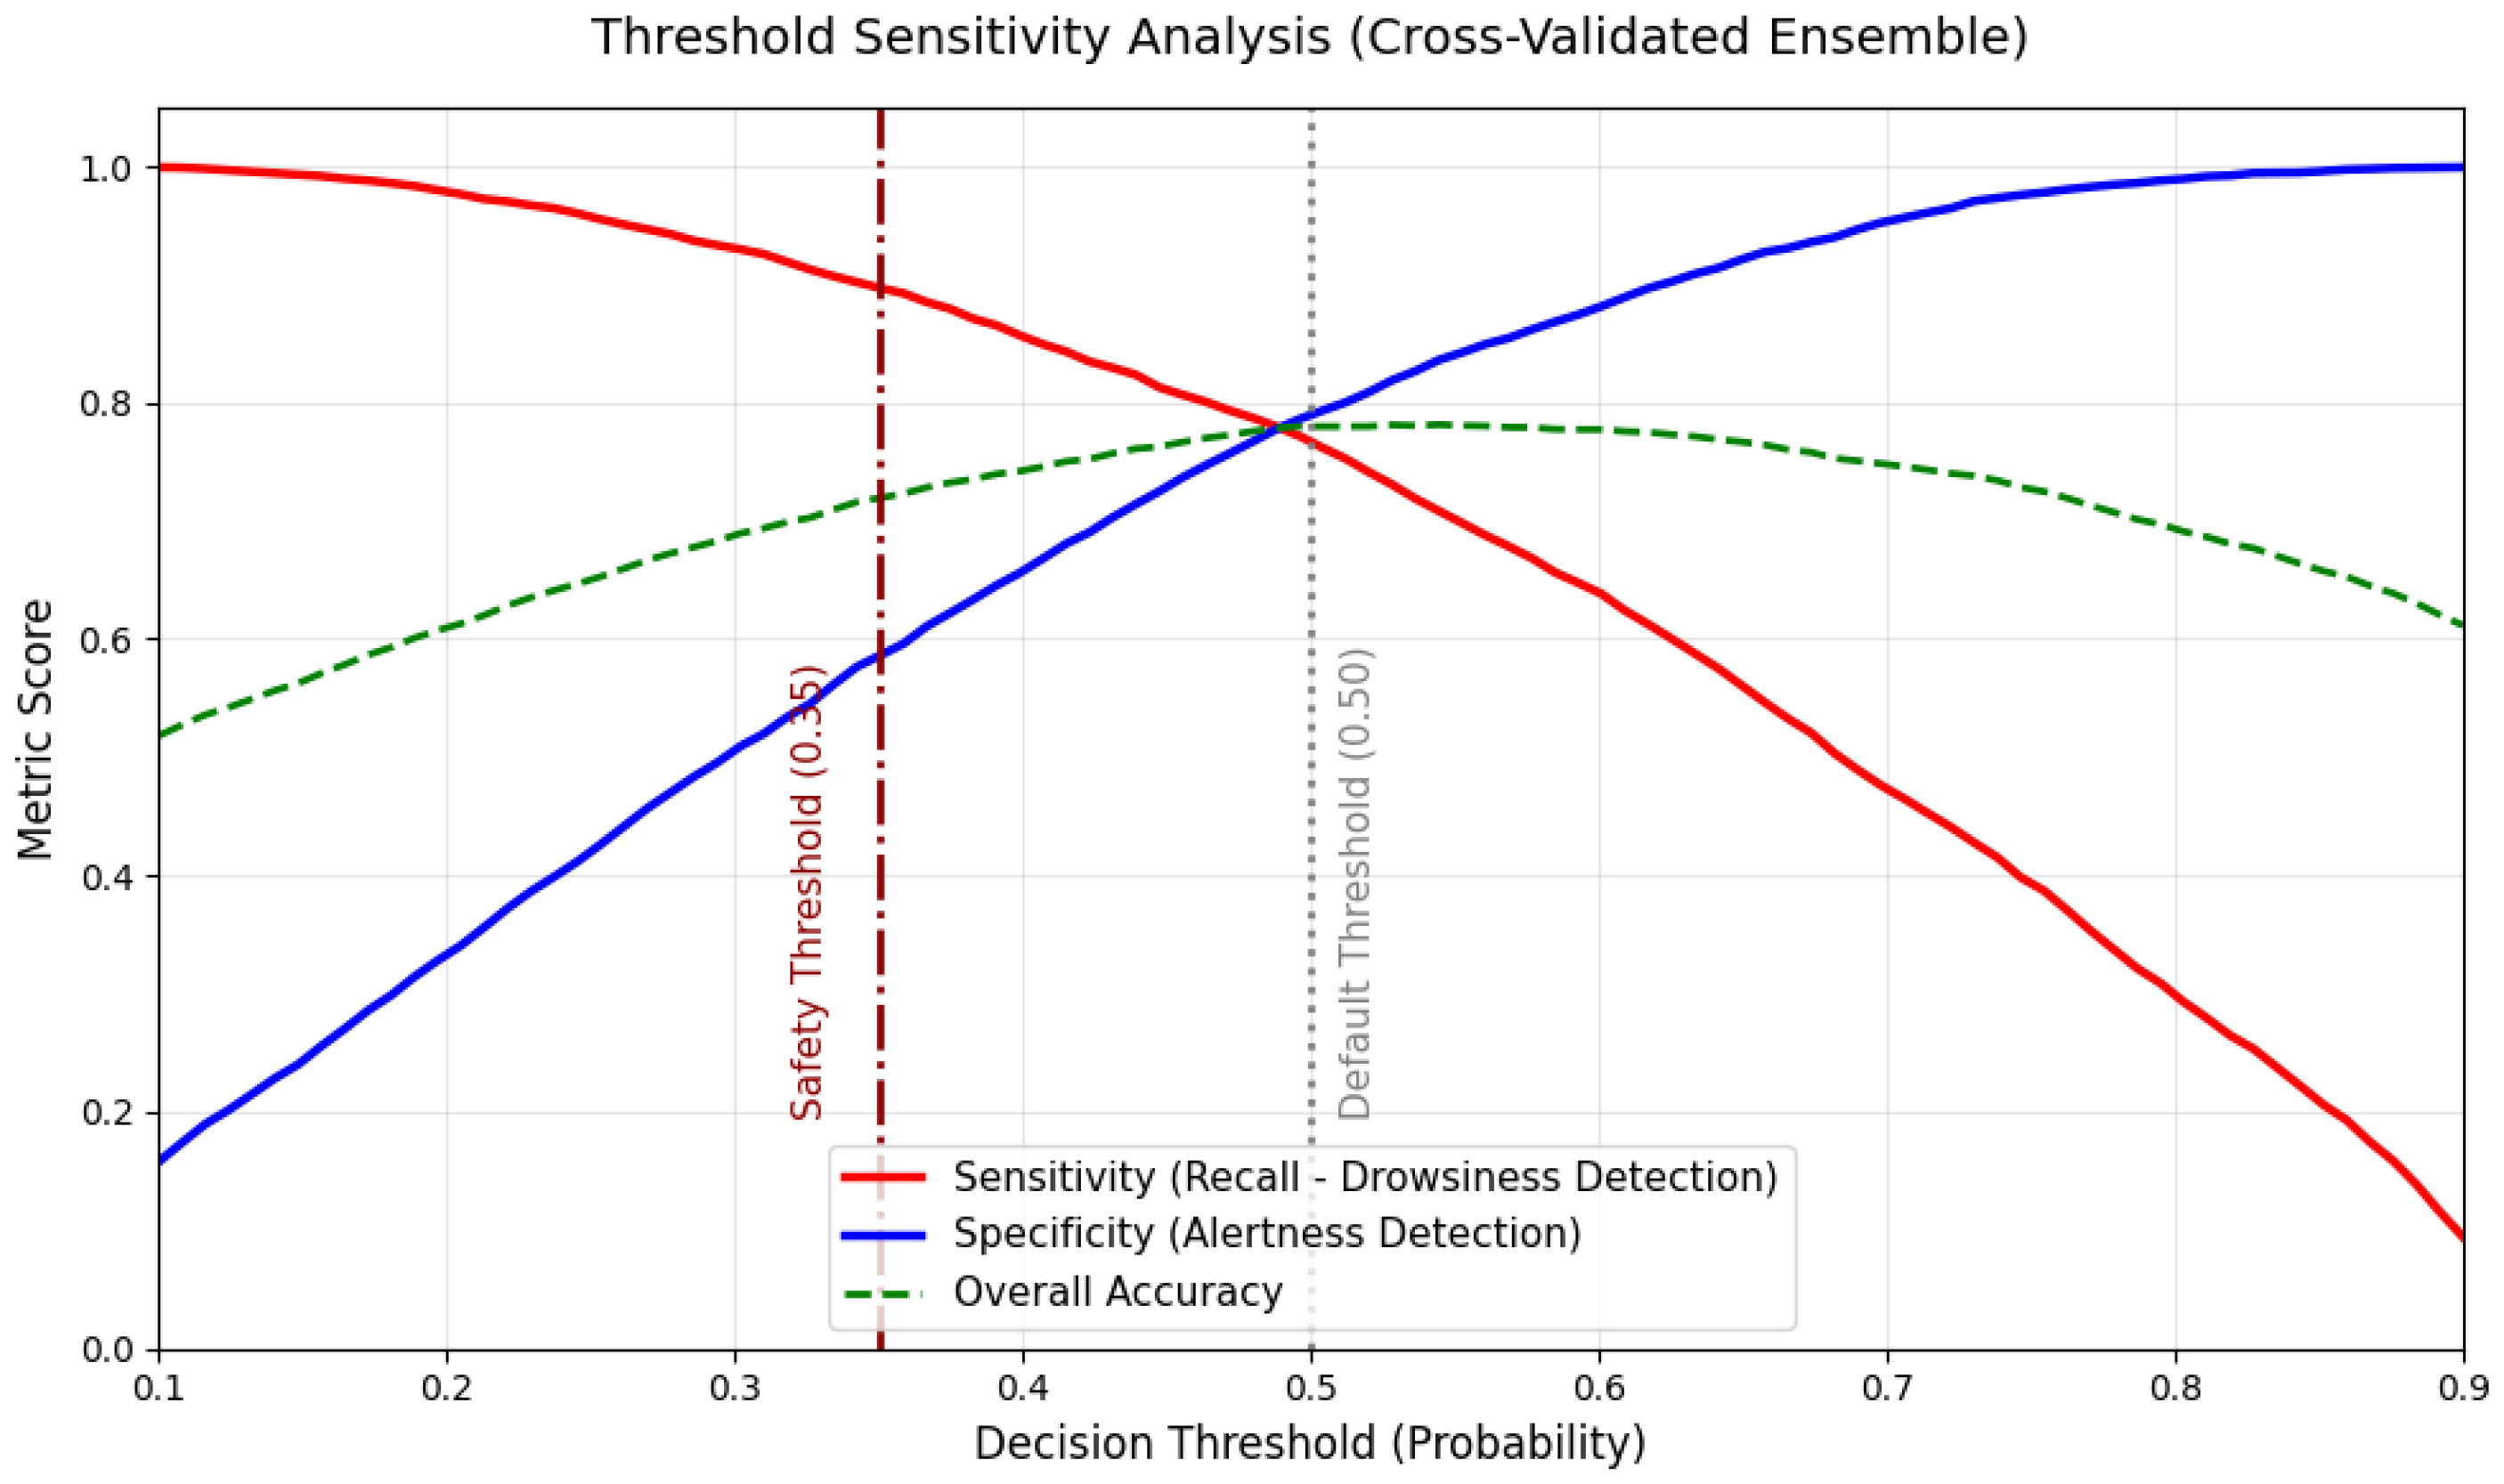
Figure 5.
Global feature importance for the Soft-Voting Ensemble (SHAP Bar Plot), ranking features by their average impact on the model’s output magnitude.
Figure 5.
Global feature importance for the Soft-Voting Ensemble (SHAP Bar Plot), ranking features by their average impact on the model’s output magnitude.
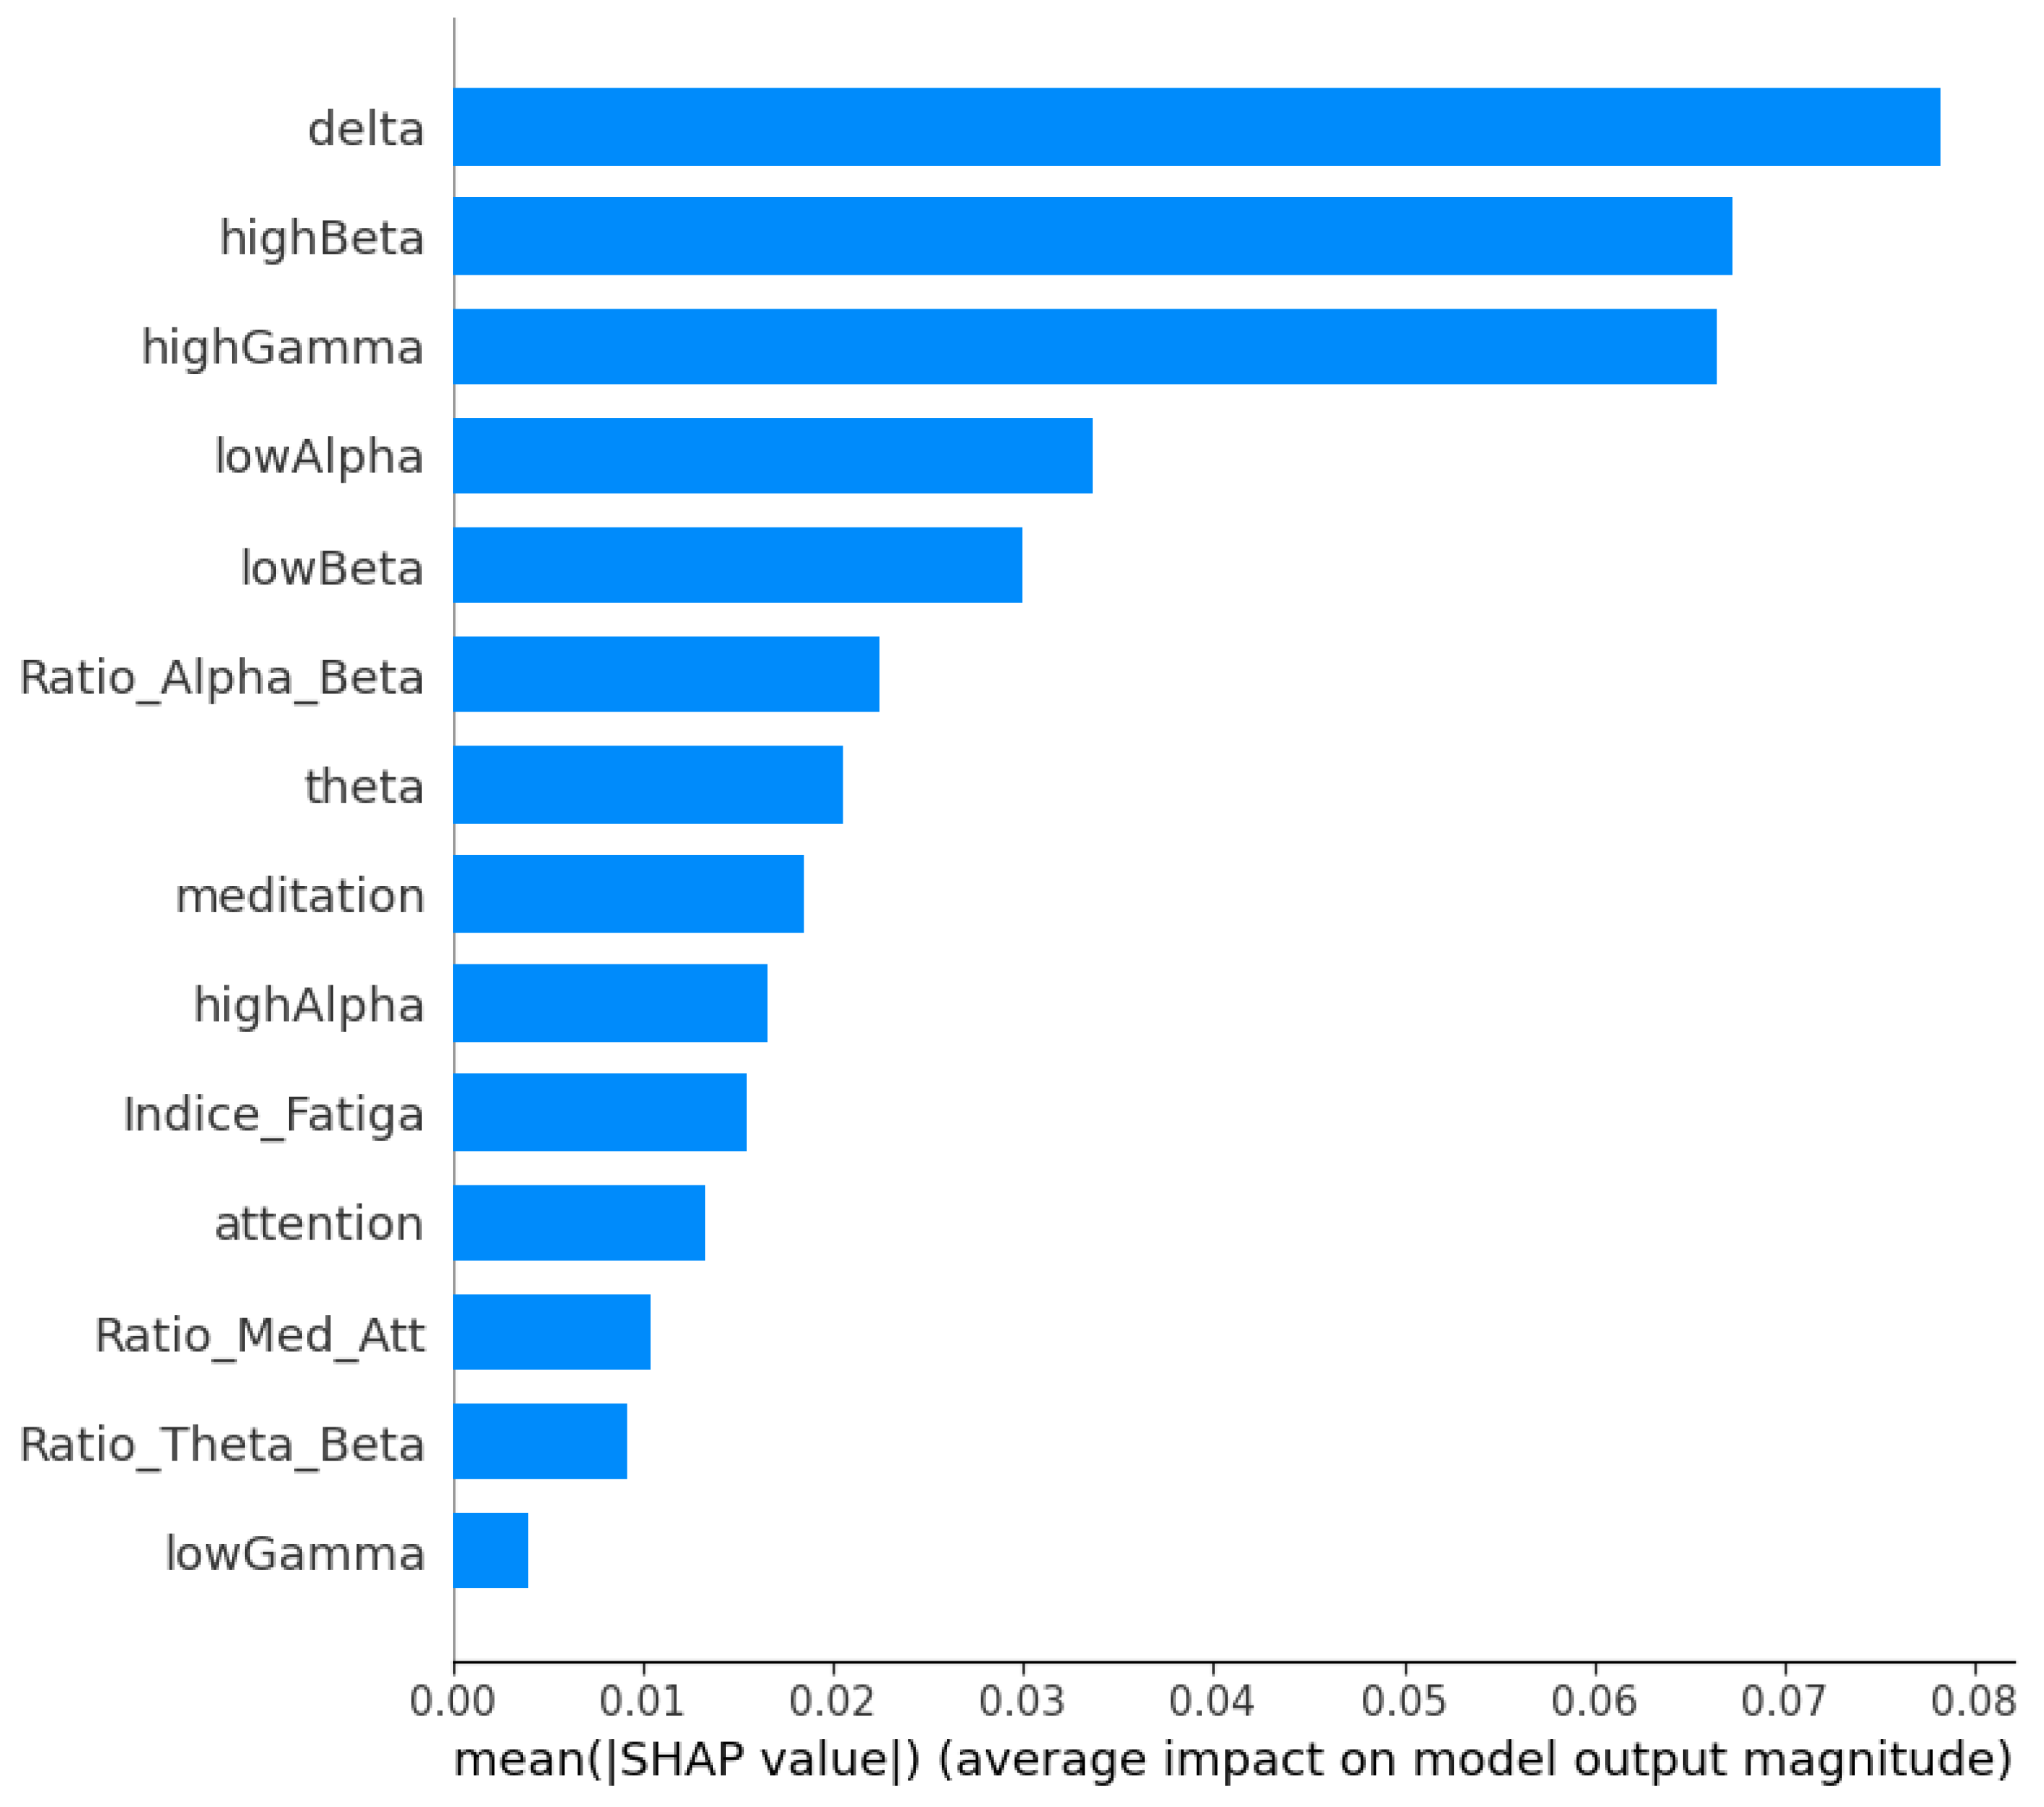
Figure 6.
SHAP beeswarm plot illustrating the detailed impact and directionality of each variable on the ensemble’s drowsiness predictions. Red indicates high feature values; blue indicates low feature values.
Figure 6.
SHAP beeswarm plot illustrating the detailed impact and directionality of each variable on the ensemble’s drowsiness predictions. Red indicates high feature values; blue indicates low feature values.
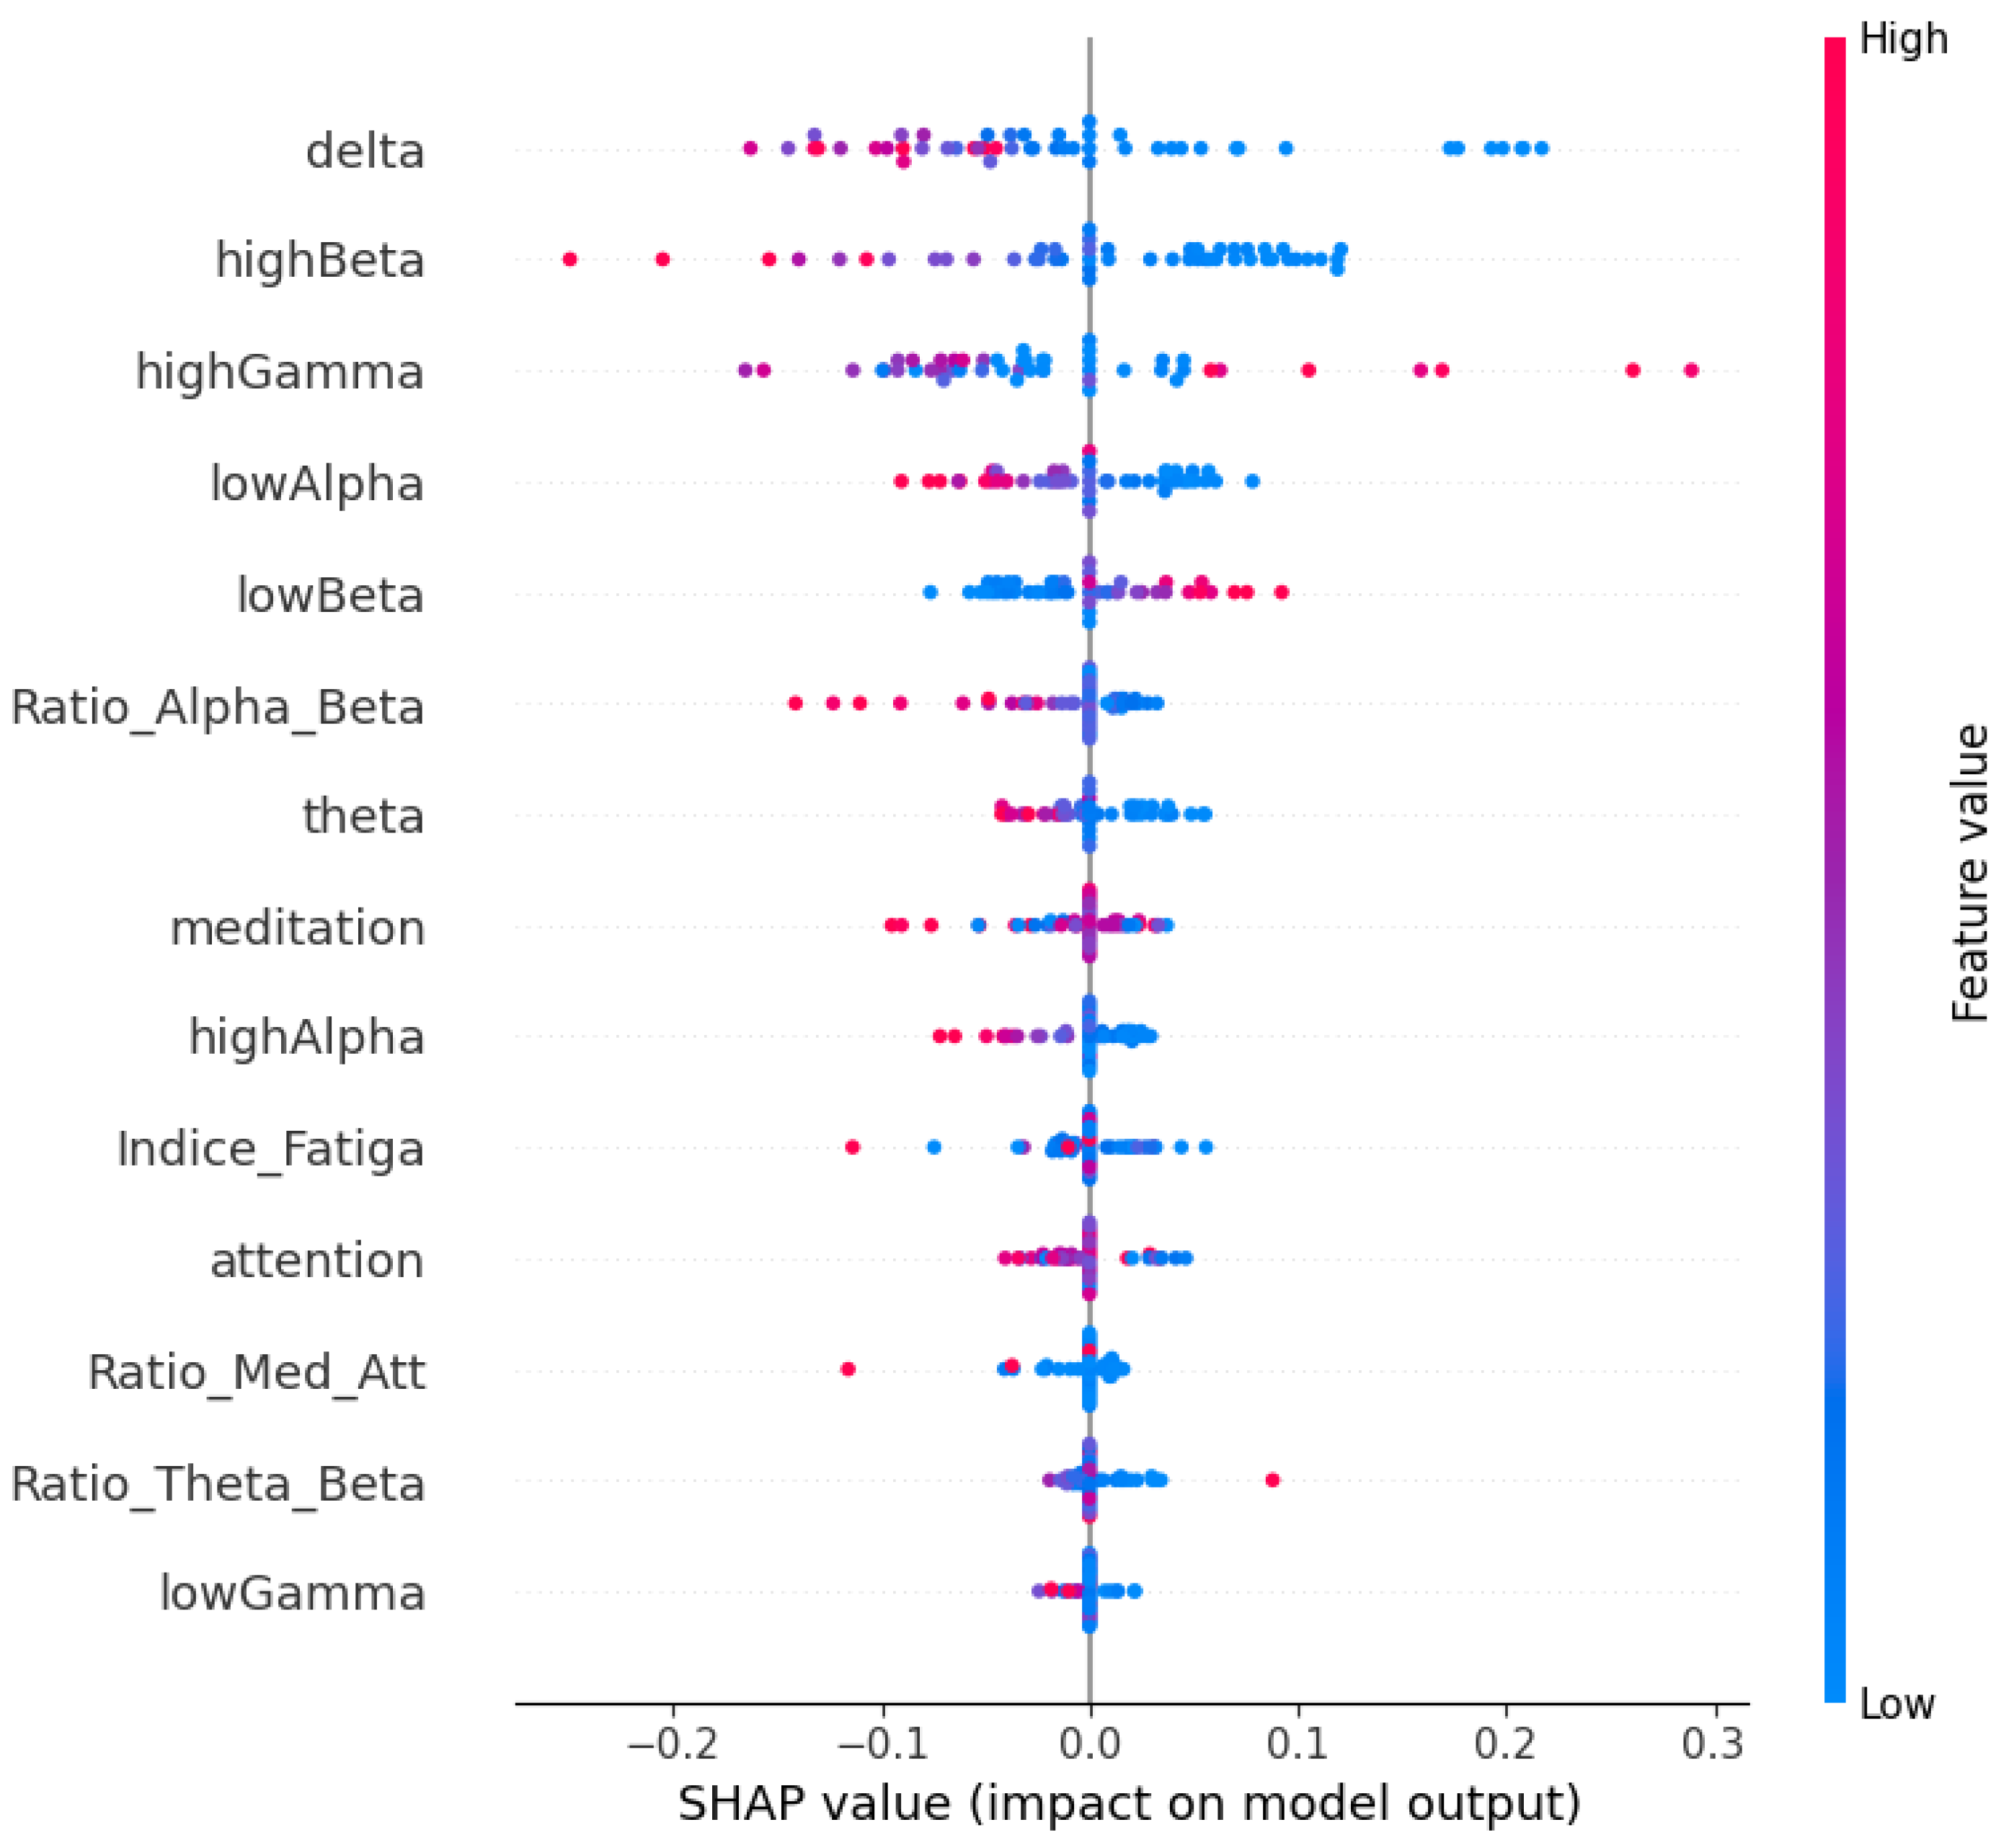
Figure 7.
Performance evaluation of models trained exclusively on the three most dominant features (delta, highBeta, highGamma) across all cross-validation folds. Panel (a) illustrates the combined ROC curves, while panel (b) displays the aggregated classification errors.
Figure 7.
Performance evaluation of models trained exclusively on the three most dominant features (delta, highBeta, highGamma) across all cross-validation folds. Panel (a) illustrates the combined ROC curves, while panel (b) displays the aggregated classification errors.
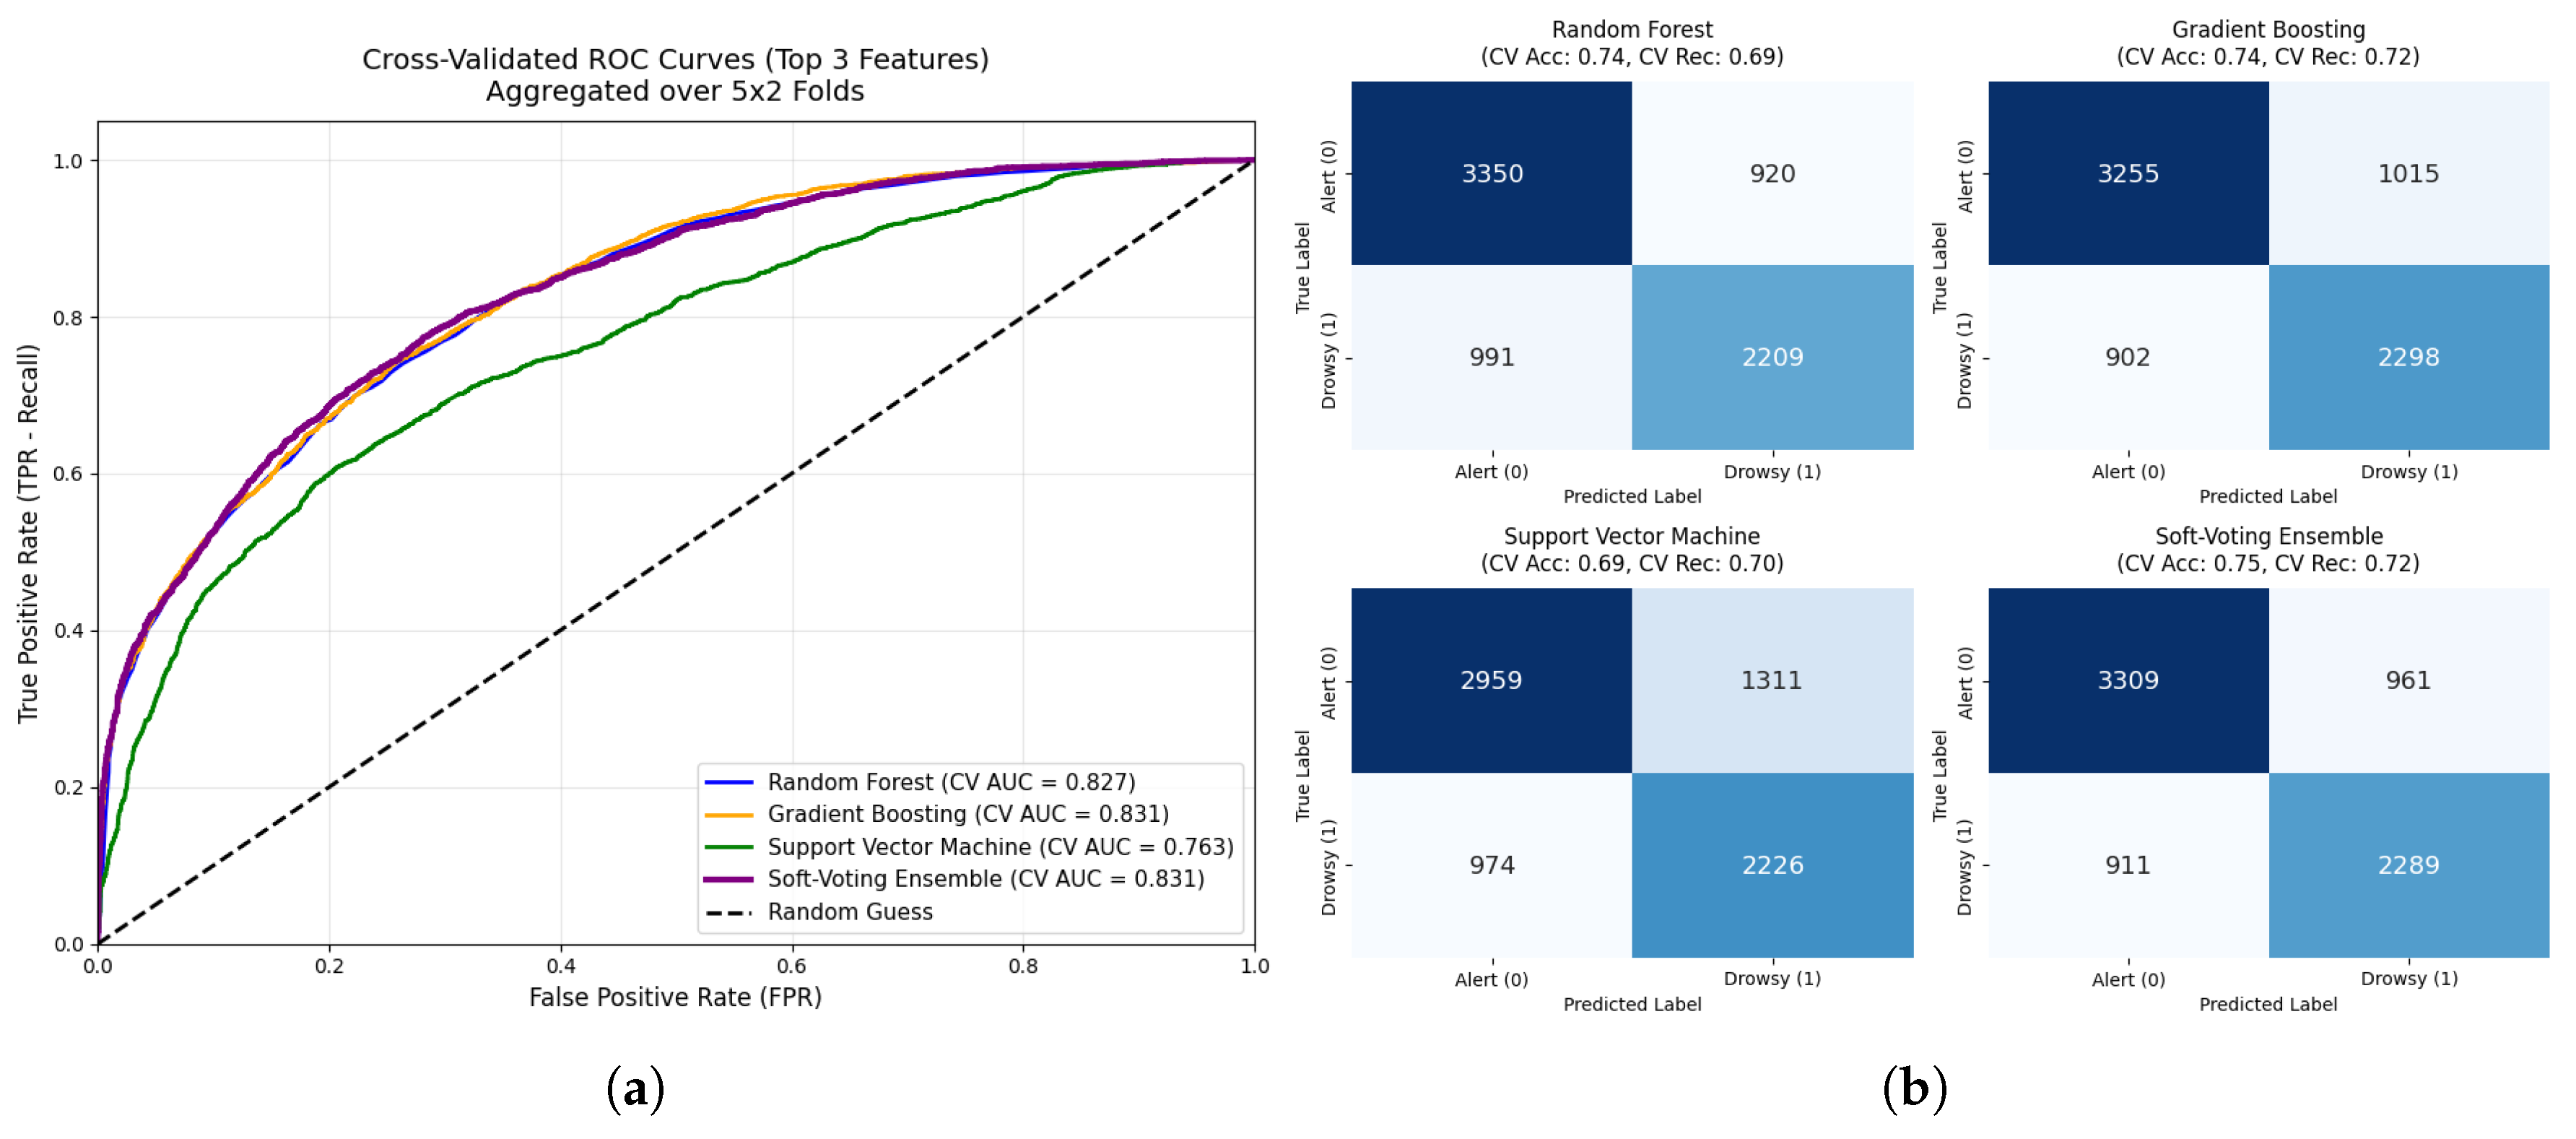

Table 1.
Comparison of recent studies utilizing the “Sleepy Driver EEG” dataset.
| Study | Methodology | Accuracy | Recall (Drowsy) |
|---|---|---|---|
| Trigka et al. (2024) [3] | Bagging Ensemble | 84.9% | 85.0% |
| Naddam (2022) [5] | Baseline | 82.0% | Not reported |
| Proposed Approach | Heterogeneous Soft-Voting | 78.7% | 79.0% |
Table 2.
Cross-validated performance comparison of evaluated advanced classifiers.
| Model | Accuracy | Recall | AUC | Specificity | F1-score |
|---|---|---|---|---|---|
| Support Vector Machine (RBF) | 0.72 | 0.78 | 0.807 | 0.6674 | 0.7022 |
| Random Forest | 0.79 | 0.74 | 0.869 | 0.8384 | 0.7391 |
| Gradient Boosting | 0.78 | 0.76 | 0.864 | 0.7939 | 0.7504 |
| Soft-Voting Ensemble | 0.78 | 0.77 | 0.863 | 0.7986 | 0.7469 |
Disclaimer/Publisher’s Note: The statements, opinions and data contained in all publications are solely those of the individual author(s) and contributor(s) and not of MDPI and/or the editor(s). MDPI and/or the editor(s) disclaim responsibility for any injury to people or property resulting from any ideas, methods, instructions or products referred to in the content. |
© 2026 by the authors. Licensee MDPI, Basel, Switzerland. This article is an open access article distributed under the terms and conditions of the Creative Commons Attribution (CC BY) license.
Copyright: This open access article is published under a Creative Commons CC BY 4.0 license, which permit the free download, distribution, and reuse, provided that the author and preprint are cited in any reuse.