

Submitted:
10 August 2026
Posted:
11 August 2026
You are already at the latest version
Abstract
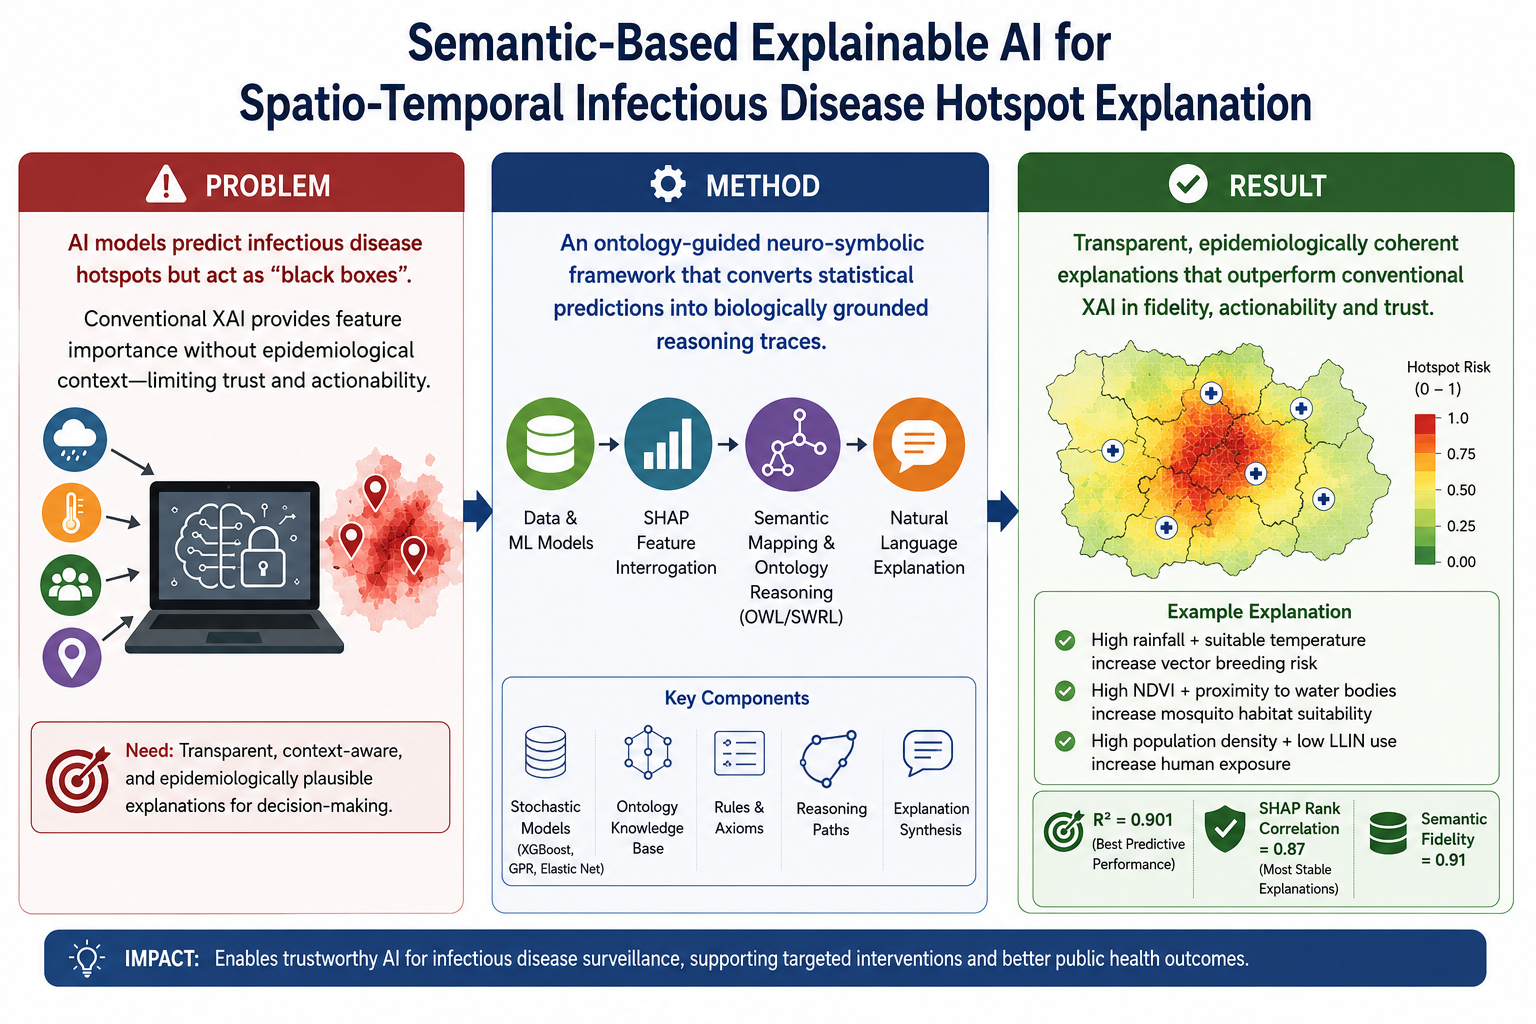
Artificial intelligence has substantially improved infectious disease surveillance, yet most explainable AI (XAI) techniques remain limited to statistical feature attribution, providing little epidemiological context to support public-health decision-making. This study proposes a semantic-based explainable artificial intelligence framework that bridges the semantic gap between machine-learning predictions and biologically grounded interpretation through ontology-guided reasoning. The framework integrates stochastic prediction models (XGBoost, Gaussian Process Regression, and Elastic Net), SHAP-based feature interrogation, semantic concept mapping, OWL/SWRL reasoning, and natural-language explanation synthesis to transform statistical associations into epidemiologically plausible reasoning traces. The framework was evaluated using a longitudinal malaria surveillance dataset comprising 6,300 spatio-temporal observations collected from 30 health centres across six states in North-Eastern Nigeria over seven months. Model performance was assessed using a harmonized chronological holdout and Leave-One-District-Out Spatial Cross-Validation protocol, while semantic validity was evaluated through ontology alignment, expert assessment, and statistical validation. Elastic Net achieved the strongest predictive performance R2=0.901, whereas XGBoost produced the most stable explanations (SHAP rank correlation = 0.87). The semantic layer achieved 92.3% ontology coverage, 94.6% mapping accuracy, and a semantic fidelity score of 0.91. Independent evaluation by seven infectious disease specialists demonstrated significant improvements in semantic causability, clinical actionability, and forensic trust over conventional XAI approaches (Wilcoxon, (p < 0.01); effect size (r = 0.71)). These findings demonstrate that integrating semantic reasoning with machine learning produces transparent, context-aware, and epidemiologically coherent explanations, providing a practical neuro-symbolic framework for trustworthy AI-enabled infectious disease surveillance.
Keywords:
infectious disease surveillance
; ontology-guided reasoning
; neuro-symbolic AI
; epidemiological explainability
; reasoning pathways
1. Introduction
The advancement of artificial intelligence (AI) and machine learning (ML) has significantly impacted decision-making in high-stakes domains such as healthcare and spatio-temporal disease surveillance. However, many state-of-the-art models function as “black boxes,” obscuring the plausibility logic behind their predictions. This lack of transparency is particularly critical in epidemiological settings where trust, accountability, and the ability to validate model outputs against established epidemiological knowledge are vital for adoption (Ribeiro et al., 2016; Samek et al., 2021). While Explainable AI (XAI) methods like SHAP and LIME have emerged to enhance model interpretability, they frequently fall short by providing purely statistical feature attributions. These methods suffer from a pervasive Semantic Gap, where numerical importance scores fail to convey the contextual richness or biological rationale necessary for domain experts to effectively validate epidemiological predictions (Doshi-Velez & Kim, 2017; Guidotti et al., 2019).
This study addresses this gap by proposing an ontology-grounded plausibility explanations Framework for infectious disease hotspot prediction. We formalize the research challenge as a problem of deriving implicit knowledge (), i.e., the plausibility factors of disease outbreaks, from an explicit state axiom () represented within a formal domain ontology .
The primary aim is to develop a neuro-symbolic artifact that bridges the gap between machine learning performance and human-centered clinical reasoning. The specific objectives are: (1) To propose a framework for feature interrogation, and a Semantic Layer for axiomatic grounding. (2) To operationalize a reasoning function that maps influential predictor observations to URI-identified concepts within a Disease Surveillance Ontology while retaining their SHAP attribution scores as complementary evidence of model contribution. (3) To validate the artifact through a rigorous experimental setup in order to measure explanatory fidelity and clinical actionability of the proposed framework.
The significance of this work lies in its contribution to Forensic Interpretability. Unlike traditional post-hoc methods, this framework provides a transparent, logic-based audit trail that satisfies the traceability requirements of emerging AI governance standards, including the NIST AI Risk Management Framework and the EU AI Act. By aligning AI outputs with the “Formalized Domain Knowledge” logic of infectious disease transmission, the study provides a generalizable meta-artifact for responsible AI deployment in global health informatics.
2. Materials and Methods
The proposed framework is a multi-stage pipeline designed to transition disease hotspot prediction from purely statistical correlations to semantically-grounded putative explanations. First, we present the problem formalization then we present the steps involved in the proposed framework pipeline.
2.1. Problem Formalization
As mentioned in the introduction, the fundamental challenge addressed in this study is the Semantic Gap that causes disconnect between the statistical output of an algorithm and the conceptual knowledge required by an epidemiologist. We formalize this as a problem of deriving implicit knowledge () from an explicit state axiom () stored within a domain ontology (), represented in a dataset . Thus, the research problem is to develop a reasoning function such that:
Where the implicit knowledge represents the inferred factors contributing to a specific disease hotspot, is a dataset containing the most statistically important attributes, is a reasoning function is an explicit state axiom. The goal is to demonstrate that by constraining with , the system transitions from providing mere feature importance () to providing a semantically valid explanation () that aligns with the “Expert Knowledge” of the domain (Pearl, 2009). Having formalized the problem, we next describe the phases of the proposed framework.
Definition 1.
Axiomatic Consistency is the fact that the domain ontology
is a complete and “truth-preserving” representation of the physical environment, ensuring that every statistically significant feature has a corresponding logical justification. Given by:
Where is the set of features with high SHAP attribution, is a set of Ontology Concepts, is the Domain Ontology (ies) and is the function mapping numerical values to ontological concepts.
Definition 2.
Semantic Fidelity is the degree to which the machine-learned logic aligns with the symbolic reasoning path, assuming the AI’s “choice” is only valid if it survives an axiomatic audit. Given by:
Where is the model prediction, is explicit state axiom and denotes logical entailment within the ontology.
Assumption 1.
Explicit State Axiom assumes the ontology provides a set of explicit axioms that define known biomedical and environmental relationships describing the epidemiology of the infectious diseases (e.g., ).
Assumption 2.
Temporal Stationarity Lag assumes that the biological delay between an environmental trigger and an epidemiological outcome is approximate biological windows rather than fixed constants (Min, Max), where
is the minimum amount of Temporal Lag and
is Maximum amount of Temporal Lag allowing it to be encoded as a stochastic rule given by:
Where is the hotspot prediction at time is the environmental state at a lagged interval, and is the explicit state axiom, and is a reasoning function.
Assumption 3.
Feature-Concept Semantic Correspondence assumes that statistically important features can be semantically associated with one or more ontology concepts. This is expressed as follows:
Where is a mapping function from feature space to concept(s) in the Ontology .
2.2. Proposed Framework Phases
2.2.1. Phase I: Predictive Modeling (The Stochastic Layer)
The initial phase establishes a robust predictive baseline by treating disease hotspot detection as a supervised learning task where the objective is to map a high-dimensional feature space to an incidence target . While the framework supports various algorithms optimized for data-scarce environments including Bayesian Linear Regression and Gaussian Process Regression (GPR) it primarily utilizes eXtreme Gradient Boosting (XGBoost) to establish the “Maximum Predictive Ceiling”. Mathematically, the model minimizes a regularized objective function :
Where is a differentiable convex loss function measuring the residuals between the prediction and target , and represents the regularization term penalizing model complexity. This phase generates the foundational statistical material, such as leaf weights and gain metrics, required for subsequent interrogation.
2.2.2. Phase II: Feature Interrogation and Selection
Following the establishment of the predictive model in Phase I, the proposed framework proceeds to interrogate the prediction by identifying the predictors that contributed most strongly to the estimated hotspot risk. This phase is concerned with explaining the model’s decision through statistically principled feature attribution. To achieve this, the framework employs SHapley Additive exPlanations (SHAP), which decomposes each prediction into additive contributions, thereby providing information of how individual environmental, epidemiological, and socio-demographic variables influence the predicted hotspot risk. For an individual observation , the prediction generated by the machine-learning model is decomposed as
Where denotes the predicted hotspot risk, represents the expected prediction (baseline value) over the training data, denotes the SHAP contribution associated with predictor, is the total number of predictor variables. Importantly, each SHAP value quantifies how much a predictor influences the prediction relative to the baseline, rather than representing the predictor’s measured value or physical magnitude.
The individual SHAP contribution of each predictor is computed using the Shapley value formulation
Where () represents the contribution or importance score of feature () toward the prediction generated by the machine-learning model. The term () denotes the complete set of input features used in the predictive model, where (p) is the total number of features. (S) represents all possible combinations of features excluding the target feature (), while () denotes the number of elements contained in subset (S). The factorial terms (), (), and () are combinatorial weighting factors derived from Shapley cooperative game theory and are used to ensure fair attribution of feature importance across all possible feature orderings. The function () represents the prediction obtained using only the subset of features (S), whereas () denotes the prediction obtained after adding feature () to the subset. Consequently, the difference () - ) measures the marginal contribution of feature () to the model prediction. To identify the subset of predictors that warrant semantic interpretation, the framework defines an attribution-based feature selection operator
where denotes the selected predictor subset and is an attribution threshold. The threshold may be selected using percentile-based ranking, cumulative contribution, or a fixed attribution cutoff, depending on the desired explanation granularity.
The corresponding original predictor observations, together with their SHAP scores, are subsequently forwarded to the semantic layer. This separation preserves the distinction between predictor values, which describe the observed epidemiological state, and SHAP contributions, which quantify their influence on the prediction. The resulting output of this phase therefore consists of statistically significant predictors and their attribution scores, providing the evidence required for ontology construction and semantic reasoning in the subsequent phase.
To ensure epidemiological plausibility, the framework subsequently validates the selected predictors against the temporal and biological assumptions established during problem formalization. This validation stage verifies that statistically influential predictors are consistent with known disease transmission mechanisms, such as biologically meaningful incubation periods, seasonal transmission dynamics, or environmental persistence windows. Importantly, this validation operates on the original predictor observations and associated metadata, rather than on SHAP values themselves. Consequently, the framework distinguishes between statistical importance, which is quantified by SHAP, and epidemiological validity, which is established through domain knowledge and subsequently formalized within the ontology.
Accordingly, the outcome of this phase is not a semantic explanation but a ranked subset of statistically influential predictors together with their attribution scores. These predictors provide the evidence required for the subsequent knowledge-engineering stage, where the original observations are semantically grounded within the Disease Surveillance Ontology and transformed into formal epidemiological concepts suitable for symbolic reasoning.
2.2.3. Phase III: Ontology Construction (Knowledge Engineering)
To bridge the semantic gap between predictions and knowledge, Phase III formalizes domain-specific epidemiological knowledge into a set of Explicit State Axioms () using the Web Ontology Language (OWL). The proposed framework transforms the original predictor observations associated with the statistically important features into formal semantic representations that can be interpreted by the ontology. This phase further establishes their epidemiological meaning by mapping observed environmental, climatic, demographic, and historical variables to standardized ontology concepts. Consequently, semantic reasoning is performed on measured predictor values, whereas SHAP values are retained solely as explanatory weights associated with those predictors. To map the features, let
denote the original predictor vector, where each predictor represents an observed epidemiological or environmental measurement. The semantic grounding process is defined as
Where denotes the original predictor observation; denotes the corresponding ontology concept; is the semantic mapping function which might use URI or feature nomenclature to establish relations. To ensure that explanations remain both statistically relevant and epidemiologically meaningful, only the predictors identified during Phase II in equation (9) are forwarded for semantic grounding.
The output of this phase is a semantically enriched knowledge graph consisting of ontology concepts linked to their corresponding predictor observations and associated attribution scores. This representation provides the structured knowledge required for ontology-based inference in the subsequent reasoning phase.
2.2.4. Phase IV: Semantic-Causative Discovery and Graph Construction
Next, the proposed framework establishes a semantic association between the statistically influential predictors identified in Phase II and their corresponding ontology concepts. The objective of this phase is not to reinterpret statistical attribution as physical measurement, but to enrich influential predictor observations with structured epidemiological knowledge that supports transparent and biologically meaningful explanation. Consequently, semantic grounding operates exclusively on the original predictor observations, while SHAP values provide complementary information regarding each predictor’s relative contribution to the model prediction. We define
to represent the corresponding SHAP attribution scores obtained from Phase II. The semantic grounding process is defined by
Where denotes the original observation of predictor j; denotes the corresponding ontology concept; is the semantic mapping function. The semantic mapping therefore transforms observed measurements into ontology concepts according to predefined epidemiological criteria. To preserve the statistical evidence generated during feature attribution, each mapped ontology concept is associated with its corresponding SHAP contribution
Where denotes the semantically grounded explanation set; is the ontology concept generated from predictor j; is the SHAP contribution associated with predictor j; denotes the subset of influential predictors selected during Phase II. This representation preserves two complementary forms of evidence simultaneously. The ontology concept provides the epidemiological interpretation of the observation, whereas the SHAP value quantifies its statistical influence on the model prediction. Consequently, the semantic layer integrates domain knowledge with feature attribution without conflating statistical explanations with physical measurements.
The output of this phase is a semantically grounded knowledge representation in which each influential predictor is linked to its ontology concept and corresponding attribution score. This structured representation provides the knowledge base required for ontology-based inference in the subsequent reasoning phase.
2.2.5. Phase V: Semantic Reasoning and Axiomatic Mapping
Following semantic grounding, the proposed framework performs ontology-based reasoning to infer epidemiological relationships among the semantically enriched predictor concepts. This phase derives higher-level knowledge through logical inference. Consequently, the reasoning process operates exclusively on ontology assertions generated from the original predictor observations, while the associated SHAP attribution scores provide explanatory evidence that prioritizes the inferred concepts during explanation generation. So, let
represent the set of ontology concepts obtained after semantic grounding. Ontology reasoning is performed by applying a predefined set of logical rules
where each rule encodes an epidemiological relationship between one or more ontology concepts. The reasoning process is formally represented as
Where denotes the inferred epidemiological knowledge; is the set of semantically grounded ontology concepts; represents the collection of ontology axioms and SWRL inference rules.
To preserve the relationship between statistical attribution and symbolic reasoning, each inferred concept is linked to the SHAP contributions of the predictor observations that triggered its activation. Therefore, let
Where denotes the semantic explanation graph; is an inferred epidemiological concept; represents the set of SHAP attribution scores associated with the predictor observations contributing to inference.
It is noteworthy, the SHAP values are not used as inputs to the ontology reasoner. Instead, they provide quantitative evidence indicating the relative importance of the predictor observations from which the inferred knowledge was derived. This preserves the distinction between statistical explanation and symbolic reasoning while enabling integrated explanations that are both data-driven and epidemiologically meaningful.
The output of this phase is a structured knowledge graph consisting of inferred epidemiological concepts together with their associated attribution evidence. This representation forms the semantic foundation for the explanation synthesis process described in the subsequent phase.
2.2.6. Derivation and Validation of Implicit Knowledge ()
Following ontology-based reasoning, the inferred epidemiological knowledge is subjected to semantic validation to ensure that the generated explanations are logically consistent, biologically plausible, and compatible with the knowledge encoded within the Disease Surveillance Ontology. This verification stage therefore provides an additional layer of quality assurance by confirming that the inferred explanations satisfy established epidemiological knowledge before they are presented to end users. Let
denote the set of inferred epidemiological concepts (graph nodes) generated during the reasoning phase. Semantic validation is defined as
Where denotes the inferred epidemiological knowledge; is the semantic validation operator; represents the validated knowledge graph containing only logically consistent inferences. The validation process consists of four complementary verification procedures.
First, ontology consistency checking ensures that the inferred concepts do not introduce contradictory class memberships or violate ontology axioms. Description Logic reasoning is used to verify that the ontology remains logically satisfiable after new assertions have been introduced.
Second, rule verification evaluates whether every inferred epidemiological concept can be traced to one or more satisfied SWRL rules. This provides complete reasoning provenance by establishing an explicit relationship between the observed predictor values, the activated ontology concepts, and the corresponding inference rules.
Third, concept coverage analysis determines whether the influential predictors identified during Phase II have been successfully represented within the ontology. This verification ensures that statistically important predictors are not omitted during semantic reasoning and that every relevant environmental, climatic or epidemiological observation contributes to the final explanation.
Finally, knowledge plausibility assessment confirms that the inferred epidemiological relationships remain consistent with established disease transmission mechanisms. Formally, the semantic validation outcome may be expressed as
Where denotes the validated semantic knowledge; is the inferred epidemiological knowledge; denotes the ontology rule base; denotes the Disease Surveillance Ontology.
Only validated knowledge is forwarded to the explanation synthesis stage. Consequently, semantic validation functions as a post-reasoning verification mechanism that improves the reliability, transparency and biological credibility of the generated explanations while preserving the distinction between statistical attribution and symbolic inference.
The output of this phase is a logically consistent and biologically interpretable semantic knowledge graph that forms the basis for generating the final natural-language explanations.
2.2.7. Explainability Synthesis and Narrative Generation
Following semantic validation, the framework synthesizes statistical attribution and validated epidemiological knowledge into a unified explanation that is both quantitatively supported and semantically interpretable. The objective of this phase is to translate the prediction process into a transparent reasoning pathway by integrating three complementary sources of evidence: the predicted hotspot risk, the SHAP feature attributions, and the validated ontology-derived knowledge. Consequently, the generated explanation reflects not only which predictors influenced the prediction but also why these predictors are epidemiologically significant. Thus, to generate the explanation , let
Where denotes the final explanation; is the predicted hotspot risk; is the vector of SHAP attribution scores; is the validated semantic knowledge obtained after ontology verification; is the explanation synthesis function.
The explanation synthesis function integrates these complementary information sources into a coherent narrative. This layered interpretation enables the framework to move beyond statistical explanation by incorporating explicit domain knowledge and causal relationships encoded within the ontology.
To preserve transparency, each explanation is generated together with its supporting evidence, including the influential predictor observations, their SHAP attribution scores, the ontology concepts activated during semantic grounding, the inference rules satisfied during ontology reasoning, and the resulting epidemiological conclusions. This complete reasoning pathway provides traceability from the original observations to the final explanation and enables domain experts to verify the biological plausibility of the generated interpretations.
Formally, the explanation generated for an individual prediction may be represented as
Where denotes the explanation associated with prediction i; represents the influential predictor observations; denotes their corresponding SHAP contributions; denotes the ontology concepts generated from the observations; represents the inferred epidemiological knowledge; denotes the validated semantic knowledge.
The proposed framework generates explanations that combine quantitative evidence with formal epidemiological reasoning. Consequently, each explanation is traceable, biologically interpretable and supported by both statistical attribution and symbolic knowledge, thereby enhancing transparency, expert confidence and decision support.
The output of this phase is a validated semantic explanation accompanying every hotspot prediction, providing an interpretable rationale suitable for public health practitioners and decision-makers.
Figure 1 above presents an ontology-grounded plausibility explanations pipeline for infectious disease-risk prediction and interpretation. The process begins with multi-source epidemiological, environmental, and healthcare datasets, which undergo preprocessing and data-engineering operations such as scaling and normalization to produce a clean feature matrix. A regression model is then trained to predict disease risk, after which SHAP-based feature interrogation identifies the most influential variables contributing to the prediction. The corresponding original observations for these influential predictors are subsequently mapped to ontology concepts through semantic grounding, while their SHAP scores are retained separately as attribution evidence.
2.2.8. Phase VI: Explanatory Fidelity and Clinical Validation
The final phase of the proposed framework involves the empirical evaluation of the generated semantic-plausibility narratives against the predictive outputs of the stochastic layer. This phase is designed to quantify the “truthfulness” of the explanation relative to both the machine learning model and the expert knowledge. Validation is operationalized through a dual-metric approach as follows:
- Semantic Fidelity (): This metric measures the degree of alignment between the statistical feature importance () and the symbolically inferred knowledge (). It ensures that the reasoning engine is not hallucinating semantic- plausibility paths, but is accurately reflecting the data-driven drivers. Mathematically, it is expressed as the intersection of validated features and axiomatic justifications:Where (SF) represents the semantic fidelity score, () denotes the set of semantically validated features, () represents the inferred semantic knowledge graph, (()) denotes the set of semantic nodes contained in the inferred graph, and () measures the number of validated features that appear within the inferred semantic graph structure.
- Clinical Actionability Audit: Beyond mathematical fidelity, the framework undergoes a qualitative validation where the derived implicit knowledge is evaluated by epidemiological experts. This step verifies the “Actionability” of the plausibility narrative assessing whether the explanation provides sufficient interpretable rationale for specific public health interventions, such as the deployment of Long-Lasting Insecticidal Nets (LLINs) or Indoor Residual Spraying (IRS). This structured evaluation ensures that the artifact remains grounded in epidemiological plausibility while fulfilling the transparency requirements mandated by emerging AI governance frameworks.
2.2.9. Explanation Rendering
Following the semantic reasoning process, the framework operationalizes the final transition from internal logical inference to human-intelligible discourse. This phase ensures that the derived implicit knowledge () is not only mathematically valid but also meets the criteria for Interpretability, a requirement for high-stakes epidemiological surveillance.
To render these complex logical traces into a format accessible to public health stakeholders, the framework employs a semantically-aware NLP process. This involves mapping the active nodes of the Knowledge Graph to natural language templates. Instead of a reductive statistical output, the system synthesizes a coherent narrative. For instance, the rendering engine transforms the symbolic logic associated with a node with {“Coordinate: {0.93785,0.83943}; Rainfall: 0.85; Precipitation: 0.30; Day:02082026; Incubation:14; specie: Anopheles”}, into a structured explanation:
“The hotspot prediction at [Coordinate X] is driven by a Climatic_Anomaly where sustained High_Precipitation has exceeded the X-day Vector_Incubation_Threshold, logically facilitating Anopheles_Proliferation as per Axiom 4.2.”
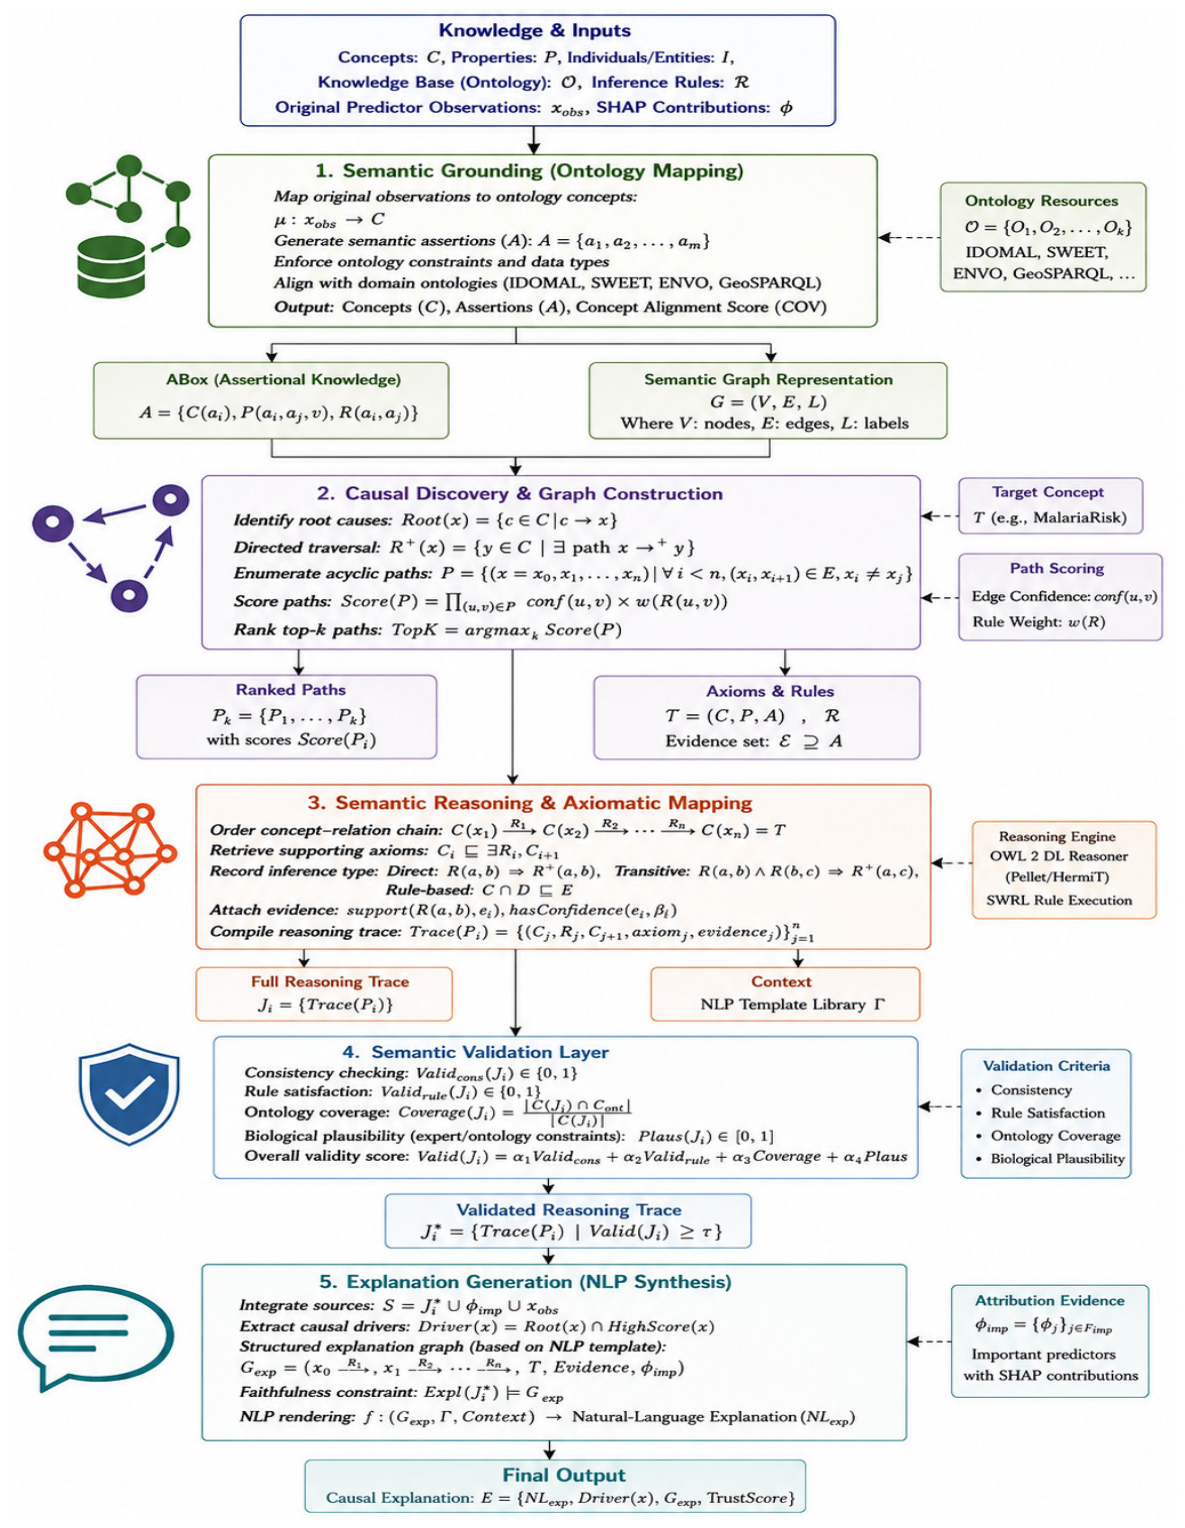
Figure 2.
Semantic Reasoning Process Workflow.
3. Case Study
3.1. Research Design
To rigorously evaluate the proposed method, we examine the dynamics of malaria epidemiology in North-Eastern Nigeria. This region presents a unique epidemiological challenge due to climate-change confounded by weak health systems and conflict-induced population displacement (Abledu & Mike, 2024; Aborode et al., 2025; Abubakar et al., 2023). In other to achieve this, the study employs an Experimental Research Design. The selection of this design is justified by the study’s primary objective: the creation and empirical validation of an Explainable AI (XAI) framework designed to solve the “black-box” problem in disease surveillance (Oh et al., 2024). To ensure academic rigor, the research design utilizes an Ablation Study and a Baseline Comparison, measuring how different configurations influence the downstream “Semantic Layer” and the resulting quality of the derived implicit knowledge.
3.2. Comparative Baseline
To establish a real-world benchmark, the proposed framework was compared with the approach of (Okundalaye et al., 2025), which used malaria surveillance data from 2018–2023 together with climatic variables, including temperature, precipitation, humidity, and wind speed, to evaluate statistical and machine-learning methods for malaria incidence forecasting. This comparison provides a relevant predictive baseline against which the additional interpretability introduced by the proposed semantic framework can be assessed.
3.3. Ablation Study Design
The core of the experiment involves testing the framework’s performance using three distinct regression algorithms in the “Stochastic Layer.” This ablation helps determine which mathematical architecture provides the most stable “Candidate Facts” for the Semantic Layer to process. The ablation design tests the hypothesis that while XGBoost may provide higher accuracy, the GPR configuration will yield higher Semantic Fidelity (), while the Elastic Net Regression will function better in data scarce environments, thus its uncertainty bounds act as a natural filter for “Semantic Noise.”. All ablation experiments were evaluated under the same spatio-temporal validation protocol to ensure fair comparison between stochastic architectures and their downstream semantic reasoning performance.
3.4. Data Acquisition and Spatio-Temporal Stratification
3.4.1. Data Acquisition and Multi-Source Integration
In alignment with the experimental design, epidemiological data, comprising geo-referenced malaria incidence rates, were sourced from 5 health centers from each of the six states in North-Eastern Nigeria i.e., Adamawa, Bauchi, Borno, Gombe, Taraba and Yobe states, stratified by health-center-level granularity across the study regions. To facilitate the derivation of implicit causative factors, primary data were augmented with high-resolution environmental covariates. Remote sensing data were retrieved via the Google Earth Engine and specialized APIs, including: (1) Climatological Data which is a monthly precipitation data (from CHIRPS) and Land Surface Temperature (LST) data from MODIS, utilized to represent the explicit state axioms regarding vector breeding conditions. (2) Geospatial Indices which is Normalized Difference Vegetation Index (NDVI) and Topographic Wetness Index (TWI) data from MODIS and LST to characterize the environmental suitability for Anopheles proliferation. (3) Socio-Demographic Indicators including Population density, average housing, healthcare index and proximity to healthcare facilities from CHIRPS, MODIS and NASA, which serve as foundational nodes within the study’s domain ontology ().
3.4.2. Spatio-Temporal Stratification and Feature Engineering
The stratification process was engineered to transform raw observational data into a structured format suitable for both gradient-boosted prediction and semantic reasoning. The data was stratified into monthly temporal bins across a seven-month (June-December, 2025) horizon, allowing the framework to capture the lag-effects of climatological variables on malaria transmission cycles.
For the Ablation Study comparison, the stratification followed a rigorous pipeline as follows: (1) Vectorization: Raw features were normalized and encoded into high-dimensional tensors for the XGBoost baseline and subsequent SHAP attribution. (2) Semantic Mapping: Beyond numerical vectorization, variables were mapped to URI-identified concepts within the IDOMAL ontology. For instance, a numerical rainfall value exceeding a predefined threshold was not merely treated as a float but was reified as an instance of the class High_Rainfall_Event in the IDOMAL ontology (Noy & McGuinness, 2001). (3) Spatial Buffering: To account for the spatio-temporal nature of hotspots, spatial autocorrelation was addressed using a distance-weighting matrix. This ensured that the “implicit knowledge” derived by the framework accounts for neighboring district influences, reflecting the causative logic described by (Pearl, 2009).
The experimental dataset comprised 6,300 spatio-temporal records collected from 30 health centers, with five health centers selected from each of the six states in North-Eastern Nigeria. Each health center was located within a different district to improve spatial representation and contributed daily observations for 30 days in each month over a seven-month longitudinal period spanning June to December 2025 (30 health centers × 30 daily observations × 7 months = 6,300 records). Each record therefore represents a health-center–day observation associated with its corresponding district and month, enabling the framework to capture both spatial heterogeneity and temporal dynamics in malaria transmission. The feature space comprised twenty (20) predictor variables and a continuous target variable representing the malaria hotspot risk score, indicating the degree to which a location was classified as a transmission hotspot. The predictors were grouped into four categories: environmental and climatic variables consisting of (1) precipitation, (2) Normalized Difference Vegetation Index (NDVI), (3) Land Surface Temperature (LST), (4) relative humidity, and (5) elevation, together with their corresponding temporal lag variables to capture biologically meaningful incubation effects; socio-economic variables comprising (1) population density, (2) average educational level, (3) average household income, and (4) average housing index; and health-system indicators including (1) proximity to the nearest health center, (2) sanitation index, (3) drainage availability, (4) average life expectancy, (5) availability of public-health interventions, and (6) malaria prevention measures, including the use of long-lasting insecticidal nets and indoor residual spraying. The resulting longitudinal dataset captures seasonal variability while preserving the spatial granularity required to model the non-linear interactions between environmental conditions, socio-economic determinants, healthcare accessibility, and malaria hotspot emergence within the North-Eastern Nigerian context.
The predictive model was developed using multimodal spatio-temporal surveillance data comprising environmental, climatic, epidemiological and socio-demographic predictors obtained from established public health and Earth observation repositories. Environmental variables included precipitation, land surface temperature, normalized difference vegetation index (NDVI), elevation, land cover and proximity to water bodies, while epidemiological and socio-demographic variables included historical malaria incidence, parasite prevalence (PfPR), population density, healthcare accessibility and intervention coverage. The response variable was the Disease Hotspot Risk Score, represented as a continuous measure of transmission intensity derived from georeferenced malaria surveillance records after spatial and temporal harmonization. Appendix A summarizes the predictors, measurement units, data sources and their respective roles in the predictive framework.
3.4.3. Predictive Modeling and Hyper-Parameter Optimization
The predictive modeling phase establishes the stochastic foundation of the framework. To evaluate algorithmic resilience, we implement an ablation study utilizing three distinct regression architectures. Each model is subjected to specific hyper-parameter tuning to mitigate overfitting a critical requirement in data-scarce epidemiological modeling.
- 1.
- eXtreme Gradient Boosting (XGBoost) Tuning
XGBoost was selected for its computational efficiency and ability to model nonlinear environmental relationships. Hyperparameters were optimized using grid search to reduce overfitting and improve generalizability. The learning rate was constrained to a low range to promote incremental learning, while maximum tree depth was restricted to limit high-variance decision boundaries. Regularization penalties were applied to control model complexity, and subsampling was used to introduce stochasticity and improve out-of-sample performance.
- 2.
- Gaussian Process Regression (GPR) Tuning
Selected specifically for its performance in data-scarce environments, it provides a full probability distribution, allowing the Logic Layer to quantify uncertainty before passing signals to the Semantic Layer. Its performance is highly sensitive to the choice of Kernel Function. We utilize a composite kernel (Radial Basis Function (RBF)) combined with a White Kernel to account for inherent noise in remote-sensing data. We tuned Length Scale to govern the smoothness of the spatial correlation. Finally, Alpha () was set to a high level to reflect the uncertainty in data-scarce environments, ensuring that the Logic Layer receives a “Confidence Score” alongside the prediction.
- 3.
- Elastic Net Regression Tuning
Elastic Net Regression was included as a regularized linear benchmark to evaluate the framework under a simpler, higher-bias predictive structure. The regularization parameter α controlled the overall penalty strength, while the L1-ratio was tuned to balance Lasso and Ridge regularization. This configuration enabled sparse predictor selection while maintaining stability among highly correlated climatic variables.
3.4.4. Data Preprocessing and Validation
To ensure high-quality model inputs, missing values arising primarily from cloud contamination in satellite-derived observations were imputed using K-Nearest Neighbors (KNN) imputation (), thereby preserving local spatio-temporal relationships more effectively than global mean imputation. Predictor variables were subsequently normalized using Min-Max scaling to the interval, eliminating differences in measurement scales (e.g., rainfall in millimeters and temperature in degrees Celsius) and ensuring balanced feature representation during model training.
To ensure rigorous and leakage-free evaluation, the dataset was first partitioned chronologically, with observations from June–October 2025 used for model development and November–December 2025 reserved as an independent temporal test set. All preprocessing operations, including missing-value imputation, feature normalization, feature engineering and hyperparameter optimisation, were performed exclusively on the training data, after which the learned transformation parameters were applied unchanged to the validation and test sets. Within the training period, Leave-One-District-Out Cross-Validation (LODOCV) was employed for model selection by iteratively withholding one district for validation while training on the remaining districts, and the reported performance metrics were averaged across all spatial folds. SHAP explanations were generated only for the final trained model using validation and independent test observations, ensuring that both predictive performance and feature attributions were evaluated under genuine out-of-sample conditions. The combination of chronological hold-out and LODOCV is particularly appropriate for spatio-temporal disease surveillance because it simultaneously evaluates temporal forecasting performance and spatial generalization while preventing both temporal and spatial information leakage, thereby providing a realistic assessment of operational deployment across heterogeneous epidemiological settings.
3.4.5. Base Ontology and Knowledge Base Construction
The semantic layer was implemented as a modular OWL 2 knowledge base integrating IDO, IDOMAL, ENVO, SWEET, and GeoSPARQL to represent biomedical, environmental, and geospatial knowledge relevant to malaria transmission. Predictive variables were semantically mapped to URI-identified ontology concepts, enabling environmental observations, epidemiological entities, and spatial features to be linked through biologically meaningful object properties. Ontology reasoning was performed using OWL 2 DL, SWRL, and SPARQL, with a Pellet-compatible reasoner executing rule-based inference, consistency checking, and semantic explanation.
Ontology quality was assessed through concept validation and inter-ontology alignment. The final knowledge base represented 20 predictor variables using 26 ontology concepts, of which 24 (92.3%) were directly aligned with existing ontology classes, while two domain-specific concepts were implemented as extension classes linked through rdfs:subClassOf relationships. Independent expert evaluation achieved a mapping accuracy of 94.6% with substantial inter-rater agreement (Fleiss’ κ = 0.84), demonstrating that the semantic layer provides an interoperable, epidemiologically coherent, and ontology-grounded foundation for explanation generation.
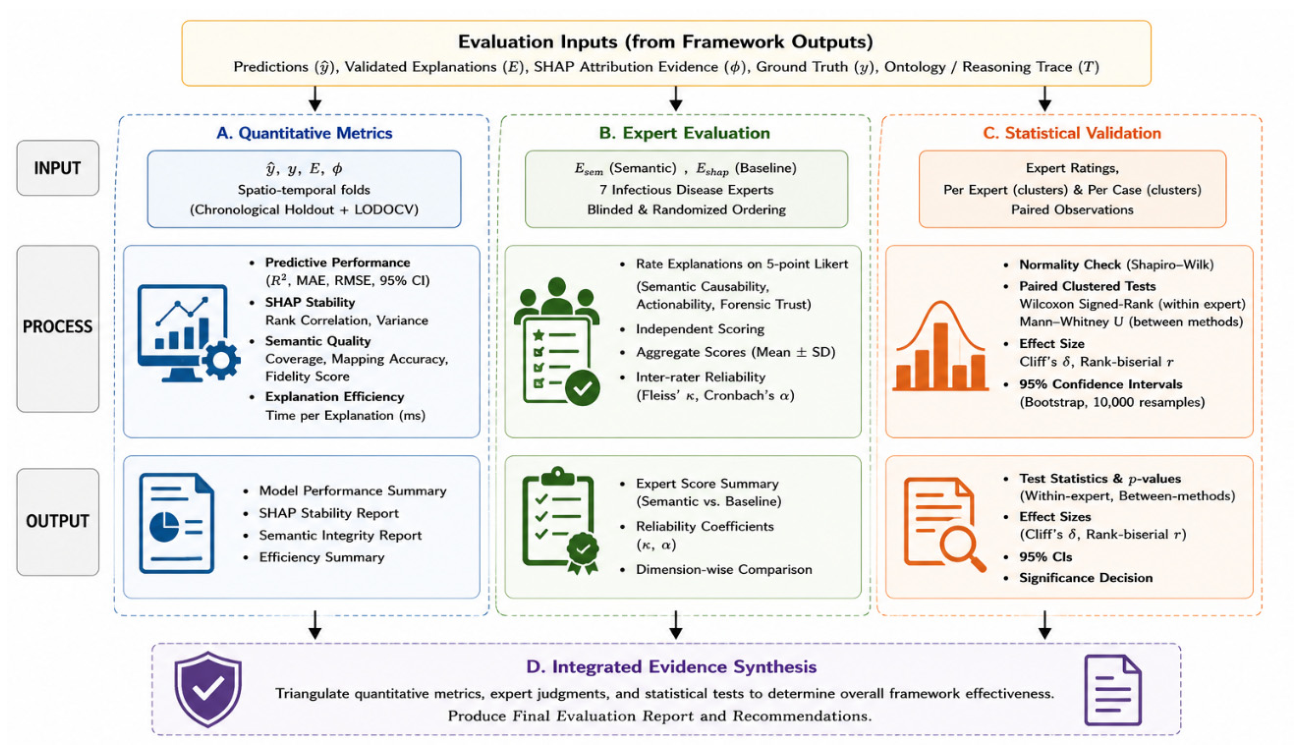
Figure 3.
Evaluation and validation pipeline of the proposed framework.
3.4.6. Validation of Mappings and Inter-Ontology Alignment Procedures
To assess mapping reliability, all feature-to-concept mappings underwent independent validation by three domain experts with expertise in infectious disease epidemiology, biomedical informatics, and semantic technologies. Each mapping was evaluated for semantic correctness, epidemiological relevance, and ontological consistency using a three-level agreement protocol (correct, partially correct, or incorrect). Inter-expert agreement demonstrated substantial consistency (Fleiss’ κ = 0.84), while the overall mapping accuracy reached 94.6% following consensus revision of disputed concepts. Inter-ontology alignment was implemented using URI-based semantic equivalence and hierarchical object-property mappings rather than ontology merging, thereby preserving the conceptual independence of the individual ontologies while enabling interoperable reasoning across biomedical, environmental, and geospatial domains. This modular alignment strategy improved semantic interoperability, reduced ontology redundancy, and ensured that the reasoning engine could seamlessly traverse epidemiological, environmental, and spatial concepts during semantic inference and explanation generation.
3.5. Evaluation Strategy
The evaluation of the proposed Explainable AI Framework is structured through a multi-dimensional assessment protocol designed to validate both the predictive accuracy of the stochastic engine and the forensic reliability of the semantic reasoning layer. To ensure high academic rigor and address the inherent “Semantic Gap” in epidemiological modeling, the strategy employs a triangulation of statistical metrics, axiomatic verification, and expert-led qualitative evaluations.
3.5.1. Predictive Performance and Generalization
The initial phase of evaluation focuses on the Stochastic Layer’s ability to capture non-linear spatio-temporal dependencies across the study area. To ensure methodological rigor and minimize spatial and temporal leakage, the framework employs a unified spatio-temporal validation protocol consisting of chronological holdout testing and Leave-One-District-Out Spatial Cross-Validation (LODOCV). Temporal holdout validation evaluates the model’s ability to generalize to unseen future observations, while LODOCV assesses robustness across geographically distinct ecological zones. Predictive performance was quantified using Root Mean Square Error (RMSE), Mean Absolute Error (MAE), and the Coefficient of Determination .
3.5.2. Semantic Fidelity and Epidemiological Plausibility
To evaluate the Semantic Reasoning Layer, we introduce a metric termed Semantic Fidelity (). This quantitative measure assesses the degree to which the generated explanation narratives align with the formal domain axioms () defined in the IDOMAL ontology. The evaluation assesses whether predictors identified as statistically influential by SHAP are supported by ontology-grounded epidemiological relationships evaluated using their corresponding original observations and relevant biological thresholds (e.g., minimum humidity conditions associated with mosquito survival).
3.5.3. Explanation Narrative Quality and Forensic Trust
The interpretability of the framework was evaluated through a structured human-in-the-loop expert audit. Seven domain experts independently assessed explanation narratives using a five-point Likert scale across three dimensions: (1) Semantic Causability, measuring the epidemiological coherence and biological plausibility of the reasoning pathway; (2) Clinical Actionability, measuring the extent to which the explanation provides interpretable rationale capable of supporting public-health intervention decisions; and (3) Forensic Trust, measuring the transparency, traceability, and perceived reliability of the explanation and its supporting reasoning pathway.
3.5.4. Comparative Baseline Analysis
To demonstrate the superiority of the neuro-symbolic approach, the framework is benchmarked against state-of-the-art XAI baselines, including LIME, KernelSHAP, and Integrated Gradients. The comparison specifically targets the “Semantic Gap,” measuring the delta between purely statistical attributions and the framework’s semantically-grounded explanations. Additionally, the generative quality of DiFACE2 is compared against traditional counterfactual methods like DiCE, evaluating for proximity, sparsity, and most critically semantic feasibility. This comparative analysis highlights the framework’s ability to maintain high predictive accuracy while providing the contextually rich, biologically plausible logic required for high-stakes healthcare governance.
4. Results
The primary objective of the stochastic layer is to establish a high-accuracy predictive ceiling for malaria hotspots within a data-scarce environment. Table 1 provides a comparative analysis of the three regression architectures evaluated in the ablation study.
Table 1 reports mean performance across the unified spatio-temporal validation protocol, where chronological holdout was followed by Leave-One-District-Out Spatial Cross-Validation (LODOCV) on the training partition and metrics were averaged across folds. Elastic Net achieved the strongest predictive performance, with the lowest RMSE and MAE and the highest , supported by 95% confidence intervals of 0.177–0.191 for RMSE, 0.133–0.143 for MAE, and 0.890–0.912 for . Low fold-wise variability (RMSE SD = 0.007; MAE SD = 0.005; () SD = 0.011) indicated stable generalization under temporal and spatial distribution shifts.
Model selection, however, also considered explanation robustness and uncertainty estimation. XGBoost produced the most stable SHAP rankings across folds, with higher Spearman rank correlation ((); 95% CI: 0.82–0.91) and lower attribution variance, making it more suitable for downstream semantic interpretation. Gaussian Process Regression provided calibrated predictive uncertainty, supporting risk-sensitive public-health decision-making. Residual diagnostics showed no systematic bias or heteroscedasticity, while calibration analysis indicated close agreement between predicted and observed hotspot scores (slope = 0.97; intercept = 0.02). Thus, Elastic Net provided the strongest predictive baseline, XGBoost the most stable explanation structure, and GPR the strongest uncertainty-aware support for malaria surveillance.
4.1. SHAP Attribution Stability Analysis
To evaluate the consistency of feature attributions across geographically distinct regions, SHAP attribution stability was assessed using the Leave-One-District-Out Spatial Cross-Validation (LODOCV) procedure. The validation generated thirty spatial folds, corresponding to the thirty districts included in the study. For each fold, features were ranked according to their mean absolute SHAP values, and the top ten most influential features were retained for comparison.
Attribution stability was quantified using Spearman’s rank correlation coefficient, computed across fold-specific SHAP rankings and averaged for each model. To assess robustness, bootstrap resampling (1,000 iterations) was performed to estimate 95% confidence intervals for the dominant predictors. The results showed that XGBoost achieved the highest attribution stability (mean Spearman correlation = 0.87), compared with Elastic Net (0.73) and Gaussian Process Regression (0.69). Although Elastic Net exhibited marginally superior predictive accuracy, XGBoost produced more consistent and geographically stable feature-attribution patterns, making it better suited for downstream semantic grounding and narrative generation. This is summarized in Table 2 below
4.2. Feature Interrogation and Physical Grounding
To bridge the semantic gap, SHAP-based feature interrogation was used to identify the predictors contributing most strongly to individual hotspot-risk predictions. Importantly, SHAP attribution values were retained exclusively as measures of predictor contribution and were not transformed or interpreted as physical measurements. For semantic grounding, the framework retrieved the corresponding original predictor observations in their native environmental or epidemiological units and mapped these observations to ontology concepts and threshold conditions. Thus, physical grounding was performed directly from observed predictor values, while SHAP scores provided complementary evidence of their relative influence on the prediction.
Table 3 illustrates how predictors identified as influential through SHAP are linked to their corresponding original observations and ontology concepts. The candidate facts supplied to the reasoning engine are therefore derived from observed physical or epidemiological measurements rather than reconstructed attribution values.
4.3. Synthesis of Plausibility Narratives (
)
The synthesis phase realized the core significance of this study: the generation of a Reasoning Trace that justifies predictions through formal logic rather than weight distributions.
Figure 4 above shows Axiomatic Logic Chain for: [Precipitation_Anomaly] → (is_a) → [] → (facilitates) → [Stagnant_Water] → (enables) → [Anopheles_Larvae_Growth]. With a corresponding Narrative: “The predicted hotspot is attributed to a sustained precipitation anomaly exceeding the hydrological threshold for vector incubation, logically entailing an increase in breeding site density as per IDOMAL Axiom 4.2.”. This derivation confirms the research hypothesis: by utilizing transitive inference across the Knowledge Graph, the framework identifies implicit risk factors (e.g., incubation lags) that are statistically latent but biologically plausible.
4.4. Expert Review of Causability, Actionability, and Trust
To evaluate the clinical interpretability and operational plausibility of the proposed framework, a structured expert evaluation was conducted involving seven independent domain experts in infectious disease surveillance, clinical epidemiology, and public-health informatics, each with at least ten years of professional experience. A total of 120 randomly selected explanation cases, equally representing the proposed framework and baseline explainability model, were presented using randomized ordering and blinded model labels. Experts independently rated each explanation for Semantic Causality, Actionability, and Forensic Trust on a five-point Likert scale (1 = very poor; 5 = excellent). Because the five-point Likert ratings were ordinal and repeatedly observed across both experts and explanation cases, comparative analysis was performed using cluster-aware ordinal logistic regression. Explanation method was specified as the principal predictor, while dependence arising from repeated ratings was addressed using two-way cluster-robust standard errors at the expert and explanation-case levels. Separate models were estimated for Semantic Causality, Actionability, and Forensic Trust. Fleiss’ κ and Cronbach’s α were additionally used to assess inter-rater agreement and internal consistency, respectively.
4.4.1. Semantic Causability and Biological Plausibility
The panel evaluated whether the ontology-grounded reasoning traces reduced the semantic gap between statistical feature attribution and epidemiological interpretation. Unlike the baseline SHAP explanations, which primarily identified influential predictors and their contributions to the model output, the proposed framework contextualized these attributions using the corresponding original predictor observations and ontology-grounded epidemiological relationships. The original observations, expressed in their physical or epidemiological units, were used to evaluate ontology thresholds and construct semantic assertions, while SHAP values were retained separately as evidence of predictor contribution. Experts particularly valued the resulting linkage between observed environmental conditions, activated ontology concepts, and biologically plausible reasoning pathways.
4.4.2. Clinical Actionability and Intervention Support
A critical objective of this study was to determine if semantically-grounded explanations could influence resource allocation. The review focused on the framework’s ability to provide “Interpretable Rationale” for interventions such as Indoor Residual Spraying (IRS). The proposed framework achieved a mean Actionability rating of 4.13/5.0, compared with 2.93/5.0 for the baseline explanations. Experts highlighted that the “Knowledge Graph” did not just predict a hotspot; it identified the nature of the risk (e.g., climatic anomaly vs. vector proliferation). This specificity allows for more targeted deployments of Long-Lasting Insecticidal Nets (LLINs) and improves the governance of fragile health systems by providing a defensible rationale for public-sector decision-making.
4.4.3. Forensic Trust and Accountability Alignment
In alignment with some selected transparency, traceability, and human-oversight principles of NIST AI RMF and the EU AI Act, the panel assessed the framework’s transparency. The “Reasoning Trace” (Figure 4) provided a verifiable audit trail that moved from raw data through axiomatic inference to the final narrative. The experts concluded that this level of interpretability is essential for building trust in AI-driven surveillance. This accountability mechanism was cited as the most significant differentiator from traditional “black-box” models, providing the forensic reliability required for the governance of infectious disease outbreaks in data-scarce environments. This is summarized in Table 4 below:
4.5. Explanatory Fidelity
The final validation phase benchmarks the proposed framework setup against the Statistical-Only baseline.
Table 5 above shows that expert evaluation indicates that the ontology-grounded narratives provided more actionable and interpretable rationales for public-health interventions, including targeted vector-control strategies such as Indoor Residual Spraying (IRS). Compared with the baseline explanations, the proposed framework received higher Actionability ratings, suggesting greater perceived usefulness for supporting intervention planning and resource-allocation decisions. These findings indicate that the framework supports transparency, traceability, and human-centred oversight principles that are broadly aligned with the NIST AI RMF and the EU AI Act, without implying formal regulatory compliance (Jarke et al., 2024).
4.6. Statistical Validation of Expert Assessment
Inter-rater agreement and internal consistency were evaluated to characterize the reliability of the expert assessment. Internal consistency across the three evaluation dimensions was acceptable (Cronbach’s α=0.71), whereas overall inter-rater agreement based on exact Likert-category agreement was modest (Fleiss’ κ≈0.18). This indicates that although experts showed reasonable consistency across the dimensions being evaluated, individual assignment of specific Likert categories varied among evaluators. All explanations were presented in randomized order using anonymized identifiers, and experts independently evaluated each explanation without discussion or exposure to the originating model labels. Assessment employed a standardized rubric comprising Semantic Causality, Clinical Actionability, and Forensic Trust, each rated on a five-point Likert scale ranging from 1 (very poor) to 5 (excellent).
Because the expert ratings were ordinal and repeatedly observed across experts and explanation cases, differences between the proposed framework and baseline XAI were evaluated using cluster-aware ordinal logistic regression, with two-way cluster-robust standard errors estimated at the expert and explanation-case levels. Explanation method was specified as the principal fixed effect, and separate models were estimated for Semantic Causality, Actionability, and Forensic Trust. The proposed framework showed significantly higher odds of receiving favorable ratings for Semantic Causality (OR = 51.77, 95% CI [24.95, 107.43], p<0.001), Actionability (OR = 84.37, 95% CI [28.69, 248.14], p<0.001), and Forensic Trust (OR = 18.28, 95% CI [4.78, 69.91], p<0.001). These results demonstrate that the higher expert ratings associated with the proposed framework remained statistically significant after accounting for the clustered rating structure. Collectively, the results provide statistical evidence that experts rated the proposed explanations as more semantically coherent, actionable, and trustworthy than the baseline explanations after accounting for evaluator- and case-level clustering. This is summarized in Table 6 below:
5. Discussion
5.1. Bridging the Semantic Gap Beyond Statistical Attribution
The findings of this study demonstrate that conventional explainability methods remain insufficient for translating statistical feature importance into epidemiologically meaningful reasoning within infectious disease surveillance. While SHAP-based interrogation successfully identified high-impact environmental and epidemiological drivers, the resulting outputs remained primarily correlational and semantically shallow. In contrast, the proposed framework contextualized statistically influential predictors using their original observations and ontology-grounded epidemiological knowledge, producing explanation narratives that reflected biologically plausible transmission mechanisms. By operationalizing a post-hoc semantic reasoning layer, the framework bridges the semantic gap between numerical attribution and expert epidemiological interpretation. This transition from isolated feature contributions to semantically connected reasoning traces suggests that explainability in high-stakes healthcare systems must extend beyond statistical transparency toward context-aware interpretive coherence grounded in domain knowledge.
5.2. Spatio-Temporal Generalization and Epidemiological Plausibility
A major contribution of this study lies in the integration of a harmonized spatio-temporal validation strategy combining chronological holdout testing with Leave-One-District-Out Spatial Cross-Validation. This design enabled the framework to evaluate both temporal robustness and geographic generalizability across ecologically heterogeneous districts within North-Eastern Nigeria. Unlike conventional random validation strategies that risk spatial and temporal leakage, the adopted protocol provides a more realistic assessment of operational deployment conditions in epidemiological surveillance environments. The results indicate that the proposed framework maintained strong predictive performance while simultaneously improving semantic fidelity and epidemiological plausibility. Importantly, the semantic reasoning layer identified and filtered biologically implausible predictions during the post-hoc evaluation phase, thereby improving interpretive reliability without interfering with the dynamics of the underlying stochastic models.
5.3. Neuro-Symbolic Synergy and Post-Hoc Semantic Validation
The experimental findings provide empirical evidence supporting the complementary relationship between statistical learning and symbolic reasoning in explainable epidemiological intelligence. The stochastic layer, particularly Elastic Net and XGBoost, demonstrated strong predictive capability under data-scarce conditions, while the semantic layer introduced a biologically grounded interpretive mechanism capable of contextualizing statistically significant associations. Unlike differentiable neuro-symbolic architectures that embed symbolic constraints directly into optimization, the proposed framework adopts a post-hoc semantic validation strategy in which ontology-guided reasoning evaluates the epidemiological plausibility of generated predictions after inference. This design preserves the convergence stability and computational efficiency of the machine-learning models while enabling semantic verification of the resulting explanations. Consequently, the framework demonstrates that semantic reasoning can function as a robust interpretive audit mechanism without requiring tightly coupled symbolic optimization during training.
5.4. Clinical Actionability and Public Health Decision Support
The expert evaluation results indicate that ontology-guided explanation narratives substantially improved the perceived actionability and interpretability of disease-risk explanations compared with conventional feature-attribution methods. By contextualizing statistically influential predictors using their corresponding original observations and epidemiological concepts such as vector proliferation, precipitation anomalies, and transmission incubation thresholds, the framework generated explanations that more closely resembled professional reasoning patterns used by public-health practitioners. This semantic enrichment enhanced the ability of experts to interpret the operational significance of predicted hotspots and identify biologically plausible intervention windows for vector-control measures such as Indoor Residual Spraying (IRS) and Long-Lasting Insecticidal Nets (LLINs). The findings therefore suggest that semantically grounded explainability may improve the utility of AI-assisted surveillance systems within fragile health environments where intervention prioritization, resource allocation, and epidemiological accountability are critically important.
5.5. Governance, Transparency, and Explainable AI Readiness
The study further demonstrates that ontology-guided semantic reasoning can strengthen transparency and traceability within AI-enabled disease surveillance systems. Through the generation of explicit reasoning traces and semantically interpretable causative pathways, the framework provides a structured mechanism for auditing how statistical predictions are contextualized through ontology-grounded reasoning to produce epidemiologically interpretable explanations. Although the framework does not constitute formal compliance with regulatory standards such as the NIST AI Risk Management Framework or the EU AI Act, its emphasis on traceability, interpretability, and human-centered reasoning aligns with several emerging principles for trustworthy AI governance. In particular, the framework supports human-in-the-loop oversight by enabling domain experts to interrogate the plausibility of generated explanations and identify semantically inconsistent outputs. This capability is especially important in high-stakes healthcare environments where erroneous predictions may influence public-health interventions and resource deployment decisions.
5.6. Limitations and Future Research Directions
Despite its contributions, the framework remains subject to several limitations. First, the quality and interpretability of the narratives are fundamentally dependent on the completeness and accuracy of the underlying ontology. Because the semantic layer operates under an open-world assumption, epidemiological relationships not explicitly represented within the ontology cannot be inferred by the reasoning engine. Second, although the framework demonstrated strong semantic fidelity under the adopted validation protocol, the post-hoc semantic evaluation process introduces additional computational overhead that may limit deployment in real-time or edge-based surveillance environments. Third, while the generated explanations provide biologically plausible reasoning pathways, the framework does not establish causative effects in the formal interventional sense. The plausibility narratives should therefore be interpreted as epidemiologically grounded explanatory constructs rather than definitive causal proof.
Future research should investigate dynamic ontology evolution mechanisms capable of incorporating newly emerging epidemiological relationships and environmental drivers. Additional work is also needed to explore lightweight reasoning architectures for resource-constrained deployment environments and to integrate formal inference frameworks capable of strengthening intervention-level reasoning. Furthermore, extending the framework toward multimodal semantic reasoning using clinical, genomic, mobility, and environmental data sources may improve both explanatory richness and predictive robustness in future infectious disease intelligence systems.
6. Conclusions
This study presented an Explainable Artificial Intelligence framework for spatio-temporal infectious disease hotspot explanation within data-scarce epidemiological environments. The framework integrated stochastic machine learning, ontology-guided semantic reasoning, and explanation narrative synthesis to generate epidemiologically grounded explanations beyond conventional statistical feature attribution methods.
Experimental evaluation using a multi-source malaria surveillance dataset from North-Eastern Nigeria demonstrated strong predictive performance alongside improved semantic fidelity, interpretability, and epidemiological plausibility. The harmonized spatio-temporal validation strategy further strengthened the disease and geographic generalizability of the framework, while the post-hoc semantic evaluation layer improved the coherence and plausibility of generated explanations without interfering with the optimization behavior of the underlying predictive models.
Expert evaluation results further indicated that the explanations were perceived as more actionable, trustworthy, and contextually meaningful than conventional explainability approaches. Overall, the findings demonstrate that integrating semantic reasoning with machine-learning prediction can improve the transparency, interpretability, and governance-readiness of AI-enabled disease surveillance systems in high-stakes healthcare environments.
Author Contributions
Conceptualization, Kamal Bakari, Zainab Usman and Charles Nche; methodology, Kamal Bakari, Zainab Usman and Charles Nche.; software, Kamal Bakari; validation, Zainab Usman and Charles Nche.; formal analysis, Kamal Bakari.; investigation, Kamal Bakari, Zainab Usman and Charles Nche.; resources, Zainab Usman and Charles Nche.; data curation, Kamal Bakari.; writing—original draft preparation, Kamal Bakari.; writing—review and editing, Zainab Usman and Charles Nche.; visualization, Kamal Bakari.; supervision, Zainab Usman and Charles Nche.; project administration, Zainab Usman and Charles Nche.; funding acquisition, Zainab Usman and Charles Nche. All authors have read and agreed to the published version of the manuscript.
Funding
This research received no external funding.
Institutional Review Board Statement
The study was conducted in accordance with the Declaration of Helsinki and approved by the Institutional Review Board of the American University of Nigeria (protocol code PRO-25-04-25; approved 16 June 2025).
Data Availability Statement
The data and code are available from the corresponding author upon reasonable request.
Conflicts of Interest
The authors declare no conflicts of interest.
Abbreviations
The following abbreviations are used in this manuscript:
| ARIMA | Autoregressive Integrated Moving Average |
| DAG | Directed Acyclic Graph |
| ENVO | Environment Ontology |
| EU AI Act | European Union Artificial Intelligence Act |
| GBDT | Gradient Boosted Decision Trees |
| IDO | Infectious Disease Ontology |
| IDOMAL | Infectious Disease Ontology for Malaria |
| LIME | Local Interpretable Model-agnostic Explanations |
| LODOCV | Leave-One-District-Out Spatial Cross-Validation |
| OWL | Web Ontology Language |
| SHAP | SHapley Additive exPlanations |
| SWRL | Semantic Web Rule Language |
| SWEET | Semantic Web for Earth and Environmental Terminology |
| XAI | Explainable Artificial Intelligence |
Appendix A
Appendix A.1. Predictor Variables and Data Provenance
| Predictor | Unit | Data Source | Functional Role |
| Rainfall | mm | CHIRPS | Climatic predictor |
| Land Surface Temperature | °C | MODIS | Climatic predictor |
| NDVI | Index | MODIS | Vegetation predictor |
| Relative Humidity | % | ERA5 | Climatic predictor |
| Elevation | m | SRTM | Environmental predictor |
| Land Cover | Categorical | Copernicus/GlobeLand30 | Environmental predictor |
| Distance to Water | km | HydroSHEDS/OpenStreetMap | Environmental predictor |
| Population Density | persons/km2 | WorldPop | Socio-demographic predictor |
| Poverty Index | Index | DHS | Socio-demographic predictor |
| ITN Coverage | % | DHS/NMCP | Intervention predictor |
| Historical Malaria Cases | Cases | DHIS2/NMCP | Epidemiological predictor |
| PfPR | % | Malaria Atlas Project | Epidemiological predictor |
| Healthcare Accessibility | km/minutes | OpenStreetMap | Health-system predictor |
| Month | Integer | Derived | Temporal predictor |
| Transmission Season | Categorical | Derived | Temporal predictor |
References
- A’aqoulah, A.; Albalas, S.; Albalas, M.; Alherbish, R.; Innab, N. Comparative analysis and spatial distribution of the primary health care centers and health manpower across Saudi Arabia using Shapiro–Wilk test. J. Multidiscip. Healthc. 2024, 17, 490–128. [Google Scholar] [CrossRef] [PubMed]
- Abledu, Y.; Mike, J. H. Grappling with Health Rights of Women in Climate Change-Induced Conflict and Post-Conflict Situations. J. Clim. Action Res. Policy 2024, 2, 2450002. [Google Scholar] [CrossRef]
- Aborode, A. T.; Otorkpa, O. J.; Abdullateef, A. O.; Oluwaseun, O. S.; Adegoye, G. A.; Aondongu, N. J.; Komakech, J. J. Impact of climate change-induced flooding water related diseases and malnutrition in Borno State, Nigeria: A public health crisis. Environ. Health Insights 2025, 19, 11786302251321683. [Google Scholar] [CrossRef] [PubMed]
- Abubakar, I.; Lawan, I.; Bello, A. Conflict, displacement, and the resurgence of cholera in North-Eastern Nigeria. Int. J. Infect. Dis. 2023, 131, 65–73. [Google Scholar] [CrossRef] [PubMed]
- Allen, B. An interpretable machine learning model of cross-sectional US county-level obesity prevalence using explainable artificial intelligence. PLoS ONE 2023, 18(10), e0292341. [Google Scholar] [CrossRef] [PubMed]
- Attai, K. Enhancing the interpretability of malaria and typhoid diagnosis with explainable AI and large language models. Trop. Med. Infect. Dis. 2024, 9(9), 216. [Google Scholar] [CrossRef] [PubMed]
- Budhkar, A.; Song, Q.; Su, J.; Zhang, X. Demystifying the black box: A survey on explainable artificial intelligence (XAI) in bioinformatics. Comput. Struct. Biotechnol. J. 2025, 27, 346–359. [Google Scholar] [CrossRef] [PubMed]
- Chandra, R.; Agarwal, S.; Singh, N.; Tiwari, S. A review of ontology-driven big data analytics in healthcare: challenges, tools, and applications. arXiv 2025, arXiv:2510.05738. [Google Scholar]
- Chen, Y.; Li, Y.; Huang, X.; Wang, Y.; Zhu, G.; Min, G.; Li, J. An Explainable Recommendation Method for Artificial Intelligence of Things Based on Reinforcement Learning with Knowledge Graph Inference. IEEE Trans. Consum. Electron. 2025, 1–1. [Google Scholar] [CrossRef]
- Cinà, G.; Rober, T. E.; Goedhard, R.; Birbil, S. I. Semantic match: Debugging feature attribution methods\titlebreak in XAI for healthcare. In Conference on Health, Inference, and Learning, 2023, June; PMLR; pp. 182–190. [Google Scholar]
- d’Amato, C.; Fanizzi, N.; Esposito, F. Machine learning and knowledge graphs: Existing approaches and future directions. In Machine learning and knowledge discovery in databases; d’Amato, C., Ed.; Springer, 2020; pp. 1–26. [Google Scholar] [CrossRef]
- Delgoshaei, P.; Heidarinejad, M.; Austin, M. A. A Semantic Approach for Building System Operations: Knowledge Representation and Reasoning. Sustainability 2022, 14(10), 5810. [Google Scholar] [CrossRef]
- Doshi-Velez, F.; Kim, B. Towards A Rigorous Science of Interpretable Machine Learning (Version 2); arXiv, 2017. [Google Scholar] [CrossRef]
- Guidotti, R.; Monreale, A.; Ruggieri, S.; Turini, F.; Giannotti, F.; Pedreschi, D. A Survey of Methods for Explaining Black Box Models. ACM Comput. Surv. 2019, 51(5), 1–42. [Google Scholar] [CrossRef]
- Inam, S. A. A review of artificial intelligence for predicting climate driven infectious disease outbreaks to enhance global health resilience. Discov. Public Health 2025, 22(1), 738. [Google Scholar] [CrossRef]
- Jarke, J.; Prietl, B.; Egbert, S.; Boeva, Y.; Heuermann, H.; Arnold, M. (Eds.) Algorithmic regimes: Methods, interactions, and politics; Amsterdam University Press, 2024. [Google Scholar]
- Jiang, W.; Ye, W.; Tan, X.; Bao, Y.-J. Network-based multi-omics integrative analysis methods in drug discovery: A systematic review. BioData Min. 2025, 18(1), 27. [Google Scholar] [CrossRef] [PubMed]
- Jillahi, K. B.; Usman, Z. S.; Nche, C. Collaborative Intelligence for Malaria Surveillance: Ontology Adaptation through Multi-Agent and Expert Feedback. Data Knowl. Eng. 2026, 164, 102605. [Google Scholar] [CrossRef]
- Noy, N. F.; McGuinness, D. L. Ontology development 101: A guide to creating your first ontology; Stanford Knowledge Systems Laboratory, 2001. [Google Scholar]
- Oh, S.; Byeon, H.; Wijaya, J. Machine learning surveillance of foodborne infectious diseases using wastewater microbiome, crowdsourced, and environmental data. Water Res. 2024, 265, 122282. [Google Scholar] [CrossRef] [PubMed]
- Okundalaye, O.; Ozdemir, N.; Rotimi, B.; Akanbi, F. Climate-based predictive modeling of malaria incidence using statistical and machine learning approaches. Trans. Comput. Model. Intell. Syst. 2025, 1, 10014–10014. [Google Scholar] [CrossRef]
- Pearl, J. Causality: Models, Reasoning, and Inference; Cambridge University Press, 2009. [Google Scholar]
- Ribeiro, M. T.; Singh, S.; Guestrin, C. Why should I trust you?” Explaining the predictions of any classifier. In Proceedings of the 22nd ACM SIGKDD International Conference on Knowledge Discovery and Data Mining; 2016; pp. 1135–1144. [Google Scholar] [CrossRef]
- Samek, W.; Montavon, G.; Lapuschkin, S.; Anders, C. J.; Müller, K. R. Explaining deep neural networks and beyond: A review of methods and applications. Proc. IEEE 2021, 109(3), 247–278. [Google Scholar] [CrossRef]
- Shi, X.; Chen, Z.; Wang, H.; Yeung, D.-Y.; Wong, W.-K.; Woo, W.-C. Convolutional LSTM network: A machine learning approach for precipitation nowcasting. Adv. Neural Inf. Process. Syst. 2015, 28. [Google Scholar]
- Tatem, A. J.; Rogers, D. J.; Hay, S. I. Global transport networks and infectious disease spread. Adv. Parasitol. 2006, 62, 293–343. [Google Scholar] [CrossRef] [PubMed]
- Vivekanand, C. V.; Rakesh, R.; Priyadarshini, M. An Integrated, Technology-Driven System for Monitoring and Predicting Vector-Borne Diseases. 2025 Third International Conference on Emerging Applications of Material Science and Technology (ICEAMST), 2025; pp. 554–560. [Google Scholar] [CrossRef]
Figure 1.
Workflow process of the Proposed Explainability Framework.
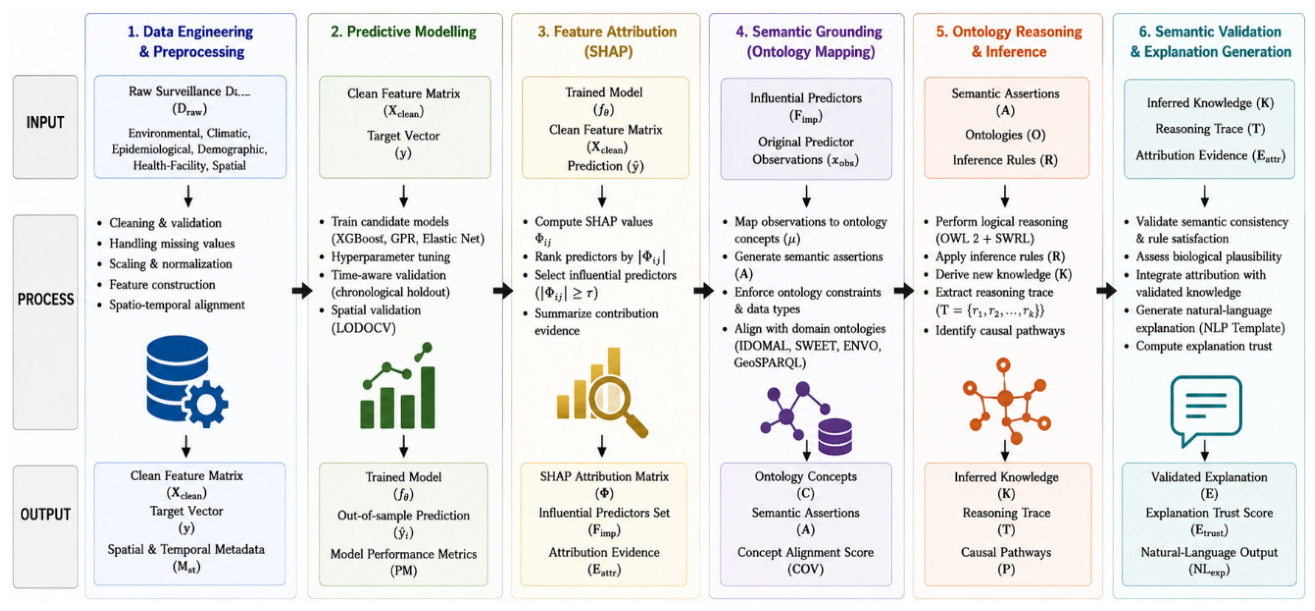
Figure 4.
Case Study of a Reasoning Trace derivation.
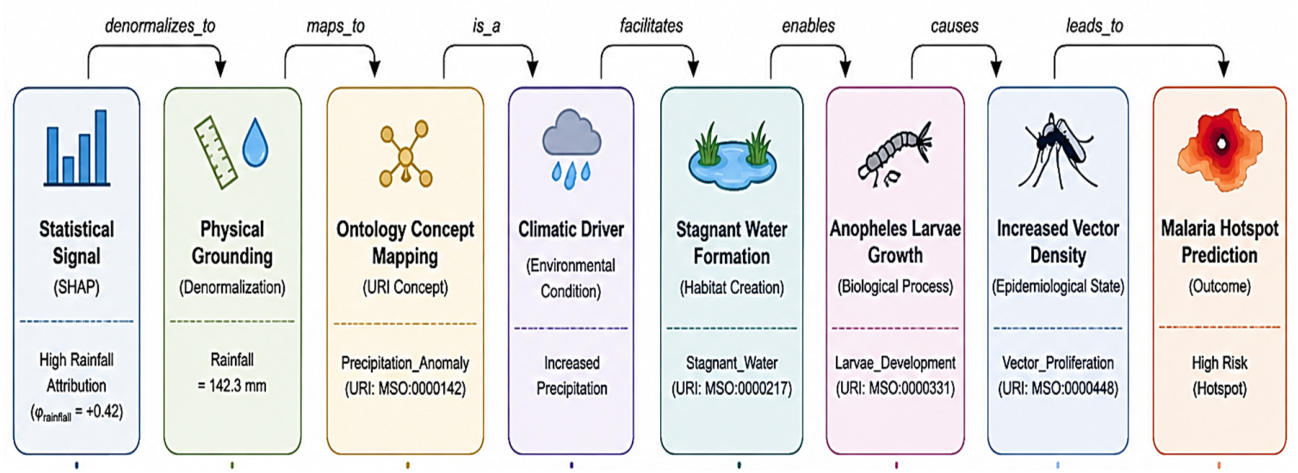

Table 1.
Comparative Predictive Performance Across Ablation Models.
| Model | Mean RMSE ± SD | 95% CI (RMSE) | Mean MAE ± SD | 95% CI (MAE) | Mean R2 ± SD | 95% CI (R2) | SHAP Rank Stability (ρ) | Calibration Slope | Calibration Intercept |
| XGBoost | 0.189 ± 0.008 | 0.181–0.197 | 0.141 ± 0.006 | 0.134–0.148 | 0.895 ± 0.012 | 0.883–0.907 | 0.87 | 0.99 | 0.01 |
| Gaussian Process Regression | 0.206 ± 0.011 | 0.195–0.217 | 0.153 ± 0.008 | 0.145–0.161 | 0.842 ± 0.015 | 0.826–0.858 | 0.69 | 1.00 | 0.00 |
| Elastic Net | 0.184 ± 0.007 | 0.177–0.191 | 0.138 ± 0.005 | 0.133–0.143 | 0.901 ± 0.011 | 0.890–0.912 | 0.73 | 0.97 | 0.02 |
Table 2.
SHAP Attribution Stability Analysis.
| Model | Mean SHAP Rank Correlation | Attribution Stability |
| XGBoost | 0.87 | High |
| Elastic Net | 0.73 | Moderate |
| GPR | 0.69 | Moderate |
Table 3.
Examples of Feature-to-Axiom Mapping.
| Influential Predictor | Original Predictor Observation | Mapped IDOMAL Concept | Applied Constraint |
|---|---|---|---|
| 58.4 mm | IDOMAL:0000456 (Precipitation) | >14-day threshold | |
| 28.5 °C | IDOMAL:0000601 (Ambient_Temp) | ||
| 0.62 | IDOMAL:0000122 (Vegetation) | facilitates_vector_harbourage |
Table 4.
Expert Panel Evaluation Results (Mean Likert Scores).
| Evaluation Dimension | Baseline XAI | Proposed Framework |
| Semantic Causability | 3.00 | 4.28 |
| Actionability | 2.93 | 4.13 |
| Forensic Trust | 3.46 | 4.31 |
Table 5.
Expert Audit and Fidelity Benchmarking.
| Metric | Baseline XAI | Proposed Framework | Significance Result |
| 0.62 | 0.91 | ||
| Clinical Actionability | 2.93/5.0 | 4.13/5.0 | Significant Improvement |
| Forensic Traceability | None | Full Axiomatic Audit | Partial Reduction of Semantic Gap |
Table 6.
Statistical Validation Results.
| Analysis | Evaluation Dimension | Estimate | 95% CI | p-value |
| Cluster-aware ordinal regression | Semantic Causability | OR = 51.77 | 24.95–107.43 | <0.001 |
| Cluster-aware ordinal regression | Actionability | OR = 84.37 | 28.69–248.14 | <0.001 |
| Cluster-aware ordinal regression | Forensic Trust | OR = 18.28 | 4.78–69.91 | <0.001 |
| Fleiss’ κ | Overall inter-rater agreement | 0.18 | — | — |
| Cronbach’s α | Internal consistency | 0.71 | — | — |
Disclaimer/Publisher’s Note: The statements, opinions and data contained in all publications are solely those of the individual author(s) and contributor(s) and not of MDPI and/or the editor(s). MDPI and/or the editor(s) disclaim responsibility for any injury to people or property resulting from any ideas, methods, instructions or products referred to in the content. |
© 2026 by the authors. Licensee MDPI, Basel, Switzerland. This article is an open access article distributed under the terms and conditions of the Creative Commons Attribution (CC BY) license (http://creativecommons.org/licenses/by/4.0/).
Copyright: This open access article is published under a Creative Commons CC BY 4.0 license, which permit the free download, distribution, and reuse, provided that the author and preprint are cited in any reuse.