
Submitted:
10 August 2026
Posted:
11 August 2026
You are already at the latest version
Abstract
Background: Slowing of gait and daily activities, reported by older adults or by people close to them, may identify a clinically relevant motor phenotype in population-based movement-disorder epidemiology. We examined whether this simple baseline history item predicted long-term all-cause mortality in the Neurological Disorders in Central Spain (NEDICES) cohort. Methods: NEDICES was a prospective, population-based cohort of 5,278 census-based participants aged 65 years or older. Information on the slowing item was available for 3,994 participants. Reported slowing was defined as an affirmative answer to: 'Have you noticed, or has anyone told you, that lately you walk or do things more slowly?' Vital status and date of death were obtained through linkage to the Spanish National Population Register (Instituto Nacional de Estadística; INE). Follow-up accrued from baseline assessment to death or to administrative censoring on 31 December 2017 for participants who were alive. Survival was assessed with Kaplan-Meier curves and Cox proportional-hazards models. The multivariable model adjusted for age, sex, education, hypertension, prevalent tremor, prevalent Parkinson's disease, osteoarthritis, osteoporosis, smoking, alcohol consumption, depressive symptoms and/or antidepressant use, and comorbidity using a Carey-based index. Results: At baseline, 1,516 participants (38.0%) reported slowing. Through 31 December 2017, 3,426 deaths occurred, and 568 participants were censored alive. The mean observed time to death or censoring was 12.9 years (median 12.6 years). Crude mortality was higher among participants with reported slowing than among those without it (89.4% vs. 83.6%). Kaplan-Meier survival was shorter in the reported-slowing group (median: 140 vs. 158 months; log-rank p< 0.001). In the fully adjusted Cox model (n=3,841), reported slowing was independently associated with mortality (hazard ratio 1.09; 95% confidence interval 1.02-1.18; p=0.017). Conclusions: A single self- or informant-reported item on slowing of gait and daily activities identified older adults with a modest but independent excess long-term mortality risk.
Keywords:
reported motor slowing
; gait
; daily activities
; parkinsonian signs
; mild motor signs
; mortality
; aging
; cohort study
; NEDICES
; survival analysis
1. Introduction
Motor slowing in later life is often treated as a nonspecific complaint, yet from a neurological and epidemiological standpoint it can be informative. Walking and carrying out everyday activities depend on the integrated performance of motor networks, executive control, balance, cardiorespiratory reserve, musculoskeletal integrity, affective state, and comorbidity burden. A simple question about recent slowing therefore has the potential to summarize multiple latent processes that are difficult to capture in routine epidemiologic surveys.
The Neurological Disorders in Central Spain (NEDICES) study offers a strong framework to examine this issue. NEDICES was a door-to-door, population-based cohort of older adults from three communities in Central Spain, designed to study major age-associated neurological disorders including dementia, essential tremor, Parkinson’s disease, parkinsonism, and stroke [1,2]. Previous NEDICES publications have shown that the cohort can generate robust longitudinal evidence on mortality and clinically meaningful predictors, including Parkinson’s disease and parkinsonism, physical activity, polypharmacy, self-rated health, morale, dementia, and mild cognitive impairment [3,4,5,6,7,8,9,10,11].
The prognostic literature on gait provides the clearest epidemiologic rationale. In pooled cohorts of community-dwelling older adults, measured gait speed predicts survival across a wide age range and improves survival estimation beyond age and sex alone [12]. Reviews and meta-analyses have consistently linked slower usual walking speed with all-cause mortality and other adverse outcomes [13,14,15]. Importantly for large surveys, self-reported walking speed and walking pace have also been associated with physical performance, comorbidity, and mortality [16,17,18,19,20,21]. This evidence supports the idea that a simple history-based item may carry a biological signal even without formal gait instrumentation.
Frailty research provides a second bridge between motor slowing and survival. Slow walking speed is one of the defining components of the frailty phenotype and is closely related to falls, disability, hospitalization, and death [22,23,24,25]. However, motor slowing in older adults is not only geriatric; it is also neurological. Mild parkinsonian or mild motor signs are common in aging populations and have been associated with disability, dementia, neuropathological burden, and mortality [26,27,28,29,30,31,32,33,34,35,36,37]. These signs may reflect mixed etiologies, including cerebrovascular disease, neurodegeneration, musculoskeletal disease, affective symptoms, and systemic frailty.
A related construct, motoric cognitive risk syndrome, combines slow gait with cognitive complaints and predicts dementia and mortality in older adults [38,39,40,41,42,43]. Although the NEDICES item studied here does not require a cognitive complaint, the conceptual overlap is relevant. Both approaches use accessible clinical information to detect vulnerability before overt dependency or a formal movement-disorder diagnosis becomes the only focus of care.
We therefore investigated whether a single baseline question on whether the participant had noticed, or had been told by someone else, that they had recently begun to walk or perform activities more slowly was associated with long-term all-cause mortality. Our primary hypothesis was that reported slowing of gait and daily activities would be associated with increased mortality over long-term follow-up, independently of age, sex, education, prevalent movement disorders, depressive symptoms and/or antidepressant use, and comorbidity.
2. Materials and Methods
2.1. Study Design and Population
NEDICES was a prospective, population-based survey of adults aged 65 years or older living in three areas of Central Spain: one urban district of Madrid, one suburban municipality in Greater Madrid, and one rural area. The baseline survey was conducted in 1994-1995 using a two-phase design with an initial screening interview followed, when indicated, by neurological examination and diagnostic adjudication [1,2]. The baseline cohort included 5,278 screened participants.
The present analysis used baseline data and long-term vital status through 31 December 2017. The exposure item was available for 3,994 participants (75.7% of the baseline cohort). The remaining 1,284 participants (24.3%) lacked information on this question and were not included in the primary survival analyses. All participants included in the survival analysis had reliable death or censoring information. Before modeling the primary association, participants with and without exposure information were compared according to age, sex, and educational attainment to describe the pattern of missing exposure data.
2.2. Exposure: Reported Slowing of Gait and Daily Activities
The exposure was defined by the baseline question: ‘Have you noticed, or has anyone told you, that lately you walk or do things more slowly?’ Participants answering yes were classified as having self- or informant-reported slowing of gait and daily activities. Participants answering no were classified as having no reported slowing. The wording explicitly allowed information to come either from the participant or from another person who had observed the participant’s recent motor behavior.
Throughout the manuscript, the item is referred to descriptively as reported slowing or reported motor slowing. This terminology was chosen to preserve the wording and source of the original NEDICES history item and to avoid overinterpreting a single questionnaire response as a specific etiological diagnosis.
2.3. Outcome Ascertainment
The outcome was all-cause mortality. Vital status and dates of death were ascertained through 31 December 2017 by linkage to the Spanish National Population Register (Instituto Nacional de Estadística; INE), the official source used for previous NEDICES mortality analyses [5,6,7]. The administrative end of follow-up was 31 December 2017, the date of complete validated linkage to national mortality records for the NEDICES cohort. Follow-up time was calculated from the baseline assessment to the date of death; participants who were alive on 31 December 2017 were right-censored at that date and contributed person-time until then. In the current analytic dataset, follow-up was available for 3,994 participants, with a mean time to death or censoring of 154.7 months (12.9 years) and a median of 151.0 months (12.6 years).
2.4. Covariates
Baseline covariates were selected a priori on clinical and epidemiological grounds after inspection of the original NEDICES variable labels and coding. The fully adjusted model included age, sex, educational level, hypertension, prevalent tremor, prevalent Parkinson’s disease, osteoarthritis, osteoporosis, smoking status, alcohol-consumption status, depressive symptoms and/or antidepressant use, and global comorbidity. Sex was coded as male or female at baseline. The variable depressive was a composite indicator coded positive when depressive symptoms were reported or antidepressant use was recorded. Comorbidity was summarized using a Carey-based index, an approach previously used in NEDICES analyses and based on chronic conditions strongly predictive of mortality in older adults [44]. In this dataset, the index included major chronic disorders such as atrial fibrillation, cancer, chronic obstructive pulmonary disease, depression, dementia, diabetes, treated epilepsy, heart failure, myocardial infarction, psychiatric disorders, renal disease, and stroke.
2.5. Statistical Analysis
Baseline characteristics were summarized as mean and standard deviation, median and interquartile range, or counts and percentages. Age was compared using an independent-samples t test for the full-cohort availability analysis and Welch’s t test in the analytic cohort; the Carey-based comorbidity index was compared using the Mann-Whitney U test. All categorical comparisons used Pearson’s chi-square test without continuity correction; Yates’ correction was not applied. Values labeled unknown and user-defined missing codes were treated as missing. In particular, codes 9 or 99 in dichotomous variables were excluded rather than analyzed as categories. Analyses for each variable used the available non-missing observations, and denominators are reported where they differed from the group totals.
Time at risk was defined as the interval from baseline assessment to death or administrative censoring on 31 December 2017. Survival was described using Kaplan-Meier curves and compared with the log-rank test. Cox proportional-hazards regression was used to estimate hazard ratios (HRs) and 95% confidence intervals (CIs) for the association between reported slowing and all-cause mortality, with the Breslow method used for tied event times. The primary multivariable analysis used complete cases for all covariates. Model 1 was unadjusted; Model 2 adjusted for age and sex; Model 3 additionally adjusted for educational level; and Model 4 was fully adjusted for demographic factors, comorbidity, movement-disorder variables, musculoskeletal conditions, lifestyle factors, and depressive symptoms and/or antidepressant use. Educational level, smoking status, and alcohol-consumption status were modeled as categorical variables. Sensitivity analyses examined the robustness of the primary association after excluding participants with prevalent Parkinson’s disease, prevalent dementia, either diagnosis, and deaths occurring during the first 24 or 60 months of follow-up.
Cause-of-death analyses were performed among deceased participants. The broad underlying cause of death was taken from the NEDICES variable causamuert and grouped as dementia, cancer, cardiocirculatory diseases, cerebrovascular diseases, respiratory diseases, and other causes. Participants alive at administrative censoring were not included. Unknown or uncoded causes among deceased participants were treated as missing and excluded from the distributional comparison. Cause-of-death distributions were compared between reported-slowing groups using Pearson’s chi-square test without continuity correction.
The manuscript was prepared following the STROBE recommendations for reporting observational cohort studies [45,46]. The number of deaths in the complete-case Cox model provided ample events per candidate predictor for stable multivariable estimation [47,48,49,50]. Statistical significance was set at a two-sided p<0.05.
2.6. Standard Protocol Approvals, Registrations, and Patient Consents
The NEDICES protocol was approved by the ethics committees of 12 de Octubre University Hospital and La Princesa University Hospital, Madrid. Written informed consent was obtained at cohort enrollment; when cognitive, sensory, or severe health limitations prevented direct consent, consent was obtained from a family member or close informant in accordance with the original protocol.
3. Results
3.1. Availability of the Slowing Item
Of the 5,278 baseline NEDICES participants, 3,994 (75.7%) had information on the baseline question about walking or doing things more slowly, whereas 1,284 (24.3%) did not. Participants with available exposure information were younger than those without information (mean age 73.98 vs. 75.34 years; mean difference -1.36 years; p<0.001). Sex distribution was similar between groups (women: 57.1% among those with information vs. 59.3% among those without information; Pearson chi-square p=0.164). Educational attainment differed between groups (Pearson chi-square p<0.001), with a lower proportion of primary studies and higher proportions able to read and write or with secondary/higher education among participants with available exposure information. These comparisons are summarized in Table 1.
3.2. Baseline Characteristics According to Reported Slowing
Among the 3,994 participants with exposure information, 1,516 (38.0%) reported recent slowing of gait or daily activities. Participants with reported slowing were older, more frequently women, and had a different educational distribution than those without reported slowing. They also had a higher burden of comorbidity and higher prevalences of hypertension, prevalent tremor, prevalent Parkinson’s disease, osteoarthritis, osteoporosis, depressive symptoms and/or antidepressant use, dementia, stroke, and chronic obstructive pulmonary disease. Cancer, diabetes, heart disease, and antiepileptic treatment did not differ significantly between groups. Baseline characteristics are shown in Table 2.
3.3. Mortality and Survival
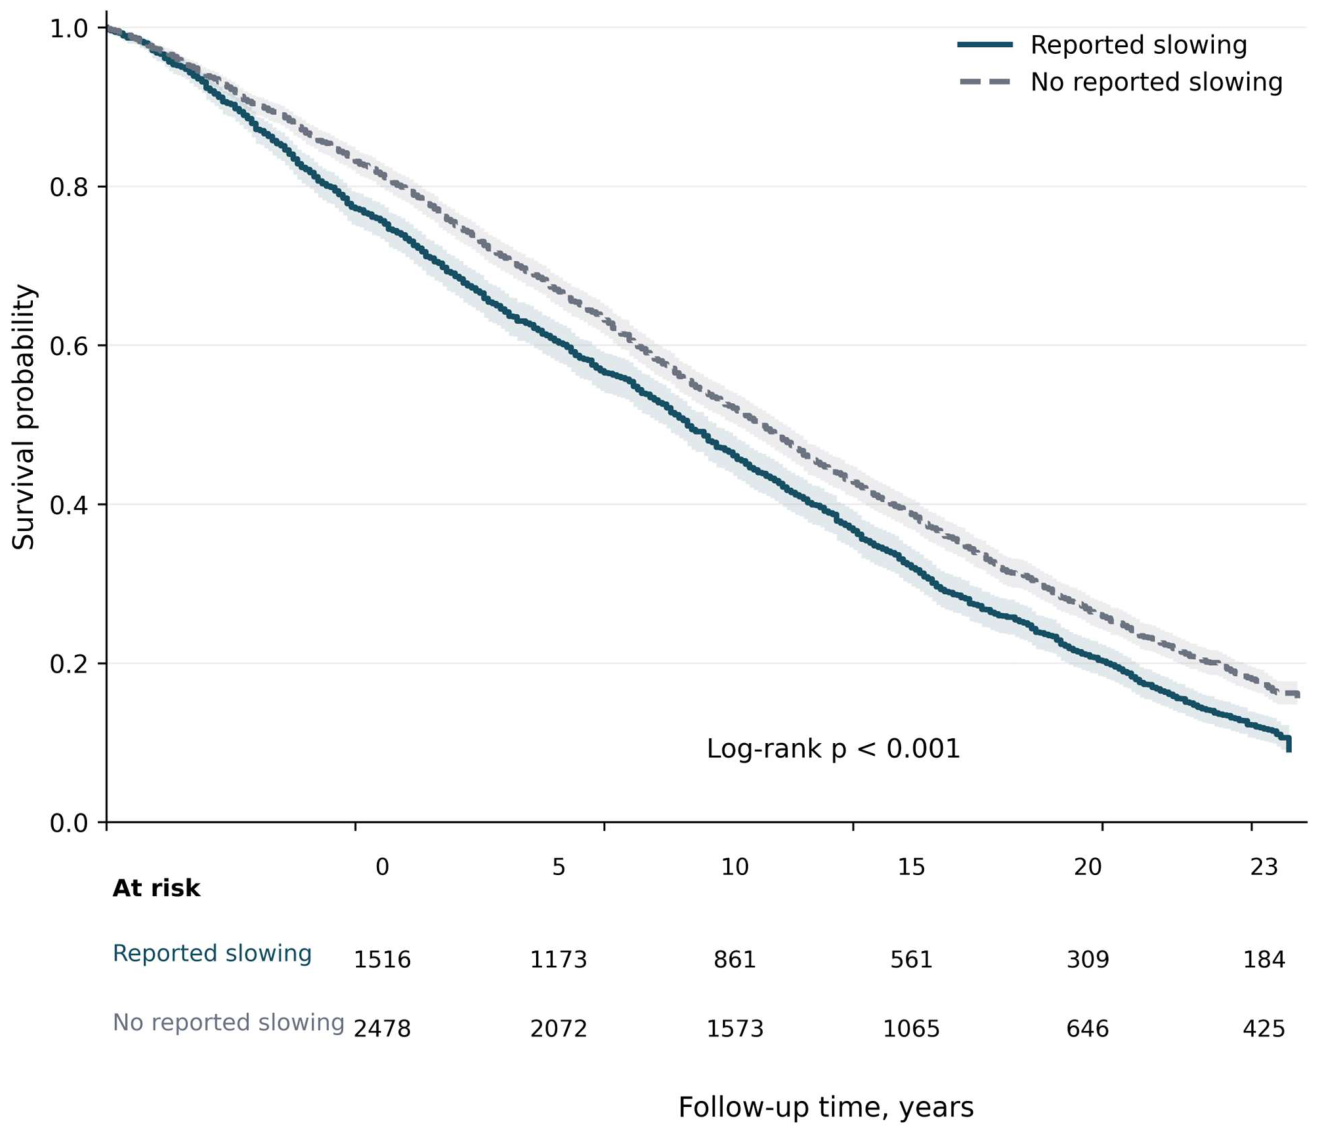
Vital status was ascertained through 31 December 2017. During follow-up from baseline to death or administrative censoring, 3,426 of the 3,994 participants died and 568 were alive and right-censored at the end of follow-up. Crude mortality was higher among participants with reported slowing than among those without reported slowing (1,355/1,516 [89.4%] vs. 2,071/2,478 [83.6%]). The mean observed time to death or censoring was 145.4 months in the reported-slowing group and 160.3 months in the no-reported-slowing group. Kaplan-Meier estimated survival was shorter among participants with reported slowing (mean: 146.0 vs. 161.4 months; median: 140 vs. 158 months; log-rank chi-square=32.02, p<0.001). The survival curves separated early and remained distinct during long-term follow-up (Figure 2). Survival summaries are shown in Table 3.
Figure 1.
Study flow chart and analytic samples. INE, Instituto Nacional de Estadística.
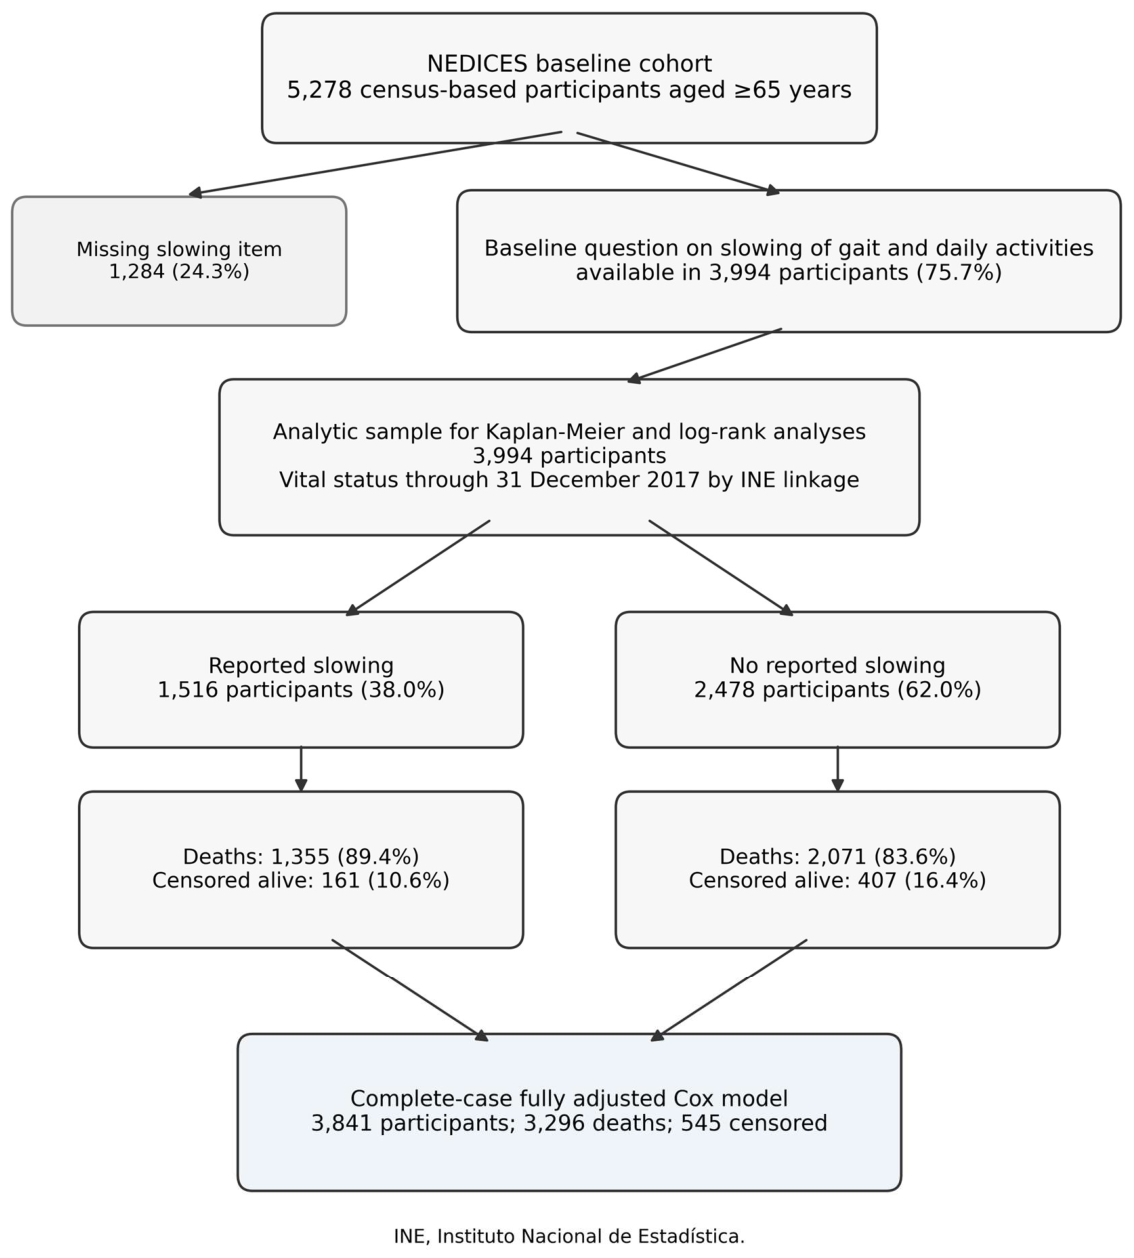
Figure 2.
Kaplan-Meier survival curves with 95% confidence intervals and numbers at risk according to reported slowing of gait and daily activities.
Figure 2.
Kaplan-Meier survival curves with 95% confidence intervals and numbers at risk according to reported slowing of gait and daily activities.
3.4. Cause-of-Death Distribution
Among the 3,426 participants who died, 3,392 (99.0%) had a coded broad cause of death in causamuert. Cause-of-death information was missing or uncoded for 34 deaths (1.0%; 11 in the reported-slowing group and 23 in the no-reported-slowing group) and was excluded from the comparison. Among deaths with a known broad cause, the distribution was similar in participants with and without reported slowing (Pearson chi-square=6.23, df=5, p=0.284; Table 4). Cardiocirculatory disease was the most frequent category in both groups (27.8% vs. 27.1%). Cerebrovascular deaths were numerically more common among participants with reported slowing (9.4% vs. 7.4%), but the overall distribution did not differ significantly.
3.5. Cox Proportional-Hazards Models
In unadjusted Cox regression, reported slowing was associated with higher all-cause mortality. The association attenuated after adjustment for age and sex and remained statistically significant after additional adjustment for education, comorbidity, prevalent movement disorders, musculoskeletal conditions, lifestyle factors, and depressive symptoms and/or antidepressant use. In the fully adjusted complete-case model including 3,841 participants, 3,296 deaths, and 545 censored observations, reported slowing was associated with a 9% higher hazard of death (HR 1.09; 95% CI 1.02-1.18; p=0.017). Cox models are summarized in Table 5.
3.6. Sensitivity Analyses
Sensitivity analyses supported the direction and approximate magnitude of the primary association. The HR for reported slowing remained significant after excluding participants with prevalent Parkinson’s disease, prevalent dementia, or either diagnosis, and after excluding deaths occurring during the first 24 months. When deaths during the first 60 months were excluded, the estimate remained in the same direction but was attenuated and no longer statistically significant. These analyses suggest that the primary association was not driven solely by prevalent Parkinson’s disease, prevalent dementia, or very early mortality (Table 6 and Figure 3).
4. Discussion
In this population-based cohort of older adults, a single question about whether the participant had noticed, or had been told by someone else, that they had recently begun to walk or do things more slowly identified a group with higher long-term mortality. The association was modest in magnitude but remained statistically significant after adjustment for demographic factors, educational level, vascular risk, prevalent movement disorders, musculoskeletal disease, lifestyle factors, depressive symptoms and/or antidepressant use, and a Carey-based comorbidity index. The finding was also robust to several clinically relevant sensitivity analyses.
The cause-of-death analysis did not identify a single coded category that explained the excess mortality associated with reported slowing. Cause distributions among deceased participants were broadly similar across groups after missing or uncoded causes were excluded. This pattern supports the interpretation of reported slowing as a general marker of biological and neurological vulnerability rather than a marker tied to one specific terminal pathway.
The effect size deserves careful interpretation. An adjusted HR of 1.09 is not large at the individual level. However, the item was extremely simple, required no instrumentation, and was obtained in a population-based survey rather than in a specialized clinic. In that context, the result is epidemiologically meaningful: a low-cost history item captured residual risk beyond standard clinical and demographic information. Such variables can be particularly valuable in large cohorts, primary care, and public-health screening, where direct gait assessment or formal movement examination may not be available for every participant.
The missing-exposure comparison is also informative. Approximately one quarter of baseline participants lacked the slowing item. Those with available information were younger and differed in education, although sex distribution was similar. We therefore present the primary cohort transparently as an analytic subset of the full NEDICES baseline sample. The comparison does not eliminate the possibility of selection bias, but it clarifies its most visible structure. Because participants without exposure data were older, the analytic cohort may have been slightly healthier than the full baseline cohort. This would tend to make the observed long-term association conservative rather than artificially stronger, although the direction of any bias cannot be proven from available data alone.
Our findings align with the broader literature on gait speed and survival. Objective gait speed is one of the most reproducible predictors of mortality in older adults, and pooled analyses have shown that survival increases progressively with faster gait speed [12]. Meta-analytic data support slow usual walking speed as an independent risk factor for all-cause mortality [14,15]. Studies based on self-reported walking pace reach a similar conclusion, suggesting that an individual’s or informant’s recognition of slowness can carry prognostic information [16,17,18,19]. NEDICES extends this literature by using a question that combines gait and general daily activity slowing and by evaluating survival over more than a decade.
The link with movement disorders is central. Mild parkinsonian signs and broader mild motor signs are common in older adults and are associated with disability, dementia, and death [26,27,28,29,30,31,32,33,34,35,36,37]. These signs are not necessarily specific for Parkinson’s disease in the oldest age groups; rather, they often appear to index mixed brain and systemic pathology. The present item may operate similarly, capturing a clinical phenotype at the intersection of prodromal neurological disease, vascular burden, musculoskeletal limitation, affective symptoms, and frailty. Persistence of the association after adjustment for prevalent Parkinson’s disease, dementia, depressive symptoms and/or antidepressant use, osteoarthritis, osteoporosis, and global comorbidity supports this interpretation.
The results also relate to motoric cognitive risk syndrome, a construct combining slow gait with subjective cognitive complaints. MCR predicts cognitive decline, dementia, frailty transitions, and mortality [38,39,40,41,42,43]. Our exposure is simpler and does not require a cognitive complaint. This may be a strength in movement-disorder epidemiology, because it isolates the motor or activity-slowing perception without requiring memory concern as part of the definition. In practice, older adults or their relatives often first report a change in pace before a formal neurological label is established. That observation may deserve more systematic attention.
Several mechanisms could explain the association between reported slowing and mortality. First, slowing may reflect early neurological disease, including parkinsonism, cerebrovascular damage, frontal-subcortical dysfunction, or neurodegenerative processes. Second, it may mark frailty, sarcopenia, reduced physical activity, or lower physiological reserve. Third, it may capture multimorbidity, polypharmacy, depression, pain, or musculoskeletal disease. Fourth, it may reflect a transition toward dependency, with reduced mobility leading to lower activity, deconditioning, falls, hospitalization, and further decline. These mechanisms are not mutually exclusive and are likely to coexist in older population-based cohorts.
The NEDICES setting strengthens the analysis. The cohort was population-based, included urban and rural communities, used standardized baseline information, and has already generated important longitudinal mortality studies [1,2,3,4,5,6,7,8,9,10,11]. Vital status was ascertained through official national registry linkage, and the administrative censoring date was uniform for all survivors. The long follow-up is a major asset: few movement-disorder epidemiologic studies can relate a simple baseline motor-history item to mortality over such an extended period. The analysis also adjusted for a broad set of potential confounders, including prevalent Parkinson’s disease and global comorbidity using a Carey-based index.
The study also has limitations. The exposure was based on a single baseline question and did not quantify severity, duration, laterality, progression, falls, freezing, objective gait speed, or neurological examination components in the same variable. Because the item allowed reporting by the participant or another person, self-perception could not be separated from informant observation. This is clinically realistic but analytically heterogeneous. The depressive covariate combined depressive symptoms with antidepressant use and therefore could not distinguish untreated symptoms, treated depression, or antidepressant treatment prescribed for another indication. Residual confounding is also possible, especially from frailty, medication burden, pain, undiagnosed neurological disease, socioeconomic factors, and later incident disorders. Finally, the slowing item was unavailable in 1,284 baseline participants, and the analytic cohort differed from the missing-exposure group in age and education.
Despite these limitations, the clinical message is straightforward. Asking whether an older person has recently started to walk or do things more slowly is not a trivial question. In NEDICES, the answer identified a large subgroup with poorer long-term survival even after extensive adjustment. For movement-disorder clinicians, this supports a broader view of motor slowing in late life as a marker of vulnerability that may merit careful neurological, functional, and systemic assessment. For epidemiologists, it shows that parsimonious history items can preserve meaningful prognostic information in large longitudinal cohorts.
5. Conclusions
In the NEDICES population-based cohort, self- or informant-reported slowing of gait and daily activities was associated with a modest but independent increase in all-cause mortality during follow-up to death or administrative censoring on 31 December 2017. The association persisted after accounting for age, sex, education, prevalent movement disorders, depressive symptoms and/or antidepressant use, musculoskeletal disease, lifestyle factors, and global comorbidity. A simple history item on recent motor slowing may help identify older adults with increased biological vulnerability. It could be useful in movement-disorder epidemiology, geriatric neurology, and population-based risk stratification.
Author Contributions
Julián Benito-León: study concept and design; major role in acquisition of data; epidemiologic and statistical analysis and interpretation; drafting and revision of the manuscript; corresponding author. Carla María Benito-Rodríguez: epidemiologic interpretation; drafting and revision of the manuscript. Álex Escolà-Gascón: epidemiologic and statistical analysis and interpretation; drafting and revision of the manuscript. Félix Bermejo-Pareja: study concept and design; major role in acquisition of data; interpretation of data; drafting and revision of the manuscript. All authors have read and agreed to the published version of the manuscript.
Funding
The Spanish Health Research Agency and the Spanish Office of Science and Technology supported the NEDICES study.
Institutional Review Board Statement
The NEDICES protocol was approved by the ethics committees of 12 de Octubre University Hospital and La Princesa University Hospital, Madrid.
Informed Consent Statement
Written informed consent was obtained at cohort enrollment; when cognitive, sensory, or severe health limitations prevented direct consent, consent was obtained from a family member or close informant in accordance with the original protocol.
Data Availability Statement
The data analyzed in this study are not publicly available because they derive from a historical population-based cohort with ethical and privacy restrictions. Reasonable requests may be considered by the corresponding author subject to applicable approvals and data-protection requirements.
Acknowledgments
The authors thank the NEDICES participants and informants; the field interviewers and study neurologists; the participating primary-care physicians and nurses; the municipal authorities; and the members of the NEDICES Study Group in Getafe, Lista, and Arévalo.
Conflicts of Interest
The authors report no disclosures relevant to the manuscript. Complete disclosure forms will be submitted through the journal submission system if required.
References
- Morales, J.M.; Bermejo, F.P.; Benito-León, J.; Rivera-Navarro, J.; Trincado, R.; Gabriel, R.; Vega, S. NEDICES Study Group. Methods and demographic findings of the baseline survey of the NEDICES cohort: a door-to-door survey of neurological disorders in three communities from Central Spain. Public Health 2004, 118, 426–433. [Google Scholar] [CrossRef] [PubMed]
- Bermejo-Pareja, F.; Benito-León, J.; Vega, S.; Medrano, M.J.; Román, G.C. The NEDICES cohort of the elderly. Methodology and main neurological findings. Rev. Neurol. 2008, 46, 416–423. [Google Scholar] [CrossRef] [PubMed]
- Benito-León, J.; Bermejo-Pareja, F.; Rodríguez, J.; Molina, J.A.; Gabriel, R.; Morales, J.M. NEDICES Study Group. Prevalence of PD and other types of parkinsonism in three elderly populations of central Spain. Mov. Disord. 2003, 18, 267–274. [Google Scholar] [CrossRef] [PubMed]
- Benito-León, J.; Bermejo-Pareja, F.; Morales-González, J.M.; Porta-Etessam, J.; Trincado, R.; Vega, S.; Louis, E.D. NEDICES Study Group. Incidence of Parkinson disease and parkinsonism in three elderly populations of central Spain. Neurology 2004, 62, 734–741. [Google Scholar] [CrossRef] [PubMed]
- Benito-Rodríguez, C.M.; Benito-León, J.; Bermejo-Pareja, F.; et al. Twenty-three-year mortality in Parkinson’s disease: A population-based prospective study (NEDICES). J. Clin. Med. 2025, 14, 498. [Google Scholar] [CrossRef] [PubMed]
- Llamas-Velasco, S.; Villarejo-Galende, A.; Contador, I.; Lora Pablos, D.; Hernández-Gallego, J.; Bermejo-Pareja, F. Physical activity and long-term mortality risk in older adults: A prospective population based study (NEDICES). Prev. Med. Rep. 2016, 4, 546–550. [Google Scholar] [CrossRef] [PubMed]
- Gómez, C.; Vega-Quiroga, S.; Bermejo-Pareja, F.; Medrano, M.J.; Louis, E.D.; Benito-León, J. Polypharmacy in the elderly: A marker of increased risk of mortality in a population-based prospective study (NEDICES). Gerontology 2015, 61, 301–309. [Google Scholar] [CrossRef] [PubMed]
- Fernández-Ruiz, M.; Guerra-Vales, J.M.; Trincado, R.; et al. The ability of self-rated health to predict mortality among community-dwelling elderly individuals differs according to the specific cause of death: Data from the NEDICES cohort. Gerontology 2013, 59, 368–377. [Google Scholar] [CrossRef] [PubMed]
- Benito-León, J.; Louis, E.D.; Rivera-Navarro, J.; Medrano, M.J.; Vega, S.; Bermejo-Pareja, F. Low morale is associated with increased risk of mortality in the elderly: A population-based prospective study (NEDICES). Age Ageing 2010, 39, 366–373. [Google Scholar] [CrossRef] [PubMed]
- Villarejo, A.; Benito-León, J.; Trincado, R.; et al. Dementia-associated mortality at thirteen years in the NEDICES Cohort Study. J. Alzheimers Dis. 2011, 26, 543–551. [Google Scholar] [CrossRef] [PubMed]
- Contador, I.; Bermejo-Pareja, F.; Mitchell, A.J.; Trincado, R.; Villarejo, A.; Sánchez-Ferro, Á.; Benito-León, J. Cause of death in mild cognitive impairment: A prospective study (NEDICES). Eur. J. Neurol. 2014, 21, 253–e9. [Google Scholar] [CrossRef] [PubMed]
- Studenski, S.; Perera, S.; Patel, K.; et al. Gait speed and survival in older adults. JAMA 2011, 305, 50–58. [Google Scholar] [CrossRef] [PubMed]
- Abellan van Kan, G.; Rolland, Y.; Andrieu, S.; et al. Gait speed at usual pace as a predictor of adverse outcomes in community-dwelling older people: An IANA Task Force. J. Nutr. Health Aging 2009, 13, 881–889. [Google Scholar] [CrossRef] [PubMed]
- Liu, B.; Hu, X.; Zhang, Q.; et al. Usual walking speed and all-cause mortality risk in older people: A systematic review and meta-analysis. Gait Posture 2016, 44, 172–177. [Google Scholar] [CrossRef] [PubMed]
- Wu, Q.; Li, G.; Zhang, X.; Pan, Y.; Chen, S.; Chen, J.; He, Q. Systematic review and meta-analysis of the association between usual walking speed and all-cause mortality and risk of major non-communicable diseases. J. Sports Sci. 2025, 43, 1364–1377. [Google Scholar] [CrossRef] [PubMed]
- Syddall, H.E.; Westbury, L.D.; Cooper, C.; Sayer, A.A. Self-reported walking speed: A useful marker of physical performance among community-dwelling older people? J. Am. Med. Dir. Assoc. 2015, 16, 323–328. [Google Scholar] [CrossRef] [PubMed]
- Stamatakis, E.; Kelly, P.; Strain, T.; Murtagh, E.M.; Ding, D.; Murphy, M.H. Self-rated walking pace and all-cause, cardiovascular disease and cancer mortality: Individual participant pooled analysis of 50,225 walkers from 11 population British cohorts. Br. J. Sports Med. 2018, 52, 761–768. [Google Scholar] [CrossRef] [PubMed]
- Yates, T.; Zaccardi, F.; Dhalwani, N.N.; et al. Association of walking pace and handgrip strength with all-cause, cardiovascular, and cancer mortality: A UK Biobank observational study. Eur. Heart J. 2017, 38, 3232–3240. [Google Scholar] [CrossRef] [PubMed]
- Goldney, J.; et al. Self-reported walking pace and 10-year cause-specific mortality: A UK Biobank investigation. Prog. Cardiovasc Dis. 2023, 81, 17–23. [Google Scholar] [CrossRef] [PubMed]
- Cesari, M.; Onder, G.; Zamboni, V.; et al. Self-assessed health status, walking speed and mortality in older Mexican-Americans. Gerontology 2009, 55, 194–201. [Google Scholar] [CrossRef] [PubMed]
- Dumurgier, J.; Elbaz, A.; Ducimetière, P.; Tavernier, B.; Alpérovitch, A.; Tzourio, C. Slow walking speed and cardiovascular death in well functioning older adults: Prospective cohort study. BMJ 2009, 339, b4460. [Google Scholar] [CrossRef] [PubMed]
- Fried, L.P.; Tangen, C.M.; Walston, J.; et al. Cardiovascular Health Study Collaborative Research Group. Frailty in older adults: Evidence for a phenotype. J. Gerontol. A Biol. Sci. Med. Sci. 2001, 56, M146–M156. [Google Scholar] [CrossRef] [PubMed]
- Clegg, A.; Young, J.; Iliffe, S.; Rikkert, M.O.; Rockwood, K. Frailty in elderly people. Lancet 2013, 381, 752–762. [Google Scholar] [CrossRef] [PubMed]
- Rockwood, K.; Song, X.; MacKnight, C.; et al. A global clinical measure of fitness and frailty in elderly people. CMAJ 2005, 173, 489–495. [Google Scholar] [CrossRef] [PubMed]
- Hoogendijk, E.O.; Afilalo, J.; Ensrud, K.E.; Kowal, P.; Onder, G.; Fried, L.P. Frailty: Implications for clinical practice and public health. Lancet 2019, 394, 1365–1375. [Google Scholar] [CrossRef] [PubMed]
- Bennett, D.A.; Beckett, L.A.; Murray, A.M.; et al. Prevalence of parkinsonian signs and associated mortality in a community population of older people. N Engl. J. Med. 1996, 334, 71–76. [Google Scholar] [CrossRef] [PubMed]
- Louis, E.D.; Schupf, N.; Marder, K.; Tang, M.X. Functional correlates and prevalence of mild parkinsonian signs in a community population of older people. Arch. Neurol. 2005, 62, 297–302. [Google Scholar] [CrossRef] [PubMed]
- Louis, E.D.; Bennett, D.A. Mild parkinsonian signs: An overview of an emerging concept. Mov. Disord. 2007, 22, 1681–1688. [Google Scholar] [CrossRef] [PubMed]
- Wilson, R.S.; Schneider, J.A.; Bienias, J.L.; Evans, D.A.; Bennett, D.A. Progression of gait disorder and rigidity and risk of death in older persons. Neurology 2002, 58, 1815–1819. [Google Scholar] [CrossRef] [PubMed]
- Zhou, G.; Duan, L.; Sun, F.; Yan, B. Association between mild parkinsonian signs and mortality in an elderly male cohort in China. J. Clin. Neurosci. 2010, 17, 173–176. [Google Scholar] [CrossRef] [PubMed]
- Buchman, A.S.; Leurgans, S.E.; Yu, L.; Wilson, R.S.; Lim, A.S.; James, B.D.; Bennett, D.A. Parkinsonism in older adults and its association with adverse health outcomes and neuropathology. J. Gerontol. A Biol. Sci. Med. Sci. 2016, 71, 549–556. [Google Scholar] [CrossRef] [PubMed]
- Louis, E.D.; Tang, M.X.; Mayeux, R. Mild parkinsonian signs are associated with increased risk of dementia in a prospective, population-based study of elders. Mov. Disord. 2010, 25, 172–178. [Google Scholar] [CrossRef] [PubMed]
- Mahoney, J.R.; Verghese, J.; Holtzer, R.; Allali, G. The evolution of mild parkinsonian signs in aging. J. Neurol. 2014, 261, 1922–1928. [Google Scholar] [CrossRef] [PubMed]
- Buchanan, S.M.; Richards, M.; Schott, J.M.; Schrag, A. Mild parkinsonian signs: A systematic review of clinical, imaging, and pathological associations. Mov. Disord. 2021, 36, 2481–2493. [Google Scholar] [CrossRef] [PubMed]
- Lerche, S.; Brockmann, K.; Pilotto, A.; et al. Mild parkinsonian signs in the elderly: Is there an association with prodromal Parkinson’s disease? J. Neurol. 2014, 261, 1103–1111. [Google Scholar] [CrossRef] [PubMed]
- Algotsson, C.; Berglund, P.; Schmidt, R.; et al. Prevalence and functional impact of parkinsonian signs in older adults from the Good Aging in Skåne study. Park. Relat. Disord. 2023, 111, 105416. [Google Scholar] [CrossRef] [PubMed]
- Oveisgharan, S.; Yu, L.; Bennett, D.A.; Buchman, A.S. Incident mobility disability, parkinsonism, and mortality in community-dwelling older adults. PLoS ONE 2021, 16, e0246206. [Google Scholar] [CrossRef] [PubMed]
- Verghese, J.; Wang, C.; Lipton, R.B.; Holtzer, R.; Xue, X. Motoric cognitive risk syndrome and the risk of dementia. J. Gerontol. A Biol. Sci. Med. Sci. 2013, 68, 412–418. [Google Scholar] [CrossRef] [PubMed]
- Verghese, J.; Annweiler, C.; Ayers, E.; et al. Motoric cognitive risk syndrome: Multicountry prevalence and dementia risk. Neurology 2014, 83, 718–726. [Google Scholar] [CrossRef] [PubMed]
- Ayers, E.; Verghese, J. Motoric cognitive risk syndrome and risk of mortality in older adults. Alzheimers Dement. 2016, 12, 556–564. [Google Scholar] [CrossRef] [PubMed]
- Mullin, D.S.; Cockburn, A.; Welstead, M.; Luciano, M.; Russ, T.C.; Muniz-Terrera, G. Mechanisms of motoric cognitive risk: Hypotheses based on a systematic review and meta-analysis of longitudinal cohort studies of older adults. Alzheimers Dement. 2022, 18, 2413–2427. [Google Scholar] [CrossRef] [PubMed]
- Verghese, J.; Ayers, E. Subjective motoric complaints and new onset slow gait. J. Gerontol. A Biol. Sci. Med. Sci. 2021, 76, e245–e252. [Google Scholar] [CrossRef] [PubMed]
- Xing, Y.; Zhang, L.; Liu, P.; Pan, Y.; Tang, Z.; Ma, L. Self-reported motoric cognitive risk syndrome predicts long-term mortality in older adults. J. Nutr. Health Aging 2025, 29, 100578. [Google Scholar] [CrossRef] [PubMed]
- Carey, I.M.; Shah, S.M.; Harris, T.; DeWilde, S.; Cook, D.G. A new simple primary care morbidity score predicted mortality and better explains between-practice variations than the Charlson index. J. Clin. Epidemiol. 2013, 66, 436–444. [Google Scholar] [CrossRef] [PubMed]
- von Elm, E.; Altman, D.G.; Egger, M.; Pocock, S.J.; Gøtzsche, P.C.; Vandenbroucke, J.P. STROBE Initiative. The Strengthening the Reporting of Observational Studies in Epidemiology (STROBE) statement: Guidelines for reporting observational studies. PLoS Med. 2007, 4, e296. [Google Scholar] [CrossRef] [PubMed]
- Vandenbroucke, J.P.; von Elm, E.; Altman, D.G.; STROBE Initiative; et al. Strengthening the Reporting of Observational Studies in Epidemiology (STROBE): Explanation and elaboration. PLoS Med. 2007, 4, e297. [Google Scholar] [CrossRef] [PubMed]
- Concato, J.; Peduzzi, P.; Holford, T.R.; Feinstein, A.R. Importance of events per independent variable in proportional hazards analysis. I. Background, goals, and general strategy. J. Clin. Epidemiol. 1995, 48, 1495–1501. [Google Scholar] [CrossRef] [PubMed]
- Peduzzi, P.; Concato, J.; Feinstein, A.R.; Holford, T.R. Importance of events per independent variable in proportional hazards regression analysis. II. Accuracy and precision of regression estimates. J. Clin. Epidemiol. 1995, 48, 1503–1510. [Google Scholar] [CrossRef] [PubMed]
- Schoenfeld, D.A. Sample-size formula for the proportional-hazards regression model. Biometrics 1983, 39, 499–503. [Google Scholar] [CrossRef] [PubMed]
- White, I.R.; Royston, P.; Wood, A.M. Multiple imputation using chained equations: Issues and guidance for practice. Stat. Med. 2011, 30, 377–399. [Google Scholar] [CrossRef] [PubMed]
Figure 3.
Fully adjusted association between reported slowing and all-cause mortality across sensitivity analyses. HR, hazard ratio; CI, confidence interval.
Figure 3.
Fully adjusted association between reported slowing and all-cause mortality across sensitivity analyses. HR, hazard ratio; CI, confidence interval.
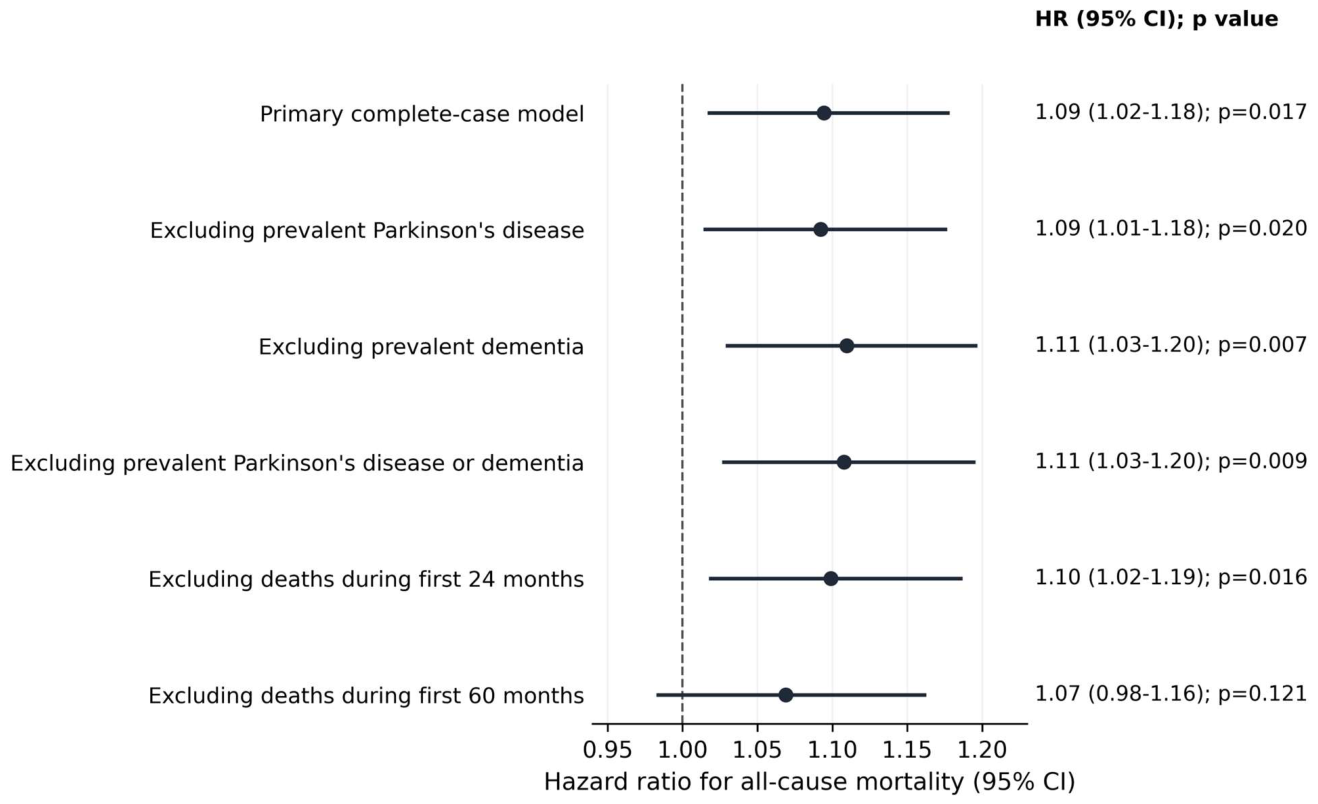

Table 1.
Baseline comparison of NEDICES participants with and without information on the slowing item.
Table 1.
Baseline comparison of NEDICES participants with and without information on the slowing item.
| Characteristic | Exposure item available (n=3,994) |
Exposure item unavailable (n=1,284) |
p value |
|---|---|---|---|
| Age, years, mean (SD) | 73.98 (6.72) | 75.34 (7.62) | <0.001 |
| Men, n (%) | 1,715 (42.9) | 523 (40.7) | 0.164 |
| Women, n (%) | 2,279 (57.1) | 761 (59.3) | |
| Education available, n | 3,994 | 1,237 | |
| Illiterate, n (%) | 552 (13.8) | 159 (12.9) | <0.001 |
| Can read and write, n (%) | 1,652 (41.4) | 440 (35.6) | |
| Primary studies, n (%) | 1,222 (30.6) | 498 (40.3) | |
| Secondary or higher, n (%) | 568 (14.2) | 140 (11.3) |
Percentages for sex are column percentages among all 5,278 baseline participants. Percentages for education are calculated among participants with educational data (n=5,231). P values were obtained with an independent-samples t test for age and Pearson’s chi-square tests without continuity correction for sex and the overall educational distribution.
Table 2.
Baseline characteristics of participants with and without reported slowing of gait and daily activities.
Table 2.
Baseline characteristics of participants with and without reported slowing of gait and daily activities.
| Characteristic | Reported slowing (n=1,516) |
No reported slowing (n=2,478) |
p value |
|---|---|---|---|
| Age, years, mean (SD) | 74.8 (6.8) | 73.5 (6.6) | <0.001 |
| Female sex, n (%) | 934 (61.6) | 1,345 (54.3) | <0.001 |
| Education: illiterate, n (%) | 230 (15.2) | 322 (13.0) | <0.001 |
| Education: can read/write, n (%) | 604 (39.8) | 1,048 (42.3) | |
| Education: primary studies, n (%) | 545 (35.9) | 677 (27.3) | |
| Education: secondary/higher, n (%) | 137 (9.0) | 431 (17.4) | |
| Carey-based comorbidity index, median (IQR) | 1 (0-2) | 0 (0-2) | <0.001 |
| Hypertension, n/N (%) | 823/1,513 (54.4) | 1,222/2,473 (49.4) | 0.002 |
| Prevalent tremor, n (%) | 115 (7.6) | 104 (4.2) | <0.001 |
| Prevalent Parkinson’s disease, n (%) | 52 (3.4) | 16 (0.6) | <0.001 |
| Osteoarthritis, n/N (%) | 972/1,496 (65.0) | 1,448/2,454 (59.0) | <0.001 |
| Osteoporosis, n/N (%) | 317/1,483 (21.4) | 297/2,423 (12.3) | <0.001 |
| Depressive symptoms and/or antidepressant use, n/N (%) | 466/1,503 (31.0) | 573/2,465 (23.2) | <0.001 |
| Prevalent dementia, n (%) | 100 (6.6) | 83 (3.3) | <0.001 |
| Stroke, n (%) | 111 (7.3) | 103 (4.2) | <0.001 |
| Chronic obstructive pulmonary disease, n/N (%) | 274/1,504 (18.2) | 370/2,456 (15.1) | 0.009 |
| Cancer, n/N (%) | 103/1,508 (6.8) | 152/2,460 (6.2) | 0.417 |
| Diabetes, n/N (%) | 268/1,506 (17.8) | 417/2,457 (17.0) | 0.506 |
| Heart disease, n/N (%) | 160/1,511 (10.6) | 228/2,473 (9.2) | 0.157 |
| Antiepileptic treatment, n (%) | 25 (1.6) | 26 (1.0) | 0.101 |
| Current alcohol consumption, n/N (%) | 398/1,515 (26.3) | 933/2,473 (37.7) | <0.001 |
| Former alcohol consumption, n/N (%) | 309/1,515 (20.4) | 526/2,473 (21.3) | |
| Never alcohol consumption, n/N (%) | 808/1,515 (53.3) | 1,014/2,473 (41.0) | |
| Current smoking, n/N (%) | 146/1,514 (9.6) | 339/2,475 (13.7) | <0.001 |
| Former smoking, n/N (%) | 344/1,514 (22.7) | 730/2,475 (29.5) | |
| Never smoking, n/N (%) | 1,024/1,514 (67.6) | 1,406/2,475 (56.8) |
IQR, interquartile range; SD, standard deviation. P values were calculated using Welch’s t test for age, the Mann-Whitney U test for the Carey-based index, and Pearson’s chi-square test without continuity correction for categorical variables. The p value shown for education, alcohol consumption, and smoking refers to the overall distribution. Unknown values and user-defined missing codes, including 9 or 99 in dichotomous variables, were excluded; denominators are shown when they differed from the group totals.
Table 3.
Follow-up and Kaplan-Meier survival according to reported slowing of gait and daily activities.
Table 3.
Follow-up and Kaplan-Meier survival according to reported slowing of gait and daily activities.
| Survival measure | Reported slowing (n=1,516) |
No reported slowing (n=2,478) |
Overall (n=3,994) |
|---|---|---|---|
| Deaths, n (%) | 1,355 (89.4) | 2,071 (83.6) | 3,426 (85.8) |
| Censored alive, n (%) | 161 (10.6) | 407 (16.4) | 568 (14.2) |
| Observed time to death or censoring, mean, months | 145.4 | 160.3 | 154.7 |
| Kaplan-Meier mean survival, months | 146.0 | 161.4 | 155.5 |
| Kaplan-Meier median survival, months | 140 | 158 | 151 |
| Kaplan-Meier median survival, years | 11.7 | 13.2 | 12.6 |
| Log-rank test | chi-square=32.02; p<0.001 |
The overall mean observed time to death or censoring was 154.7 months (12.9 years), and the median was 151.0 months (12.6 years). Kaplan-Meier mean survival estimates were restricted to the largest observed follow-up time (289 months). Censored participants were alive on 31 December 2017.
Table 4.
Cause-of-death distribution among deceased participants with a coded broad cause of death.
| Cause of death | Reported slowing (n=1,344) |
No reported slowing (n=2,048) |
Overall (n=3,392) |
|---|---|---|---|
| Dementia | 97 (7.2) | 167 (8.2) | 264 (7.8) |
| Cancer | 267 (19.9) | 446 (21.8) | 713 (21.0) |
| Cardiocirculatory diseases | 373 (27.8) | 556 (27.1) | 929 (27.4) |
| Cerebrovascular diseases | 126 (9.4) | 152 (7.4) | 278 (8.2) |
| Respiratory diseases | 212 (15.8) | 320 (15.6) | 532 (15.7) |
| Other causes | 269 (20.0) | 407 (19.9) | 676 (19.9) |
| Total known broad cause | 1,344 (100.0) | 2,048 (100.0) | 3,392 (100.0) |
Values are n (%), with column percentages calculated among deceased participants with a coded broad cause of death. Unknown or uncoded causes (n=34) were treated as missing and excluded. Pearson’s chi-square test without continuity correction for the six-category distribution: chi-square=6.23, df=5, p=0.284.
Table 5.
Association between reported slowing and all-cause mortality in Cox regression models.
| Model | Adjustment set | Participants | Deaths | HR (95% CI) | p value |
|---|---|---|---|---|---|
| Model 1 | Unadjusted | 3,994 | 3,426 | 1.22 (1.14-1.30) | <0.001 |
| Model 2 | Age and sex | 3,994 | 3,426 | 1.16 (1.08-1.24) | <0.001 |
| Model 3 | Age, sex, and education | 3,994 | 3,426 | 1.16 (1.08-1.24) | <0.001 |
| Model 4 | Fully adjusted complete-case model | 3,841 | 3,296 | 1.09 (1.02-1.18) | 0.017 |
HR, hazard ratio; CI, confidence interval. The fully adjusted model included age, sex, education, hypertension, prevalent tremor, prevalent Parkinson’s disease, osteoarthritis, osteoporosis, smoking status, alcohol-consumption status, depressive symptoms and/or antidepressant use, and the Carey-based comorbidity index. Education, smoking, and alcohol were modeled as categorical variables; unknown and user-defined missing codes were excluded. Model 4 was the prespecified primary complete-case model.
Table 6.
Sensitivity analyses for the association between reported slowing and all-cause mortality.
| Analysis | Participants/deaths | HR (95% CI) | p value |
|---|---|---|---|
| Primary complete-case model | 3,841 / 3,296 | 1.09 (1.02-1.18) | 0.017 |
| Excluding prevalent Parkinson’s disease | 3,775 / 3,231 | 1.09 (1.01-1.18) | 0.020 |
| Excluding prevalent dementia | 3,670 / 3,126 | 1.11 (1.03-1.20) | 0.007 |
| Excluding prevalent Parkinson’s disease or dementia | 3,615 / 3,072 | 1.11 (1.03-1.20) | 0.009 |
| Excluding deaths during first 24 months | 3,592 / 3,047 | 1.10 (1.02-1.19) | 0.016 |
| Excluding deaths during first 60 months | 3,116 / 2,571 | 1.07 (0.98-1.16) | 0.121 |
All analyses used the fully adjusted complete-case covariate set where applicable, including depressive symptoms and/or antidepressant use. Deaths occurring at or before 24 or 60 months were excluded in the corresponding analyses. HR, hazard ratio; CI, confidence interval.
Disclaimer/Publisher’s Note: The statements, opinions and data contained in all publications are solely those of the individual author(s) and contributor(s) and not of MDPI and/or the editor(s). MDPI and/or the editor(s) disclaim responsibility for any injury to people or property resulting from any ideas, methods, instructions or products referred to in the content. |
© 2026 by the authors. Licensee MDPI, Basel, Switzerland. This article is an open access article distributed under the terms and conditions of the Creative Commons Attribution (CC BY) license (http://creativecommons.org/licenses/by/4.0/).
Copyright: This open access article is published under a Creative Commons CC BY 4.0 license, which permit the free download, distribution, and reuse, provided that the author and preprint are cited in any reuse.


