

Submitted:
06 August 2026
Posted:
10 August 2026
You are already at the latest version
Abstract
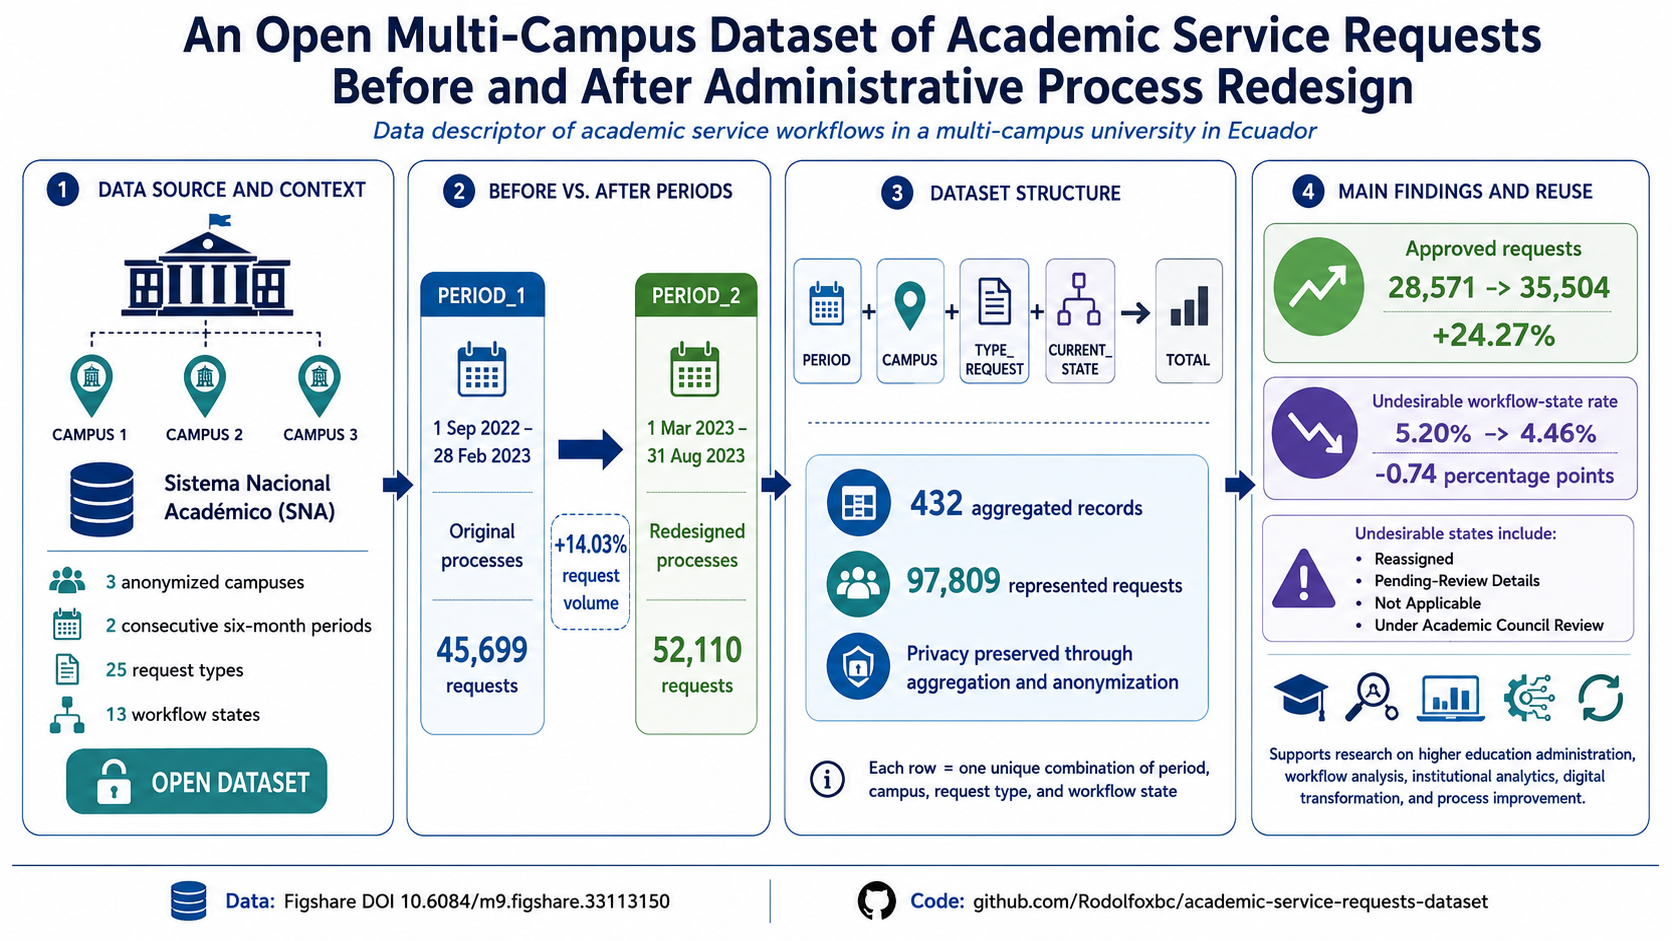
This paper presents an open, anonymized dataset of academic service requests collected before and after an administrative process redesign in a multi-campus university in Ecuador. The dataset was extracted from the Sistema Nacional Académico and covers two consecutive six-month periods: PERIOD_1, representing the original processes, and PERIOD_2, representing the redesigned processes. It contains 432 aggregated records corresponding to 97,809 requests across three anonymized campuses, 25 request types, and 13 workflow states. Each record combines period, campus, request type, current state, and the aggregated request count, while preserving privacy through aggregation and removal of identifiers. Descriptive analyses show that request volume increased by 14.03%, approved requests increased by 24.27%, and the combined rate of four institutionally defined undesirable states decreased from 5.20% to 4.46%. The dataset, documentation, and reproducible analysis code are publicly available through Figshare and GitHub, supporting research on higher education administration, workflow analysis, institutional analytics, and process improvement.
Keywords:
academic service requests
; higher education administration
; administrative process redesign
; digital transformation
1. Summary
Digital transformation has become a strategic priority for higher education institutions seeking to improve the accessibility, consistency, traceability, and responsiveness of their academic and administrative services. Universities manage a wide range of processes related to enrollment, academic records, certificates, course registration, withdrawals, degree requirements, student requests, and other institutional procedures. As these services increase in volume and complexity, fragmented or functionally oriented workflows can make it difficult to ensure homogeneous service delivery across campuses and administrative units.
Business Process Management (BPM) provides a structured approach for identifying, modeling, redesigning, implementing, and continuously improving organizational processes. Its application in higher education can support the transition from function-oriented administration toward process-oriented management, while digital tools can facilitate workflow standardization, coordination, and monitoring [1,2,3]. Recent university case studies have also shown that BPM-based redesign can support digital transition, process transparency, and measurable improvements in administrative performance [4,5,6]. Consequently, higher education institutions are increasingly adopting digital platforms, workflow automation, and BPM practices to coordinate activities, standardize procedures, and support data-informed decision-making [7,8].
The digitalization of administrative workflows also generates operational data that can provide evidence about how institutional services are used and how requests progress through predefined states. Business Process Management Systems can support and automate internal educational processes, including applications, notifications, administrative documents, and inter-organizational activities [9]. These systems generate structured records that can reveal the distribution of service demand across locations, the relative frequency of different request types, and the occurrence of workflow outcomes requiring administrative attention.
For example, a request may be reassigned when the user initially selects an incorrect procedure, remain pending when additional information is required, be declared not applicable when eligibility conditions are not satisfied, or require review by an academic council when the existing institutional regulations do not provide a direct resolution mechanism. Analyzing these states can support the identification of recurrent operational issues and provide evidence for continuous process improvement. This type of analysis is consistent with BPM approaches that use AS-IS and TO-BE representations, performance indicators, and iterative redesign to assess organizational change [4,6,10].
Research using educational data has expanded substantially during the last two decades. Educational Data Mining and Learning Analytics have provided methods for examining learner behavior, academic performance, engagement, retention, and interactions with digital learning environments [11,12,13]. Classification, clustering, association-rule mining, visualization, and predictive modeling have been applied to large volumes of data generated by learning management systems, student information systems, and online educational platforms [14,15]. However, most publicly documented educational datasets focus on teaching and learning processes, such as grades, course participation, student activity, assessment results, or dropout prediction. Comparatively less attention has been given to reusable datasets describing the administrative services through which students and other university users interact with institutional procedures.
Although several studies document the adoption or redesign of business processes in higher education, they commonly emphasize organizational models, technological implementation, process simulation, or institution-specific performance improvements [1,3,4,5,6]. The underlying operational records are not generally released as open and reusable datasets. This limits the reproducibility and comparability of analyses of university service demand, workflow outcomes, process standardization, and administrative change.
Institutional workflow data may contain sensitive or personally identifiable information, and their interpretation often depends on organization-specific processes, regulations, and information systems. As a result, these data are frequently analyzed internally and are seldom released in reusable formats. A properly anonymized and documented dataset can help address this gap without disclosing individual identities or confidential request contents.
Open research data also contribute to transparency, reproducibility, and the development of new analytical applications. The FAIR principles emphasize that research data should be findable, accessible, interoperable, and reusable [16]. In the context of higher education administration, openly sharing structured workflow data can enable researchers to reproduce descriptive analyses, test alternative statistical and machine-learning methods, develop visual analytics, compare request distributions, and explore approaches related to process mining and organizational decision support. Reusability depends not only on providing a downloadable file, but also on documenting the institutional context, data-generation process, variable semantics, aggregation criteria, validation procedures, limitations, and appropriate interpretations of the records.
This paper introduces an open dataset of academic service requests obtained from a university with campuses in three of Ecuador’s principal cities. The dataset contains records from two institutional conditions. PERIOD_1 represents the original administrative processes, whereas PERIOD_2 represents the processes after their redesign and optimization. Each record combines the period of measurement, campus, request type, current workflow state, and the aggregated number of requests associated with that combination. The dataset therefore permits comparisons of request volume and workflow-state distributions before and after the administrative process redesign, both at the institutional level and separately for each campus and request type.
The variable TYPE_REQUEST identifies the academic service requested and indirectly represents the administrative process associated with that service. The variable CURRENT_STATE indicates the state reached by the corresponding requests within the institutional workflow. Particular attention can be given to states that indicate avoidable user errors, missing information, ineligibility, or the absence of a directly applicable regulatory mechanism. Finally, TOTAL contains the aggregated number of requests for each combination of period, campus, request type, and workflow state. Because the published dataset is aggregated and does not contain names, identifiers, request descriptions, or other individual-level attributes, it supports institutional analysis while reducing privacy risks.
The dataset is relevant for several research and practical applications. It can be used to examine changes in service demand between the original and redesigned processes, compare workflow outcomes across campuses, identify request types with high frequencies of undesirable states, and study whether specific operational patterns are consistent across institutional locations. It can also support the development of dashboards, statistical comparisons, anomaly-detection procedures, clustering experiments, and reproducible educational-administration case studies. Nevertheless, the dataset should not be interpreted as a direct measurement of processing time, employee productivity, operational cost, or causal impact because it does not contain staffing levels, resource-consumption measures, timestamps for individual workflow events, or a contemporaneous control group.
Accordingly, the objective of this data descriptor is to document the construction, organization, validation, and potential reuse of an open multi-campus dataset of academic service requests collected before and after an administrative process redesign. The principal contributions of the paper are as follows:
- 1.
- the publication of an anonymized and structured dataset describing academic service requests across two process conditions, three campuses, multiple request types, and their corresponding workflow states;
- 2.
- a detailed description of the institutional context, variables, aggregation criteria, preprocessing procedures, and data-quality validation applied before publication;
- 3.
- a descriptive comparison of request volumes and workflow outcomes before and after the administrative process redesign; and
- 4.
- the identification of potential reuse scenarios for research on higher education administration, workflow analysis, process improvement, institutional analytics, and data-driven decision support.
The remainder of this data descriptor follows the structure recommended by the journal. Section 2 documents the dataset structure, temporal and institutional coverage, variables, categorical values, available formats, and recommended data-use conventions. Section 3 describes the institutional context, data source, extraction and aggregation procedures, anonymization strategy, data cleaning, technical validation, and reproducibility workflow. Section 4 provides illustrative analyses of the published data, discusses potential reuse scenarios, and identifies the limitations and interpretive precautions that should be considered when using the resource.
2. Data Description
This section describes the content, structure, coverage, variables, categories, and available files of the published dataset. The resource contains aggregated academic service-request records collected from three anonymized campuses of a higher education institution in Ecuador during two consecutive six-month periods corresponding to the original and redesigned administrative processes.
The dataset is openly available through Figshare under the persistent identifier https://doi.org/10.6084/m9.figshare.33113150. It is intended for reuse in higher education administration, institutional analytics, workflow analysis, data visualization, and exploratory data-analysis applications. The procedures used to extract, aggregate, anonymize, clean, and validate the records are described separately in Section 3.
2.1. Dataset Overview
The dataset contains 432 rows and five variables. Each row represents a unique observed combination of measurement period, campus, academic service-request type, and current workflow state. The numerical variable TOTAL indicates the number of individual requests represented by that combination.
The complete dataset accounts for 97,809 academic service requests recorded between 1 September 2022 and 31 August 2023. The records are distributed across two consecutive six-month periods, three anonymized campuses, 25 request types, and 13 workflow states.
Table 1 summarizes the principal characteristics of the resource.
The dataset contains no missing values. Each row follows the same five-variable schema, and the values of TOTAL range from 1 to 5,457 represented requests.
2.2. Dataset Schema and Unit of Observation
Table 2 provides the data dictionary for the five variables included in the dataset.
The first four variables jointly define the composite key of the dataset:
The unit of observation is an aggregated group of requests rather than an individual request or user. The first four categorical variables jointly define the composite key of the dataset:
Each composite key occurs at most once in the published file. Therefore, every row represents a unique observed combination of period, campus, request type, and workflow state. Combinations that did not occur in the source records are not represented as rows with a value of zero.
The dataset should consequently be interpreted as a sparse aggregated representation of the observed administrative activity. Researchers requiring a complete multidimensional structure may generate the Cartesian product of the categorical variables and assign zero to absent combinations, provided that this derived transformation is explicitly documented.
2.3. Temporal Coverage
The variable PERIOD contains two categorical values representing the administrative conditions included in the dataset. Their temporal coverage and institutional meaning are shown in Table 3.
Both periods span six months. The dataset contains 45,699 requests associated with PERIOD_1 and 52,110 requests associated with PERIOD_2. These values describe the coverage of the dataset. Illustrative comparisons between the two periods are presented in Section 4.
2.4. Campus Coverage
The dataset covers three campuses located in three of Ecuador’s principal cities. To reduce institutional disclosure and preserve the anonymized nature of the public resource, the actual campus names were replaced by the generic identifiers CAMPUS_0, CAMPUS_1, and CAMPUS_2.
Table 4 presents the number and proportion of requests represented by each campus.
Table 4 describes the anonymized campus categories and the total number of requests represented by each one.
The campus identifiers are nominal categories. Their numerical suffixes do not represent geographic order, campus size, institutional hierarchy, or performance ranking.
2.5. Academic Service-Request Types
The variable TYPE_REQUEST contains 25 academic and administrative service categories. Each category identifies a user-initiated procedure registered and managed through the Sistema Nacional Académico. The complete list is provided in Table 5.
The categories differ in purpose, procedural complexity, eligibility conditions, supporting documentation, and institutional decision authority. The dataset does not include the internal sequence of tasks associated with each request type. Therefore, TYPE_REQUEST identifies the process category but does not provide an event log of the complete workflow.
Researchers may group request types into broader analytical families, such as enrollment, academic mobility, graduation, equivalency, language proficiency, financial support, or student welfare. Any such grouping is a derived classification and is not included as an original variable in the published dataset.
2.6. Workflow-State Categories
The variable CURRENT_STATE contains 13 categories describing the workflow state assigned to each aggregated group of requests at the time represented by the source-system extraction. Table 6 lists the categories and their operational meanings.
Table 6 lists the workflow states and provides a general operational description.
The workflow states do not necessarily represent a single universal ordinal sequence. Different request types can follow different routes, and some states apply only to particular procedures. Consequently, CURRENT_STATE should normally be treated as a nominal categorical variable rather than as an ordered scale.
Four states were identified by institutional process specialists as undesirable or requiring particular attention:
This classification is based on the institutional meaning of the states rather than on a general workflow standard. The original dataset preserves the individual state labels and does not include a separate binary variable for undesirable outcomes. Such a variable can be derived during analysis using the definition provided in Equation (3).
2.7. Aggregated Frequency Variable
The variable TOTAL contains the aggregated frequency represented by each row. It is a positive integer and should be interpreted as a statistical weight or request count, not as a duration, number of workflow steps, resource measure, or indicator of process complexity.
For a given row i:
Consequently, counting dataset rows does not yield the number of academic service requests. Request volumes must be calculated by summing TOTAL. For example, the total number of represented requests in period p is:
The same weighted aggregation can be performed by campus, request type, workflow state, or any combination of those dimensions.
2.8. Files, Formats, and Repository Organization
The dataset is publicly available through Figshare in comma-separated values (CSV) and Microsoft Excel (XLSX) formats. The CSV file is considered the canonical machine-readable version because it is non-proprietary and can be imported directly into statistical, programming, database, and visualization environments. The XLSX file is provided as a complementary format for spreadsheet users.
The Figshare record contains four files:
academic_service_requests.csv
processDataset.xlsx
data_dictionary.csv
README.md
The file academic_service_requests.csv contains the canonical anonymized dataset. The file processDataset.xlsx provides the same records in spreadsheet format. The file data_dictionary.csv documents the variable names, data types, allowed categories, numerical ranges, missing-value conventions, units, descriptions, and example values. The file README.md describes the institutional and temporal context, aggregation criteria, anonymization procedure, workflow-state definitions, limitations, and recommended conditions of reuse.
The complete reproducible computational workflow is maintained in the associated GitHub repository: https://github.com/Rodolfoxbc/academic-service-requests-dataset. The repository contains the dataset files, validation and analysis scripts, software dependencies, generated tables, figure-generation procedures, and the directory structure required to reproduce the illustrative analyses reported in Section 4.
3. Methods
This section describes the institutional context, study design, data source, extraction and aggregation procedures, anonymization strategy, data cleaning, technical validation, and reproducibility workflow used to construct the published dataset. The aim is to provide sufficient methodological detail for understanding how the resource was generated and for reproducing the validation and illustrative analyses.
3.1. Institutional Context and Study Design
The dataset was generated within a higher education institution operating across three campuses located in three of Ecuador’s principal cities. The institution manages multiple academic and administrative service requests through the Sistema Nacional Académico (SNA). Each request type corresponds to a particular institutional procedure and progresses through one or more workflow states.
The institution implemented an administrative process-redesign initiative intended to standardize and optimize the management of academic service requests. The study therefore follows a retrospective before-and-after observational design based on two consecutive process conditions:
- PERIOD_1, covering 1 September 2022 to 28 February 2023, represents the original administrative processes before redesign; and
- PERIOD_2, covering 1 March 2023 to 31 August 2023, represents the redesigned administrative processes.
Each observation period spans six months. This temporal equivalence permits direct comparison of absolute and relative request frequencies without normalization for observation duration. However, the periods correspond to different portions of the academic year and may therefore be affected by enrollment cycles, graduation procedures, payment schedules, institutional policies, or seasonal service demand.
The design is observational rather than experimental. No control campus, parallel unchanged process, or contemporaneous control institution was available. Accordingly, the published data support descriptive and comparative analyses, but observed differences cannot be attributed exclusively to the administrative process redesign.
3.2. Data Source and Extraction
The original operational records were obtained from the Sistema Nacional Académico (SNA), the institutional platform used by the university to register and manage academic service requests. The source system records the campus associated with each request, the type of procedure selected by the user, and the workflow state represented in the institutional system.
The extraction covered the continuous 12-month interval from 1 September 2022 to 31 August 2023. The records were assigned to the two six-month process conditions described in Section 2.3.
Only the attributes required to construct the open dataset were retained. Personal identifiers, user names, email addresses, student codes, free-text request descriptions, comments, attachments, supporting documents, and request-level event histories were excluded before publication.
The extracted data were therefore converted from individual operational records into an aggregated representation. The published file does not contain one row per user or one row per individual request.
3.3. Aggregation Procedure
The source records were grouped according to period, campus, request type, and current workflow state. The aggregation unit was defined as:
where denotes the measurement period, the campus, the request type, and the current workflow state.
For each unique combination, the number of original requests was counted. The value stored in TOTAL was calculated as:
where N is the number of individual requests in the source system and is an indicator function equal to 1 when request j belongs to the specified combination and 0 otherwise.
The procedure produced one row for each observed combination. Combinations that did not occur in the source records were not represented as rows with zero frequencies. The resulting aggregated file contained 432 unique rows representing 97,809 individual academic service requests.
3.4. Workflow-State Classification for the Illustrative Analysis
For the illustrative analyses, four workflow states were classified by institutional process specialists as undesirable or requiring particular administrative attention:
The operational meanings of these states are documented in Section 2.6. For analytical purposes, the following indicator was derived:
The total number of requests assigned to undesirable states in period p was calculated as:
Because total request volume differed between periods, a normalized undesirable-state rate was also calculated:
The same calculation was applied separately by campus. This classification reflects the institutional meaning of the workflow states and should not be interpreted as a universal taxonomy for higher education processes.
3.5. Data Anonymization and Privacy Protection
The dataset was prepared according to a data-minimization strategy. Only the variables required to describe the administrative workflows and their aggregated frequencies were retained. No direct personal identifiers are included.
The anonymization procedure comprised the following measures:
- 1.
- removal of all individual identifiers and free-text content;
- 2.
- exclusion of request-level timestamps, comments, attachments, and supporting documents;
- 3.
- replacement of actual campus names with generic labels;
- 4.
- aggregation of the original temporal records into two six-month observation periods labeled PERIOD_1 and PERIOD_2; and
- 5.
- aggregation of individual requests into grouped frequency counts.
As a result, each row describes a group of requests rather than a specific individual or transaction. The published data cannot be used to reconstruct the sequence of events followed by an individual request, identify a user, or determine the identity of an employee responsible for processing a case.
The anonymization process improves privacy protection but also limits the analyses that can be performed. In particular, the dataset cannot support request-level duration analysis, user-trajectory reconstruction, sequence mining, or conformance checking based on individual event logs.
3.6. Data Cleaning and Standardization
Before publication, the extracted data were reviewed to ensure consistent formatting, valid categorical representation, and numerical integrity. The preparation procedure included:
- 1.
- selecting the five variables included in the public dataset;
- 2.
- verifying that every row contained valid values for period, campus, request type, workflow state, and total frequency;
- 3.
- standardizing period and campus labels;
- 4.
- checking the spelling and capitalization of request-type and workflow-state categories;
- 5.
- converting TOTAL to an integer-valued variable;
- 6.
- checking for negative and zero frequency values;
- 7.
- identifying missing values; and
- 8.
- checking the uniqueness of the composite key formed by PERIOD, CAMPUS, TYPE_REQUEST, and CURRENT_STATE.
No imputation was required because the final dataset contains no missing values. No negative or zero values were detected in TOTAL. Each of the 432 rows contains a unique combination of the four categorical dimensions, and no duplicate composite keys were identified.
The request-type and workflow-state labels were retained in descriptive form to improve human readability. Researchers may encode these variables for statistical or machine-learning applications, but any numerical coding should be treated as nominal unless a meaningful ordering is explicitly defined and justified.
3.7. Technical Validation
Technical validation was performed at the structural, categorical, numerical, and aggregation levels. Structural validation confirmed that the dataset contained the expected five columns and that all rows followed the same schema. Categorical validation confirmed the presence of two periods, three campuses, 25 request types, and 13 workflow states. Numerical validation confirmed that TOTAL was stored as a positive integer.
Table 7 summarizes the validation results.
The numerical totals were additionally aggregated by period, campus, request type, and workflow state to verify that the dataset could be consistently reconstructed from its composite dimensions. These checks assess the internal consistency of the published file; they do not independently validate the accuracy of every transaction originally entered into the institutional system.
3.8. Reproducibility Workflow
The anonymized dataset, data dictionary, and supporting documentation are available through Figshare under the persistent identifier https://doi.org/10.6084/m9.figshare.33113150. The validation scripts, analysis code, software dependencies, and figure-generation workflow are available in the associated GitHub repository: https://github.com/Rodolfoxbc/academic-service-requests-dataset.
The computational workflow includes:
- 1.
- dataset importation and schema validation;
- 2.
- calculation of request volumes by period and campus;
- 3.
- calculation of absolute and relative workflow-state frequencies;
- 4.
- derivation of the four institutionally defined undesirable states;
- 5.
- comparison of request-type distributions between periods; and
- 6.
- generation of the tables and figures presented in the illustrative analysis.
The publication of the data, documentation, and source code supports the principles of findability, accessibility, interoperability, and reusability [16]. Researchers reusing the dataset should preserve the distinction between aggregated request counts and individual-level records.
4. User Notes
This section provides practical guidance for reusing the dataset and presents an illustrative descriptive analysis generated with the publicly available computational workflow. The purpose of the analysis is to demonstrate how the aggregated records can be examined by period, campus, request type, and workflow state. The results should not be interpreted as causal estimates of the effect of the administrative process redesign.
All calculations use TOTAL as the frequency variable. Therefore, the illustrative results refer to the 97,809 individual requests represented by the 432 aggregated rows rather than to the number of rows in the published file.
4.1. Recommended Data-Use Conventions
To avoid incorrect interpretations, users of the dataset should observe the following conventions:
- 1.
- TOTAL must be used as the frequency variable when calculating request volumes;
- 2.
- absent categorical combinations should not automatically be treated as missing data, because the dataset contains only observed combinations;
- 3.
- period and campus labels should be treated as nominal identifiers;
- 4.
- comparisons between PERIOD_1 and PERIOD_2 should consider possible academic-calendar and seasonal differences;
- 5.
- workflow states should not be assumed to form a common linear sequence across all request types;
- 6.
- the four undesirable states should be analyzed both individually and as an aggregated derived category; and
- 7.
- the dataset should not be used to infer individual user behavior, employee productivity, processing duration, or causal effectiveness of the redesign.
Subject to these considerations, the dataset can support descriptive statistics, contingency-table analyses, comparisons of proportions, data visualization, workflow-outcome profiling, campus comparisons, request-type segmentation, anomaly detection, and exploratory machine-learning applications.
4.2. Illustrative Analysis of the Dataset
The following descriptive analysis demonstrates one possible use of the published dataset and its accompanying computational workflow. It compares request volumes and workflow-state distributions across the two observation periods and three anonymized campuses. The analysis is illustrative rather than exhaustive, and alternative statistical, visual, and computational approaches may be applied by future users.
4.2.1. Overall Request Volume
The dataset contains 45,699 requests in PERIOD_1 and 52,110 requests in PERIOD_2. The absolute increase between the two consecutive six-month periods was 6,411 requests, corresponding to a 14.03% increase over the volume recorded during the original administrative processes.
Table 8 presents the total request volume and the absolute and relative differences between periods.
Figure 1 shows the total number of requests in each period.
Because both observation periods span six months, the totals can be compared directly without adjusting for differences in observation duration.
4.2.2. Request Volume by Campus
Request volume increased at all three anonymized campuses. The largest absolute increase occurred at CAMPUS_0, where the number of requests rose from 14,875 to 20,008. This represents an increase of 5,133 requests, or 34.51%.
At CAMPUS_1, the number of requests increased from 11,090 to 11,463, an absolute difference of 373 requests and a relative increase of 3.36%. At CAMPUS_2, request volume increased from 19,734 to 20,639, corresponding to 905 additional requests and an increase of 4.59%.
Table 9 presents the results by campus.
Figure 2 illustrates the distribution of requests across campuses and periods.
4.2.3. Distribution by Request Type
The distribution of requests was concentrated in a limited number of service categories. The most frequent category in both periods was General Request, with 20,295 requests in PERIOD_1 and 22,859 in PERIOD_2. This category accounted for 43,154 requests across the complete dataset.
The second most frequent category was Authorization Request for Pre-Professional Practice Enrollment, with 9,305 requests in PERIOD_1 and 8,639 in PERIOD_2. Together, the two most frequent categories represented 61,098 requests, or 62.47% of the complete dataset.
Table 10 presents the ten request types with the largest accumulated volume across both periods.
Among the ten most frequent request types, the largest relative increases were observed for Thesis Presentation Request for Undergraduate Level (96.49%), Request for Registration of the Thesis Degree Option for Undergraduate Level (92.55%), and Request for Payment Extension (69.93%).
In contrast, the number of Authorization Requests for Pre-Professional Practice Enrollment decreased by 7.16%, while Equivalency Requests by Content Comparison for Undergraduate Level decreased by 9.48%.
Figure 3 compares the ten request types with the largest total frequencies.
4.2.4. Workflow-State Distribution
Table 11 reports the distribution of the 13 workflow states in both periods.
The most frequent workflow state in both periods was Approved. Its frequency increased from 28,571 to 35,504 requests, an absolute increase of 6,933 requests and a relative increase of 24.27%.
The proportion of requests in the Approved state increased from 62.52% of all requests in PERIOD_1 to 68.13% in PERIOD_2. The Denied state increased in absolute terms from 8,104 to 8,742 requests, although its share of the total decreased from 17.73% to 16.78%.
The number of records in the Processed Request state decreased from 6,028 to 4,809, corresponding to an absolute reduction of 1,219 requests and a relative reduction of 20.22%.
4.2.5. Undesirable Workflow States
The four institutionally defined undesirable workflow states were Reassigned, Pending-Review Details, Not Applicable, and Under Academic Council Review.
The combined number of requests assigned to these states decreased from 2,377 in PERIOD_1 to 2,324 in PERIOD_2. The absolute reduction was 53 requests.
Because the overall request volume increased between periods, the undesirable workflow-state rate provides a normalized comparison. This rate decreased from 5.20% in PERIOD_1 to 4.46% in PERIOD_2, corresponding to a reduction of 0.74 percentage points. Relative to the initial rate, this represents a 14.26% reduction.
Table 12 summarizes the combined results.
Figure 4 shows the undesirable-state rate in each period.
The results for the individual undesirable states are presented in Table 13.
The two most frequent undesirable states decreased in absolute terms. Reassigned declined by 44 requests, while Pending-Review Details declined by 24 requests.
In contrast, Not Applicable increased from 27 to 32 requests, and Under Academic Council Review increased from 22 to 32 requests. Despite their relative increases, these two states jointly represented fewer than 0.13% of all requests in either period.
Figure 5 presents the individual counts of the four undesirable states.
4.2.6. Undesirable Workflow States by Campus
Table 14 reports the undesirable-state frequencies and rates separately for each campus and period.
The undesirable-state rate decreased at CAMPUS_0 from 5.34% to 4.28%, a reduction of 1.07 percentage points. At CAMPUS_1, the rate decreased from 6.77% to 4.75%, corresponding to a reduction of 2.02 percentage points.
At CAMPUS_2, the undesirable-state rate increased slightly from 4.21% to 4.47%, an increase of 0.26 percentage points. Thus, the aggregate reduction observed at the institutional level was not uniform across the three campuses.
Figure 6 displays the undesirable-state rates by campus and period.
Overall, the illustrative analysis shows how the published resource can be used to compare request volume, request-type concentration, workflow outcomes, and campus-level variation. The institutional interpretation and limitations of these patterns are discussed in Section 4.3 and Section 4.5.
4.3. Interpretive Considerations
The illustrative analysis demonstrates the analytical value of the dataset for examining academic service demand and workflow outcomes in a multi-campus higher education institution. The resource permits comparisons across two consecutive six-month periods, three campuses, 25 request types, and 13 workflow states using a consistent aggregated structure.
The principal descriptive pattern is that the number of academic service requests increased from 45,699 in PERIOD_1 to 52,110 in PERIOD_2. At the same time, the proportion of requests assigned to the four institutionally defined undesirable workflow states decreased from 5.20% to 4.46%.
Taken together, these observations indicate that the redesigned-process period was associated with a higher volume of recorded requests and a lower relative frequency of several workflow conditions requiring corrective or additional administrative action. However, the dataset does not include staffing levels, working hours, operating costs, processing times, or service-capacity measures. Therefore, the observed increase should not be interpreted as a direct quantitative measurement of productivity or operational efficiency.
4.3.1. Request Volume
The increase in total request volume may be consistent with improved accessibility, greater adoption of the institutional platform, reduced procedural barriers, or an increased capacity to register and manage academic services. Digital workflow redesign can facilitate the standardization and traceability of administrative procedures by providing centralized access to services and reducing dependence on informal or campus-specific channels.
Nevertheless, request volume is an ambiguous indicator. A higher number of recorded requests does not necessarily imply that underlying institutional demand increased by the same proportion. It may also reflect changes in how requests were registered, migration from other communication channels, improved visibility of available services, or differences in the academic activities conducted during each period.
The periods cover different portions of the academic year. PERIOD_1 extends from September to February, whereas PERIOD_2 extends from March to August. Enrollment, graduation, withdrawal, payment, internship, and other procedures may not be uniformly distributed throughout the year. Consequently, the 14.03% increase represents a descriptive difference between the observed periods rather than an estimate of the isolated effect of the redesign.
Using periods of equal duration nevertheless avoids one important source of bias: the observed difference does not result from one condition containing more months than the other.
4.3.2. Campus-Level Differences
Request volume increased at all three campuses, but the magnitude varied substantially. CAMPUS_0 registered the largest increase, whereas the changes at CAMPUS_1 and CAMPUS_2 were comparatively smaller.
This variation suggests that the institutional change was not reflected uniformly across locations. Differences may be associated with student population size, academic offerings, local administrative practices, adoption of the redesigned services, communication strategies, or pre-existing levels of digitalization. The anonymized dataset does not contain the contextual variables required to determine which explanation is most plausible.
Campus-level undesirable-state rates also followed heterogeneous patterns. The rate decreased at CAMPUS_0 and CAMPUS_1, while it increased slightly at CAMPUS_2. This demonstrates the value of retaining the campus dimension because institutional averages can conceal local differences.
4.3.3. Request-Type Distribution
Service demand was highly concentrated. General Request and Authorization Request for Pre-Professional Practice Enrollment represented 62.47% of all requests.
This concentration has implications for reuse. Analytical methods applied to the complete dataset may be strongly influenced by the most frequent categories. Researchers interested in less frequent procedures may need to analyze request types separately, use relative frequencies, or apply weighting and stratification strategies.
The high volume of General Request records may indicate that this category functions as a broad entry point for administrative needs not represented by specialized procedures. Although such a category can improve accessibility, it may reduce the ability to determine the specific service initially required by the user. The dataset does not include the free-text content needed to disaggregate these requests.
Changes between periods were not uniform across service categories. Some request types almost doubled, whereas others decreased. The overall increase should therefore be understood as the combined result of different category-specific trajectories.
4.3.4. Workflow-State Outcomes
The Approved state increased both in absolute and relative terms. By contrast, the number of denied requests increased in absolute terms, although its proportion of the total decreased. These results demonstrate why absolute frequencies and normalized proportions should be reported together.
The reduction in Processed Request should be interpreted cautiously. The dataset contains Approved, Processed Request, and Processed / Closed as distinct states, but it does not include a complete transition model explaining their procedural relationships. Different request types may use different intermediate and final states.
Consequently, the reduction in Processed Request cannot be assumed to represent a decrease in completed services. It may reflect changes in workflow configuration, state naming, or the route through which requests were closed following the redesign.
The variable CURRENT_STATE should therefore be treated as a nominal operational attribute rather than as a universally ordered measure of process completion.
4.3.5. Undesirable Workflow States
The combined undesirable-state rate decreased even though total request volume increased. The largest components of this derived indicator were Reassigned and Pending-Review Details, both of which decreased in absolute terms.
The reduction in reassigned requests may be consistent with improved identification or presentation of the available procedures. Similarly, the reduction in requests pending additional details may be consistent with clearer instructions, improved form design, or better validation of required information.
These explanations remain hypotheses because the dataset does not contain interface characteristics, form revisions, instructions, error messages, or specific reasons for reassignment and pending review. The data identify where changes occurred but do not establish their causes.
The increases in Not Applicable and Under Academic Council Review also deserve attention. Although both states remained infrequent, they represent distinct operational issues. The first may indicate that users initiated procedures without satisfying eligibility conditions, while the second may identify areas in which institutional regulations or decision criteria require clarification.
The aggregated undesirable-state rate is useful as a summary measure, but the four components should also be analyzed separately.
4.4. Dataset Value and Reuse Scenarios
The principal contribution of this work is the publication of a structured and anonymized dataset describing administrative service activity within a real multi-campus higher education institution.
Most educational datasets used in Educational Data Mining and Learning Analytics emphasize student performance, participation, assessment, or digital learning behavior [11,12,13]. The present resource complements these datasets by focusing on the administrative services through which university users interact with institutional procedures.
The dataset also illustrates how operational higher education data can be shared while reducing privacy risks. Aggregation by period, campus, request type, and workflow state removes direct identifiers and prevents the reconstruction of personal request trajectories while retaining sufficient structure for comparative and exploratory analyses.
The publication of the dataset and data dictionary in Figshare, together with the validation and figure-generation code available through GitHub, supports the FAIR principles by improving the findability, accessibility, interoperability, and reusability of the resource [16]. The persistent Figshare DOI enables formal citation and version-controlled access to the dataset.
Researchers can reproduce the illustrative comparisons presented in this paper or develop alternative visualizations of request volume, workflow-state distribution, and campus-level variation. Contingency tables and proportion tests may be used to examine associations among period, campus, request type, and workflow state.
Request types may also be grouped into broader service domains, including graduation, enrollment, equivalencies, language requirements, financial procedures, and student welfare. Such groupings would constitute derived classifications rather than original dataset variables and should therefore be documented by the reuser.
The resource may support exploratory clustering, correspondence analysis, association-rule mining, anomaly detection, and dimensionality-reduction applications [14,15]. In such cases, TOTAL should be used as a frequency or analytical weight, and the imbalance among request types should be considered.
Another reuse scenario is the construction of institutional dashboards. Potential indicators include request volume, period-to-period change, approval rates, undesirable-state rates, campus comparisons, and request-type concentration.
The dataset may additionally serve as a reference structure for institutions interested in publishing comparable administrative information. Although workflow states and request types differ among universities, the general schema of period, location, service type, state, and frequency can be adapted to other organizational contexts.
4.5. Limitations
Several limitations must be considered when reusing or interpreting the dataset.
First, the study uses a retrospective before-and-after observational design. There is no control institution, control campus, or parallel workflow that remained unchanged during the same period. Consequently, the results cannot establish that the redesign caused the observed differences.
Second, the two six-month periods correspond to different portions of the academic year. Seasonal demand, enrollment schedules, graduation cycles, payment dates, institutional policies, and changes in the student population may have affected the distribution of requests.
Third, the dataset contains aggregated frequencies rather than request-level records. It cannot be used to calculate processing times, waiting times, repeated requests by the same user, state-transition sequences, or individual service trajectories.
Fourth, the dataset does not include staffing, resource allocation, employee workload, operating costs, or infrastructure measures. It therefore cannot independently demonstrate that the institution processed more requests using the same resources.
Fifth, CURRENT_STATE captures the state represented in the source extraction but does not provide a complete event history. Some states may be intermediate, final, or applicable only to particular request types. Their interpretation requires knowledge of the corresponding institutional workflows.
Sixth, campus anonymization limits the possibility of associating observed patterns with campus characteristics such as enrollment, program portfolio, staff size, or geographic context. This restriction reduces institutional disclosure but limits explanatory analysis.
Seventh, General Request represents a large proportion of the data. Without request-level text, it is not possible to determine whether these requests could be assigned to more specific service categories.
Finally, the classification of four states as undesirable reflects their institutional interpretation and should not be assumed to apply universally. Researchers adapting the analysis to another context should define undesirable outcomes according to the operational meaning of their own processes.
Despite these limitations, the dataset provides an uncommon open view of administrative service activity in higher education. Its documented structure, cross-campus coverage, before-and-after organization, and reproducible workflow make it suitable for descriptive research, methodological experimentation, education, and comparative dataset development.
4.6. Concluding Guidance and Future Extensions
The dataset can be reused for descriptive statistics, campus comparisons, workflow-state profiling, request-type analysis, contingency tables, data visualization, dashboard development, anomaly detection, and exploratory machine-learning applications. The accompanying validation and analysis scripts provide a reproducible starting point for these uses.
The descriptive differences reported in this section should not be interpreted as causal estimates of the effect of the administrative redesign. Reusers should account for the aggregated nature of the records, differences in the academic calendar, the absence of a control group, and the lack of processing times, staffing measures, and individual event histories.
Future extensions could incorporate additional observation periods, new campuses, more detailed process metadata, and contextual institutional variables. Subject to appropriate privacy safeguards, request-level timestamps and anonymized event histories could support analyses of processing duration, state transitions, bottlenecks, and conformance with administrative workflow models.
Information about staffing, resource allocation, service-level targets, operating costs, and user satisfaction would also permit more comprehensive evaluations of administrative performance.
The dataset and data dictionary are openly available through Figshare under the persistent identifier https://doi.org/10.6084/m9.figshare.33113150. The validation scripts, analysis code, software dependencies, and figure-generation workflow are publicly available in the associated GitHub repository: https://github.com/Rodolfoxbc/academic-service-requests-dataset.
Author Contributions
Conceptualization, R.B. and A.P.; methodology, R.B., A.P. and P.M.; software, R.B. and P.M.; validation, R.B., A.P., P.M. and F.M.; formal analysis, R.B.; investigation, R.B., A.P. and P.M.; resources, A.P. and F.M.; data curation, R.B. and P.M.; writing—original draft preparation, R.B.; writing—review and editing, R.B., A.P., P.M. and F.M.; visualization, R.B. and P.M.; supervision, R.B. and F.M.; project administration, R.B.; funding acquisition, F.M. All authors have read and agreed to the published version of the manuscript.
Funding
This research received no external funding.
Institutional Review Board Statement
Not applicable.
Informed Consent Statement
Not applicable.
Data Availability Statement
The anonymized dataset supporting the findings of this study is openly available in Figshare at https://doi.org/10.6084/m9.figshare.33113150. The Figshare record includes the dataset files, data dictionary, and supporting documentation. The source code used to validate the dataset and reproduce the descriptive analyses, tables, and figures is publicly available in the associated GitHub repository: https://github.com/Rodolfoxbc/academic-service-requests-dataset.
Conflicts of Interest
“The authors declare no conflicts of interest”.
Abbreviations
The following abbreviations are used in this manuscript:
| SNA | Sistema Nacional Académico |
| FAIR | Findable, Accessible, Interoperable, and Reusable |
| CSV | Comma-Separated Values |
| XLSX | Microsoft Excel Open XML Spreadsheet |
| DOI | Digital Object Identifier |
References
- Abaev, A.; Maslevich, T.; Safronova, N. Issues of implementatiom of process management in practice of higher educational institutions of textile industry. Izv. Vyss. Uchebnykh Zaved. Seriya Teknol. Tekst. Promyshlennosti 2019, 380, 213–217. [Google Scholar]
- Petkovics, I.; Tumbas, P.; Matković, P.; Baracskai, Z. Cloud computing support to university business processes in external collaboration. Acta Polytech. Hung. 2014, 11, 181–200. [Google Scholar] [CrossRef]
- Siciński, J.M.; Sliż, P.; Antonowicz, P.; Delińska, L. Implementation of BPM at a Public University in Poland: The Significance of Custom IT Tools. Public Organ. Rev. 2026. [Google Scholar] [CrossRef]
- Ammirato, S.; Cutrì, L.; Felicetti, A.M.; Di Maio, F. Business process management and digital transition. The case study of an Italian Public University. Transform. Gov. People Process Policy 2024, 18, 825–855. [Google Scholar] [CrossRef]
- Arana, M.; Arana, M.; Camborda, M. Business Process Model for University Management based on ISO 21000:2018 standard. Proceedings - 8th International Symposium on Accreditation of Engineering and Computing Education, ICACIT 2022; 2022. [Google Scholar] [CrossRef]
- Renna, P.; Colonnese, C. A Simulation-Driven Business Process Reengineering Framework for Teaching Assignment Optimization in Higher Education—A Case Study of the University of Basilicata. Appl. Sci. 2025, 15. [Google Scholar] [CrossRef]
- Souli, S.P.; Pierrakeas, C. Contemporary Trends in University Administration with the Integration of Digital/New Technologies. Adm. Sci. 2025, 15, 437. [Google Scholar] [CrossRef]
- Velásquez-Angamarca, V.; Arce-Cuesta, D.; Oyola-Flores, C.; García-Pesántez, A.; Pesántez-Avilés, F.; Cárdenas-Tapia, J. A Formal Document Approval Workflow for Business Process in Higher Education Institutions. In Proceedings of the 19th Iberian Conference on Information Systems and Technologies, CISTI 2024 Cham; Rocha, Á., Peñalvo, García, Gonçalves, F.J., García-Holgado, R., Moreira, A.F., Eds.; Lecture Notes in Networks and Systems ; 2026; Vol. 1747, pp. 74–83. [Google Scholar] [CrossRef]
- Trąbka, J.; Grabowski, M. Supporting the Management of Educational Institutions Using Blockchain. Supporting Higher Education 4.0 with Blockchain: Critical Analyses of Automation, Data, Digital Currency, and Other Disruptive Applications 2023, 62–93. [Google Scholar] [CrossRef]
- Lo, S.M.S.; Chang, Y.M. Utilizing Business Process Management (BPM) for Performance Improvement: A Case Study of an Express Company in Taiwan. NTU Manag. Rev. 2025, 35, 55–88. [Google Scholar] [CrossRef]
- Romero, C.; Ventura, S. Educational data mining and learning analytics: An updated survey. Wiley Interdiscip. Rev. Data Min. Knowl. Discov. 2020, 10, e1355. [Google Scholar] [CrossRef]
- Calvet Liñán, L.; Juan Pérez, Á.A. Educational Data Mining and Learning Analytics: Differences, Similarities, and Time Evolution. Int. J. Educ. Technol. High. Educ. 2015, 12, 98–112. [Google Scholar] [CrossRef]
- Dutt, A.; Ismail, M.A.; Herawan, T. A Systematic Review on Educational Data Mining. IEEE Access 2017, 5, 15991–16005. [Google Scholar] [CrossRef]
- Han, J.; Kamber, M.; Pei, J. Data Mining: Concepts and Techniques, 3rd ed.; Elsevier: Amsterdam, 2011. [Google Scholar]
- Jain, A.K. Data Clustering: 50 Years Beyond K-Means. Pattern Recognit. Lett. 2010, 31, 651–666. [Google Scholar] [CrossRef]
- Wilkinson, M.D.; Dumontier, M.; Aalbersberg, I.J.; Appleton, G.; Axton, M.; Baak, A.; Blomberg, N.; Boiten, J.W.; da Silva Santos, L.B.; Bourne, P.E.; et al. The FAIR Guiding Principles for Scientific Data Management and Stewardship. Sci. Data 2016, 3, 160018. [Google Scholar] [CrossRef] [PubMed]
Figure 1.
Total number of academic service requests in the original and redesigned process periods.
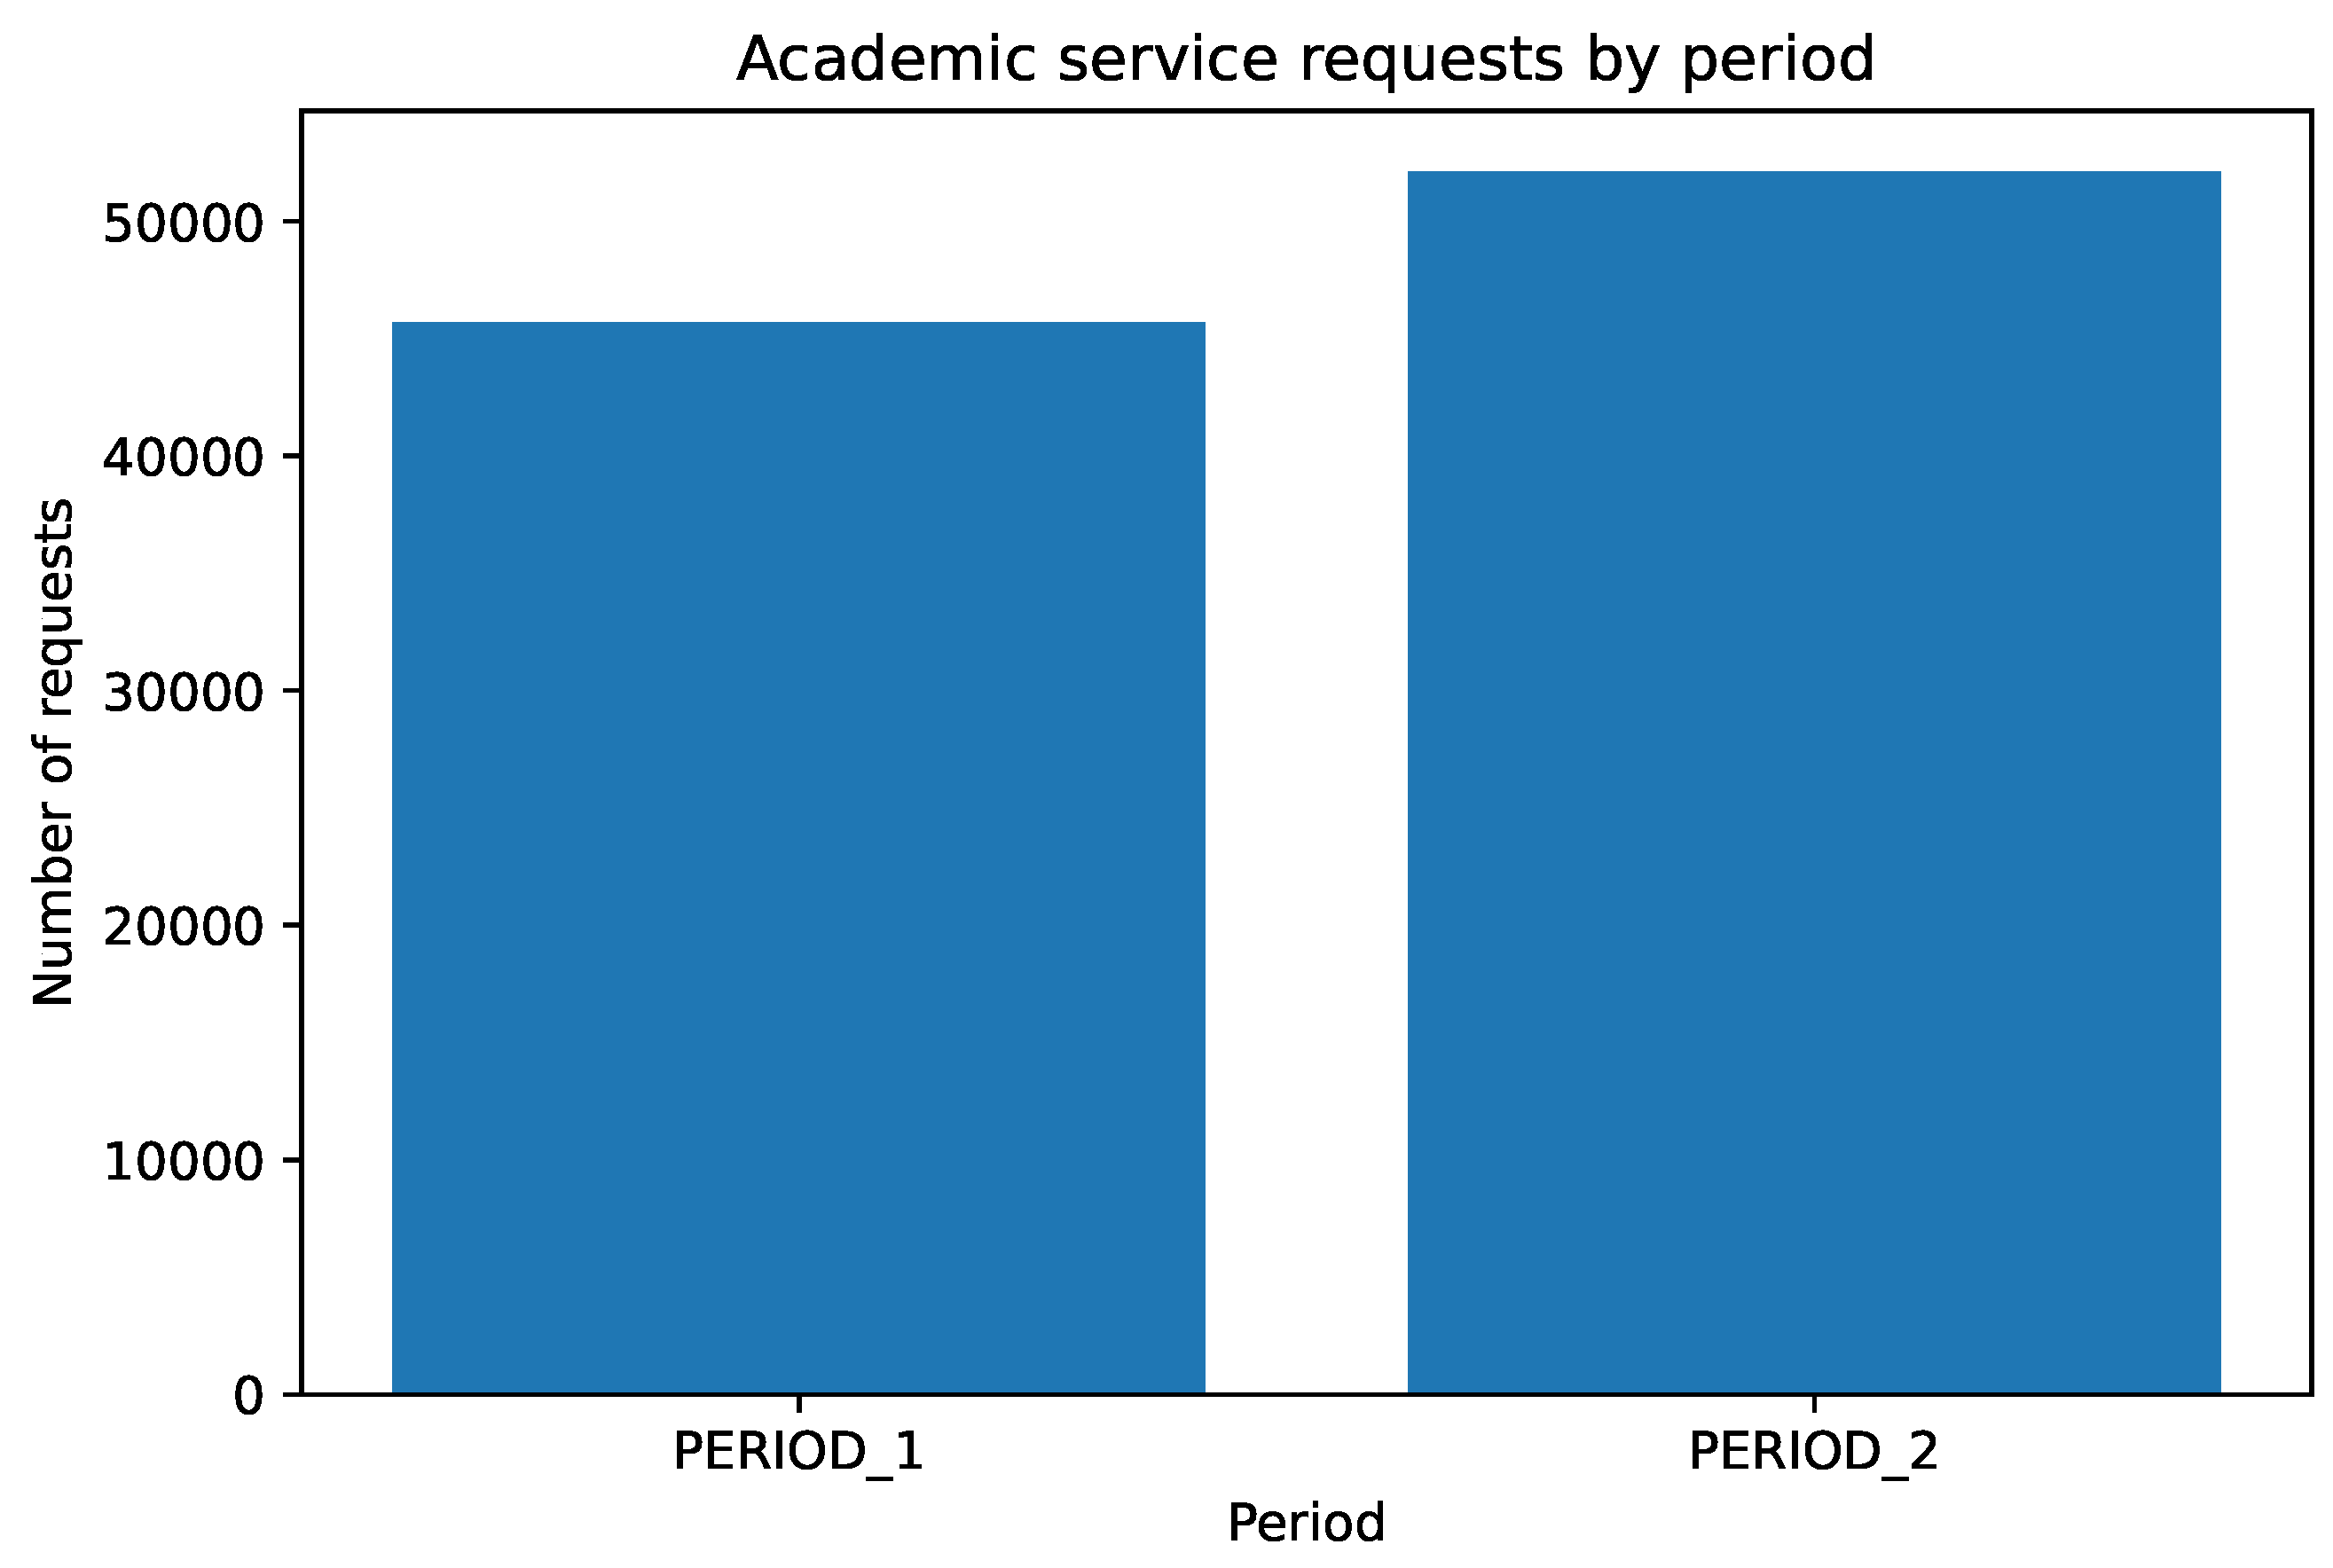
Figure 2.
Academic service-request volume by campus and period.
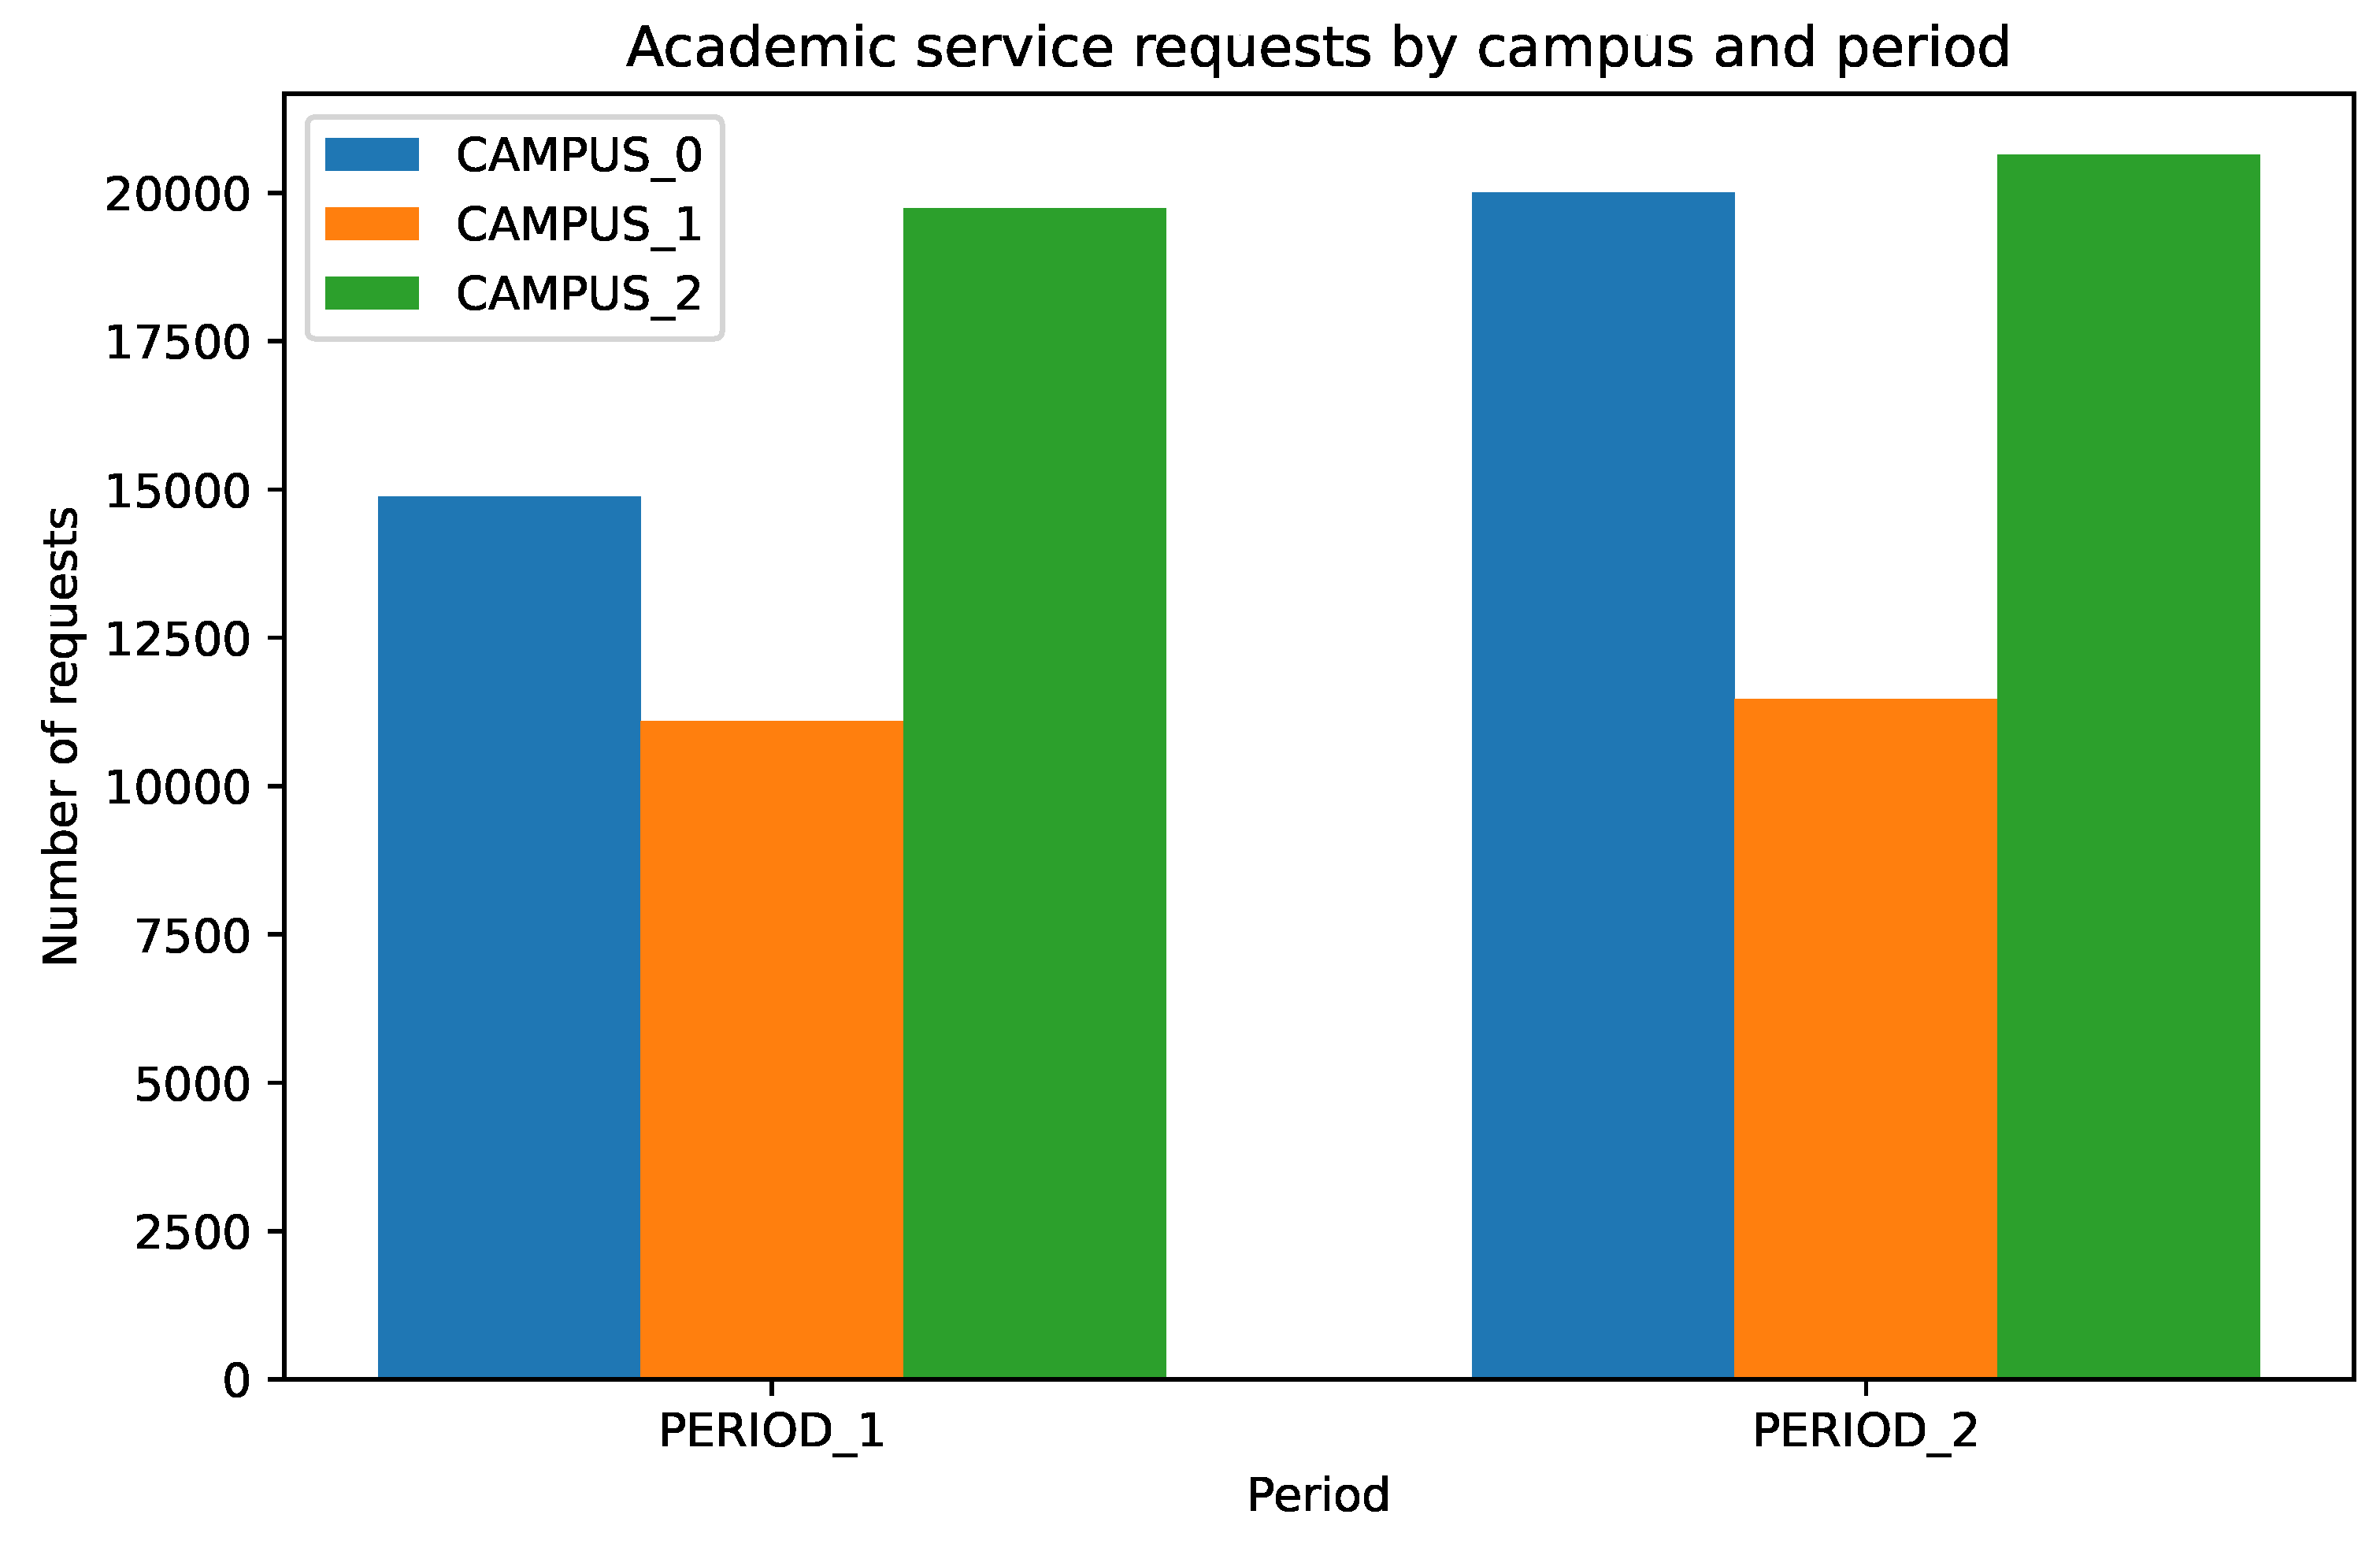
Figure 3.
Ten most frequent academic service-request types in PERIOD_1 and PERIOD_2.
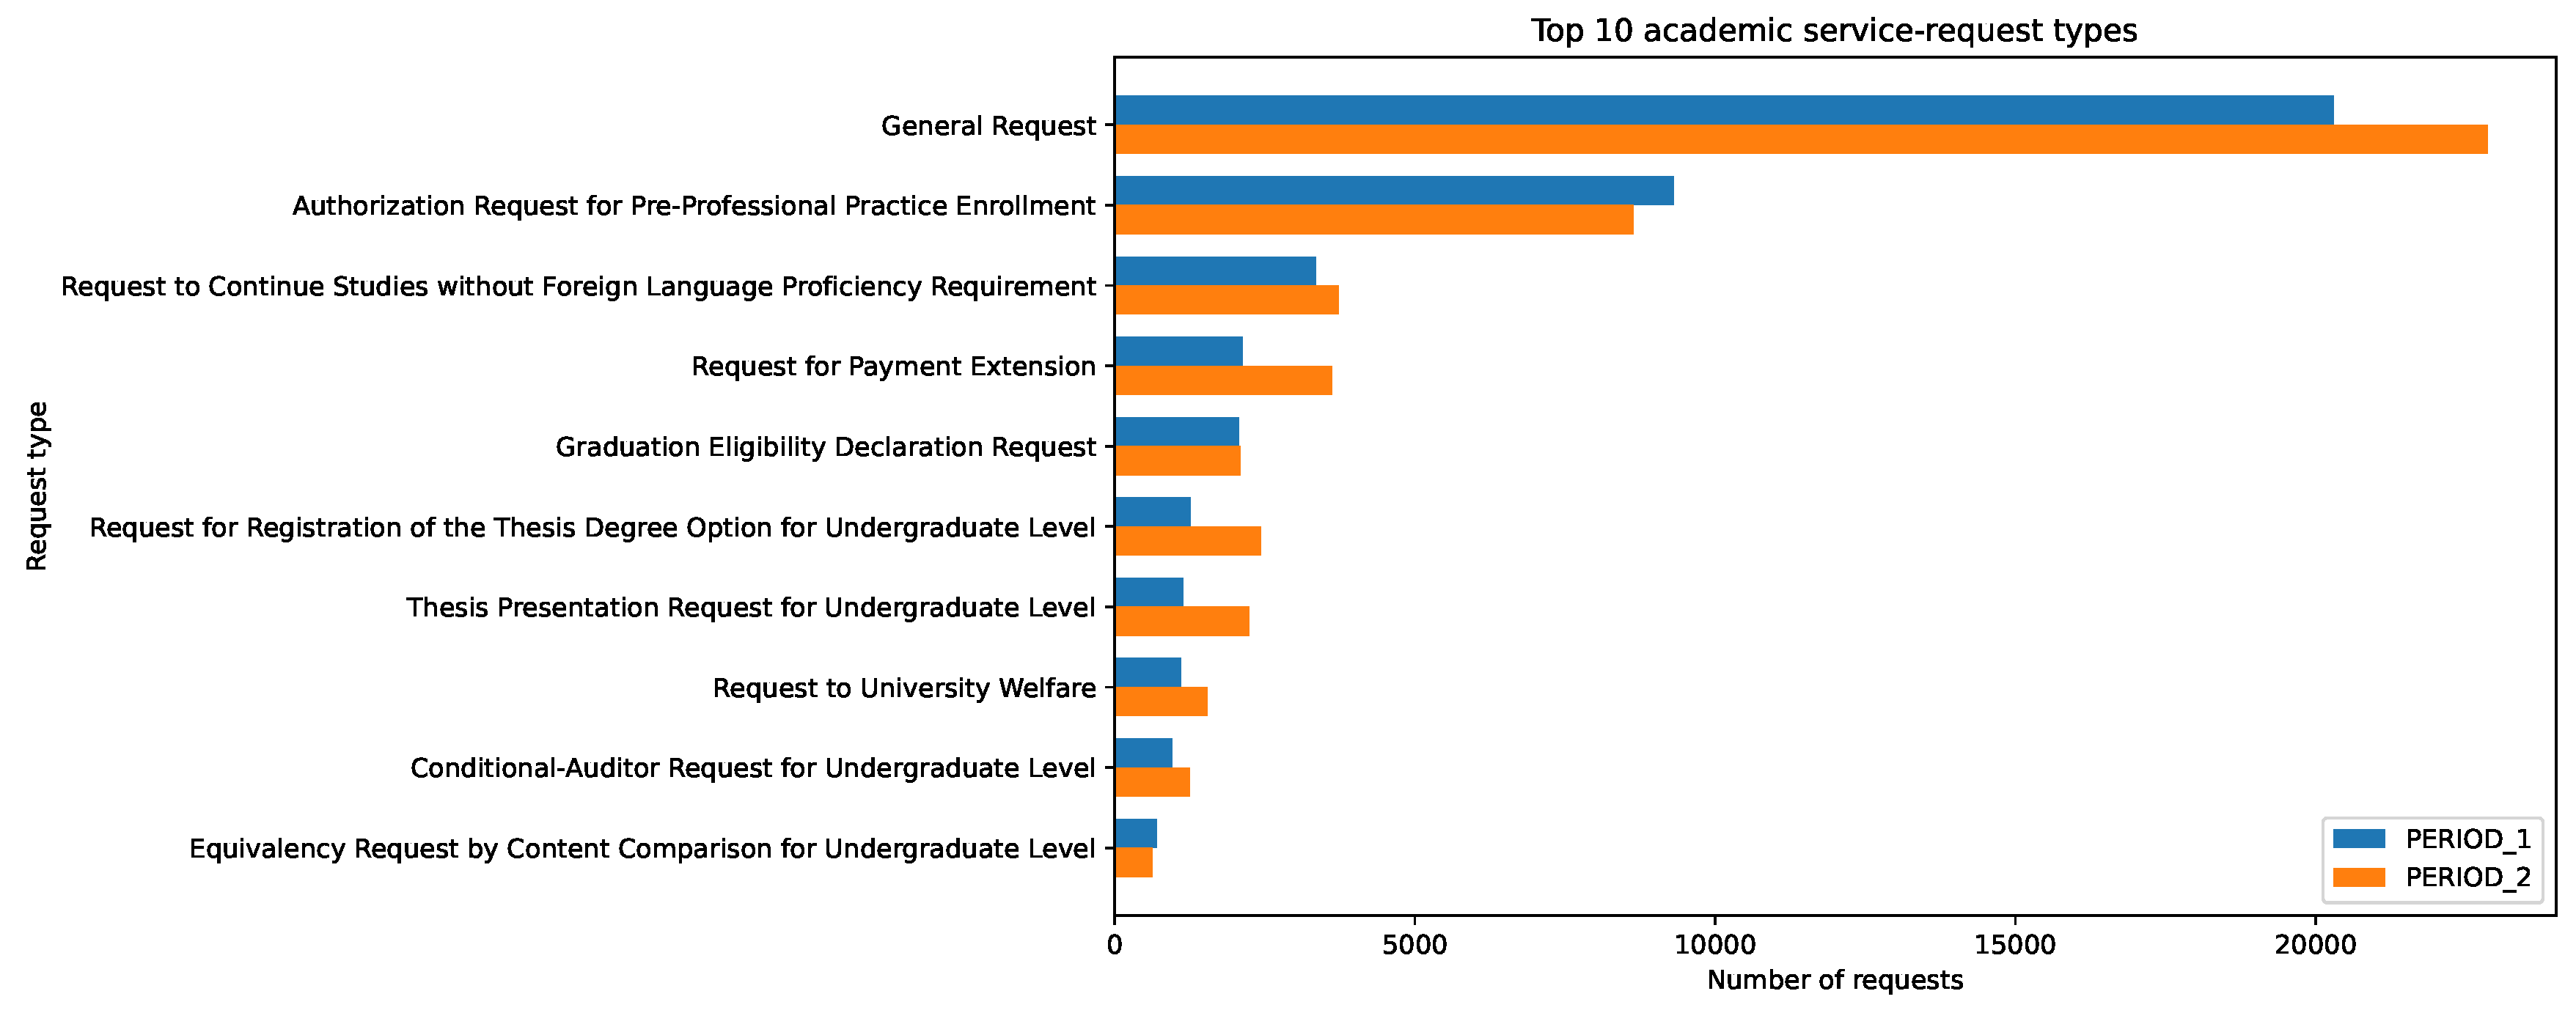
Figure 4.
Percentage of academic service requests assigned to the four institutionally defined undesirable workflow states.
Figure 4.
Percentage of academic service requests assigned to the four institutionally defined undesirable workflow states.
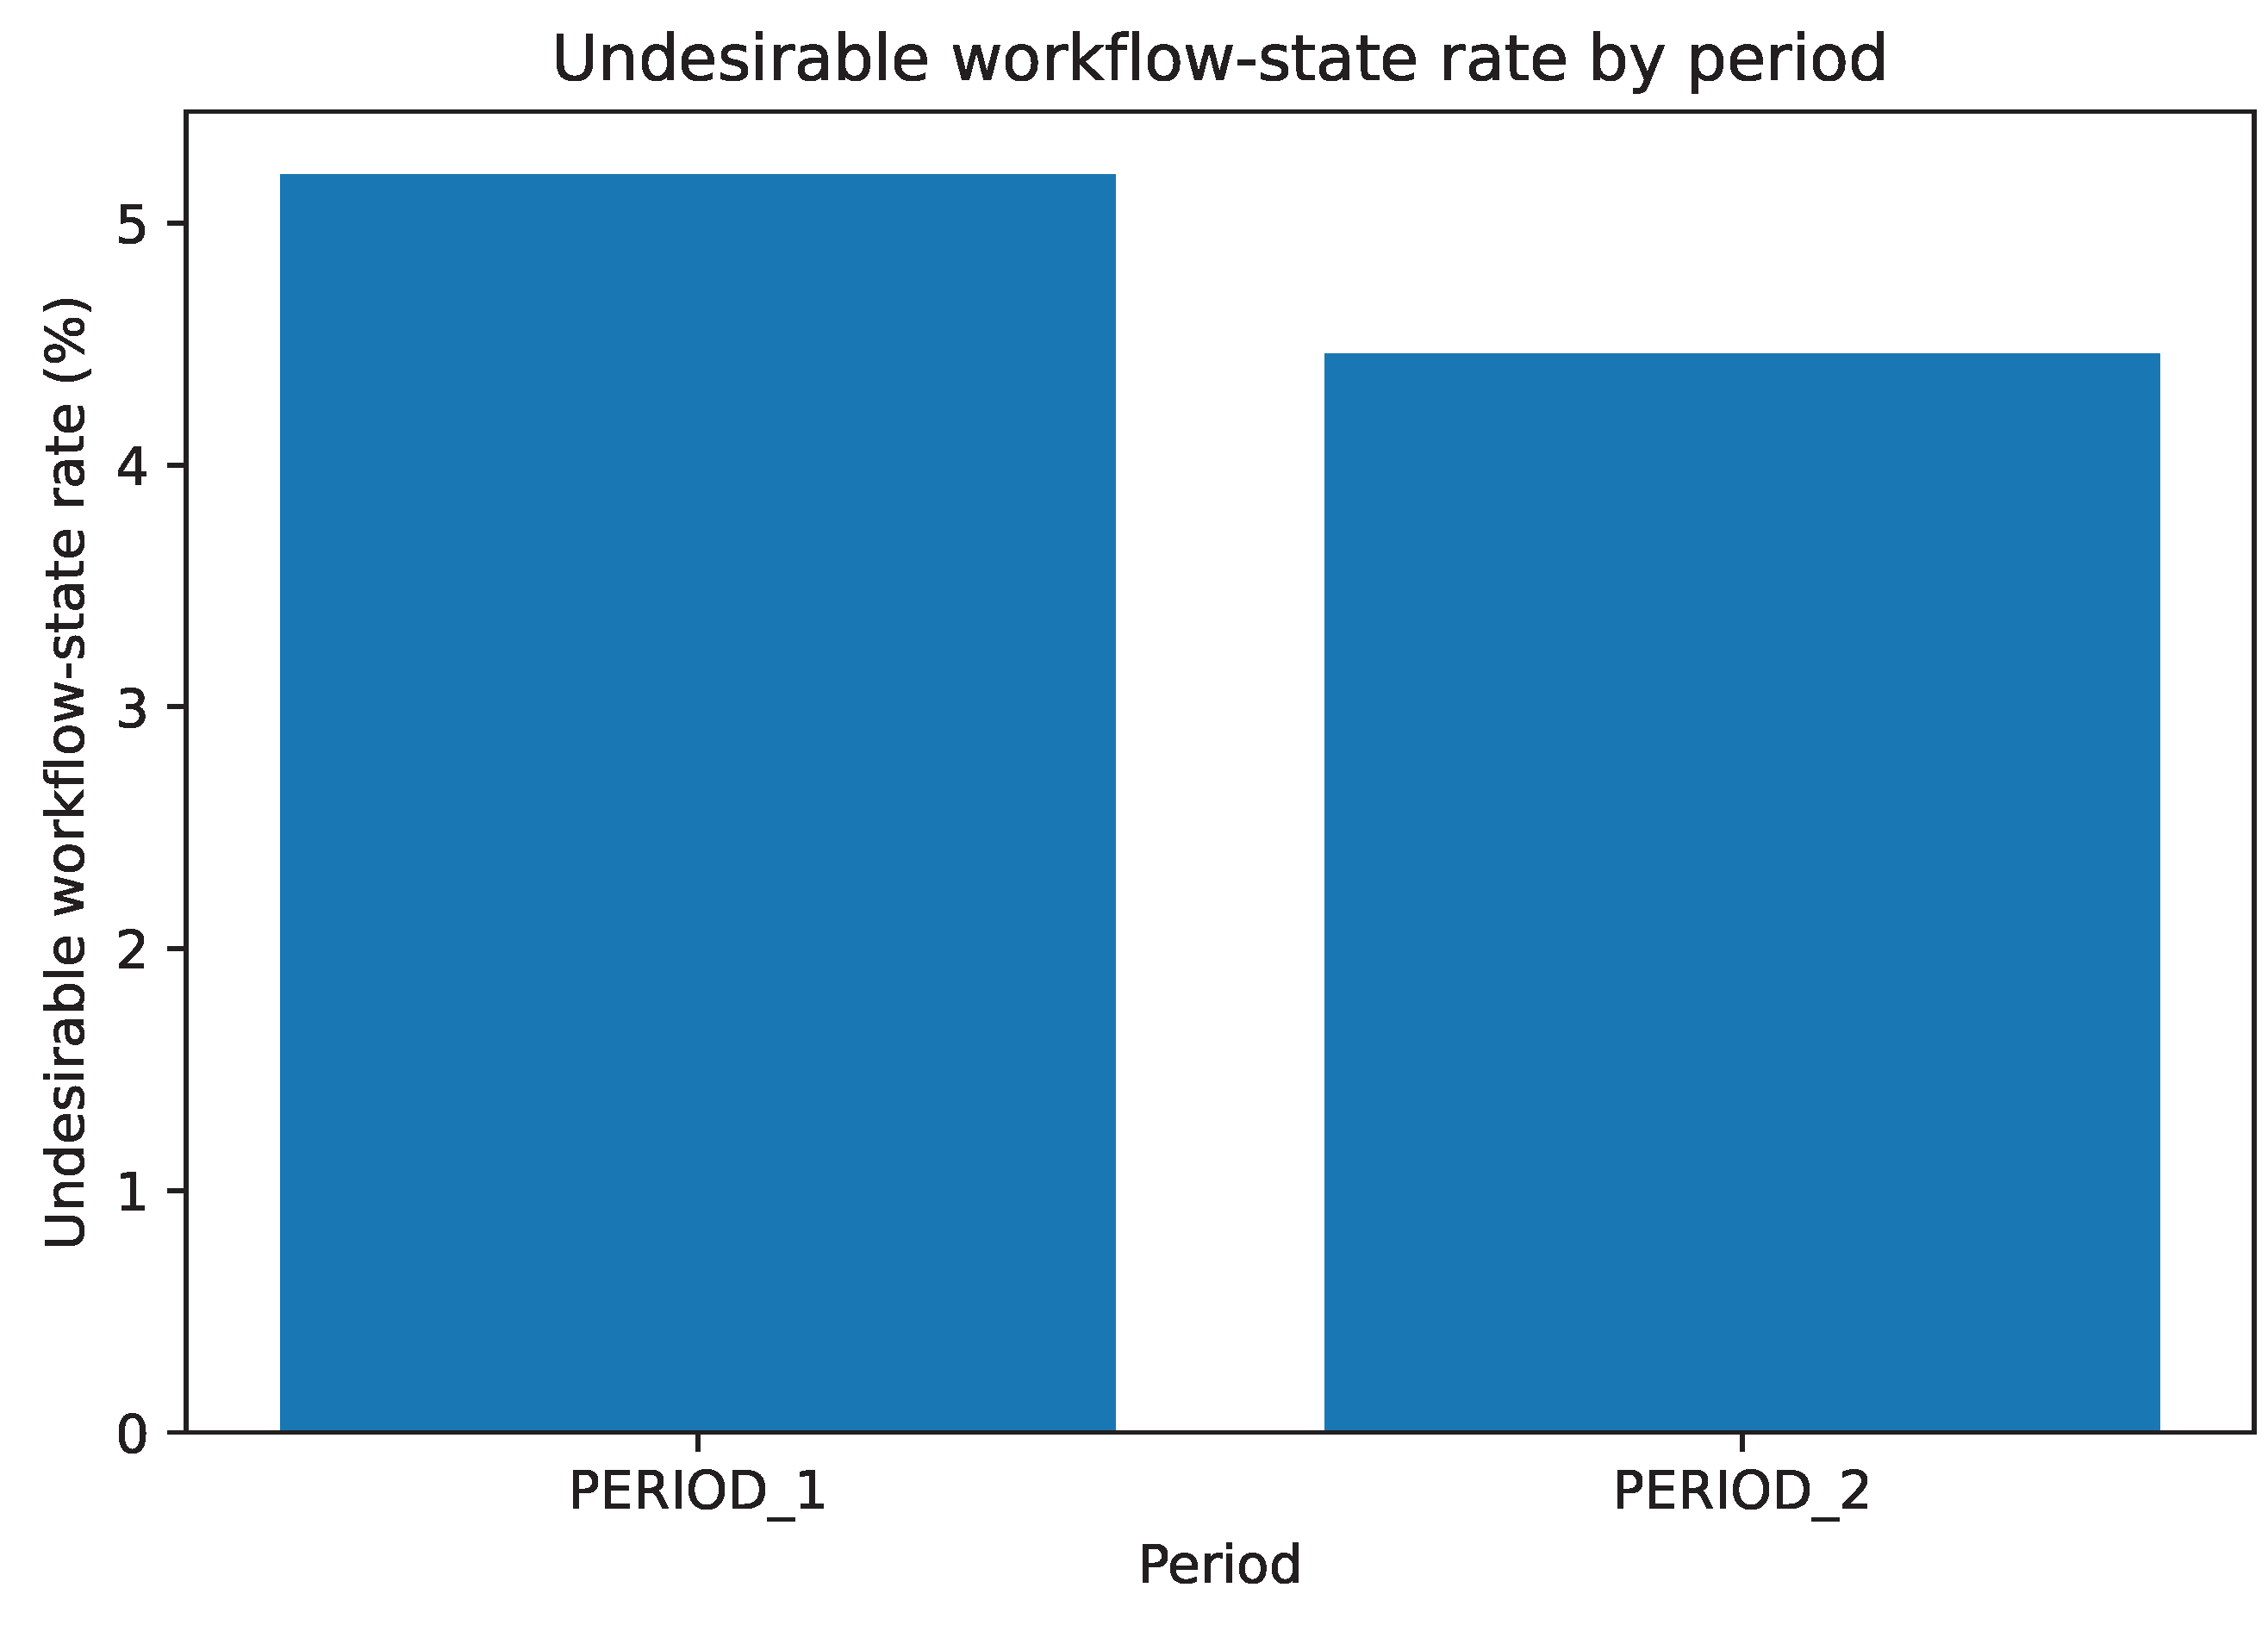
Figure 5.
Absolute frequencies of the four undesirable workflow states by period.
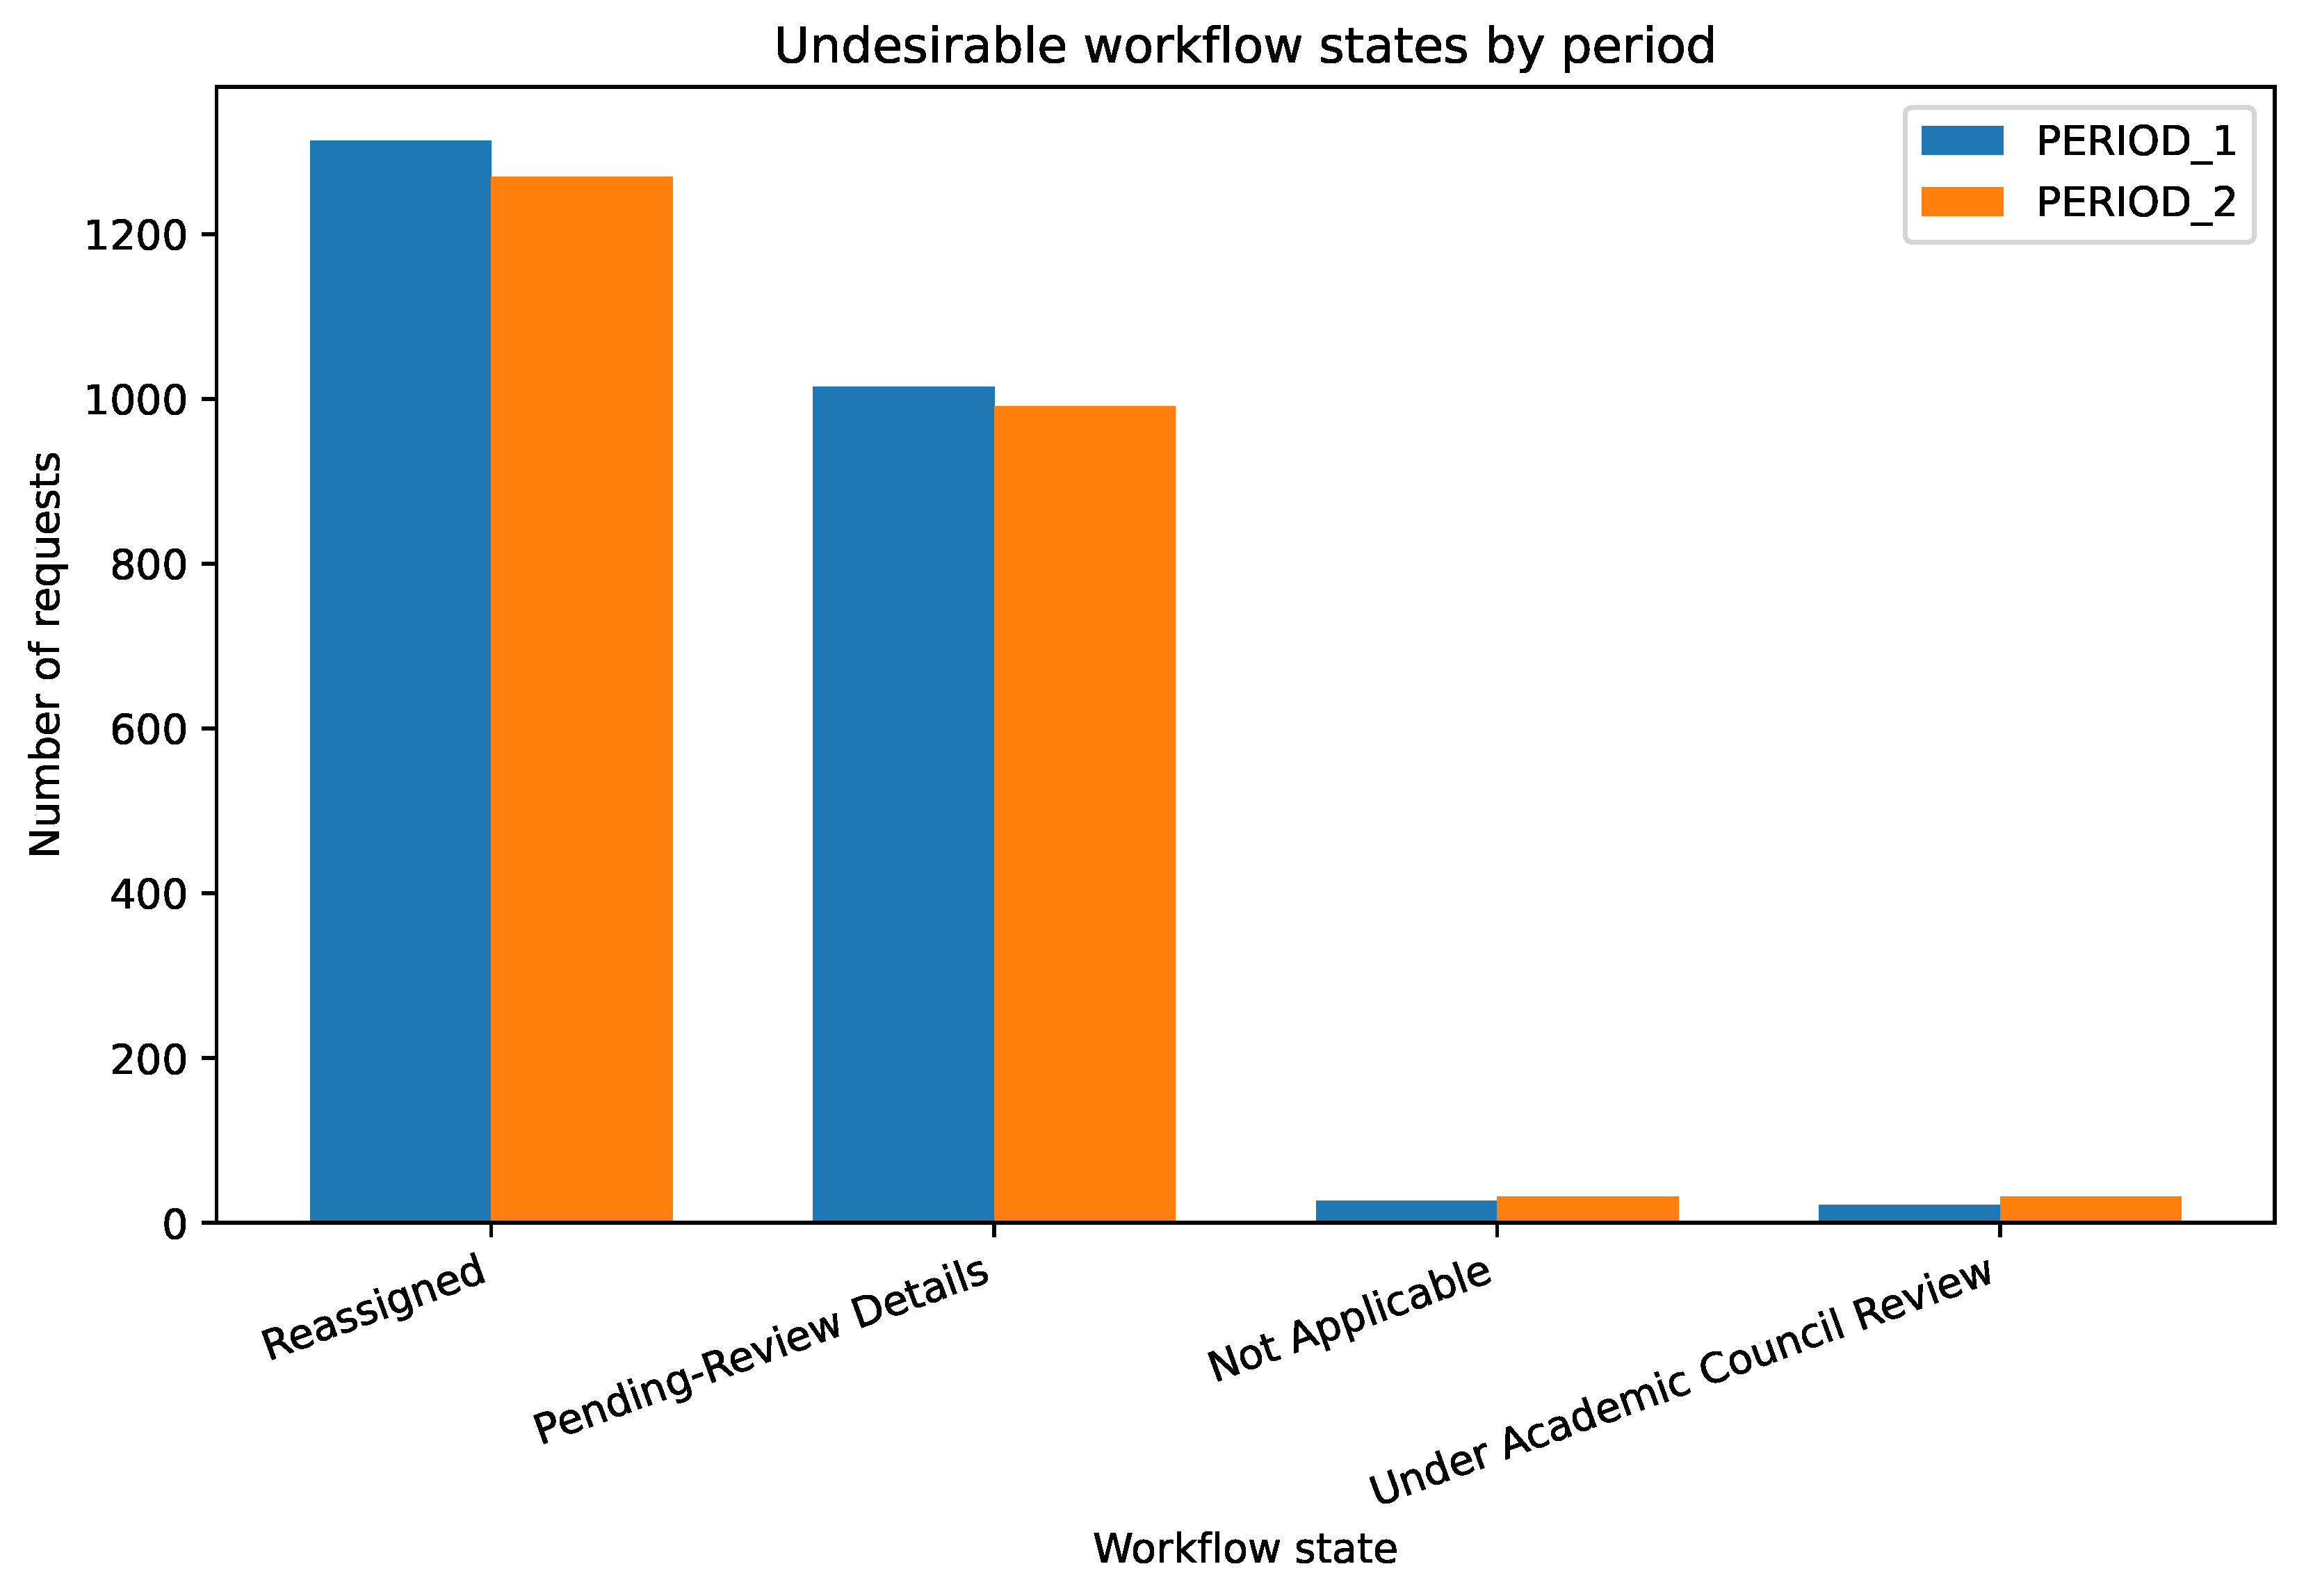
Figure 6.
Heatmap of undesirable workflow-state rates by campus and period.
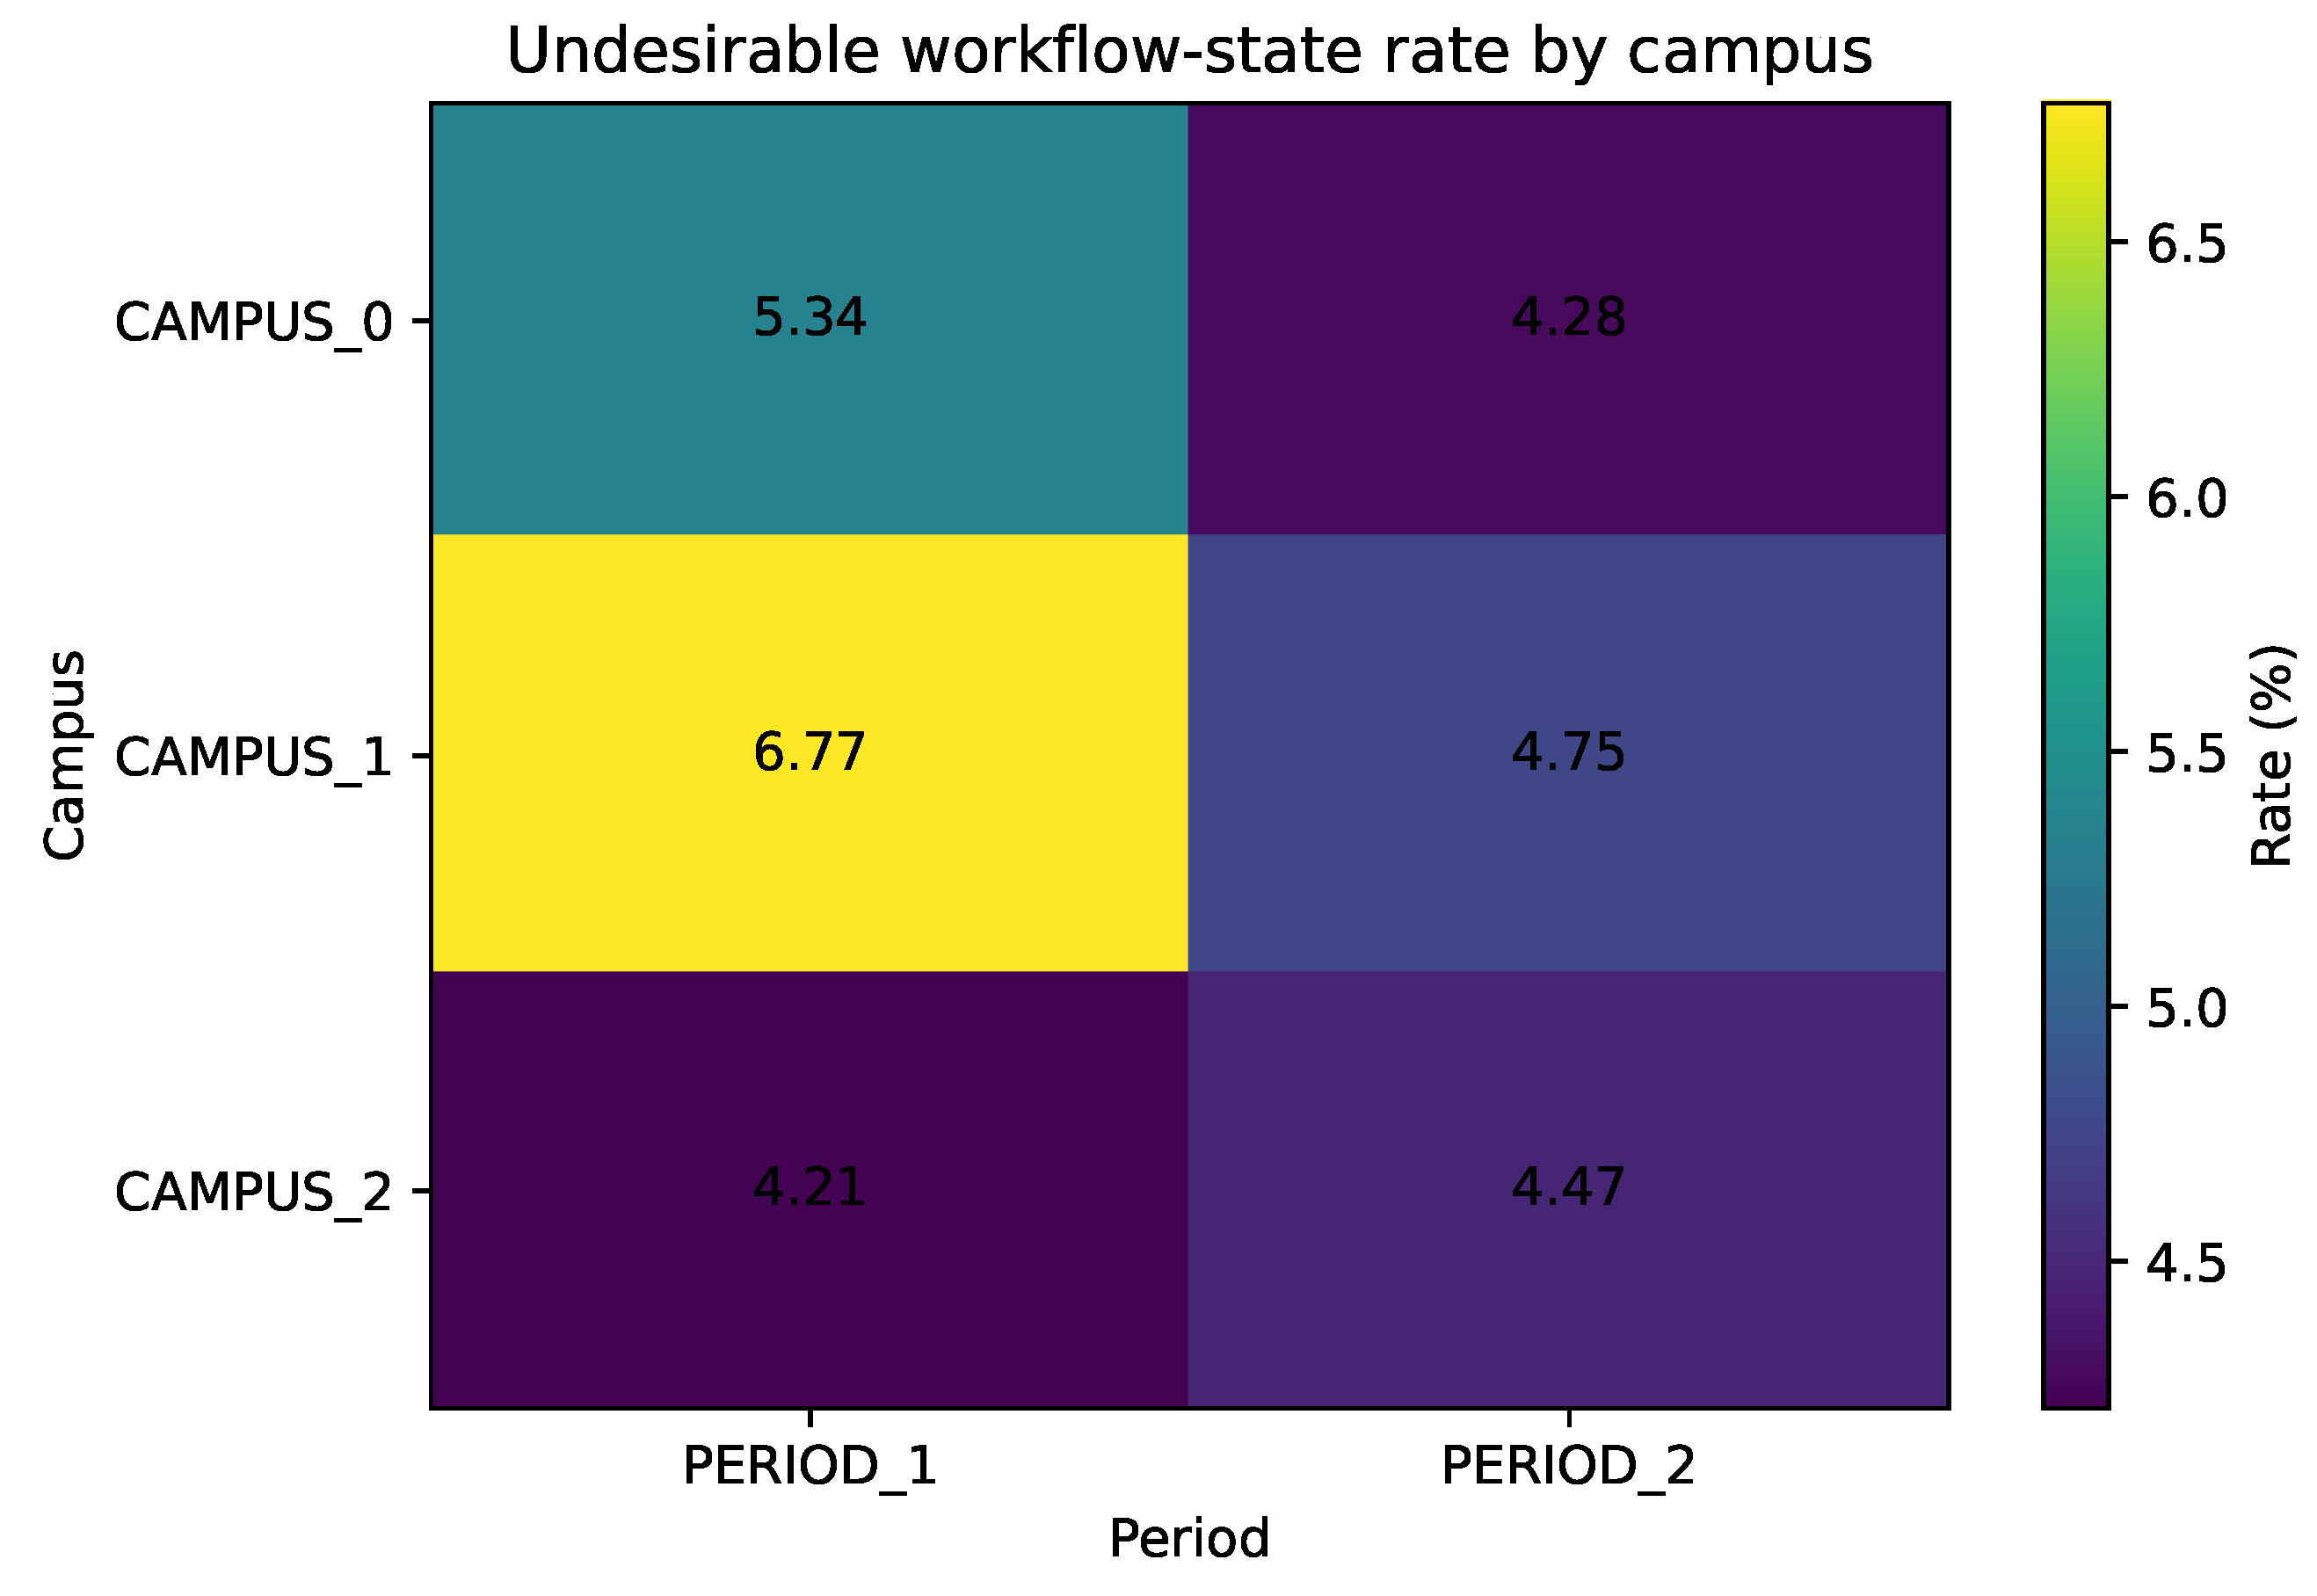

Table 1.
General characteristics of the published dataset.
| Characteristic | Value | Description |
|---|---|---|
| Observation interval | 1 September 2022–31 August 2023 | Twelve-month interval divided into two consecutive six-month periods. |
| Number of rows | 432 | Unique observed combinations of period, campus, request type, and workflow state. |
| Number of variables | 5 | Four categorical variables and one integer-valued frequency variable. |
| Periods | 2 | PERIOD_1 and PERIOD_2. |
| Campuses | 3 | CAMPUS_0, CAMPUS_1, and CAMPUS_2. |
| Request types | 25 | Academic and administrative procedures available through the institutional system. |
| Workflow states | 13 | Possible states associated with the processing or resolution of requests. |
| Total represented requests | 97,809 | Sum of the values contained in TOTAL. |
| Minimum aggregated frequency | 1 | Smallest value observed in TOTAL. |
| Maximum aggregated frequency | 5,457 | Largest value observed in TOTAL. |
| Missing values | 0 | No missing values were identified in the published file. |
Table 2.
Data dictionary for the published academic service-request dataset.
| Variable | Data Type | Allowed Values or Range | Description |
|---|---|---|---|
| PERIOD | Categorical | PERIOD_1, PERIOD_2 | Identifies whether the record corresponds to the original or redesigned administrative processes. |
| CAMPUS | Categorical | CAMPUS_0, CAMPUS_1, CAMPUS_2 | Anonymized identifier of the campus associated with the requests. |
| TYPE_REQUEST | Categorical | 25 documented categories | Identifies the academic service or administrative procedure initiated by the user. |
| CURRENT_STATE | Categorical | 13 documented categories | Identifies the workflow state assigned to the requests at the time of measurement. |
| TOTAL | Integer | 1–5457 | Number of requests represented by the corresponding period–campus–request type–state combination. |
Table 3.
Temporal categories included in the dataset.
| Period | Date Range | Administrative Condition |
|---|---|---|
| PERIOD_1 | 1 September 2022–28 February 2023 | Original academic service processes before administrative redesign. |
| PERIOD_2 | 1 March 2023–31 August 2023 | Redesigned and optimized academic service processes. |
Table 4.
Anonymized campus categories and dataset coverage.
| Campus Identifier | Represented Requests | Share of Dataset (%) |
|---|---|---|
| CAMPUS_0 | 34,883 | 35.66 |
| CAMPUS_1 | 22,553 | 23.06 |
| CAMPUS_2 | 40,373 | 41.28 |
| Total | 97,809 | 100.00 |
Table 5.
Academic service-request categories contained in the dataset.
| No. | Request Type |
|---|---|
| 1 | Academic Withdrawal Request for Periods Before 43 (2013–2014) |
| 2 | Attendance Type Change Request |
| 3 | Authorization Request for Pre-Professional Practice Enrollment |
| 4 | Conditional-Auditor Request for Undergraduate Level |
| 5 | Equivalency Request by Content Comparison for Undergraduate Level |
| 6 | Equivalency Request by Knowledge Validation for Undergraduate Level |
| 7 | Foreign Language Proficiency Validation via Certification |
| 8 | Foreign Language Proficiency Validation via Evaluation |
| 9 | Form Request for Online Program Complementary Information |
| 10 | General Request |
| 11 | Graduation Eligibility Declaration Request |
| 12 | Group Change Request for Undergraduate Level |
| 13 | Modality Change Request |
| 14 | Re-entry to Program Request for Undergraduate Level |
| 15 | Request for Academic Track (Itinerary) Selection for Undergraduate Level |
| 16 | Request for Course Enrollment Increase as an Auditor for Undergraduate Level |
| 17 | Request for Course Withdrawal for Undergraduate Level |
| 18 | Request for Payment Extension |
| 19 | Request for Peer Review of the Academic Essay/Article for Undergraduate Level |
| 20 | Request for Registration of the Comprehensive Examination Degree Option for Undergraduate Level |
| 21 | Request for Registration of the Thesis Degree Option for Undergraduate Level |
| 22 | Request to Continue Studies without Foreign Language Proficiency Requirement |
| 23 | Request to University Welfare |
| 24 | Study Plan Recognition for Re-entry Request |
| 25 | Thesis Presentation Request for Undergraduate Level |
Table 6.
Workflow-state categories contained in the dataset.
| Workflow State | Operational Description |
| Approved | The request satisfied the applicable conditions and was approved. |
| Awaiting Evaluation | The request was waiting for an academic or administrative evaluation. |
| Closed (for Credit Transfers and Graduation Projects) | The process was closed under the workflow used for credit-transfer or graduation-project procedures. |
| Denied | The request was reviewed and rejected. |
| Evaluation Completed | The required evaluation was completed. |
| In Process | The request was being processed by the corresponding administrative unit. |
| Not Applicable | The user initiated the request but did not meet the applicable eligibility conditions. |
| Not Started | The workflow had been created, but processing had not begun. |
| Pending-Review Details | The request was paused because additional information or supporting details were required. |
| Processed / Closed | The workflow had been processed and formally closed. |
| Processed Request | The request had completed the operational processing stage. |
| Reassigned | The initially selected procedure did not correspond to the user’s intended request and was reassigned. |
| Under Academic Council Review | The request required review by the academic council because no directly applicable regulation or institutional rule was available. |
Table 7.
Technical validation of the published dataset.
| Validation Criterion | Result | Validation Outcome |
|---|---|---|
| Number of rows | 432 | All rows follow the expected five-variable structure. |
| Number of columns | 5 | The dataset contains the variables PERIOD, CAMPUS, TYPE_REQUEST, CURRENT_STATE, and TOTAL. |
| Missing values | 0 | No missing values were detected in any variable. |
| Duplicate complete rows | 0 | No exact duplicate rows were detected. |
| Duplicate composite keys | 0 | Each period–campus–request type–state combination is unique. |
| Period categories | 2 | The valid categories are PERIOD_1 and PERIOD_2. |
| Campus categories | 3 | The valid categories are CAMPUS_0, CAMPUS_1, and CAMPUS_2. |
| Request-type categories | 25 | All observations correspond to one of the documented request types. |
| Workflow-state categories | 13 | All observations correspond to one of the documented workflow states. |
| Minimum value of TOTAL | 1 | No zero or negative request frequencies were detected. |
| Maximum value of TOTAL | 5457 | The largest observed aggregation contains 5,457 requests. |
| Sum of TOTAL | 97,809 | The dataset represents 97,809 academic service requests. |
Table 8.
Academic service-request volume by period.
| Period | Total Requests | Absolute Change | Percentage Change |
|---|---|---|---|
| PERIOD_1 | 45,699 | — | — |
| PERIOD_2 | 52,110 | 6,411 | 14.03% |
Table 9.
Academic service-request volume by campus and period.
| Campus | PERIOD_1 | PERIOD_2 | Absolute Change | Percentage Change |
|---|---|---|---|---|
| CAMPUS_0 | 14,875 | 20,008 | 5,133 | 34.51% |
| CAMPUS_1 | 11,090 | 11,463 | 373 | 3.36% |
| CAMPUS_2 | 19,734 | 20,639 | 905 | 4.59% |
Table 10.
Ten most frequent academic service-request types.
| Request Type | PERIOD_1 | PERIOD_2 | Absolute Change | Percentage Change |
|---|---|---|---|---|
| General Request | 20,295 | 22,859 | 2,564 | 12.63% |
| Authorization Request for Pre-Professional Practice Enrollment | 9,305 | 8,639 | % | |
| Request to Continue Studies without Foreign Language Proficiency Requirement | 3,351 | 3,729 | 378 | 11.28% |
| Request for Payment Extension | 2,132 | 3,623 | 1,491 | 69.93% |
| Graduation Eligibility Declaration Request | 2,066 | 2,097 | 31 | 1.50% |
| Request for Registration of the Thesis Degree Option for Undergraduate Level | 1,262 | 2,430 | 1,168 | 92.55% |
| Thesis Presentation Request for Undergraduate Level | 1,141 | 2,242 | 1,101 | 96.49% |
| Request to University Welfare | 1,103 | 1,543 | 440 | 39.89% |
| Conditional-Auditor Request for Undergraduate Level | 951 | 1,249 | 298 | 31.34% |
| Equivalency Request by Content Comparison for Undergraduate Level | 696 | 630 | % |
Table 11.
Workflow-state frequencies by period.
| Workflow State | PERIOD_1 | PERIOD_2 | Absolute Change | Percentage Change |
|---|---|---|---|---|
| Approved | 28,571 | 35,504 | 6,933 | 24.27% |
| Awaiting Evaluation | 1 | 1 | 0 | 0.00% |
| Closed (for Credit Transfers and Graduation Projects) | 3 | 2 | % | |
| Denied | 8,104 | 8,742 | 638 | 7.87% |
| Evaluation Completed | 1 | 0 | % | |
| In Process | 538 | 658 | 120 | 22.30% |
| Not Applicable | 27 | 32 | 5 | 18.52% |
| Not Started | 63 | 41 | % | |
| Pending-Review Details | 1,015 | 991 | % | |
| Processed / Closed | 13 | 29 | 16 | 123.08% |
| Processed Request | 6,028 | 4,809 | % | |
| Reassigned | 1,313 | 1,269 | % | |
| Under Academic Council Review | 22 | 32 | 10 | 45.45% |
Table 12.
Combined frequency and rate of undesirable workflow states.
| Period | Total Requests | Undesirable-State Requests | Undesirable Rate |
|---|---|---|---|
| PERIOD_1 | 45,699 | 2,377 | 5.20% |
| PERIOD_2 | 52,110 | 2,324 | 4.46% |
Table 13.
Frequencies of undesirable workflow states by period.
| Workflow State | PERIOD_1 | PERIOD_2 | Absolute Change | Percentage Change |
|---|---|---|---|---|
| Reassigned | 1,313 | 1,269 | % | |
| Pending-Review Details | 1,015 | 991 | % | |
| Not Applicable | 27 | 32 | 5 | 18.52% |
| Under Academic Council Review | 22 | 32 | 10 | 45.45% |
Table 14.
Undesirable workflow-state frequencies and rates by campus.
| Period | Campus | Total Requests | Undesirable Requests | Rate |
|---|---|---|---|---|
| PERIOD_1 | CAMPUS_0 | 14,875 | 795 | 5.34% |
| PERIOD_1 | CAMPUS_1 | 11,090 | 751 | 6.77% |
| PERIOD_1 | CAMPUS_2 | 19,734 | 831 | 4.21% |
| PERIOD_2 | CAMPUS_0 | 20,008 | 856 | 4.28% |
| PERIOD_2 | CAMPUS_1 | 11,463 | 545 | 4.75% |
| PERIOD_2 | CAMPUS_2 | 20,639 | 923 | 4.47% |
Disclaimer/Publisher’s Note: The statements, opinions and data contained in all publications are solely those of the individual author(s) and contributor(s) and not of MDPI and/or the editor(s). MDPI and/or the editor(s) disclaim responsibility for any injury to people or property resulting from any ideas, methods, instructions or products referred to in the content. |
© 2026 by the authors. Licensee MDPI, Basel, Switzerland. This article is an open access article distributed under the terms and conditions of the Creative Commons Attribution (CC BY) license (http://creativecommons.org/licenses/by/4.0/).
Copyright: This open access article is published under a Creative Commons CC BY 4.0 license, which permit the free download, distribution, and reuse, provided that the author and preprint are cited in any reuse.