Preprint
Article

This version is not peer-reviewed.

Optimization of Solvent Extraction for Phenolic, Flavonoid, and Elemental Profiling of Nerium oleander, Bulbine frutescens, and Cotyledon orbiculata: Implications for Phytomedicinal Applications

Submitted:

06 August 2026

Posted:

10 August 2026

You are already at the latest version

Abstract

Medicinal plants are important sources of bioactive phytochemicals and essential mineral elements with therapeutic potential. This study investigated the effects of extraction solvent polarity on the total phenolic content (TPC), total flavonoid content (TFC), and elemental composition of Nerium oleander, Bulbine frutescens, and Cotyledon orbiculata. Phenolic and flavonoid contents were determined spectrophotometrically, while elemental nutrients in N. oleander extracts were analyzed using inductively coupled plasma-optical emission spectroscopy. N. oleander exhibited the highest phenolic and flavonoid contents among the three species. Dichloromethane extracts yielded the highest TPC (6.936 ± 0.613 mg GAE/100 mg), whereas hexane extracts produced the highest TFC (8.793 ± 0.020 mg QE/100 mg). Extraction solvent significantly affected phenolic recovery (p < 0.05), with a significant interaction between solvent and plant species. Essential macroelements (Ca, Mg, Na and K) and micronutrients (Al, Mn, Zn and Fe) were detected, while Cr, Cu, Ni and Pb were absent or below detectable limits. These findings demonstrate the importance of solvent selection and highlight N. oleander as a promising source of phytochemicals and mineral nutrients for phytomedicinal and nutraceutical applications.

Keywords: 
;  ;  ;  ;  ;  ;  ;  

1. Introduction

Medicinal plants continue to play a significant role in primary healthcare owing to their rich diversity of bioactive phytochemicals and essential nutrients. Among the most important classes of phytochemicals are phenolic compounds and flavonoids, which are recognized for their potent antioxidant, anti-inflammatory, antimicrobial, and wound-healing properties [1,2]. Phenolic compounds act as effective free-radical scavengers, thereby reducing oxidative stress and protecting biological systems from cellular damage associated with chronic diseases and impaired tissue repair [3,4]. Flavonoids, a major subclass of phenolic compounds, contribute to therapeutic efficacy through multiple mechanisms, including modulation of inflammatory pathways, inhibition of microbial growth, enhancement of collagen synthesis, and protection against oxidative damage [5,6]. Consequently, the determination of total phenolic and flavonoid contents is widely employed as an indicator of the medicinal potential and quality of plant extracts.
In addition to phytochemicals, medicinal plants contain essential macro- and microelements that contribute to their nutritional and therapeutic value. Elements such as calcium, magnesium, potassium, iron, zinc, manganese, and copper are involved in numerous physiological processes, including enzyme activation, immune function, antioxidant defence, cellular metabolism, and tissue regeneration [7]. The presence of these elements may enhance the biological activity of plant extracts through synergistic interactions with secondary metabolites, particularly in applications related to wound healing and inflammation management. Furthermore, elemental profiling serves as an important quality-control measure by assessing nutritional value and ensuring the absence of potentially toxic elements [8].
Nerium oleander, Bulbine frutescens, and Cotyledon orbiculata are medicinal plants traditionally used for the treatment of wounds, skin disorders, inflammation, and various infectious conditions. Previous studies have attributed these therapeutic effects to the presence of phenolic compounds, flavonoids, and other bioactive metabolites. For example, Nerium leaves were found to be rich in carbohydrates, flavonoids, alkaloids, steroids, cardiac glycosides and tannins [9]. It has been demonstrated that Bulbine frutescens species contain chemotaxonomic biomarkers, responsible for enhancing skin health and wound healing [10]. Phytochemical analysis of C. orbiculata leaf extract has also confirmed the presence of cardiac glycosides, flavonoids, phenolics, reducing sugars, saponins, condensed tannin, gallotannin, and triterpene steroids [11]. However, comparative information regarding the recovery of these constituents under different extraction conditions and their relationship with elemental composition remains limited. Therefore, the evaluation of total phenolic content, total flavonoid content, and elemental nutrients in these medicinal species is essential for understanding their phytochemical characteristics, validating their traditional uses, and supporting the development of standardized phytotherapeutic products. Given the significant contribution of phenolic compounds, flavonoids, and mineral nutrients to the biological activities and nutritional value of medicinal plants, their quantitative evaluation provides important insights into the therapeutic potential and quality of plant-derived products. Therefore, this study aimed to determine the total phenolic content, total flavonoid content, and elemental composition of Nerium oleander, Bulbine frutescens, and Cotyledon orbiculata extracts and to evaluate the influence of extraction conditions on the recovery of these bioactive constituents.

2. Materials and Methods

2.1. Plant Material Collection and Preparation

The plant material was identified by a traditional healer and was purchased at Magic Lawns Nursery in Vereeniging, Gauteng Province, South Africa (26°40′S, 27°55′E). To comply with botanical documentation and alignment with scientific standards, the plant name was cross-checked and validated using internationally recognized taxonomic databases, including Plants of the World Online (POWO), World Flora Online (WFO), and the Medicinal Plant Names Services (MPNS). Leaves were thoroughly washed with distilled water, air-dried at ambient temperature (25 ± 2°C) for 14 days, and ground to a fine powder (particle size < 0.5 mm) using a laboratory mill. The powdered material was stored in airtight containers at 4°C until further analysis.

2.2. Plant Material Extraction

Powdered leaf material (50 g) was extracted with 500 mL of each solvent (1:10 w/v ratio) by maceration at room temperature (25 ± 2°C) with intermittent shaking (150 rpm) for 72 hours. The solvents evaluated included water, methanol, ethanol, acetone, dichloromethane, chloroform, ethyl acetate, and hexane, selected to encompass a broad polarity range (polarity index: 0.1–9.0). The extract was filtered through Whatman No. 1 filter paper, and the residue was re-extracted twice with fresh solvent (2 × 250 mL) to ensure complete extraction. The combined filtrates were concentrated under reduced pressure at 40°C using a rotary evaporator (Büchi Rotavapor R-210) to obtain the crude extract, which was then dried to constant weight in a vacuum desiccator and stored at 4°C until analysis. All extractions were performed in triplicate, and results are expressed as mean ± standard deviation.

2.3. Spectrophotometric Analysis of Total Phenols using Garlic Acid Standard

Total phenolic content of extracts was determined according to the modified method of Khatiwora [12]

2.3.1. Preparation of extract Solution

1 mg of extract was dissolved in 5 ml of its extracting solvent.

2.3.2. Preparation of garlic Acid Standard Stock Solution

About 5 mg of garlic acid was dissolved in 10 ml of ethanol, and then further diluted to 100 ml with deionized water in a volumetric flask. Different concentrations (0.005 – 0.05 mg/ml) were prepared from the standard stock solution.

2.3.3. Preparation of Forlin-Ciocalteu Reagent (FCR)

About 2 ml of FCR was diluted 10x with deionized water.

2.3.4. Preparation of 7.5% sodium carbonate solution

About 7.5 g of sodium carbonate was dissolved in 100 ml of deionized water, and the pH was adjusted to 10.

2.3.5. Preparation of blank Solution

1 ml of ethanol, 5 ml of FCR and 4 ml of sodium carbonate solution were mixed.

2.3.6. Procedure

To 1 ml of standard/extract, 5 ml FCR and 4 ml sodium carbonate solutions were added. The mixtures were incubated at 25 ◦C for 45 min. Absorbance at 760 nm were measured using UV-VIS spectrophotometer. A standard calibration curve of concentration vs. absorbance was plotted, from which total phenolic content of extracts was expressed as mg of garlic acid equivalents.

2.4. Spectrophotometric Analysis of Flavonoids using Quercetin Standard

Total phenolic content of extracts was determined according to the modified method of Ramos [13].

2.4.1. Preparation of Extract Solution

1 mg of extract was dissolved in 5 ml of its solvent.

2.4.2. Preparation of quercetin Standard Stock Solution

About 5 mg of quercetin was dissolved in 10 ml of ethanol, and then further diluted to 100 ml with deionized water in a volumetric flask. Different concentrations (0.005 – 0.05 mg/ml) were prepared from the standard stock solution.

2.4.3. Preparation of 5% aluminium Chloride Solution

About 5 g of aluminium chloride was dissolved in 100 ml of deionized water.

2.4.4. Procedure

To 6 ml of standard/extract solutions, 2 ml of 5% aluminium chloride was added, and the volume was made up to 25 ml with deionized water. The mixtures were incubated at 25 ◦C for 35 min. The wavelength of maximum absorption was determined using UV-VIS spectrophotometer, from which the absorbance was measured. A standard calibration curve of concentration vs. absorbance was plotted, from which total phenolic content of extracts was expressed as mg of garlic acid equivalents.

2.5. Elemental Analysis of Plant Extracts Using ICP-OES Method

2.5.1. Reagents Preparation

All solvents and reagents used were of analytical grade. Distilled water was used as a solvent for preparation of solutions. Saturated solutions of extracts were prepared by dissolving 1 mg of extract in 1 ml of distilled water. Stock solutions of standards were prepared from the multi- element solution, and different dilutions were prepared from which the calibration curve was plotted.

2.5.2. Analytical Procedure

The Inductively Coupled Plasma-Optical Emission Spectroscopy (ICP-OES) method was used for the elemental analysis of elements in the extracts.

2.6. Data Analysis

Results were expressed as mean ± standard deviation. Comparative evaluation was based on: Sensitivity, accuracy and reproducibility.

3. Results

3.1. Determination of total Phenols, Flavonoids and Elemental Nutrients from Nerium oleander (N. oleander), Bulbine frutescens (B. frutescens, and Cotyledon orbiculata (C. orbiculata)

3.1.1. Spectrophotometric Determination of Total Phenolic and Flavonoid Content Using Gallic Acid and quercetin Standards, Respectively

  • Figure 1 is the calibration curve of the Gallic acid standard;
  • Table 1 shows the results of the absorbance versus the concentration of the Gallic acid standard;
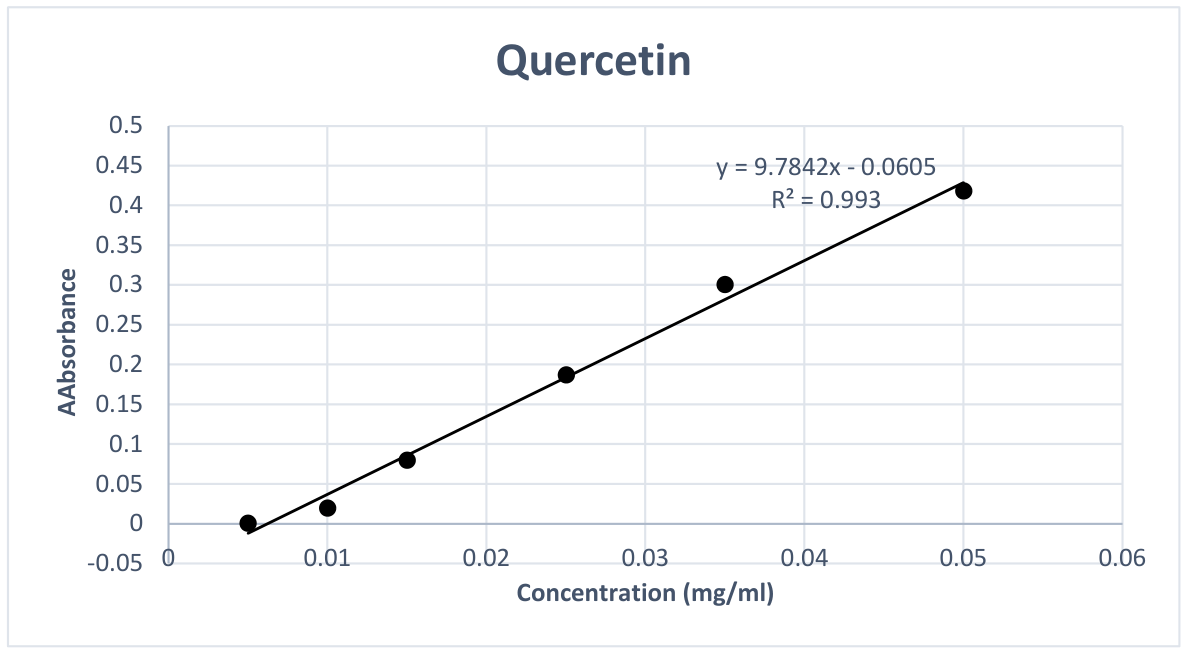
  • Figure 2 is the calibration curve of the quercetin standard;
  • Table 2 shows the results of the absorbance versus the concentration of the quercetin standard;
  • There was good correlation between absorbance and concentration of both Gallic acid and quercetin, with correlation coefficients of 0.99 and 0.993, respectively.

3.1.2. Total Phenolic Content of N. oleander, B. frutescens, and C. orbiculta Extracts Expressed as Garlic Acid Equivalent

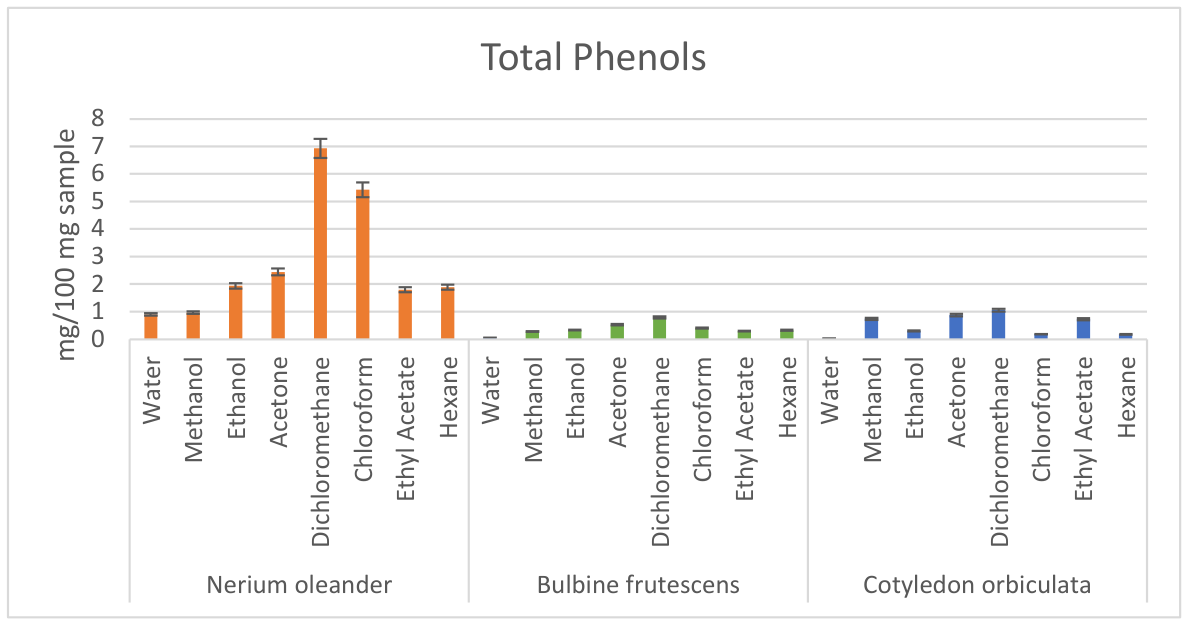
  • Figure 3 is the graphical representation of the total phenolic content of N. oleander, B. frutescens, and C. orbiculata;
  • Table 3 shows the results of the total phenolic content of N. oleander, B. frutescens, and C. orbiculta extracts;
  • The total phenolic content in N.oleander and B.frutescens increased with decrease in polarity of the solvent from water to dichloromethane, and decreased from dichloromethane to ethyl acetate;
  • Dichloromethane resulted in the highest total phenolic content of 6.936±0.613, 0.798±0.13, and 1.061±0.587 mg Gallic Acid Equivalent (GAE)/ 100 mg sample for N. oleander, B. frutescens and C. orbiculata, respectively;
  • There seemed to be no significant differences in the total phenolic content between B. frutescens and C. orbiculata.

3.1.3. Total Flavonoid Content of N. oleander, B. frutescens, and C. orbiculta extracts expressed as quercetin equivalent

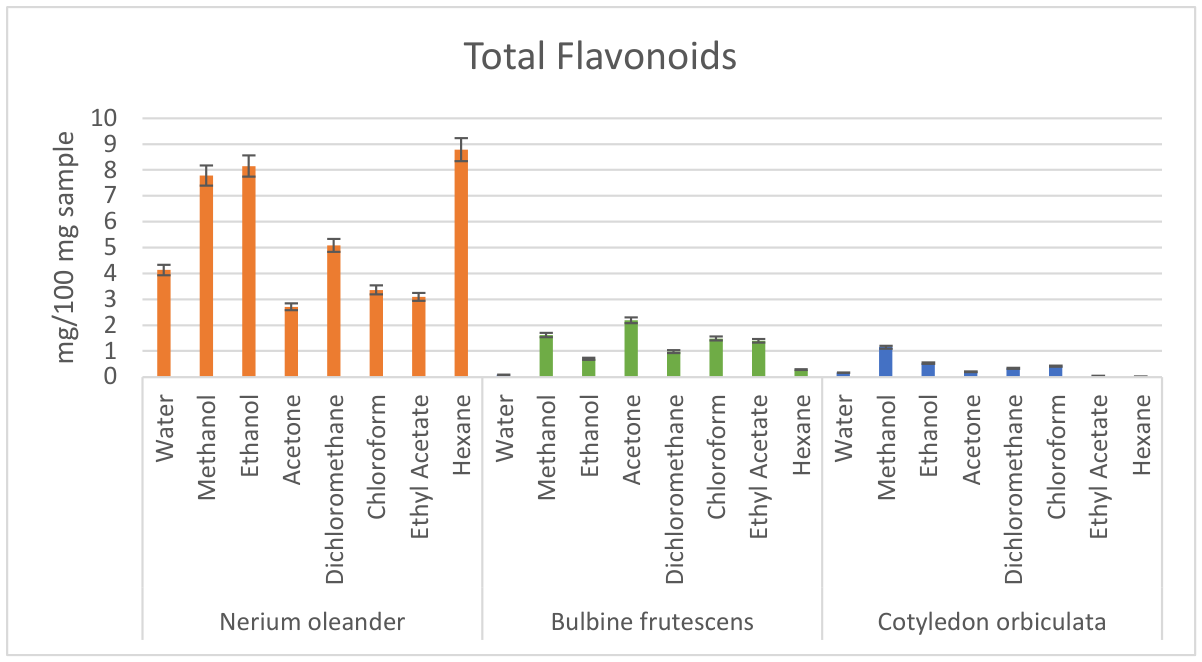
  • Figure 4 is the graphical representation of the total flavonoid content of N. oleander, B. frutescens, and C. orbiculata;
  • Table 4 shows the results of the total flavonoid content of N. oleander, B. frutescens, and C. orbiculta extracts;
  • Hexane extract of N. oleander resulted in the highest total flavonoid content of 8.793±0.02 Querceting Equivalent (QE)/ 100 mg sample, respectively;
  • Methanol extracts of both B.frutescens and C.orbiculata had the highest flavonoid content of 1.625±0.022 and 1.157±0.074 mg Quercetin Equivalent (QE)/ 100 mg sample, respectively;
  • Generally, N.oleander presented the highest flavonoid content of the three plants;
  • There seemed to be significant difference in the flavonoid content of all the three plants.

3.1.4. Investigating Whether or Not There’s Any Significant Differences in the Total Phenolic Content Between B. frutescens and C. orbiculata

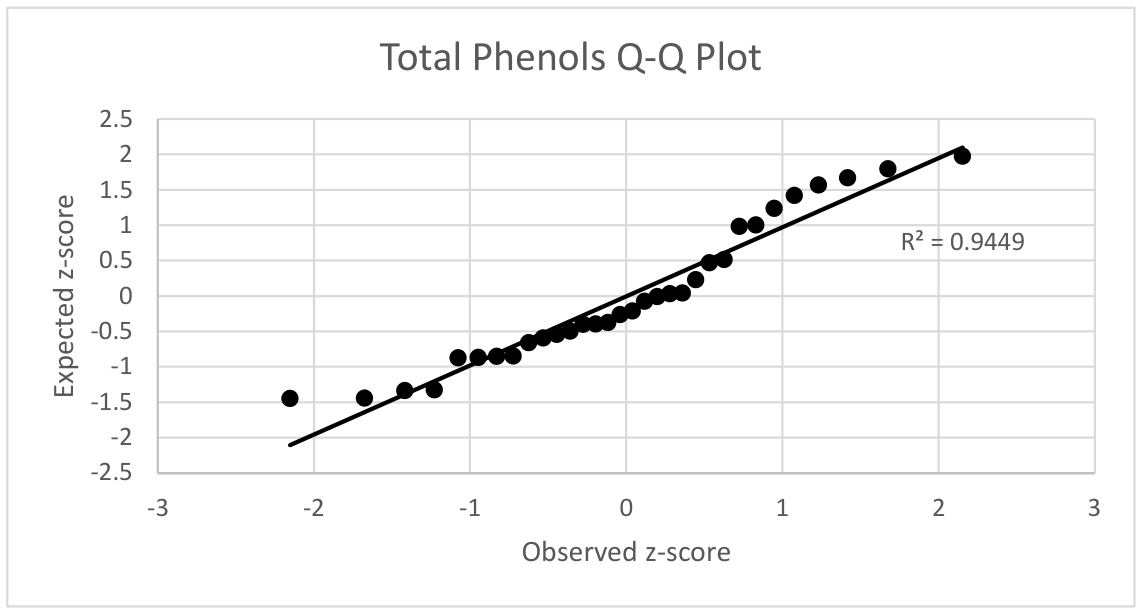
  • Table 5 illustrates the descriptive statistics of the B. frutescens and C. orbiculata data to evaluate if the data followed normal distribution. For normal distribution, the mean and median should be similar. The skewness of the data points should be closer to zero. There was no conclusive evidence from the descriptive statistics to suggest if the data was normally distributed;
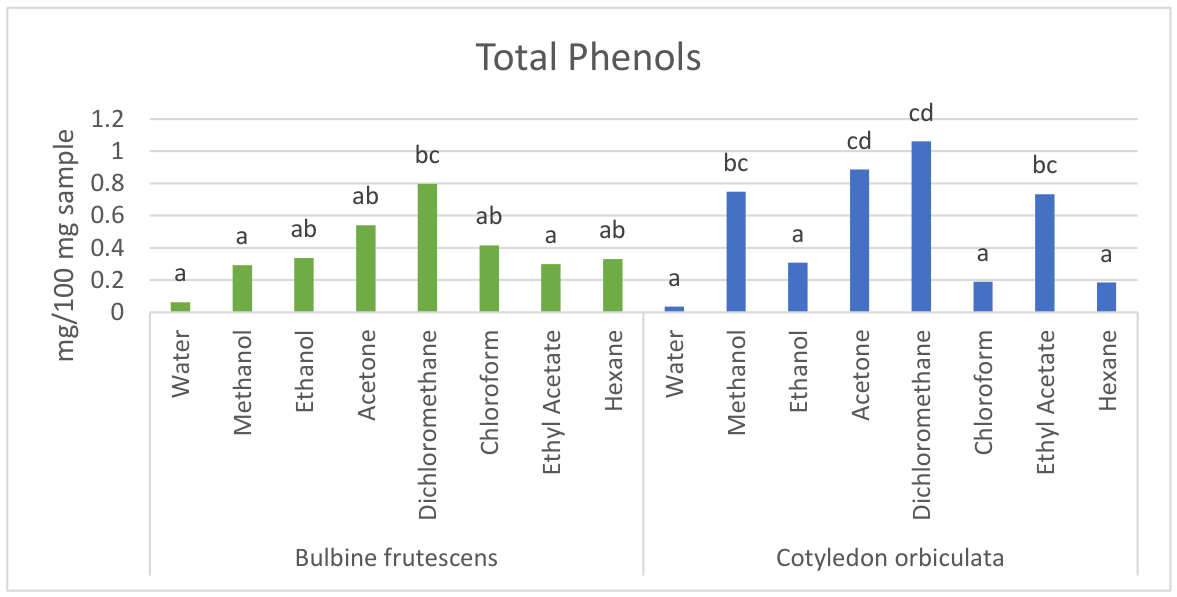
  • Figure 5 shows the Q-Q plot of the B. frutescens and C. orbiculata data to further investigate the normality of the data. It was evident that the data was normally distributed since most data points were lying in or near the straight line, and thus ANOVA and Tukey’s HSD tests were appropriate to determine the significant difference of the phenolic content between B. frutescens and C. orbiculata;
  • Table 6 displays the results for a two-way ANAVO test with replication, whilst Figure 6 a graphical illustration of the similarities or differences in the phenolic content using Tukey’s HSD test;
  • The plant type had no significant effect (F = 1.64, p < 0.05), indicating that both plants had similar amounts of total phenolic content (Table 6);
  • The analysis showed a significant effect of extraction solvent (F = 15.15, p < 0.05), demonstrating that solvent type played a critical role in the extraction efficiency of phenolic compounds from the same plant type (Table 6);
  • There was a significant interaction effect between extracting solvent and the type of plant (F = 4.42, p < 0.05), suggesting that the effectiveness of extracting phenolic compounds from a specific type of plant depends on the solvent employed (Table 6). For example, both methanol and ethyl acetate extracted different amounts of total phenolic compounds from B. frutescens and C. orbiculata (Figure 6).

3.1.5. Determination of Macro and Trace Elements from Nerium Oleander Plant Extracts Using ICP-OES

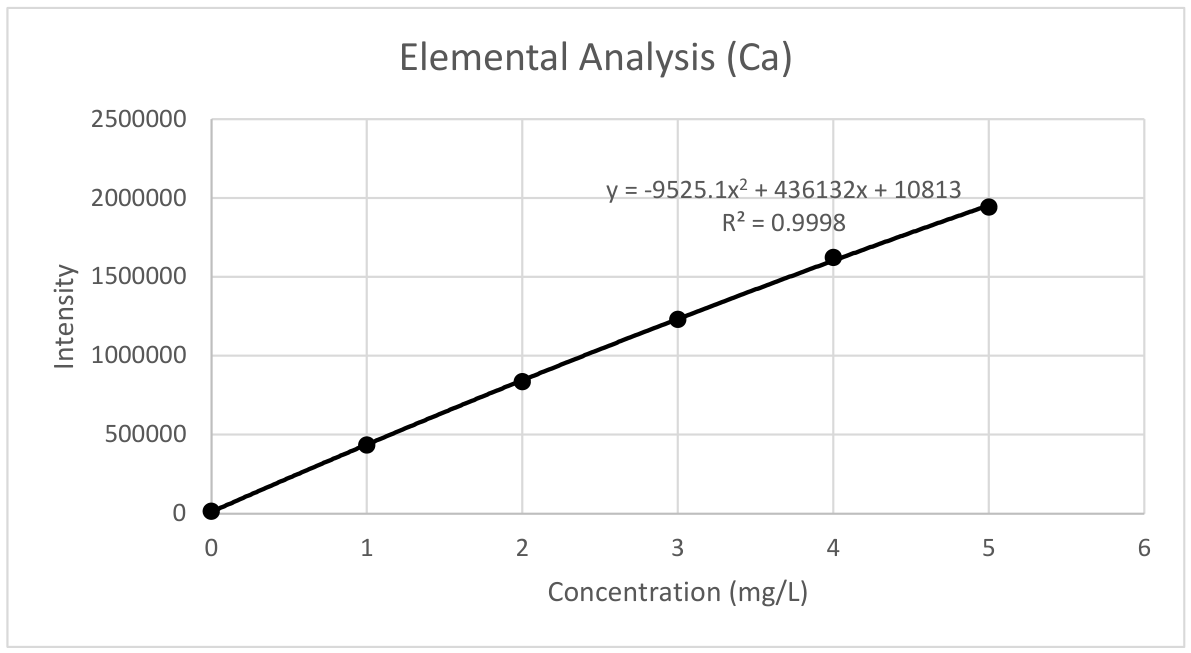
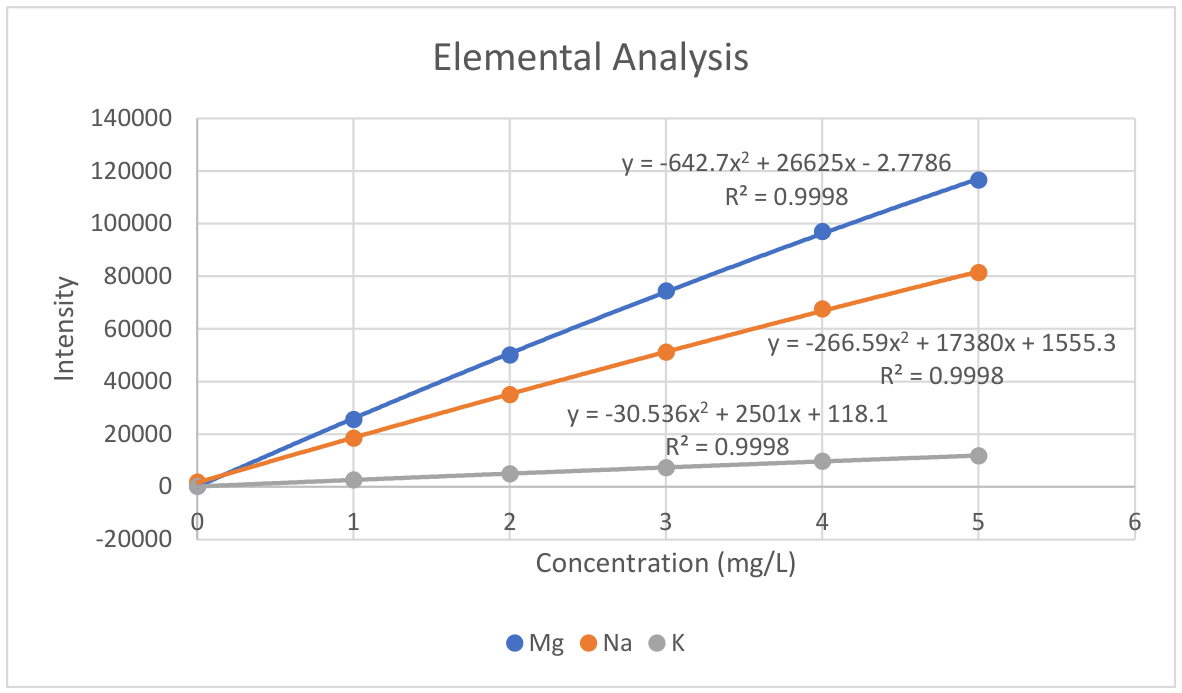
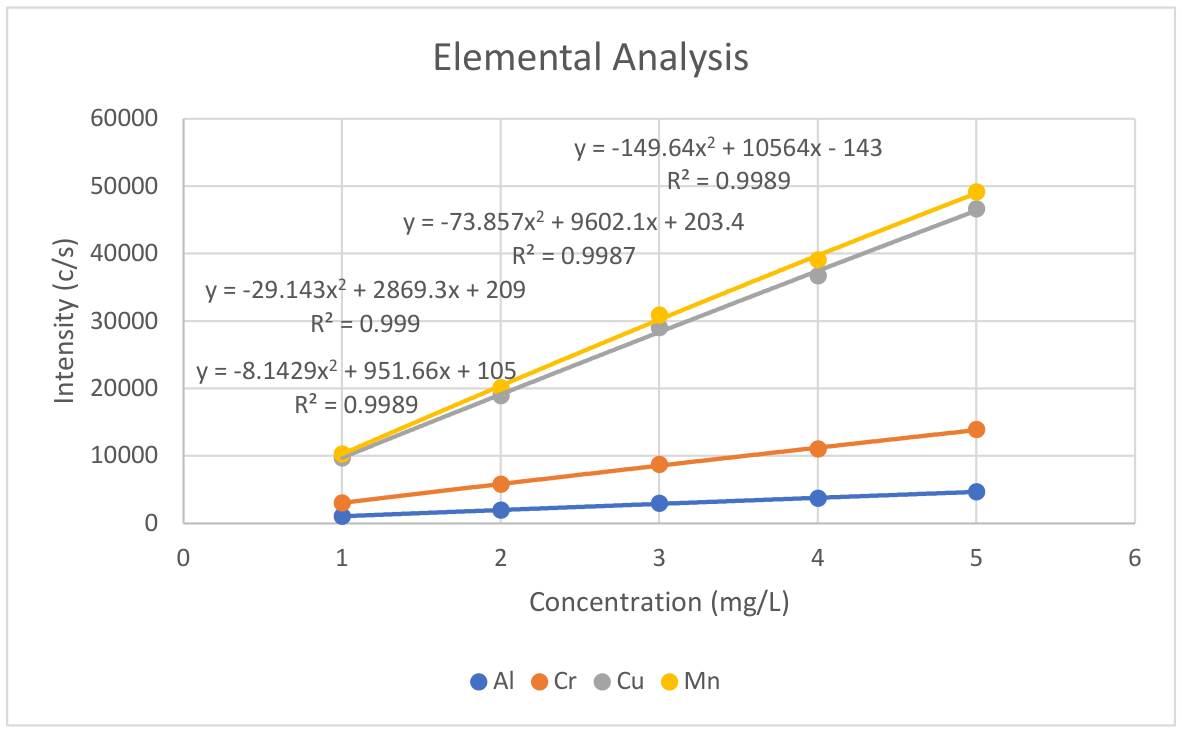
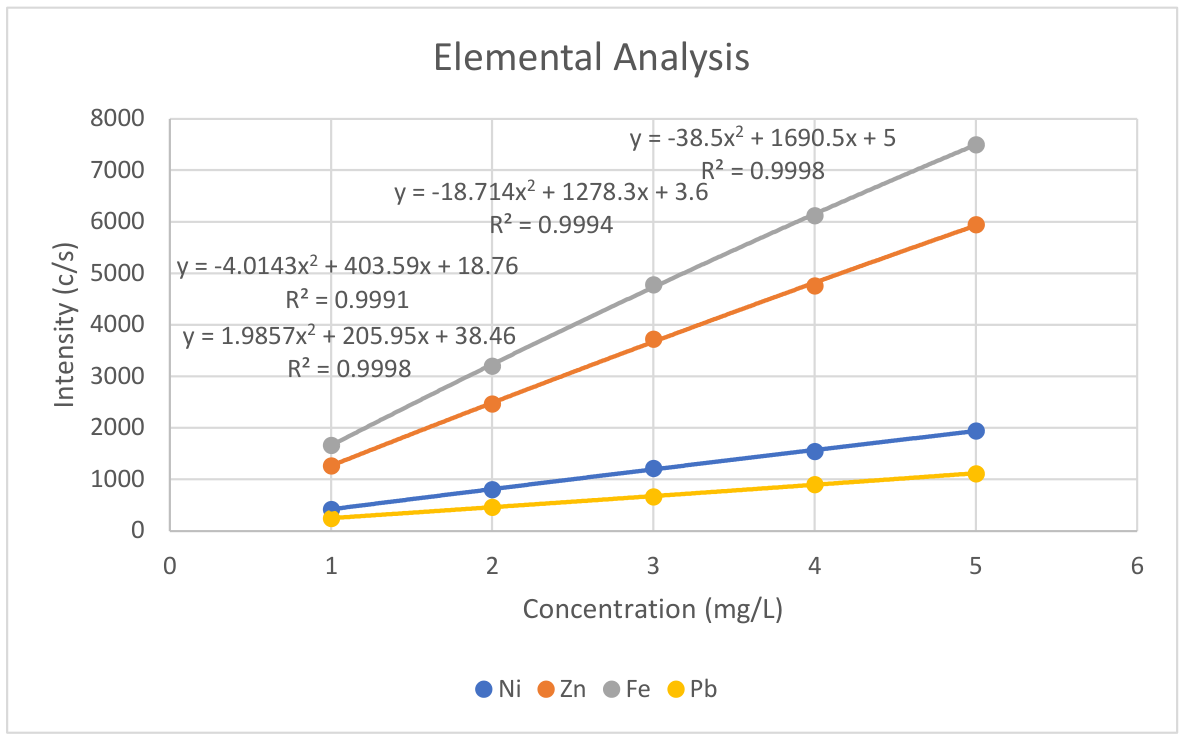
  • Table 7 gives the results for the elemental nutrients of a multi element standard using Inductively Coupled Plasma Optical Emission Spectroscopy (ICP-OES). Figure 7, Figure 8, Figure 9 and Figure 10 are the calibration curves generated from the data in Table 7;
  • The calibration curves show good correlation between elemental nutrients and the intensity;
  • Table 8 and Table 9 display the results of the macro and micro/trace elemental nutrients for the water, methanol, acetone, chloroform, ethyl acetate, and hexane extracts of Nerium oleander, calculated from the multi elements standard calibration curves;
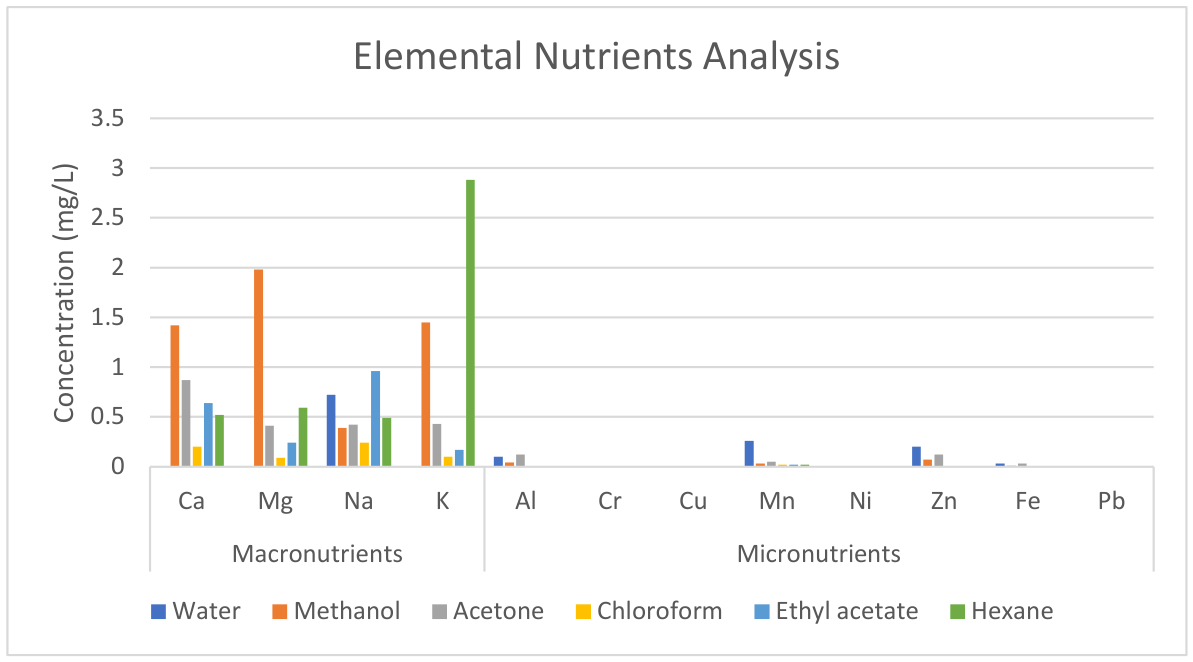
  • Figure 11 is the graphical illustration of the macro and micro/trace elemental nutrients of the Nerium oleander water, methanol, acetone, ethyl acetate, and hexane extracts;
  • Methanol had the highest concentration of calcium and magnesium, which were 1.42 and 1.98 mg/L respectively.
  • Ethyl acetate displayed the highest concentration of 0.96 mg/L for sodium, whilst hexane had the highest concentration of potassium, at 2.88 mg/L;
  • Chromium, copper, nickel and lead were not present or their concentration were below detectable limits from all the extracts;
  • The highest manganese and zinc concentrations of 0.26 and 0.2 mg/L were found in the water extract;
  • The highest iron concentration of 0.03 mg/L was found in both water and acetone extracts.

3.2. Formatting of Mathematical Components

The phenolic and flavonoid content of samples in µg/mL was calculated using a linear equation,
x = 1000 m ( y + b )
where “y” is absorbance of samples; “x” is concentration of samples; “m” is the gradient of the graph, and “b” is the constant in the equation (see Figure 1 and Figure 2).
The phenolic and flavonoid content of samples in mg/100 mg sample was calculated using equation,
c o n c e n t r a t i o n = x × d i l F a c t o r × m a s s   o f   e x t r a c t   ( s e e   T a b l e   7 ) m a s s   o f   r a w   m a t e r i a l   e x t r a c t e d   ( s e e   T a b l e   7 )
where
dilFactor = dilution factor (see 2.2.1);
The elemental nutrient content of samples in mg/L was calculated from a quadratic equation,
y = a x 2 + b x + c
where
x = 1 a y c + b 2 a 2 b 2 a
and “x” and “y” are the concentration and “intensity”, respectively.

4. Discussion

Bhuvaneshwari et al. [14], reported negative results for the presence of total phenols and wflavonoids in Nerium oleander (N. oleander). However, Motaung et al. [15] reported positive results for the presence of phenols and flavonoids. In the same study by Motaung and company, phytochemical screening of B. frutescens reported negative results for phenols, whilst positive results were reported for the acetone and hexane extracts of C. orbiculata. They reported positive results for the presence of total flavonoids for C. orbiculata.
Mohadjerani reported the phenolic content of 4.54 ± 0.23 µg/mL for water extract of N. oleander leaves [16]. The phenolic content for the water extract of N. oleander leaves obtained in this study was 1.061±0.587 mg Gallic acid (GAE)/ 100 mg sample. Ali et al. reported the total phenolic content of Nerium oleander flower to be 13.654±3.32 mg GAE/100 g essential oil [17], which suggests that most of the phenolic compounds are contained in the flower part. Teffo et al. reported a total phenolic content of 83.14 ± 53.4 mg GAE/100 mg sample for B. frutescens [18], which is higher than 0.798±0.13 mg GAE/100 mg sample reported in this study. They reported a total phenolic content of 1.70 mg GAE per gram dry matter for C. orbiculata, which is similar to 1.061±0.587 mg GAE/100 mg dry matter reported in this study.
The highest flavonoid content of 8.793±0.02 mg QE/ 100 mg sample was obtained by the hexane extract. Redha obtained the flavonoid content of 2.5 ± 0.04 and 3.287 ± 0.10 mg Rutin Equivalents (RE) per 100 gram sample for water and methanol extracts of N. oleander leaves, respectively [19]. The flavonoid content from the flower were 7.10 ± 0.02 and 40.04 ± 0.09 mg RE per gram sample for water and methanol extracts of N.oleander, respectively. The flavonoid content for water and methanol in this present study were 4.139±0.078 mg QE/100 mg sample and 7.796±0.055 mg Quercetin Equivalent (QE)/100 mg sample, respectively.
Methanol extracts of B. frutescens and C. orbiculata resulted in the highest flavonoid contents of 1.625±0.022 and 1.157±0.074 mg QE/100 mg sample, respectively. Shikalepo and company reported the flavonoid content of B. frutescens to be 7.160 ± 0.05 mg QE/100 mg extract [20]. Aremu et al. reported the flavonoid content of 0.008 µg Catechin Equivalent (CTE)/g dry matter of C. orbiculata [21].
Adamu and company indicated that calcium is necessary for normal functioning of cardiac muscles, regulation of cell permeability, blood coagulation [22]. Excess of calcium in blood results in calcification of several internal organs. Deficiency of calcium causes diseases like rickets, osteoporosis [22]. Magnesium is important to all the cells in humans, and is present in many enzymes involved in proteins, lipids, and carbohydrate metabolism. In plants, Magnesium is present in chlorophylls. Magnesium is required in the plasma and extracellular fluid, where it helps maintain osmotic equilibrium [22].
Sodium just like Potassium, is also one of the major electrolytes in the blood and without sodium the body cannot be hydrated, it would dry off [22]. They recommended that too much of sodium may cause the cell to break down. Sodium is of great importance for the regulation of many systems in the body. They advised that potassium helps in the proper function of brain and nerves, and thus it helps in prevention of stroke. They also indicated that potassium regulates acid-base and water balance in the blood and tissues, and suggested that high potassium in diet lowered blood pressure in individuals with raised blood pressure [22]. They emphasised that potassium is essential in protein biosynthesis by ribosomes. Mogos advised that potassium is also an essential macro-element for a human as it is involved in muscle contraction, in lipids metabolism, in proteins synthesis, maintaining the fluid and electrolyte balance in the body and is responsible in the nerve impulses sending [23].
Chromium, copper, nickel and lead were not detected from all the extracts. Chromium is known to be essential in the synthesis of fatty acids and cholesterol, but excess results in asthma, shortness of breath, liver and kidney damage and allergic reactions [23]. Zayed and Terry suggested that since chromium was highly toxic, carcinogenic and is lethal at high dosage, it is required by the human body in very trace amount [24]. The permissible limits of chromium in edible plants set by FAO/WHO was 0.02 ppm [25]. Copper is regarded as an essential redox-active transition element that is critical in various metabolic processes. They also found to be essential to the human body since it forms a component in many enzyme systems such as cytochrome oxidase, lysyl oxidase and an iron-oxidizing enzyme in the blood [22]. FAO/WHO set the permissible limit for copper in edible plants at 3.00 ppm [26].
Nickel is required for production of insulin, and it is a component of several enzymes i.e. carbon monoxide dehydrogenase, urease, hepatic microsomal enzymes etc. [26]. However, excess of nickel was found to cause allergic dermatitis known as nickel itch, which usually occurs when skin is moist [22]. The permissible limit of nickel in edible plants set by FAO/WHO was 1.63 ppm [26]. Lead is known to have no beneficial effects in humans, and the permissible limit set by FAO/WHO in edible plants was 0.43 ppm [26]. Lead was found to cause both acute and chronic poisoning, and has adverse effects on kidney, liver, vascular and immune system [27,28]. It also causes a rise in blood pressure, miscarriages, subtle abortion, and decline in fertility of men through sperm damage and diminishing abilities of children and disruption of nervous systems [29].
The highest manganese concentration of 0.26 mg/L was found in the water extract. Manganese was found to be essential for the development of normal structure, reproduction, metabolism of amino acids, lipids, carbohydrates and functioning of central nervous system, and its deficiency was found to results in tissue damage. However, excess manganese was also found to be the cause of pneumonia, affecting the reproductive system, which may lead to infertility [22]. FAO/WHO set the manganese limit in edible plants at 2.00 ppm [26]. Zinc is one of the most important minerals in the body, but high concentration of zinc was found to be neurotoxin [30]. The permissible limit set by FAO/WHO for zinc is 27.4 ppm [26]. Zinc was found to be a co-factor for enzymes in the body. It also takes part in synthesis of DNA, proteins and in insulin biosynthesis, storage, and secretion [31]. In this study, the water extract had the highest zinc concentration of 0.2 mg/L.
Iron plays an essential role in oxygen and electron transfer in human body and is also necessary for the synthesis of haemoglobin [32,33]. Adamu et al. [22] figured that the deficiency of iron was the leading causes of anaemia, poor resistance to infection, weakness. Iron is also an essential component of many proteins and enzymes in the human body. The permissible limit of iron set by FAO/WHO (1984) in edible plants was 20 ppm. The highest iron concentration of 0.03 mg/L in Nerium oleander was found in both water and acetone extracts.

5. Conclusions

The present study demonstrated that extraction solvent plays a critical role in the recovery of phenolic and flavonoid compounds from Nerium oleander, Bulbine frutescens, and Cotyledon orbiculata. Among the three species investigated, N. oleander consistently exhibited higher total phenolic and flavonoid contents, indicating a greater abundance of antioxidant phytochemicals. Dichloromethane proved to be the most effective solvent for phenolic extraction, whereas methanol and hexane yielded the highest flavonoid concentrations depending on plant species.
Statistical analysis revealed that solvent type significantly influenced total phenolic extraction, while no significant differences were observed between the phenolic contents of B. frutescens and C. orbiculata. However, the significant interaction between solvent and plant species highlighted that extraction efficiency is species-dependent. Furthermore, the flavonoid profiles of B. frutescens and C. orbiculata differed significantly, as indicated by the Wilcoxon signed-rank test.
ICP-OES analysis showed that N. oleander extracts contain nutritionally important macro-elements, including calcium, magnesium, sodium and potassium, together with trace levels of manganese, zinc and iron. Potentially toxic elements such as lead, chromium and nickel were not detected, suggesting a favourable elemental profile. Methanol extracts contained the highest concentrations of calcium and magnesium, whereas hexane extracts were enriched with potassium.
Overall, the results highlight the importance of solvent selection in maximizing phytochemical recovery and demonstrate that these medicinal plants, particularly N. oleander, represent promising sources of antioxidant compounds and essential mineral nutrients. Further studies should focus on compound isolation, identification of individual phenolic and flavonoid constituents using chromatographic techniques, evaluation of antioxidant and biological activities, and assessment of toxicity and safety to support their development for pharmaceutical, nutraceutical and cosmeceutical applications.

Author Contributions

Conceptualization, Majorobela Motaung and Fanyana Mtunzi; methodology, Majorobela Motaung and Fanyana Mtunzi; software, Majorobela Motaung; validation, Majorobela Motaung; formal analysis, Majorobela Motaung and Imelda Ledwaba; investigation, Majorobela Motaung; resources, Fanyana Mtunzi.; data curation, Majorobela Motaung; writing—original draft preparation, Majorobela Motaung; writing—review and editing, Qcobiza Manzane and Rosemary Montle; Michael Klink; visualization, Majorobela Motaung; supervision, Fanyana Mtunzi; project administration, Fanyana Mtunzi; funding acquisition, Fanyana Mtunzi.

Funding

This research received no external funding.

Institutional Review Board Statement

N/A.

Data Availability Statement

The data reported in this study is original.

Acknowledgments

ChatGPT was used to evaluate the manuscript if the basic requirements of MDPI have been met.

Conflicts of Interest

The authors declare no conflicts of interest.

Abbreviations

The following abbreviations are used in this manuscript:
TPC Total phenolic compounds
TFC Total flavonoid content
GAE Gallic acid equivalent
QE Quercetin equivalent
FCR Forlin-Ciocalteu reagent
ND Not detactable

References

  1. Carvalho, M.T.B.; Araújo-Filho, H.G.; Barreto, A.S.; Quintans-Júnior, L.J.; Quintans, J.S.S.; Barreto, R.S.S. ‘Wound healing properties of flavonoids: A systematic review highlighting the mechanisms of action’. Phytomedicine 2021. [Google Scholar] [CrossRef] [PubMed]
  2. Vitale, S.; Colanero, S.; Placidi, M.; Emidio, G.D.; Tatone, C.; Amicarelli, F.; D’Alessandro, A.M. ‘Phytochemistry and Biological Activity of Medicinal Plants in Wound Healing: An Overview of Current Research’. Molecules 2022, 27, 3566–3595. [Google Scholar] [CrossRef] [PubMed]
  3. Dai, J.; Mumper, R.J. ‘Plant phenolics: Extraction, analysis and their antioxidant and anticancer properties’. Molecules 2010, 15(10), 7313–7352. [Google Scholar] [CrossRef] [PubMed]
  4. Shahidi, F.; Ambigaipalan, P. ‘Phenolics and polyphenolics in foods, beverages and spices: Antioxidant activity and health effects’. J. Funct. Foods 2015, 18, 820–897. [Google Scholar] [CrossRef]
  5. Panche, A.N.; Diwan, A.D.; Chandra, S.R. ‘Flavonoids: An overview’. J. Nutr. Sci. 2016, 5, 47. [Google Scholar] [CrossRef] [PubMed]
  6. Tungmunnithum, D.; Thongboonyou, A.; Pholboon, A.; Yangsabai, A. ‘Flavonoids and other phenolic compounds from medicinal plants for pharmaceutical and medical aspects: An overview’. Medicines 2018, 5(3), 93. [Google Scholar] [CrossRef] [PubMed]
  7. Marschner, P. Marschner's Mineral Nutrition of Higher Plants, 3rd ed.; Academic Press, 2012. [Google Scholar]
  8. Szentmihályi, K.; Then, M.; Cséke, E.; Vinkler, P.; Prokisch, J. ‘Mineral elements in medicinal plants and their extracts’. Acta Aliment. 2006, 35(2), 231–236. [Google Scholar] [CrossRef]
  9. Çilesizoğlu, N.B.; Yalçin, E.; Çavuşoğlu, K.; Kuloğlu, S.S. ‘Qualitative and quantitative phytochemical screening of Nerium oleander L. extracts associated with toxicity profile’. Sci. Rep. 2022, 12, 21421–21436. [Google Scholar] [CrossRef] [PubMed]
  10. Voko, M.P.; Ogbe, A.A.; Kulkarni, M.G.; Coopoosamy, R.M.; Van Staden, J. ‘The Phytochemical Composition and Molecular Mechanisms Involved in the Wound Healing Attributes of Bulbine Species—A Critical Review’. Plants 2025, 14, 3045–3073. [Google Scholar] [CrossRef] [PubMed]
  11. Zengin, G.; Cziáky, Z.; Jekő, J.; Kang, K.W.; Lorenzo, J.M.; Sivanesan, I. ‘Phytochemical Composition and Biological Activities of Extracts from Early, Mature, and Germinated Somatic Embryos of Cotyledon orbiculata L.’. Plants 2023, 12, 1062–1077. [Google Scholar] [CrossRef] [PubMed]
  12. Khatiwora, E.; Adsul, V.B.; Kulkarni, M.M.; Deshpande, N.R.; Kashalkar, V. ‘Spectroscopic determination of total phenol and flavonoid contents of Ipomoea carnea’. Int. J. ChemTech Res. 2010, 3, 1698–1701. [Google Scholar]
  13. Ramos, R.T.M.; Bezerra, I.C.F.; Ferreira, M.R.A.; Soares, L.A.L. ‘Spectrophotometric quantification of flavonoids in herbal material, crude extract, and fractions from leaves of Eugenia uniflora Linn’. Pharmacogn. Res. 2017, 253–260. [Google Scholar] [CrossRef] [PubMed]
  14. Bhuvaneshwari, L.; Arthy, E.; Anitha, C.; Dhanabalan, K.; Meena, M. Ancient Science of Life; 2007; Volume 26, pp. 24–28. [Google Scholar]
  15. Motaung, M.; Mtunzi, F.; Shooto, D.; Takaidza, S.; Monapathi, M.; Klink, M.; More, T.G.K. ‘Extraction, Optimization and Phytochemical Screening of Nerium oleander Leaves’. In Proceedings of the 2nd International Conference on Futuristic Materials for Sustainable Development Goals (FMSDG 2025). Springer Proceedings in Physics; Modise, S.J., et al., Eds.; Springer: Singapore, 2026; vol. 434. [Google Scholar]
  16. Mohadjerani, M. ‘Antioxidant activity and total phenolic content of Nerium oleander L. grown in north of Iran’. Iran. J. Pharm. Res. 2012, 11, 1121–1126. [Google Scholar] [PubMed]
  17. Ali, B.; Tijani, K.; Idris, E.; Unoyiza, U.; Junaidu, Y. ‘Nutritional Health Benefits and Bioactive Compounds of Mangifera indica L (Mango) Leaves Methanolic Extracts’. Asian Plant Res. J. 2020, 41–51. [Google Scholar] [CrossRef]
  18. Teffo, T.K.; Dukhan, S.; Ramalepe, P.; Risenga, I. ‘Possible implications of climate change on the medicinal properties of Bulbine species’. J. Pharmacogn. Phytochem. 2021, 10, 49–56. [Google Scholar] [CrossRef]
  19. Redha, A.A. ‘Phytochemical investigations of Nerium oleander L. leaves and flowers’. Int. J. Sci. Res. Chem. Sci. 2020, 7, 1–4. [Google Scholar]
  20. Shikalepo, R.; Mukakalisa, C.; Kandawa-Schulz, M.; Chingwaru, W.; Kapewangolo, P. J. Herb. Med. 2018, 12, 73–78.
  21. Aremu, A.O.; Ndhlala, A.R.; Fawole, O.A.; Light, M.E.; Finnie, J.P.; Van Staden, J. South Afr. J. Bot. 2010, 76, 558–566.
  22. Adamu, H.M.; Mshelia, E.H.; Maigari, A.U.; Umar, H.Y.; Balogun, O.L. ‘Determination of some trace elements and macro minerals in Grewia mollis plant parts’. Int. J. Pure Appl. Sci. Res. 2016, 11, 1–16. [Google Scholar]
  23. Mogos, V.T. Alimentația în bolile de nutriție și metabolism; Editura Didactică și Pedagogică: București, 1997; Vol. 1, p. 356, 391, 409, 422. [Google Scholar]
  24. Zayed, A.M.; Terry, N. ‘Chromium in the environment: Factors affecting biological remediation’. Plant Soil 2003, 249, 139–156. [Google Scholar] [CrossRef]
  25. Katz, S.A.; Salem, H. ‘The toxicology of chromium with respect to its chemical speciation: A review’. J. Appl. Toxicol. 1992, 13, 217–224. [Google Scholar] [CrossRef] [PubMed]
  26. FAO/WHO. Contaminants. In Codex Alimentarius, Vol. XVII, 1st ed.; FAO/WHO Codex Commission: Rome, 1984. [Google Scholar]
  27. Heyes, R.B. ‘The carcinogenicity of metals in humans’. Cancer Causes Control 1997, 371–385. [Google Scholar] [CrossRef] [PubMed]
  28. Khan, K.; Khan, M.; Niamat, R.; Munir, M.; Fazal, H.; Mazari, P. ‘Element content analysis of plants of genus Ficus using atomic absorption spectrometer’. Afr. J. Pharm. Pharmacol. 2011, 5, 317–321. [Google Scholar] [CrossRef]
  29. Jabeen, S.; Shah, M.T.; Khan, S.; Hayat, M.Q. ‘Determination of major and trace elements in ten important folk therapeutic plants of Haripur basin, Pakistan’. J. Med. Plants Res. 2010, 4, 559–566. [Google Scholar]
  30. Okwulehie, I.C.; Ogoke, J.A. ‘Bioactive, nutritional and heavy metal constituents of some edible mushrooms found in Abia State of Nigeria’. Int. J. Appl. Microbiol. Biotechnol. Res. 2013, 1, 7–15. [Google Scholar]
  31. Diwan, A.G.; Pradhan, A.B.; Lingojwar, D.; Krishna, K.K.; Singh, P.; Almelkar, S.I. ‘Serum zinc, chromium and magnesium levels in type-2 diabetes’. Int. J. Diabetes Dev. Ctries. 2006, 26, 122–123. [Google Scholar] [CrossRef]
  32. Wani, B.A.; Bodha, R.H.; Wani, A.H. J. Med. Plants Res. 2010, 4, 2598–2604.
  33. Kaya, I.; Incekara, N. ‘Contents of some wild plant species consumed as food in Aegean region’. J. Turk. Weed Sci. 2003, 56–64. [Google Scholar]
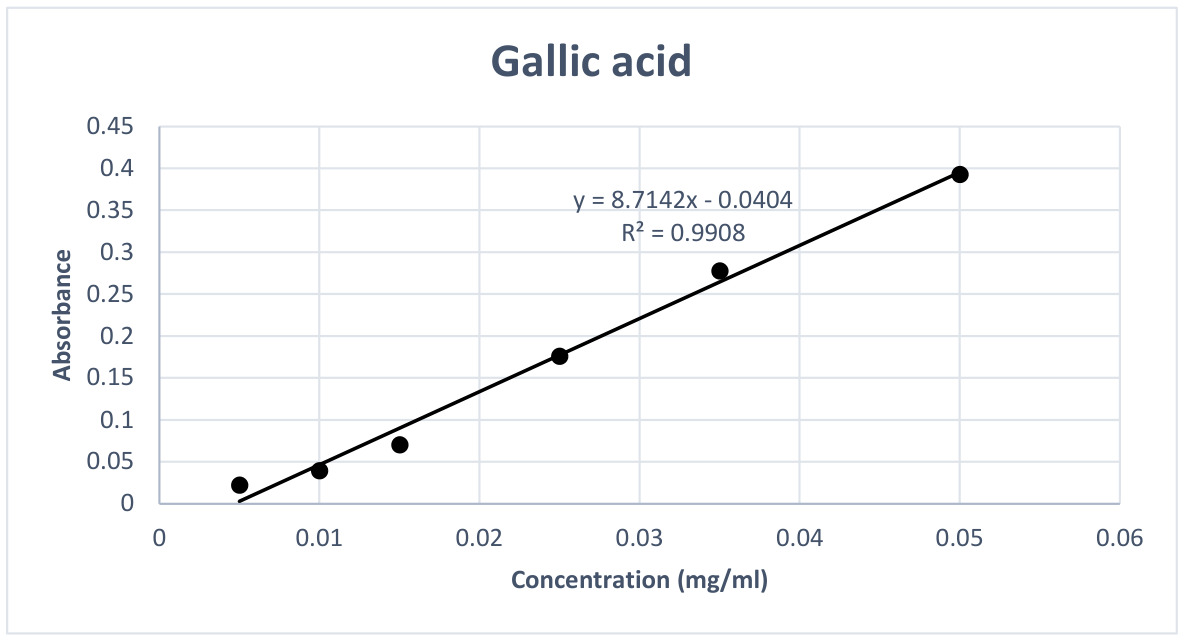
Figure 1. Gallic acid standard calibration curve for determination of total phenolic content.
Preprints 227154 g001
Figure 2. Quercetin standard calibration curve for determination of total flavonoid content.
Preprints 227154 g002
Figure 3. Total phenolic content of N. oleander, B. frutescens and C. orbiculata expressed in mg garlic acid equivalent per 100 mg sample.
Preprints 227154 g003
Figure 4. Total flavonoid content of N. oleander, B. frutescens and C. orbiculata expressed in mg quercetin equivalent per 100 mg sample.
Preprints 227154 g004
Figure 5. Normal distribution curve of the data points obtained from analysis of total phenols for B.frutescens and C.orbiculata leaves.
Preprints 227154 g005
Figure 6. Investigation of significant differences within and between plant types (Common or overlapping letters indicate no significant differences in the total phenolic content.
Preprints 227154 g006
Figure 7. Calcium (Ca) calibration curve from multi-element standard.
Preprints 227154 g007
Figure 8. Calibration curves of magnesium (Mg), sodium (Na), and potassium (K).
Preprints 227154 g008
Figure 9. Calibration curves of aluminium (Al), chromium (Cr), copper (Cu), and manganese (Mn).
Preprints 227154 g009
Figure 10. Calibration curves of nickel (Ni), zinc (Zn), iron (Fe), and lead (Pb).
Preprints 227154 g010
Figure 11. Bar chart showing macro and micro elemental nutrients analysis of N. oleander in mg/L.
Preprints 227154 g011
Table 1. Calibration curve of the Gallic acid standards for determination of the total phenolic content.
Trial 1 2 3 4 5 6
Concentration (mg/ml) 0,005 0,01 0,015 0,025 0,035 0,05
Abs 0,022 0,0392 0,0701 0,1757 0,2778 0,3925
Table 2. Calibration curve of the quercetin standard for determination of the total flavonoid content.
Trial 1 2 3 4 5 6
Concentration (mg/ml) 0,005 0,01 0,015 0,025 0,035 0,05
Abs 0,0008 0,0198 0,08 0,1871 0,3007 0,4181
Table 3. Total phenolic content of N. oleander, B. frutescens and C. orbiculta extracts expressed as garlic acid equivalents.
N.Oleander B.frutescens C.orbiculata N.Oleander B.frutescens C.orbiculata
Concentration (µg/mL)) Concentration (mg/100 g sample)
Total phenols
Water 7 10 5 0,906 0,064 0,035
Methanol 9 7 18 0,971 0,292 0,748
Ethanol 21 9 7 1,945 0,337 0,308
Acetone 23 13 21 2,445 0,541 0,886
Dichloromethane 16 35 46 6,936 0,798 1,061
Chloroform 142 18 8 5,429 0,416 0,19
Ethyl Acetate 49 12 26 1,8 0,3 0,733
Hexane 13 13 6 1,893 0,33 0,184
Table 4. Total flavonoid content of N. oleander, B. frutescens and C. orbiculta extracts expressed as quercetin equivalents.
Nerium Oleander Bulbine frutescens Cotyledon orbiculata Nerium Oleander Bulbine frutescens Cotyledon orbiculata
Concentration (µg/mL)) Concentration (mg/100 g sample)
Total flavonoids
Water 33 14 7 4,139 0,089 0,174
Methanol 85 36 22 7,796 1,625 1,157
Ethanol 89 16 8 8,155 0,707 0,539
Acetone 25 48 11 2,715 2,2 0,208
Dichloromethane 89 48 10 5,088 0,985 0,339
Chloroform 91 58 9 3,371 1,49 0,426
Ethyl Acetate 88 45 11 3,105 1,407 0,048
Hexane 68 11 8 8,793 0,292 0,02
Table 5. Descriptive statistics to determine normal distribution of total phenolic data.
Total phenols
Mean 4,1121875
Standard Error 0,628978996
Median 3,335
Mode #N/A
Standard Deviation 2,515915982
Sample Variance 6,329833229
Kurtosis -0,94028427
Skewness 0,322931098
Range 7,975
Minimum 0,345
Maximum 8,32
Sum 65,795
Count 16
Table 6. Two-way ANOVA for investigation of significant difference in total phenolic content.
Source of Variation df F P-value F crit Significance Difference
Plant 1 1,6367579 2,19E-01 4,493998 Not significantly different
Solvent 7 15,151034 5,68E-06 2,657197 Significant
Interaction 7 4,4205191 6,59E-03 2,657197 Significant
Within 16
Total 31
Table 7. Macro elemental nutrients analysis of Nerium oleander (N.oleander) extracts using ICP-OES.
Parameter Wavelength (nm) Prepared Water Methanol Acetone
Raw material (g) 50,05 50,03 50,06
Extract (g) 12,31 10,41 10,51
Ca 393,366 Intensity ND 608944 380198
Concentration (mg/L) ND 1,42 0,87
Concentration (µg/g Sample) ND 0,3 0,18
Mg 280,27 Intensity ND 50137 10870
Concentration (mg/L) ND 1,98 0,41
Concentration (µg/g Sample) ND 0,41 0,09
Na 589,592 Intensity 13947 8284 8740
Concentration (mg/L) 0,72 0,39 0,42
Concentration (µg/g Sample) 0,18 0,08 0,09
K 766,491 Intensity ND 3669 1197
Concentration (mg/L) ND 1,45 0,43
Concentration (µg/g Sample) ND 0,3 0,09
Raw material (g) 50,03 50,03 50,03
Extract (g) 3,93 3,68 14,09
Ca 393,366 Intensity 97899 284929 235384
Concentration (mg/L) 0,2 0,64 0,52
Concentration (µg/g Sample) 0,02 0,05 0,15
Mg 280,27 Intensity 2268 6468 15431
Concentration (mg/L) 0,09 0,24 0,59
Concentration (µg/g Sample) 0,01 0,02 0,17
Na 589,592 Intensity 5743 18052 9947
Concentration (mg/L) 0,24 0,96 0,49
Concentration (µg/g Sample) 0,02 0,07 0,14
K 766,491 Intensity 355,6 536,9 7066
Concentration (mg/L) 0,1 0,17 2,88
Concentration (µg/g Sample) 0,01 0,01 0,81
Table 8. Micro elemental nutrients analysis of Nerium oleander (N.oleander) extracts using ICP-OES.
Parameter Wavelength (nm) Prepared Water Methanol Acetone
Raw material (g) 50,05 50,03 50,06
Extract (g) 12,31 10,41 10,51
Al 393,366 Intensity 203,6 146,5 215,5
Concentration (mg/L) 0,1 0,04 0,12
Concentration (mg/g Sample) 0,02 0,01 0,03
Cr 280,27 Intensity 51,8 64,06 136,6
Concentration (mg/L) ND ND ND
Concentration (mg/g Sample) ND ND ND
Cu 589,592 Intensity 146,7 115,7 264,2
Concentration (mg/L) ND ND 0,01
Concentration (mg/g Sample) ND ND ND
Mn 766,491 Intensity 2557 206,4 352,8
Concentration (mg/L) 0,26 0,03 0,05
Concentration (mg/g Sample) 0,05 0,01 0,01
Extract (g) 3,93 3,68 14,09
Al 393,366 Intensity 41,98 71,88 56,05
Concentration (mg/L) ND ND ND
Concentration (µg/g Sample) ND ND ND
Cr 280,27 Intensity 52,45 49,94 56,94
Concentration (mg/L) ND ND ND
Concentration (µg/g Sample) ND ND ND
Cu 589,592 Intensity 69,4 93,55 138,4
Concentration (mg/L) ND ND ND
Concentration (µg/g Sample) ND ND ND
Mn 766,491 Intensity 53,44 85,22 92,7
Concentration (mg/L) 0,02 0,02 0,02
Concentration (µg/g Sample) 0 0 0,01
Raw material (g) 50,05 50,03 50,06
Extract (g) 12,31 10,41 10,51
Ni 231,604 Intensity 10,43 7,354 18,38
Concentration (mg/L) ND ND ND
Concentration (mg/g Sample) ND ND ND
Zn 202,548 Intensity 256,9 92,6 162,8
Concentration (mg/L) 0,2 0,07 0,12
Concentration (mg/g Sample) 0,04 0,01 0,03
Fe 259,94 Intensity 57,27 25,86 50,21
Concentration (mg/L) 0,03 0,01 0,03
Concentration (mg/g Sample) 0,01 0 0,01
Pb 283,305 Intensity 15,12 17,12 16,4
Concentration (mg/L) ND ND ND
Concentration (mg/g Sample) ND ND ND
Parameter Wavelength (nm) Prepared Chloroform Ethyl acetate Hexane
Extract (g) 3,93 3,68 14,09
Ni 231,604 Intensity 4,533 3,006 3,499
Concentration (mg/L) 0 0 0
Concentration (µg/g Sample) 0 0 0
Zn 202,548 Intensity 51,93 66,51 83,49
Concentration (mg/L) 0 0 0
Concentration (µg/g Sample) 0 0 0
Fe 259,94 Intensity 8,094 10,3 10,45
Concentration (mg/L) 0 0 0
Concentration (µg/g Sample) 0 0 0
Pb 283,305 Intensity 16,09 38,98 13,98
Concentration (mg/L) ND ND ND
Concentration (µg/g Sample) ND ND ND
Disclaimer/Publisher’s Note: The statements, opinions and data contained in all publications are solely those of the individual author(s) and contributor(s) and not of MDPI and/or the editor(s). MDPI and/or the editor(s) disclaim responsibility for any injury to people or property resulting from any ideas, methods, instructions or products referred to in the content.
Copyright: This open access article is published under a Creative Commons CC BY 4.0 license, which permit the free download, distribution, and reuse, provided that the author and preprint are cited in any reuse.