
Submitted:
06 August 2026
Posted:
07 August 2026
You are already at the latest version
Abstract
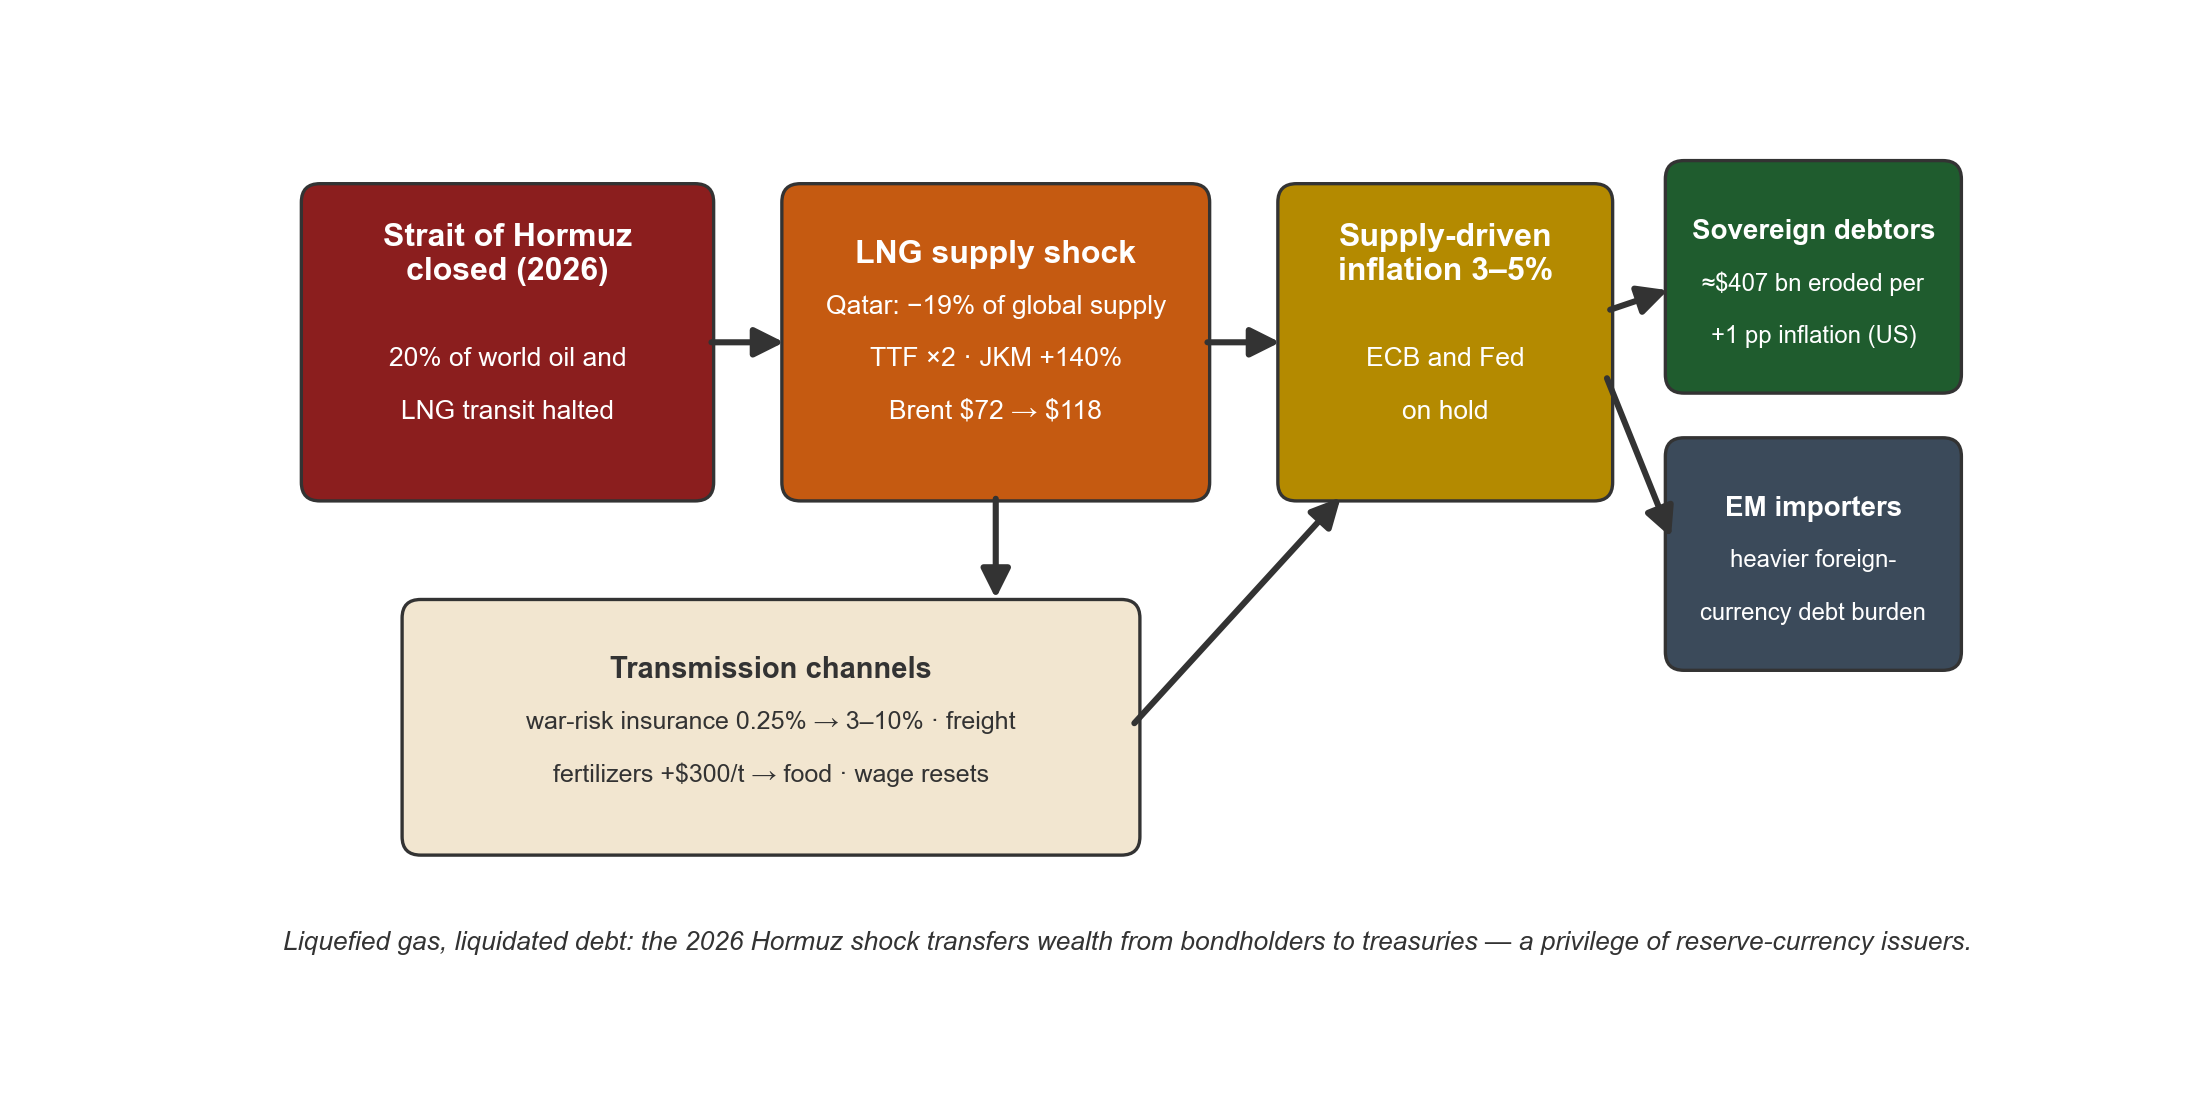
Between 28 February and 31 March 2026, Brent crude went from $72.48 to a peak of \(118.35 per barrel, the Dutch Title Transfer Facility (TTF) gas benchmark doubled, and the Asian Japan Korea Marker (JKM) spot price for liquefied natural gas (LNG) rose by more than 140%. The trigger was the war against Iran and the closure of the Strait of Hormuz, through which about one fifth of the world's oil and LNG used to pass. This article aims to explain a consequence of that shock which the energy literature and the public-debt literature have each studied on their own but almost never together: supply-driven inflation quietly erodes the real value of sovereign liabilities. Three days before the first airstrikes, the Institute of International Finance reported a record \)348 trillion in global debt. We trace the transmission channels of the 2026 shock (LNG supply, shipping and war-risk insurance, fertilizers and food), review the dilemma it created for the European Central Bank (ECB) and the Federal Reserve, and compute a simple liquidation arithmetic: each percentage point of unanticipated inflation transfers roughly $407 billion from bondholders to the United States Treasury alone. The article argues that the observed tolerance of 3-5% inflation in 2026 is best read as the initial phase of a financial-repression regime, and that this liquidation channel is a privilege of reserve-currency issuers, while energy-importing emerging economies suffer the opposite effect.
Keywords:
liquefied natural gas
; Strait of Hormuz
; supply shocks
; inflation
; public debt
; financial repression
; fiscal dominance
1. Introduction
From 2022 to 2025, the world economy seemed to have digested its second energy crisis of the decade. Europe had replaced Russian pipeline gas with seaborne liquefied natural gas (LNG), the United States had become the largest LNG exporter, and headline inflation in the Organisation for Economic Co-operation and Development (OECD) area was drifting back toward target. Then came 28 February 2026. The joint US-Israeli air campaign against Iran, and the Iranian answer of declaring the Strait of Hormuz closed to tanker traffic, produced in five weeks a price shock that most observers had treated as a tail scenario: Brent up 55%, European gas prices doubled, and the largest LNG exporter of the previous two decades, Qatar, out of the market.
This is not, at bottom, an oil story. The vulnerability that 2026 exposed is a gas story. By the time of the attack, the strait carried close to 20% of globally traded LNG in addition to a fifth of the world's petroleum, and the strike of 18 March on the Ras Laffan complex removed around 17% of Qatari liquefaction capacity for an estimated three to five years. Oil has strategic reserves, a deep tanker market and substitute routes. LNG has none of these in comparable measure. That's why the crisis of 2026 travelled through gas-importing economies, fertilizer plants and food prices with such speed.
But there is a second story underneath, and it is the one this article is really about. Three days before the first missile was fired, on 25 February 2026, the Institute of International Finance published its Global Debt Monitor: $348 trillion in global debt at the end of 2025, an increase of $29 trillion in a single year. General government debt stood near 121% of GDP in the United States, around 88-90% in the euro area, and above 200% in Japan (IMF 2026). Economies with that debt overhang do not experience an inflationary supply shock the way textbook models assume. For the sovereign debtor, unexpected inflation is not only a cost; it is also a transfer. Every point of inflation above the nominal interest rate on outstanding bonds reduces the real value of public liabilities without any parliament having to vote for it.
The mechanism is an old one. Reinhart and Sbrancia (2015) show, on a twelve-country sample, that between 1945 and 1980 negative real interest rates combined with inflation delivered annual interest savings of 1 to 5% of GDP and quietly liquidated the war debts of the advanced economies. Aizenman and Marion (2011) computed that the US debt ratio of 108.6% of GDP in 1946 was cut by more than a third within a decade, largely through this channel, and predicted that a comparable overhang would generate a temptation of roughly 5% inflation for several years. The overhang of 2026 is larger than the one they modelled.
The research question follows directly: how does the disruption of LNG supply generate supply-side inflation, and to what extent does that inflation operate as a liquidation mechanism for the accumulated public debt of the borrowing states? We approach the question as political economy, not as forecasting. Section 2 sets out the two bodies of literature the argument draws on; Section 3 reconstructs the 2026 shock and its transmission channels with verified data; the monetary-policy dilemma is in Section 4, the liquidation arithmetic in Section 5, and we discuss the distributive and geopolitical implications in Section 6.
2. Two Literatures That Rarely Meet
2.1. Energy Supply Shocks and Inflation
The macroeconomic implications of energy shocks have a long history that goes back to Hamilton (1983) and Kilian (2009). Kilian explained that fluctuations in oil prices are not the same; disruption of supply has different effects from changes in demand. The event in 2026 is one of the most significant pure supply shocks since World War II, like the 1973 and 1979 events (Blinder and Rudd, 2013). To determine the geopolitical aspect, Caldara and Iacoviello (2022) provide a standard index, while Olanipekun et al. (2020) use a nonlinear autoregressive distributed lag (NARDL) model with data over the period 1975-2018 to show that increasing geopolitical risk reduces crude production in the Persian Gulf in the short term (similar to what happened in March 2026).
On the natural gas side, the European crisis of 2022 has generated literature with direct implications. Emiliozzi, Ferriani, and Gazzani (2024) study how Europe's driven shift to LNG transformed the global gas market, linking the TTF benchmark to the Asian spot prices. Albrizio et al. (2025) show how the hardship of a total Russian shut-off is distributed, and that trade integration is effective to reduce individual importers' losses; in 2026 that buffer evaporated because the shock hit a common supplier, Qatar. Auclert et al. (2023) highlight an important point relevant to Section 4. In heterogeneous-agent models with realistic substitution elasticities, an energy price shock tends to induce recessionary effects for importing countries; monetary policy changes in one country have little impact on imported inflation. Coccia et al. (2025) also show that contractionary responses exacerbate inequality and make households more vulnerable. We will revisit these distributional outcomes later since private purchasing power is affected alongside sovereign debt relief.
2.2. Debt Liquidation and Financial Repression
The second pillar is informed by existing research on how nations manage to reduce debt without declaring default. Reinhart and Rogoff (2009) outlined various strategies; Reinhart and Sbrancia (2012, 2015) identified the less obvious method. Financial repression (the setting of negative or subpar real interest rates to a captive group of bondholders) is known to be most effective in lowering debt when combined with inflation. Becker and Ivashina (2017) point to one such example of this captive audience today: domestic banks' holdings of their own government's bonds during the euro crisis led to a significant decrease in corporate lending.
Two critical qualifications temper this argument. Hilscher, Raviv, and Reis (2022) show by examining the maturity distribution of privately owned US debt and option-implied inflation trends that unexpected inflation does not alleviate the debt burden as much as intuition suggests; the majority of US debt is in short maturities and bondholders can quickly adjust their prices to better price them. Teles et al. (2024) also get a similar result in terms of optimal policy theory: in the case of very large fiscal shocks, the ideal inflation should be slow, large, and sustained, and this works if the maturity of the debt is realistically long. The point is that liquidation must not be seen as one of the moment, but rather as an ongoing process, one that has to be maintained in the long run, and the price is not short but constant and the interest rates must remain at a level that is kept low and it is not surprise.
As for fiscal dominance, Dufrénot, Jawadi, and Khayat (2018) argue that such a regime does not necessarily cause hyperinflation. Bianchi and Melosi (2022) also point out that inflation is a limitation for fiscal policy without fiscal support. Cochrane (2023) provides a more general framework in which price levels are used to make financial adjustments.
But neither body of literature really intersects in the event. Energy economists only analyze inflation rates while debt economists start from that point. The Hormuz shock of 2026 is a solid link between these two fields and, in our opinion, is among the first to look into this connection.
3. Anatomy of the 2026 Shock
3.1. Five Weeks in Spring
The timeline is significant so we present it clearly. On 28 February 2026, the United States and Israel launched an air campaign against Iran. QatarEnergy suspended operations at Ras Laffan on 2 March due to Iranian drone attacks. Goldman Sachs estimated that this would affect 19% of the immediate global LNG supply, and the April Title Transfer Facility (TTF) contract surged 35% in 1 day. Iran declared the Strait closed on 4 March and began attacks on ships entering it and in 2 weeks maritime traffic dropped 94%. The loss of Gulf oil production was now 10 million barrels per day as of 12 March. On March 18, Iranian missiles directly targeted the liquefaction facilities at Ras Laffan. Brent crude prices reached a high of $118.35 on March 31. A partial de-escalation was declared on May 5 but this did not last and further hostilities in July saw Brent prices up to $100 by July 23. Table 1 summarizes the important indicators.
Two features distinguish this shock from 1973 and 1979. The first is that gas, not oil, was the binding constraint: oil found substitute barrels and routes within months, while the loss of Qatari liquefaction capacity is measured in years. The second is timing on the demand side. The European Union had adopted, in October 2025, a full ban on Russian LNG - short-term contracts prohibited from 25 April 2026 and all imports from 1 January 2027. Europe thus entered March 2026 having legislated away its second-largest LNG supplier weeks before the war removed its largest. Energy-security policy, designed against one adversary, reduced resilience against another. We do not know of a precedent for this particular own goal.
3.2. Transmission Channels
The shock propagated through four channels, and each one has its own literature to lean on. (a) Logistics and insurance. War-risk premiums for Gulf transits rose from about 0.25% of hull value before the war to between 3% and 10% by July 2026; a $100 million tanker that used to pay $250,000 per transit now pays $3-10 million. Tanker earnings on some routes exceeded $500,000 per day at the worst moments, and much of the remaining traffic diverted around the Cape of Good Hope, adding weeks and fuel. Palaios, Triantafyllou and Zombanakis (2024) had documented, before the war, how tightly geopolitical uncertainty and LNG freight rates are connected; 2026 turned their connectedness estimates into headlines.
(b) LNG supply and the scramble for cargoes. With Ras Laffan down, Asian importers went into the spot market. South Korea held roughly 3.5 million tons of LNG in storage at the outbreak and Japan about 4.4 million - two to four weeks of stable demand. Vivoda (2019) had ranked precisely these countries by import-portfolio concentration; the rankings read, after February 2026, like a vulnerability map. The bidding war between Asia and Europe diverted cargoes away from the Atlantic, which is how a Persian Gulf conflict doubled the price of gas in Rotterdam.
(c) Fertilizers and food. Natural gas is the feedstock of ammonia, and fertilizer is not a marginal cost of food: Gnutzmann et al. (2016), identifying through the oil-gas spread, put the fertilizer share at 44% of food commodity cost. Middle East producers supplied about a quarter of globally traded ammonia; shipments stopped on 12 March. US anhydrous ammonia rose almost $300 per ton between February and April. Vatsa et al. (2023) find, with a structural vector autoregression (VAR), that cereal-price responses to such shocks are fast but usually transitory - a useful caution, though their sample contains no episode in which the feedstock, the shipping route and the exporting region were hit simultaneously.
(d) Expectations and second-round effects. By April, euro-area negotiated wages and administered prices were being reset against a 3% headline forecast for 2026 rather than 2%. This is the channel through which a relative-price shock becomes a nominal one, and it is where the interests of the treasury and of the wage-earner begin to diverge - the subject of Section 5.
3.3. Winners and Losers
The distribution of gains was determined by one variable: net export position in molecules. The United States, whose LNG export capacity was moving from 17 to above 19 billion cubic feet per day during 2026 as the Plaquemines, Corpus Christi and Golden Pass projects ramped up, sold every incremental cargo at crisis prices. Norway, Australia and Canada shared the windfall. Vivoda (2022) shows that the five largest exporters already accounted for three quarters of global supply before the war; the crisis concentrated the rent further. On the losing side stand Japan, South Korea, Taiwan, India and the European Union - and, more severely, energy-importing emerging economies without reserve currencies, to which we return in Section 6.
4. The Monetary Dilemma of 2026
Central banks met the shock with the instruments of demand management, and the mismatch was visible within weeks. On 19 March 2026 the European Central Bank (ECB) postponed the rate reductions it had been signalling, raised its 2026 inflation projection toward 3% and cut its growth projection to under 1%. The Federal Reserve held rates as markets priced out cuts; the ten-year Treasury yield touched 4.46% on 27 March. Analysts were openly discussing whether the ECB might raise interest rates when the economy started to falter in June. The Bank of England had projections of inflation above 5%.
As we discussed in Section 2, this situation is due to the nature of the shock rather than a lack of resolve. Higher policy rates can lower domestic demand but don’t alleviate bottlenecks or restore liquefaction processes. In the view of Auclert et al. (2023), tightening measures on their own do not have a significant impact on imported inflation and only have a significant impact when importers coordinate their actions, which is politically unfeasible in 2026 because the US (a net beneficiary) and Europe (a huge loser) have different economic situations. Coccia et al. (2025) analyze the negative effects of tightening during a supply shock, such as deeper recessions, heightened inequality, and more vulnerable households. Given these calculations, both major central banks chose patience—and effectively opted to endure a period of inflation between 3% and 5% rather than forcing it down to 2% at the expense of triggering a recession.
The standard reading of that choice is prudence. This article proposes a complementary reading: tolerance. For a treasury carrying 121% of GDP in debt, inflation at 4% with policy rates at 4.5% and average coupon rates below 3% is not an emergency. It is relief.
5. The Liquidation Arithmetic
How large is the relief? The mechanism is mechanical enough to compute in a first approximation. Let D be the stock of nominal government debt held by the public and let pi_u be inflation in excess of what was priced into the interest rate at issuance. The one-year transfer from bondholders to the sovereign is approximately D times pi_u. The qualifications - maturity structure, indexed debt, the speed with which new issuance reprices - all reduce the number, and Hilscher, Raviv and Reis (2022) show they reduce it substantially for the US. What they do not do is change its sign or its addressee. Table 2 reports the computation for the three largest debtors.
There are three key points to bear in mind. First, the economic implications are very real, even discounting them at such a huge level: if only one third of the original US estimate holds up under maturity changes, a 5-point inflation episode could move $650 billion from savers to the Treasury in a single year (about the same as a defense budget) and collected without legislative action. Second, the history is not a matter of theoretical abstraction as the liquidation period from 1945 to 1980 yielded interest savings of 1-5% of GDP annually in most advanced countries (Reinhart and Sbrancia, 2015), and the inflation episode of 2021 to 2023 already reduced debt ratios by a few points before disinflation. Third and last is that the continuation of this transfer is still dependent on nominal interest rates below inflation for a long time, not just a few months. A one-time surprise cannot do this; it takes a policy regime that is maintained over time. Reinhart and Sbrancia (2012) give a brief summary of the historical strategies that have been employed: captive domestic investors, regulatory preferences for government bonds and moral pressure against banks. Becker and Ivashina (2017) describe recent developments in the euro area.
This is where the 2026 conjuncture becomes analytically interesting. A supply shock that central banks correctly judge they cannot fight without deep recession provides the cover under which below-inflation real rates are not a scandal but a prudence. Dufrénot, Jawadi and Khayat (2018) show that such a regime of weak fiscal dominance can be stable, with inflation settling at the level that stabilizes the debt ratio rather than at the announced target. Our hypothesis, stated so that future data can refute it, is that the 2026 tolerance of 3-5% inflation in the large debtor economies is the initial phase of precisely such a regime, and that ex post real returns on 2024-2026 vintage government bonds will turn out significantly negative over their holding period.
6. Discussion
The liquidation channel is a privilege, and the privilege has a passport. It works for sovereigns that borrow long-term, in their own currency, from holders who cannot easily exit. The United States, Japan and the euro-area core qualify. Energy-importing emerging economies experience the same shock with the opposite sign: imported inflation raises their local-currency rates, depreciates their exchange rate, and increases the real burden of dollar-denominated debt. Pakistan is the textbook case - Malik et al. (2020) quantified its energy-security fragility well before the 2021 spot-price episode pushed it toward crisis, and 2026 repeated the pattern with larger numbers. Early modelling of the 2026 shock for import-dependent African economies points the same way (Ahinsah-Wobil 2026). The distributive geography of an LNG shock is therefore triple: from importers to exporters across countries; from savers to treasuries inside the debtor economies; and from wage earners to everyone indexed, inside every importing economy. The literature has treated these separately. They are one event.
For the European Union, the 2026 experience carries a specific institutional lesson. The Russian-LNG ban and the Qatari outage were independent decisions by independent actors, but they landed on the same import portfolio within sixty days. Diversification metrics of the kind Vivoda (2019) computes were treated, in the 2025 policy debate, as an argument that the ban was affordable. They were static metrics; the shock was dynamic. Energy-security policy that optimizes against the last adversary can finance the vulnerability the next one exploits - an argument developed in general terms by Goldthau and Youngs (2023) and given empirical teeth by the events narrated in Section 3. Kim et al. (2025) arrive at a forward-thinking conclusion: the only diversification that really works against chokepoint geopolitics is the one that reduces the share of gas and oil molecules in the energy mix.
This is uncomfortable for fiscal and monetary institutions, but it also implies uncomfortable truths about incentives rather than conspiracy theories. In March 2026, there was no committee that decided to cut the debt through inflation. But when the distribution of costs and benefits in the state is in a particular direction (4% inflation saves the treasury tens of billions, bondholders and pensioners lose billions of dollars) the onus is on those who argue that this tolerance is temporary. Bianchi and Melosi (2022) formalized this mechanism; 2026 provided a real-world example. We would like to take the actual real return on government debt from 2026 to 2030, instead of only the projected inflation targets as our evaluation.
7. Conclusions
The 2026 crisis in the Strait of Hormuz also highlighted that liquefied natural gas represents a critical limitation of the present energy system: it is much harder to store than oil, it is even harder to reroute, and has a fifth of world supply concentrated in a single exporter whose facilities can be attacked by drones. In weeks, this disrupted European gas prices, Asian reserve stocks, ammonia production facilities, and food prices, and the ECB and Fed were in a position where interest rates did not solve the problem.
This article reflects on that inflationary time in view of the $348 trillion debt stock reported three days before the first airstrikes. The supply shock triggered inflation, while the debt burden determines who benefits. In our analysis, each percentage point of unanticipated inflation transfers about $407 billion to the U.S. Treasury before adjustments are made, and data from 1945-1980 show that sustained instances of such transfers have previously eliminated comparable debt burdens. In our title, we are playing with words: gas gets liquefied and debt is liquidated.
These conclusions are based on preliminary arithmetic involving stocks being changed and prices being changed. They do not apply automatically to economies that borrow in foreign currencies; for these countries, that kind of shock may tighten rather than relieve budget constraints. What we are providing is a testable alternative to the policy of 2026, where inflation tolerance is seen as a form of financial repression, which can be confirmed or disproven by bond returns in the next five years. We also point out that policies related to energy security and debt sustainability, currently in different ministries, are now a single transmission channel, directly linked to the Strait of Hormuz.
Author Contributions
Conceptualization, J.A.R.M.; methodology, J.A.R.M. and E.A.G.B.; investigation and data curation, E.A.G.B.; validation, E.A.R.F. and M.A.S.P.; writing-original draft preparation, J.A.R.M.; writing-review and editing, E.A.R.F. and M.A.S.P.; supervision, J.A.R.M. All authors have read and agreed to the published version of the manuscript.
Funding
This research received no external funding.
Data Availability Statement
The data presented in this study are openly available in Zenodo at https://doi.org/10.5281/zenodo.21762187 (compiled dataset of the 2026 Hormuz-shock market indicators and the sovereign debt-erosion computation). The dataset was compiled by the authors from publicly available sources (U.S. EIA, IMF Fiscal Monitor April 2026, IIF Global Debt Monitor February 2026, ECB and financial press), as cited in the article.
Conflicts of Interest
The authors declare no conflicts of interest.
References
- Ahinsah-Wobil, Isaac. Systemic risk assessment of geopolitical energy shocks: A macroprudential stress-test framework for Strait of Hormuz disruption and cross-border transmission to sovereign debt markets. SSRN working paper. 2026. [Google Scholar] [CrossRef]
- Aizenman, Joshua; Marion, Nancy. Using inflation to erode the US public debt. J. Macroecon. 2011, 33, 524–41. [Google Scholar] [CrossRef]
- Albrizio, Silvia; Bluedorn, John; Brasier, Robert; Koch, Christoffer; Pescatori, Andrea; Stuermer, Martin. Trade integration and supply disruptions: Sharing the pain from a Russian gas shut-off to Europe. Energy J. 2025, 46, 1–24. [Google Scholar] [CrossRef]
- Auclert, Adrien; Monnery, Hugo; Rognlie, Matthew; Straub, Ludwig. Managing an energy shock: Fiscal and monetary policy; NBER Working Paper 31543; 2023. [Google Scholar]
- Becker, Bo; Ivashina, Victoria. Financial repression in the European sovereign debt crisis. Rev. Financ. 2017, 22, 83–115. [Google Scholar] [CrossRef]
- Bianchi, Francesco; Melosi, Leonardo. Inflation as a fiscal limit. Paper presented at the Jackson Hole Economic Policy Symposium, Jackson Hole, WY, USA, 2022. [Google Scholar]
- Blinder, Alan S.; Rudd, Jeremy B. The supply-shock explanation of the Great Stagflation revisited. In The Great Inflation: The Rebirth of Modern Central Banking; University of Chicago Press: Chicago, 2013; pp. 119–75. [Google Scholar]
- Caldara, Dario; Iacoviello, Matteo. Measuring geopolitical risk. Am. Econ. Rev. 2022, 112, 1194–225. [Google Scholar] [CrossRef]
- Cochrane, John H. The Fiscal Theory of the Price Level; Princeton University Press: Princeton, 2023. [Google Scholar]
- Coccia, Samantha; Russo, Alberto. Inflation, inequality and financial vulnerability: Monetary vs. fiscal policy in the face of an energy shock. Energy Econ. 2025, 143, 108222. [Google Scholar] [CrossRef]
- Dufrénot, Gilles; Jawadi, Fredj; Khayat, Guillaume. A model of fiscal dominance under the Reinhart Conjecture. J. Econ. Dyn. Control 2018, 93, 332–45. [Google Scholar] [CrossRef]
- Emiliozzi, Simone; Ferriani, Fabrizio; Gazzani, Andrea. The European energy crisis and the consequences for the global natural gas market. Energy J. 2024, 46, 119–45. [Google Scholar] [CrossRef]
- Gnutzmann, Hinnerk; Spiewanowski, Piotr. Fertilizer fuels food prices: Identification through the oil-gas spread. In SSRN Working Paper; 2016. [Google Scholar] [CrossRef]
- Goldthau, Andreas; Youngs, Richard. The EU energy crisis and a new geopolitics of climate transition. JCMS J. Common Mark. Stud. 2023, 61, 1–13. [Google Scholar] [CrossRef]
- Hamilton, James D. Oil and the macroeconomy since World War II. J. Political Econ. 1983, 91, 228–48. [Google Scholar] [CrossRef]
- Hartvig, Áron Dénes; et al. The economic and energy security implications of the Russian energy weapon. Energy 2024, 294, 130972. [Google Scholar] [CrossRef]
- Hilscher, Jens; Raviv, Alon; Reis, Ricardo. Inflating away the public debt? An empirical assessment. Rev. Financ. Stud. 2022, 35, 1553–95. [Google Scholar] [CrossRef]
- Institute of International Finance (IIF). Global Debt Monitor; IIF: Washington, DC, 25 February 2026. [Google Scholar]
- International Monetary Fund (IMF). Fiscal Monitor: Fiscal Policy under Pressure - High Debt, Rising Risks; IMF: Washington, DC, 2026. [Google Scholar]
- Kilian, Lutz. Not all oil price shocks are alike: Disentangling demand and supply shocks in the crude oil market. Am. Econ. Rev. 2009, 99, 1053–69. [Google Scholar] [CrossRef]
- Kim, Jaden; Jaumotte, Florence; Panton, Augustus J.; Schwerhoff, Gregor. Energy security and the green transition. Energy Policy 2025. [Google Scholar] [CrossRef]
- Malik, Sadia; Qasim, Maha; Saeed, Hasan; Chang, Youngho; Taghizadeh-Hesary, Farhad. Energy security in Pakistan: Perspectives and policy implications from a quantitative analysis. Energy Policy 2020, 144, 111552. [Google Scholar] [CrossRef]
- Olanipekun, Ifedolapo Olabisi; Alola, Andrew Adewale. Crude oil production in the Persian Gulf amidst geopolitical risk, cost of damage and resources rents: Is there asymmetric inference? Resour. Policy 2020, 69, 101873. [Google Scholar] [CrossRef]
- Palaios, Panagiotis; Triantafyllou, Athanasios; Zombanakis, George. Economic and geopolitical uncertainty vs energy variables: Exploring connectedness in the LNG freight market. Marit. Policy Manag. 2024, 52, 287–308. [Google Scholar] [CrossRef]
- Reinhart, Carmen M.; Rogoff, Kenneth S. This Time Is Different: Eight Centuries of Financial Folly; Princeton University Press: Princeton, 2009. [Google Scholar]
- Reinhart, Carmen M.; Sbrancia, M. Belen. The return of financial repression. Financ. Stab. Rev. 2012, 16, 37–48. [Google Scholar]
- Reinhart, Carmen M.; Sbrancia, M. Belen. The liquidation of government debt. Econ. Policy 2015, 30, 291–333. [Google Scholar] [CrossRef]
- Teles, Pedro; Tristani, Oreste. The monetary financing of a large fiscal shock. J. Monet. Econ. 2024, 147, 103630. [Google Scholar] [CrossRef]
- Vatsa, Puneet; Miljkovic, Dragan; Baek, Jungho. Linkages between natural gas, fertiliser and cereal prices: A note. J. Agric. Econ. 2023, 74, 935–40. [Google Scholar] [CrossRef]
- Vivoda, Vlado. LNG import diversification and energy security in Asia. Energy Policy 2019, 129, 967–74. [Google Scholar] [CrossRef]
- Vivoda, Vlado. LNG export diversification and demand security: A comparative study of major exporters. Energy Policy 2022, 170, 113218. [Google Scholar] [CrossRef]

Table 1.
The 2026 Hormuz shock: key market indicators.
| Indicator | Pre-war level | Crisis level | Reference date |
| Brent crude (USD/bbl) | 72.48 (27 Feb) | 118.35 (peak) | 31 March 2026 |
| TTF gas (EUR/MWh) | ~30-33 | >60 (doubled) | mid-March 2026 |
| JKM Asian LNG spot (USD/MMBtu) | ~15 | ~25 (+140% at peak) | March 2026 |
| War-risk premium (% of hull value) | 0.25 | 3-10 | July 2026 |
| VLCC freight, Gulf-China (USD/bbl) | 1.35 | 1.67 (+24% in one day) | March 2026 |
| US anhydrous ammonia (USD/ton) | 843 (20 Feb) | 998; +$300 by April | Feb-Apr 2026 |
| Global LNG supply growth 2026 (%) | +11 projected | +1 realized projection | 2026 |
| Hormuz transit (share of world oil / LNG) | 20% / 20% | traffic -94% | March 2026 |
※ Approximate figures compiled from the U.S. Energy Information Administration (EIA), Bloomberg, S&P Global and press reports - verify against final 2026 statistical releases. TTF = Title Transfer Facility; JKM = Japan Korea Marker; VLCC = very large crude carrier; LNG = liquefied natural gas.
Table 2.
First-approximation real erosion of general government debt from unanticipated inflation, 2026 stocks.
Table 2.
First-approximation real erosion of general government debt from unanticipated inflation, 2026 stocks.
| Economy | Debt/GDP 2025 (%) | Debt stock (local currency) | Erosion per 1 pp surprise | At 5 pp (Aizenman-Marion scenario) |
| United States | 121 | USD 40.7 trillion | USD ~407 billion | USD ~2.0 trillion |
| Euro area | ~89 | EUR ~13.8 trillion | EUR ~138 billion | EUR ~690 billion |
| Japan | 204 | JPY ~1,240 trillion | JPY ~12.4 trillion | JPY ~62 trillion |
| Memo: 1946 US precedent | 108.6 | - | - | ratio cut by one third in a decade |
※ Stocks from the International Monetary Fund (IMF) Fiscal Monitor (April 2026) and the Institute of International Finance (IIF) Global Debt Monitor (February 2026); upper-bound computation, before maturity and indexation adjustments in the sense of Hilscher et al. (2022). Verify stocks against final Fiscal Monitor tables.
Disclaimer/Publisher’s Note: The statements, opinions and data contained in all publications are solely those of the individual author(s) and contributor(s) and not of MDPI and/or the editor(s). MDPI and/or the editor(s) disclaim responsibility for any injury to people or property resulting from any ideas, methods, instructions or products referred to in the content. |
© 2026 by the authors. Licensee MDPI, Basel, Switzerland. This article is an open access article distributed under the terms and conditions of the Creative Commons Attribution (CC BY) license.
Copyright: This open access article is published under a Creative Commons CC BY 4.0 license, which permit the free download, distribution, and reuse, provided that the author and preprint are cited in any reuse.


