
Submitted:
05 August 2026
Posted:
07 August 2026
You are already at the latest version
Abstract
Powdered solid endosperm of Cocos nucifera L. from Lolak, North Sulawesi, Indonesia, was retrospectively evaluated using an archived gas chromatography–mass spectrometry (GC–MS) dataset to establish a preliminary, confidence-qualified lipid fingerprint. Seventy-one integrated peaks were recorded between 6.07 and 31.84 min, with a total chromatographic area of 837,283,420.185 counts·min. The profile was dominated by a late-eluting region from 25.42 to 30.46 min, representing 86.01% of the normalized area. Recurrent library matches to dodecanoic acid, 1,2,3-propanetriyl ester were interpreted collectively as a laurate-associated glyceride-rich region rather than as repeated confirmation of a single triacylglycerol. More coherent signals were tentatively assigned to dodecanoic, tetradecanoic, and hexadecanoic acids, while a C18:1 peak was reported as an unresolved octadecenoic acid isomer. Several peaks were tentatively classified as glycidol fatty-acid ester-related signals, but no quantitative or safety inference was made. Steroid-, spirostane-, phospholipid-, and amide-related candidates were considered structurally ambiguous. Because authentic standards, experimental retention indices, blanks, raw vendor files, and replicate analyses were unavailable, all annotations remain provisional. The findings provide a regional GC–MS baseline for coconut solid endosperm and highlight the need for targeted fatty-acid analysis and LC–MS-based lipidomics.
Keywords:
Cocos nucifera
; coconut solid endosperm
; GC–MS fingerprinting
; lipid profiling
; dodecanoic acid
; triacylglycerols
; glycidol fatty-acid esters
; tentative annotation
1. Introduction
Cocos nucifera L. is an economically important tropical palm whose fruit provides food ingredients, edible oil, beverages, fiber, and other commercially valuable materials. The edible solid endosperm, also described as coconut kernel, meat, pulp, or flesh, develops as the fruit matures and becomes progressively thicker and richer in lipid. Recent metabolomic research has shown that the composition of solid endosperm is not static, because its lipid, protein, carbohydrate, and metabolite profiles may change with maturity and postharvest storage [1]. Coconut kernel, coconut milk, coconut powder, and coconut oil should therefore be regarded as compositionally related but analytically distinct matrices rather than interchangeable forms of the same material [2].
Lipids are among the principal constituents of mature coconut solid endosperm. Coconut-derived fats are characterized by a high proportion of saturated fatty acids, particularly dodecanoic acid, commonly known as lauric acid, together with octanoic, decanoic, tetradecanoic, hexadecanoic, and smaller proportions of unsaturated C18 fatty acids [3]. The lipid profile may nevertheless vary among genotypes, anatomical fractions, maturity stages, postharvest treatments, and extraction procedures. A study of coconut testa oils demonstrated measurable genotype-dependent differences in fatty-acid composition and physicochemical characteristics, indicating that even closely associated tissues within the coconut kernel may not have identical lipid profiles [4].
Coconut lipids occur predominantly as triacylglycerols rather than as unesterified fatty acids. Modern lipidomic analysis has revealed that coconut-derived products contain numerous triacylglycerol molecular species composed of different combinations of medium- and long-chain acyl groups. In coconut-based beverages, triacylglycerols containing decanoic, dodecanoic, and tetradecanoic residues were among the characteristic lipid species [5]. The complexity of coconut-oil lipid profiles has also been demonstrated by high-resolution mass spectrometry, which showed that extraction with different conventional and alternative solvents can alter the relative distribution of triacylglycerols, partial glycerides, and minor lipid components [6].
The predominance of medium-chain acyl groups makes coconut oil a useful substrate for the preparation of structured lipids. Enzymatic studies have used coconut-oil-derived fatty-acid esters to synthesize triacylglycerols containing medium-chain fatty acids at selected glycerol positions [7]. Coconut oil has also been incorporated into interesterified lipid blends to generate medium- and long-chain triacylglycerol species with modified physical properties [8]. These investigations demonstrate that coconut-derived fats contain a structurally diverse glyceride matrix whose individual molecular species cannot be described adequately by fatty-acid composition alone.
The chemical composition of the whole coconut kernel is also more complex than that of isolated coconut oil. Kernel flakes, coconut milk preparations, and oil differ in their relative contributions of lipid, protein, carbohydrate, fiber, and water-soluble constituents [9]. Human metabolic studies have consequently treated coconut oil, coconut kernel, and coconut milk powder as distinct dietary preparations [2]. Although nutritional effects are outside the scope of chemical fingerprinting, these studies reinforce the need to define the analyzed coconut matrix precisely and to avoid extrapolating results obtained from purified oil directly to powdered solid endosperm.
Gas chromatography–mass spectrometry is widely used to characterize volatile and semivolatile constituents, free fatty acids, fatty-acid esters, and thermally amenable lipid-related compounds in botanical and food matrices. However, intact triacylglycerols and other high-molecular-weight lipids present substantial analytical challenges because of limited volatility, thermal behavior, co-elution, complex fragmentation, and incomplete representation in conventional electron-ionization libraries. The presence of broad or incompletely resolved late-eluting regions can therefore produce several adjacent peaks with similar or competing glyceride-related library matches. Differences among automated peak-detection and spectral-matching algorithms can further alter the number of reported features and their proposed identities [10].
Library searching provides candidate identities by comparing an experimental spectrum with reference spectra, but the first-ranked result is not equivalent to structural confirmation. Spectral similarity should be evaluated together with retention behavior, diagnostic ions, candidate coherence, blank analyses, and authentic standards. Recent work has shown that retention-index scoring assumptions may influence candidate ranking and that compound-specific error distributions should be considered when interpreting GC–MS annotations [11]. Retention indices provide valuable supporting evidence, but an apparently close retention-index match cannot independently establish molecular identity [12].
Uncertainty increases when many features are searched simultaneously against a large library. Statistical approaches for estimating false discovery rates have demonstrated that apparently acceptable spectral matches may still include incorrect candidates, particularly in complex matrices [13]. Web-based platforms such as GCMS-ID improve candidate prioritization by incorporating predicted electron-ionization spectra and retention properties, but their performance remains dependent on chromatographic quality and the availability of representative reference compounds [14]. Accordingly, lipid-related GC–MS results are more defensibly reported using confidence-qualified expressions such as “tentatively annotated”, “isomer unresolved”, or “glyceride-related signal” when independent confirmation is unavailable.
Particular caution is required for library candidates assigned as glycidyl fatty-acid esters. These compounds are recognized process-related contaminants that may form during high-temperature refining and heating of edible oils. Their reliable determination generally requires validated targeted methods, appropriate purification, calibration standards, and tandem mass spectrometry [15]. Recent LC–MS/MS procedures have therefore been developed specifically for the quantitative determination of glycidyl esters in complex edible-oil matrices [14]. A high GC–MS library score may support a tentative glycidyl-ester-related annotation, but it cannot establish contamination level, processing origin, or food-safety significance.
The same principle applies to structurally complex steroidal, bile-acid-like, phospholipid-like, or spirostane-related candidates generated by automated searching. A previous investigation of coconut solid endosperm from Lolak reported a spirostane-related compound on the basis of GC–MS library comparison [16]. However, confident assignment of such a structurally specific compound requires stronger evidence than a single library match, particularly when competing candidates have similar scores or the signal occurs within an unresolved lipid-rich chromatographic region. Regional analytical documentation remains valuable, but subsequent studies should apply conservative annotation criteria and clearly distinguish candidate generation from confirmed identification.
Recent regional work has demonstrated a confidence-oriented GC–MS approach in which spectral matching was supplemented with diagnostic-ion assessment, experimental retention indices, solvent blanks, and replicate injections [17]. That study also emphasized that normalized chromatographic areas describe relative instrumental responses rather than absolute chemical concentrations. Such safeguards are especially important when evaluating archived screening datasets that were produced without analytical standards, retention-index compounds, blank chromatograms, or replicate sample preparations.
The available GC–MS dataset for the present powdered solid-endosperm material contained numerous fatty-acid-, glycidol-ester-, partial-glyceride-, and triacylglycerol-related candidates, including a complex late-eluting chromatographic envelope. The archived report comprised 71 automatically integrated peaks and library candidates generated using the mainlib database, while authentic standards and experimental retention indices were not reported. Therefore, this study aimed to establish a preliminary and confidence-qualified GC–MS fingerprint of powdered C. nucifera solid endosperm originating from Lolak, Bolaang Mongondow, North Sulawesi, Indonesia. The specific objectives were to describe the overall chromatographic profile, tentatively annotate the most plausible free-fatty-acid and lipid-ester signals, characterize the unresolved triacylglycerol-rich late-eluting region, and differentiate defensible chemical-class assignments from structurally ambiguous library matches. This investigation was intended as a regional analytical baseline rather than as definitive identification of 71 individual compounds, quantitative triacylglycerol analysis, or confirmation of biological and toxicological activities.
2. Results
2.1. Overall GC–MS Chromatographic Profile
GC–MS analysis of the powdered Cocos nucifera L. solid-endosperm preparation generated 71 integrated chromatographic peaks over a retention-time range of 6.07–31.84 min. The total integrated chromatographic area was 837,283,420.185 counts·min.
The total ion chromatogram showed relatively small signals before approximately 25 min, followed by a broad and highly intense late-eluting region extending from approximately 25.4 to 30.5 min. Peaks 50–67 within this region collectively accounted for 86.01% of the total normalized chromatographic area. In contrast, Peaks 1–10 represented only 0.21%.
The five largest individual signals were Peak 66 at 29.58 min, Peak 64 at 28.90 min, Peak 61 at 28.38 min, Peak 65 at 29.22 min, and Peak 53 at 25.99 min. Together, these five signals accounted for 50.35% of the total normalized area.
Figure 1.
Total ion chromatogram of the powdered Cocos nucifera L. solid-endosperm preparation. Peak numbers correspond to the automated Chromeleon integration results.
Figure 1.
Total ion chromatogram of the powdered Cocos nucifera L. solid-endosperm preparation. Peak numbers correspond to the automated Chromeleon integration results.
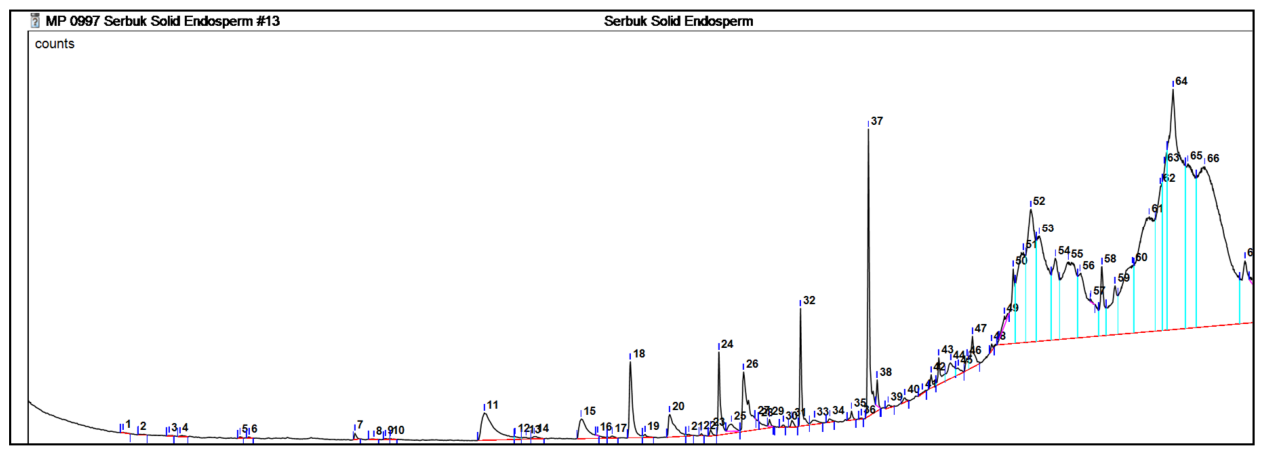

Table 1.
Fifteen predominant signals in the GC–MS chromatogram.
| Peak | RT (min) | Relative area (%) | Highest-ranking library candidate | SI | Conservative interpretation |
|---|---|---|---|---|---|
| 66 | 29.58 | 18.07 | Dodecanoic acid, 1,2,3-propanetriyl ester | 646 | Laurate-associated triacylglycerol-related signal |
| 64 | 28.9 | 13.16 | Dodecanoic acid, 1,2,3-propanetriyl ester | 674 | Laurate-associated triacylglycerol-related signal |
| 61 | 28.38 | 7.94 | Dodecanoic acid, 1,2,3-propanetriyl ester | 618 | Unresolved glyceride-rich signal |
| 65 | 29.22 | 6.34 | Dodecanoic acid, 1,2,3-propanetriyl ester | 645 | Laurate-associated triacylglycerol-related signal |
| 53 | 25.99 | 4.84 | Dodecanoic acid, 1,2,3-propanetriyl ester | 663 | Laurate-associated triacylglycerol-related signal |
| 55 | 26.62 | 4.7 | Dodecanoic acid, 1,2,3-propanetriyl ester | 693 | Laurate-associated triacylglycerol-related signal |
| 52 | 25.8 | 4.5 | Dodecanoic acid, 1,2,3-propanetriyl ester | 670 | Laurate-associated triacylglycerol-related signal |
| 62 | 28.62 | 3.58 | Phosphatricosan-aminium-related candidate | 648 | Structurally ambiguous high-molecular-weight lipid signal |
| 60 | 28.02 | 3.45 | Trimyristin | 622 | Triacylglycerol-related signal; specific identity uncertain |
| 67 | 30.46 | 3.35 | Phosphaheneicosan-aminium-related candidate | 603 | Structurally ambiguous high-molecular-weight lipid signal |
| 56 | 26.87 | 3.32 | Dodecanoic acid, 1,2,3-propanetriyl ester | 690 | Laurate-associated triacylglycerol-related signal |
| 51 | 25.64 | 3.12 | Dodecanoic acid, 1,2,3-propanetriyl ester | 651 | Laurate-associated triacylglycerol-related signal |
| 63 | 28.71 | 2.82 | Dodecanoic acid, 1,2,3-propanetriyl ester | 642 | Laurate-associated triacylglycerol-related signal |
| 37 | 22.27 | 2.35 | Glycidyl oleate | 899 | Glycidol–unsaturated fatty-acid ester-related signal |
| 54 | 26.34 | 2.22 | Dodecanoic acid, 1,2,3-propanetriyl ester | 643 | Laurate-associated triacylglycerol-related signal |
RT, retention time; SI, similarity index. The 15 signals represented 83.76% of the total normalized chromatographic area. Candidate names are library-supported annotations rather than confirmed compound identities.
2.2. Distribution of Signals across the Chromatogram
The chromatogram was divided descriptively into five retention-time regions based on signal intensity and the types of library candidates produced. Peaks 11–38, eluting between 13.92 and 22.46 min, contained the most readily interpretable free-fatty-acid and glycidol fatty-acid ester-related signals. However, this region represented only 10.92% of the total normalized area.
The transitional region between 22.70 and 25.23 min accounted for 2.02% and was dominated by structurally inconsistent steroid-, glyceride-, and long-chain ester-related candidates. The principal late-eluting region, from 25.42 to 30.46 min, represented 86.01% of the total chromatographic response.
Table 2.
Distribution of the chromatographic area by retention-time region.
| Peak range | RT range (min) | Number of peaks | Combined relative area (%) | General interpretation |
|---|---|---|---|---|
| 1–10 | 6.07–11.87 | 10 | 0.21 | Minor, poorly resolved long-chain compound-related signals |
| 11–38 | 13.92–22.46 | 28 | 10.92 | Free-fatty-acid-, partial-glyceride-, and glycidol ester-related region |
| 39–49 | 22.70–25.23 | 11 | 2.02 | Structurally ambiguous transitional region |
| 50–67 | 25.42–30.46 | 18 | 86.01 | Unresolved high-molecular-weight glyceride-rich region |
| 68–71 | 30.69–31.84 | 4 | 0.86 | Minor terminal signals with low-confidence candidates |
The combined percentage is 100.02% because the individual relative areas were rounded in the original laboratory report.
2.3. Free-Fatty-Acid-Related Signals
Four chromatographic peaks produced comparatively coherent free-fatty-acid candidates. Together, these peaks accounted for 4.61% of the normalized chromatographic area.
Peak 11, detected at 13.92 min, represented 1.49% and produced dodecanoic acid as the highest-ranking candidate, with an SI of 867 and an RSI of 911. The second- and third-ranked candidates were tridecanoic and pentadecanoic acids. Based on the higher score of the first candidate and the chemically coherent candidate set, the signal was tentatively annotated as dodecanoic acid.
Peak 15, detected at 16.02 min, accounted for 0.77%. Tetradecanoic acid was the first-ranked candidate, with an SI of 833 and an RSI of 865, followed by pentadecanoic and tridecanoic acids. This signal was tentatively annotated as tetradecanoic acid.
Peak 20, at 17.95 min, represented 0.64% and generated n-hexadecanoic acid as the leading candidate, with an SI of 829 and an RSI of 870. The alternative matches were ascorbic acid 2,6-dihexadecanoate and isopropyl palmitate. The signal was conservatively reported as hexadecanoic acid, tentative.
Peak 26, at 19.56 min, contributed 1.71%. The three leading candidates were trans-13-octadecenoic acid, cis-13-octadecenoic acid, and cis-vaccenic acid, with SI values of 876, 873, and 871, respectively. Because the scores were closely similar and represented positional or geometric isomers, this peak was annotated as octadecenoic acid, positional and geometric isomer unresolved.
The normalized areas of these peaks describe their contributions to the GC–MS chromatogram and do not represent the quantitative fatty-acid composition of the original solid endosperm.
2.4. Glycidol Fatty-Acid Ester-Related Signals
Five peaks generated glycidyl palmitate or glycidyl oleate as their highest-ranking candidates. These signals collectively represented 5.30% of the normalized chromatographic area.
Peak 32, detected at 20.80 min, produced glycidyl palmitate as its principal candidate, with an SI of 906 and an RSI of 943. This was the strongest library match in the complete dataset. The second and third candidates were palmitate-containing glycerol ester-related compounds with substantially lower SI values of 740 and 736.
Peak 37, detected at 22.27 min, produced glycidyl oleate as its leading candidate, with an SI of 899 and an RSI of 911. Its alternative candidates were oleate-containing glycerol esters, supporting a broader unsaturated fatty-acid ester-related interpretation.
Additional glycidyl ester candidates were observed for Peak 18 at 17.09 min, Peak 24 at 19.02 min, and Peak 38 at 22.46 min. Their respective normalized areas were 1.05%, 0.89%, and 0.16%.
Although Peaks 32 and 37 showed comparatively high spectral similarity, no authentic standards or experimental retention indices were available. These peaks were therefore reported collectively as glycidol fatty-acid ester-related signals, tentatively associated with glycidyl palmitate and glycidyl oleate. The data do not provide a validated quantitative measurement of glycidyl esters.
2.5. Late-Eluting Glyceride-Rich Region
The dominant chromatographic feature occurred between 25.42 and 30.46 min. This region contained 18 integrated signals and accounted for 86.01% of the total normalized area.
Twelve peaks—Peaks 51–57, 61, 63–66—returned dodecanoic acid, 1,2,3-propanetriyl ester as their highest-ranking candidate. These peaks collectively represented 71.04% of the chromatographic area. The library name corresponds to a triacylglycerol structure containing three dodecanoate residues. Nevertheless, the same candidate appeared across multiple distinct retention times, and the SI values ranged only from approximately 618 to 693.
The repeated annotation did not support the conclusion that 71.04% of the sample consisted of one pure compound. Instead, the result indicated an unresolved group of late-eluting lipid signals with spectra most closely resembling a laurate-rich triacylglycerol reference entry.
Peak 60, at 28.02 min, produced trimyristin as its first-ranked candidate but had an SI of only 622. Trimyristin also appeared as a secondary or tertiary candidate for several neighboring signals. Consequently, Peak 60 was interpreted as a tetradecanoate-containing triacylglycerol-related signal, rather than as confirmed trimyristin.
The chromatographic shape in this region consisted of several overlapping peaks superimposed on a broad elevated signal envelope. This pattern was consistent with an incompletely resolved mixture of triacylglycerols and other high-molecular-weight lipids rather than with fully separated individual compounds.
2.6. Structurally Ambiguous Library Candidates
Several peaks produced first-ranked candidates that were not accepted as specific compound annotations. Ethyl iso-allocholate appeared repeatedly between approximately 11.5 and 25.0 min, but the SI values were generally low to moderate and alternative candidates represented unrelated fatty acids, glycerides, alcohols, and steroid-like structures.
Spirost-8-en-11-one-related candidates were also generated for several minor peaks. Peak 41 represented only 0.03% and had an SI of 622, while Peak 47 represented 0.47% and had an SI of 588. These signals did not provide adequate support for specific identification of a spirostane compound.
In the late-eluting region, several peaks generated phospholipid-like quaternary-ammonium structures or pentanedioic acid bis-dodecylamide as first-ranked candidates. These matches generally had SI values close to 600–650 and competed with triacylglycerol-related candidates. They were therefore classified as structurally ambiguous high-molecular-weight lipid-related signals.
Peak 68–71, detected between 30.69 and 31.84 min, collectively represented only 0.86% and produced low-confidence steroid-, amide-, and long-chain ester-related candidate lists. These terminal signals were not assigned specific compound identities.
2.7. Overall Annotation Confidence
Among the 71 integrated peaks, the strongest individual library matches were obtained for:
- Peak 32, tentatively associated with glycidyl palmitate, SI 906;
- Peak 37, tentatively associated with glycidyl oleate, SI 899;
- Peak 26, associated with an unresolved octadecenoic acid isomer, SI 876;
- Peak 11, tentatively associated with dodecanoic acid, SI 867;
- Peak 15, tentatively associated with tetradecanoic acid, SI 833; and
- Peak 20, tentatively associated with hexadecanoic acid, SI 829.
In contrast, the quantitatively dominant late-eluting peaks generally produced lower SI values and multiple competing high-molecular-weight lipid candidates. The dataset therefore supported confident interpretation at the level of a fatty-acid- and glyceride-dominated chemical fingerprint, but not definitive identification of 71 individual compounds or quantitative determination of specific triacylglycerol molecular species.
3. Discussion
3.1. Overall Interpretation of the Lipid-Dominated Fingerprint
The GC–MS chromatogram of the powdered Cocos nucifera solid-endosperm preparation was strongly dominated by late-eluting lipid-related signals. Although 71 peaks were integrated, Peaks 50–67 accounted for 86.01% of the total normalized chromatographic area. The chromatographic profile therefore did not represent 71 equally important constituents; instead, it was characterized by a small number of free-fatty-acid- and partial-glyceride-related signals followed by a broad, incompletely resolved high-molecular-weight lipid region.
This overall pattern is chemically plausible for mature coconut solid endosperm, in which lipids occur predominantly as glycerol esters rather than as free fatty acids. Recent lipidomic analysis of coconut oil identified hundreds of lipid molecules, including numerous glycerolipid species, demonstrating that coconut lipids are substantially more complex than a simple list of their constituent fatty acids [6].
The present profile should nevertheless be regarded as method-specific. The relative intensity of the late chromatographic region may have been influenced by extraction selectivity, sample concentration, thermal behavior during injection, chromatographic resolution, and the automatic integration procedure. The results therefore describe the relative GC–MS response of the analyzed preparation rather than the complete lipid composition of the original powdered endosperm.
3.2. Free-Fatty-Acid-Related Signals
Four peaks provided comparatively coherent library-supported annotations for free fatty acids: dodecanoic acid, tetradecanoic acid, hexadecanoic acid, and an unresolved octadecenoic acid isomer. Together, these signals accounted for 4.61% of the total chromatographic area.
Dodecanoic acid was tentatively annotated at 13.92 min with an SI of 867 and an RSI of 911. The relatively high match and the chemically coherent alternative candidates supported this annotation more strongly than many of the high-molecular-weight assignments in the later region. Dodecanoic acid is a characteristic acyl component of coconut lipids, and the presence of both a free-acid-related signal and numerous laurate-associated glyceride candidates is therefore internally consistent with a coconut-derived matrix.
Tetradecanoic and hexadecanoic acids were detected as smaller signals, representing 0.77% and 0.64%, respectively. These results are also compatible with contemporary analyses showing that coconut-derived lipids contain medium-chain fatty acids together with smaller amounts of longer saturated fatty acids. However, the observed relative areas cannot be compared directly with fatty-acid percentages obtained by conventional fatty-acid methyl ester analysis because the present procedure did not involve documented transesterification, calibration, or compound-specific response correction.
Peak 26 produced three closely ranked C18:1 candidates: trans-13-octadecenoic acid, cis-13-octadecenoic acid, and cis-vaccenic acid. The SI values differed by only five units. Electron-ionization spectra of positional and geometric unsaturated-fatty-acid isomers may be insufficiently distinctive for confident localization of the double bond. The conservative annotation octadecenoic acid, positional and geometric isomer unresolved was therefore more defensible than selecting the first-ranked candidate.
The free-fatty-acid-related signals accounted for only a minor proportion of the chromatogram. This suggests that the detectable lipid response was dominated by esterified fatty acids rather than by extensive hydrolysis to free acids. However, this interpretation remains qualitative because the extraction and sample-preparation procedure was not documented.
3.3. Glycidol Fatty-Acid Ester-Related Signals
Peaks 18, 24, and 32 produced glycidyl palmitate as their leading library candidate, whereas Peaks 37 and 38 produced glycidyl oleate. The combined relative area of these five signals was 5.30%. Peak 32 had the strongest spectral match in the dataset, with an SI of 906 and an RSI of 943, while Peak 37 produced an SI of 899 and an RSI of 911.
These comparatively high scores support a tentative glycidol fatty-acid ester-related interpretation, but they do not independently confirm glycidyl palmitate or glycidyl oleate. The alternative candidates for these peaks were also fatty-acid glycerol ester-related structures. Thus, the spectra may indicate a related ester class while remaining insufficient for exact structural confirmation.
Glycidyl fatty-acid esters are generally investigated as process-related contaminants that may form during high-temperature treatment or deodorization of edible oils [16]. The present material was submitted as powdered solid endosperm rather than as industrially refined coconut oil, and no documented heating, refining, or derivatization procedure was available. Therefore, the library matches cannot be used to infer that the original coconut material contained processing-derived glycidyl esters.
Validated determination of glycidyl esters normally requires targeted extraction, matrix cleanup, authentic calibration standards, and selective mass-spectrometric analysis. Recent methods have used liquid chromatography–triple-quadrupole tandem mass spectrometry to quantify individual glycidyl esters in complex edible-oil matrices [17]. Accordingly, the present results must not be interpreted as a food-safety assessment or quantitative contamination measurement.
A suitable confirmatory experiment would involve targeted LC–MS/MS or a validated indirect method applied to independently prepared samples and procedural blanks. Until such evidence is available, the peaks are best described as glycidol fatty-acid ester-related signals tentatively associated with glycidyl palmitate and glycidyl oleate.
3.4. Interpretation of the Late-Eluting Glyceride-Rich Region
The principal analytical feature of the dataset was the late-eluting region between approximately 25.4 and 30.5 min. Twelve peaks in this region produced dodecanoic acid, 1,2,3-propanetriyl ester as their highest-ranked library candidate and collectively represented 71.04% of the normalized chromatographic area.
The library name corresponds to glyceryl tridodecanoate, commonly referred to as trilaurin. Nevertheless, the observation of the same candidate across numerous retention times does not indicate the presence of multiple independent trilaurin compounds, nor does it establish that 71.04% of the material was trilaurin. A single pure compound would ordinarily be expected to produce one principal chromatographic peak under a defined method, unless peak splitting, degradation, overloading, or another chromatographic problem occurred.
The more likely interpretation is that this region contained a complex mixture of triacylglycerols and related glycerides with overlapping fragmentation patterns. Coconut lipidomic studies have demonstrated the presence of numerous molecular species rather than a single dominant triacylglycerol [5]. Different combinations of octanoyl, decanoyl, dodecanoyl, tetradecanoyl, hexadecanoyl, and C18 acyl groups can generate structurally related glycerides whose conventional library spectra may not be sufficiently distinctive for exact assignment.
The visual appearance of the chromatogram supports this interpretation. The late region forms a broad elevated envelope containing several partially resolved peaks rather than a series of isolated baseline-resolved signals. Automated integration may consequently have divided a complex co-eluting lipid band into multiple individual features.
Peak 60 generated trimyristin as its first-ranked candidate, while trimyristin also appeared among the alternative matches for neighboring signals. The leading SI for Peak 60 was only 622, which was insufficient for specific confirmation. The signal is better reported as a tetradecanoate-containing triacylglycerol-related component.
The repeated laurate-associated matches remain chemically informative at the class level. They indicate that the late-eluting fraction was probably enriched in glycerides containing medium-chain acyl groups, particularly dodecanoate-related structures. However, determination of individual triacylglycerol species would require a more suitable targeted platform, such as high-performance liquid chromatography coupled to high-resolution or tandem mass spectrometry.
3.5. Influence of Chromatographic Integration and Spectral-Library Coverage
The dominant late region also illustrates the limitations of applying conventional GC–MS library searching to intact or incompletely resolved high-molecular-weight lipids. Candidate selection depends on the spectra available in the library. When the actual lipid species is absent, the software may return the structurally closest reference spectrum, even when the similarity score is only moderate.
Most predominant peaks in the glyceride-rich region produced SI values of approximately 618–693. These scores were substantially lower than those obtained for glycidyl palmitate, glycidyl oleate, dodecanoic acid, and the unresolved C18:1 acid signal. The lower scores and repetitive candidate names indicate that specific molecular assignments in this region were less reliable than their large peak areas might suggest.
Peak abundance and identification confidence are separate analytical properties. A highly abundant peak can still be incorrectly annotated if it contains co-eluting compounds, exhibits incomplete spectral deconvolution, or lacks an appropriate library reference. Conversely, a smaller peak may be annotated more reliably when its spectrum closely matches a well-represented reference compound.
Retention indices would have provided independent chromatographic evidence, but no experimental indices were available. Recent analytical work has shown that retention indices can improve candidate ranking, although their assumptions and compound-specific error distributions must be considered carefully [12]. An exact or apparently close retention-index value would still constitute supporting evidence rather than definitive identification [13].
3.6. Structurally Ambiguous Steroid- and Spirostane-Related Matches
Ethyl iso-allocholate appeared repeatedly as a first-ranked candidate in several regions of the chromatogram. The associated SI values were generally low to moderate, and the alternative candidates frequently belonged to unrelated classes, including fatty acids, glycerol esters, long-chain alcohols, and complex steroid-like structures.
Repeated retrieval of the same candidate does not strengthen an assignment when each individual spectrum has limited similarity and lacks coherent alternatives. Instead, it may indicate that the library entry was the closest available match for a recurring but unidentified fragmentation pattern. Consequently, the data do not support the conclusion that ethyl iso-allocholate occurred in the solid endosperm.
Spirost-8-en-11-one-related candidates were obtained for several minor signals, including Peaks 41 and 47. Their SI values were only 622 and 588, respectively. Alternative matches included glyceride-related and secosteroid-like structures, further reducing identification confidence.
A previous regional publication reported a spirostane-related compound from coconut solid endosperm [18]. However, the present dataset cannot independently verify that assignment. Specific confirmation of a spirostane structure would require isolation or targeted analysis, a high-quality mass spectrum, retention evidence, and preferably orthogonal structural characterization by techniques such as high-resolution mass spectrometry and nuclear magnetic resonance spectroscopy.
The current signals should therefore be reported as structurally ambiguous late-eluting candidates, with the original library names retained only in the complete supplementary table. They should not be highlighted as identified bioactive compounds.
3.7. Other Low-Confidence and Biologically Implausible Candidates
Several early minor peaks produced candidates such as fluorinated esters, brominated aldehydes, pantetheine-related compounds, and high-molecular-weight dialkoxy hydrocarbons. Peaks 1–10 collectively accounted for only 0.21% of the chromatographic area, and their candidate sets were generally inconsistent.
The occurrence of halogenated or highly specialized biochemical structures among the first-ranked matches does not establish their presence in coconut endosperm. These names may have resulted from low-intensity spectra, background ions, co-elution, or insufficient library representation. The early peaks are therefore more appropriately treated as unresolved minor signals.
Similarly, phospholipid-like quaternary-ammonium candidates and bis-dodecylamide candidates appeared repeatedly in the late region. Their SI values were generally close to 600–650 and competed with triacylglycerol-related matches. Because the chromatographic method and ionization conditions were not optimized for phospholipid identification, these specific names should not be accepted without targeted confirmation.
This conservative treatment prevents the complete library-search output from being misrepresented as a list of naturally occurring compounds. The full candidate list remains useful as a record of the automated search, but only chemically coherent and analytically defensible annotations should be emphasized in the main manuscript.
3.8. Relationship to Contemporary Coconut Lipidomics
The broad interpretation of a glyceride-rich matrix is consistent with contemporary coconut-oil lipidomics. Cui et al. identified 468 lipid molecules in coconut oils extracted using several solvent systems, including glycerolipids, sphingolipids, glycerophospholipids, and saccharolipids [6]. Their findings demonstrate that coconut lipid composition cannot be reduced to a few library-derived triacylglycerol names.
The present GC–MS dataset has a narrower analytical scope because it was generated using a screening method and conventional library searching. It nevertheless provides a regional chromatographic baseline for powdered solid-endosperm material from Lolak, Bolaang Mongondow. The recurrent dodecanoate-associated matches are consistent with the expected importance of laurate-containing glycerides, whereas the smaller tetradecanoic-, hexadecanoic-, and octadecenoic-acid-related signals reflect additional acyl diversity.
Direct quantitative comparison with coconut oil, coconut milk, or testa oil is inappropriate. The analyzed material was a heterogeneous solid-endosperm powder and may have contained proteins, carbohydrates, moisture, fiber, and particulate tissue components in addition to lipids. Extraction selectivity and preparation conditions could therefore strongly influence which compounds entered the GC–MS vial.
The present findings complement, rather than replace, targeted fatty-acid and lipidomic analyses. Conventional GC analysis of fatty-acid methyl esters would be more appropriate for determining total fatty-acid composition, while LC–MS-based lipidomics would be better suited to resolving intact triacylglycerol species.
3.9. Meaning of the Relative Chromatographic Areas
The normalized peak areas were calculated from the total integrated GC–MS response. They indicate the contribution of each integrated signal to this particular chromatogram but do not correspond directly to mass percentages or molar concentrations in the powdered material.
Different compound classes can have different extraction efficiencies, injection behaviors, chromatographic recoveries, fragmentation characteristics, and detector responses. The broad late-eluting envelope may also have affected baseline placement and area integration. Consequently, the finding that laurate-associated triacylglycerol-related peaks accounted for 71.04% should be interpreted as chromatographic predominance, not as proof that the sample contained 71.04% trilaurin.
Quantitative determination would require defined sample mass and extraction volume, an internal standard, compound-specific or class-specific calibration, recovery studies, repeat preparation, and validated integration procedures. None of these elements was documented in the available dataset.
3.10. Study Limitations and Recommended Confirmatory Work
The study was based on one archived GC–MS injection. The metadata documented a 1.00 µL injection on 5 November 2024 using a Thermo Fisher Scientific ISQ instrument and a processing library recorded as mainlib. However, complete information on the extraction solvent, sample-to-solvent ratio, extraction procedure, column specifications, carrier-gas flow, oven program, ion-source conditions, mass range, and spectral-library version was not available.
No authentic standards, experimental retention indices, internal standard, solvent blank, preparation blank, biological replicate, independent extraction replicate, or repeat injection was documented. These limitations prevented assessment of contamination, method precision, extraction variability, and biological variability.
Future work should use authenticated and independently collected coconut material from multiple fruits and trees. Sample preparation should be documented from drying through extraction, and replicate preparations should be analyzed alongside solvent and procedural blanks.
The free-fatty-acid fraction should be investigated through validated derivatization followed by GC–FID or GC–MS using authentic fatty-acid standards and an n-alkane retention-index series. The late glyceride-rich fraction should be characterized using LC–HRMS or LC–MS/MS to distinguish individual monoacylglycerol, diacylglycerol, and triacylglycerol species.
The glycidol fatty-acid ester-related signals should be evaluated separately using a validated targeted method. Such analysis is essential before drawing any conclusion concerning their presence, concentration, processing origin, or safety relevance.
Overall, the dataset supports a preliminary description of the sample as having a fatty-acid- and glyceride-dominated GC–MS fingerprint with a strongly unresolved laurate-associated late-eluting region. Its principal contribution is not the identification of 71 individual compounds, but the differentiation of relatively defensible fatty-acid and ester-related signals from repetitive, structurally ambiguous high-molecular-weight library matches.
4. Materials and Methods
4.1. Study Design and Data Source
This study was designed as a retrospective and descriptive evaluation of an archived gas chromatography–mass spectrometry (GC–MS) screening dataset. The available analytical records consisted of a total ion chromatogram, an integrated peak table, and a library-search report containing the three highest-ranking spectral candidates for each integrated peak.
No additional extraction, chromatographic analysis, compound isolation, or confirmatory experiment was performed as part of the present study. Consequently, the investigation was treated as preliminary chemical fingerprinting rather than definitive compound identification or quantitative lipid analysis.
4.2. Coconut Solid-Endosperm Material
The analyzed material was recorded as powdered solid endosperm of Cocos nucifera L. The sample label indicated that the material originated from Lolak, Bolaang Mongondow Regency, North Sulawesi, Indonesia. The accompanying documentation identified Frangky J. Paat as the researcher associated with the sample.
The sample container was labeled as containing 100 g of material. However, this value represented the amount shown on the sample label and was not interpreted as the mass used for GC–MS preparation or injection.
The material appeared as a coarse, cream-to-light-brown grated powder. Information concerning the number of coconut fruits or trees sampled, fruit cultivar, maturity stage, collection date, botanical authentication, voucher specimen, and exact geographical coordinates was unavailable. Accordingly, the botanical identity and provenance were reported according to the available sample documentation.
4.3. Pre-Analytical Processing and Sample Preparation
The complete pre-analytical procedure used to produce the powdered solid-endosperm material was not included in the available records. Information concerning removal of the testa, washing, drying method, drying temperature, drying duration, moisture content, grinding equipment, particle size, storage container, storage temperature, and storage duration was unavailable.
The mass of powder used for preparation, extraction solvent, solvent grade, sample-to-solvent ratio, extraction method, extraction time, extraction temperature, number of extraction cycles, centrifugation conditions, filtration procedure, evaporation step, and final concentration of the injected preparation were also not documented.
The Chromeleon metadata contained a field designated “Sample Weight: 1.0000”. Because the unit and purpose of this value were not specified, it was not interpreted as the actual mass of powdered endosperm used during sample preparation. No intentional derivatization, transesterification, methylation, or silylation procedure was documented.
4.4. GC–MS Instrumentation and Injection Metadata
GC–MS analysis was performed at the Laboratorium Penelitian dan Pengujian Terpadu, Universitas Gadjah Mada, Indonesia. The analytical system was a Thermo Fisher Scientific ISQ instrument identified in the archived report as ISQD1702517_1.
Instrument control, chromatographic processing, and library searching were performed using Chromeleon software, version 7.2.10.24543. The sample was injected on 5 November 2024 at 09:58, using vial number 153 and an injection volume of 1.00 µL.
The instrument method was recorded as “Screening Daun Splitless”, whereas the processing method was recorded as “Screening”. The injection type field was listed as “Unknown”, although the instrument-method name contained the term “Splitless”. Therefore, splitless injection was not independently verified beyond the method name.
The dilution factor was recorded as 1.0000. The library-search summary reported a run time of 27.99 min, whereas the exported chromatographic table contained integrated peaks with retention times extending to 31.84 min. Both values were retained as reported, and the discrepancy was not reconstructed in the absence of the complete instrument-method file.
Table 3.
Available GC–MS acquisition and processing metadata.
| Parameter | Recorded information |
|---|---|
| Analytical laboratory | Laboratorium Penelitian dan Pengujian Terpadu, Universitas Gadjah Mada |
| Sample name | Serbuk Solid Endosperm |
| Instrument | Thermo Fisher Scientific ISQ |
| Instrument identification | ISQD1702517_1 |
| Software | Chromeleon 7.2.10.24543 |
| Injection date and time | 5 November 2024, 09:58 |
| Vial number | 153 |
| Injection volume | 1.00 µL |
| Injection type | Unknown |
| Instrument method | Screening Daun Splitless |
| Processing method | Screening |
| Dilution factor | 1 |
| Reported run time | 27.99 min |
| Observed integrated RT range | 6.07–31.84 min |
| Spectral library designation | mainlib |
| GC column | Not available |
| Carrier gas and flow rate | Not available |
| Injector temperature | Not available |
| Oven-temperature program | Not available |
| Transfer-line temperature | Not available |
| Ion-source temperature | Not available |
| Ionization mode and electron energy | Not available |
| Scan range and acquisition rate | Not available |
4.5. Chromatographic Peak Integration
Chromatographic processing was performed using the archived Chromeleon processing method designated “Screening”. A total of 71 peaks were integrated over the retention-time range of 6.07–31.84 min. The total integrated chromatographic area was 837,283,420.185 counts·min.
The available report did not provide the integration threshold, minimum peak area, peak-width settings, baseline model, smoothing parameters, or criteria used to distinguish adjacent signals. The chromatogram contained a broad late-eluting region with numerous partially resolved features. Because the raw vendor-format chromatographic file was unavailable, the original peak integration could not be repeated, deconvoluted, or independently optimized.
4.6. Mass-Spectral Library Searching
For each integrated peak, the processing software reported the three highest-ranking library candidates together with a similarity index (SI) and reverse similarity index (RSI). The library was designated mainlib in the Chromeleon report. The exact name, release year, and version of the underlying spectral-library database were not specified.
The highest-ranking candidate was not automatically accepted as the identified compound. Each signal was evaluated according to:
- the SI and RSI values;
- structural coherence among the three leading candidates;
- the difference between the first- and lower-ranked match scores;
- whether the candidates represented positional or geometric isomers;
- consistency with the chromatographic retention region;
- recurrence of the same candidate across neighboring peaks;
- compatibility with a coconut lipid matrix; and
- the possibility of co-elution or incomplete resolution in the late-eluting region.
No minimum SI or RSI acceptance threshold was documented in the archived processing method. Library-search candidates were therefore treated as tentative annotations rather than confirmed chemical identities.
4.7. Confidence-Based Annotation Strategy
The integrated signals were assigned to interpretive categories according to the strength and coherence of the available evidence.
Tentatively annotated fatty-acid signals were peaks for which the leading candidates were chemically related fatty acids and the first-ranked match showed comparatively strong spectral agreement. This category included the signals associated with dodecanoic, tetradecanoic, and hexadecanoic acids.
Isomer-unresolved signals were peaks for which the leading candidates represented positional or geometric isomers with closely similar match scores. The C18:1-related peak was therefore reported as octadecenoic acid without assignment of a specific double-bond position or configuration.
Glycidol fatty-acid ester-related signals were peaks producing glycidyl palmitate or glycidyl oleate as leading candidates. Specific compound names remained tentative because authentic standards, retention indices, and a validated targeted method were unavailable.
Glyceride-related signals were peaks whose candidate lists were dominated by monoacylglycerol-, diacylglycerol-, or triacylglycerol-related structures. Repeated matches to dodecanoic acid, 1,2,3-propanetriyl ester were interpreted as evidence of a laurate-associated glyceride-rich region rather than as multiple independently confirmed occurrences of pure trilaurin.
Structurally ambiguous signals were peaks for which the leading candidates belonged to substantially different chemical classes, had low-to-moderate similarity scores, or represented biologically and analytically unsupported steroid-, amide-, phospholipid-, or spirostane-related structures.
4.8. Evaluation of the Late-Eluting Lipid Region
The chromatographic region from approximately 25.4 to 30.5 min was evaluated separately because it accounted for most of the total integrated area. Visual examination of the total ion chromatogram showed a broad elevated envelope containing several incompletely resolved peaks in this interval.
Numerous signals within this region produced dodecanoic acid, 1,2,3-propanetriyl ester as the first-ranked library candidate, while neighboring signals produced trimyristin, phospholipid-like candidates, long-chain amides, and other glyceride-related structures. Because the same candidate appeared at multiple retention times and the similarity indices were generally moderate, the region was interpreted collectively as an unresolved high-molecular-weight glyceride-rich chromatographic region.
No individual triacylglycerol molecular species was regarded as definitively identified.
4.9. Calculation of Relative Chromatographic Areas
Relative chromatographic areas were taken directly from the archived peak table. The original processing software calculated each percentage from the integrated area of an individual peak relative to the total integrated chromatographic area.
Combined relative areas were calculated by summing the reported percentages of peaks assigned to the same descriptive group or retention-time region. Minor discrepancies from exactly 100% resulted from rounding of the individual percentages in the laboratory report.
Relative areas were used only to describe the contribution of each integrated signal to the archived chromatogram. They were not interpreted as:
- absolute concentrations;
- mass percentages in the original powder;
- molar proportions;
- extraction yields;
- total fatty-acid composition; or
- quantitative triacylglycerol composition.
No response-factor correction, internal-standard normalization, or calibration curve was available.
4.10. Replication and Quality Control
The available records documented one sample injection. Biological replication, independent sample-preparation replication, and repeat instrumental injections were not available.
No solvent blank, vial blank, procedural blank, internal standard, calibration standard, recovery experiment, precision assessment, or mass-spectrometer tuning report was provided. Experimental retention indices were not determined, and authentic reference standards were not analyzed.
The raw vendor-format GC–MS file was also unavailable. Consequently, spectral deconvolution, reintegration, background subtraction, repeatability assessment, and statistical evaluation of analytical variability could not be performed.
The analysis was therefore descriptive and exploratory. No inferential statistical analysis was conducted.
4.11. Ethical Considerations
The study involved only archived analytical data obtained from plant-derived material. It did not involve human participants, human biological specimens, experimental animals, or personally identifiable information. Institutional review board approval and informed consent were therefore not applicable.
5. Conclusions
This study established a preliminary GC–MS fingerprint of powdered Cocos nucifera L. solid endosperm originating from Lolak, Bolaang Mongondow, North Sulawesi, Indonesia. A total of 71 integrated peaks were detected between 6.07 and 31.84 min. The chromatogram was strongly dominated by a late-eluting lipid-rich region, with Peaks 50–67 accounting for 86.01% of the total normalized chromatographic area.
The more interpretable signals were tentatively associated with dodecanoic acid, tetradecanoic acid, hexadecanoic acid, and an unresolved octadecenoic acid isomer. Several additional peaks showed comparatively strong spectral similarity to glycidol fatty-acid ester-related compounds, particularly glycidyl palmitate and glycidyl oleate. However, these assignments remain tentative and should not be interpreted as quantitative evidence of process contaminants or food-safety risk.
The dominant late-eluting peaks repeatedly generated laurate-containing triacylglycerol-related candidates, including dodecanoic acid, 1,2,3-propanetriyl ester. Their repeated occurrence at different retention times and generally moderate similarity scores indicated an unresolved mixture of glycerides rather than multiple confirmed occurrences of a single pure triacylglycerol. Steroid-, spirostane-, phospholipid-, and long-chain amide-related candidates were considered structurally ambiguous and were not accepted as specifically identified constituents.
Overall, the dataset supports interpretation of the sample as having a fatty-acid- and glyceride-dominated GC–MS profile with a complex laurate-associated late-eluting region. All annotations remain provisional because authentic standards, experimental retention indices, blank chromatograms, raw vendor data, and replicate analyses were unavailable. Future studies should combine validated fatty-acid analysis with LC–MS-based lipidomics to confirm individual glyceride species and assess their quantitative distribution.
Author Contributions
Conceptualization, F.J.P. and S.S.; methodology, F.J.P.; formal analysis, F.J.P. and S.S.; investigation, F.J.P.; resources, F.J.P.; data curation, F.J.P. and S.S.; writing—original draft preparation, F.J.P., S.S., FBP, and FJTP; writing—review and editing, F.J.P, FBP, FJTP and S.S.; visualization, F.J.P., FJTP, FBP and S.S.; supervision, S.S.; project administration, F.J.P. All authors have read and agreed to the published version of the manuscript.
Funding
This research received no external funding.
Institutional Review Board Statement
Not applicable. This study involved only archived analytical data obtained from plant-derived material and did not involve humans or experimental animals.
Informed Consent Statement
Not applicable.
Data Availability Statement
The processed data supporting the findings of this study are available within the article and its Supplementary Materials. These data include the total ion chromatogram, integrated peak table, relative chromatographic areas, and mass-spectral library-search results. Raw vendor-format GC–MS files, blank chromatograms, authentic-standard data, experimental retention-index data, and replicate-analysis files were not available for the present retrospective study. The available processed analytical records may be obtained from the corresponding author upon reasonable request.
Conflicts of Interest
The authors declare no conflicts of interest.
Acknowledgments
The authors acknowledge the Laboratorium Penelitian dan Pengujian Terpadu, Universitas Gadjah Mada, Indonesia, for performing the GC–MS analysis and providing the processed chromatographic and mass-spectral library-search reports. The archived report identifies the analytical platform as a Thermo Fisher Scientific ISQ system operated using Chromeleon software.
Abbreviations
The following abbreviations are used in this manuscript:
| C18:1 | Monounsaturated 18-carbon fatty acid or related compound |
| EI | Electron ionization |
| FAME | Fatty-acid methyl ester |
| GC–FID | Gas chromatography with flame-ionization detection |
| GC–MS | Gas chromatography–mass spectrometry |
| HPLC | High-performance liquid chromatography |
| LC–HRMS | Liquid chromatography–high-resolution mass spectrometry |
| LC–MS/MS | Liquid chromatography–tandem mass spectrometry |
| m/z | Mass-to-charge ratio |
| NIST | National Institute of Standards and Technology |
| RSI | Reverse similarity index |
| RT | Retention time |
| SI | Similarity index |
| TAG | Triacylglycerol |
| TIC | Total ion chromatogram |
| TMS | Trimethylsilyl |
References
- Shen, X.; Xiong, F.; Niu, X.; Gong, S.; Sun, X.; Xiao, Y.; Yang, Y.; Chen, F. Molecular Mechanism of Quality Changes in Solid Endosperm of Tender Coconut during Room Temperature Storage Based on Transcriptome and Metabolome. Food Chem. 2024, 436. [Google Scholar] [CrossRef] [PubMed]
- Ekanayaka, R.A.I.; de Silva, P.G.S.M.; Ekanayaka, M.K.I.; Jayathilake, W.M.M.; Pathirana, R.P.M.M.R.; Amaratunga, Y.N.; De Silva, P.J.D.; Perera, B. Effect of Different Forms of Coconut on the Lipid Profile in Normal Free-Living Healthy Subjects: A Randomized Controlled Trial (Phase II). Glob. Epidemiol. 2024, 7. [Google Scholar] [CrossRef] [PubMed]
- Spiazzi, B.F.; Duarte, A.C.; Zingano, C.P.; Teixeira, P.P.; Amazarray, C.R.; Merello, E.N.; Wayerbacher, L.F.; Farenzena, L.P.; Correia, P.E.; Bertoluci, M.C.; et al. Coconut Oil: An Overview of Cardiometabolic Effects and the Public Health Burden of Misinformation. Arch. Endocrinol. Metab. 2023, 67. [Google Scholar] [CrossRef] [PubMed]
- Shunmugiah Veluchamy, R.; Mary, R.; Beegum Puthiya P., S.; Pandiselvam, R.; Padmanabhan, S.; Sathyan, N.; Shil, S.; Niral, V.; Musuvadi Ramarathinam, M.; Lokesha, A.N.; et al. Physicochemical Characterization and Fatty Acid Profiles of Testa Oils from Various Coconut (Cocos nucifera L.) Genotypes. J. Sci. Food Agric. 2023, 103, 370–379. [Google Scholar] [CrossRef] [PubMed]
- Blasi, F.; Maria Pellegrino, R.; BR Alabed, H.; Ianni, F.; Emiliani, C.; Cossignani, L. Lipidomics of Coconut, Almond and Soybean Milks - Comprehensive Characterization of Triacylglycerol Class and Comparison with Bovine Milk. Food Res. Int. 2023, 172. [Google Scholar] [CrossRef] [PubMed]
- Cui, J.; Yang, Z.; Xu, Y.; Tan, C.P.; Zhang, W. Lipidomics Insight on Differences in Lipid Profiles and Phytosterol Compositions of Coconut Oils Extracted by Classical and Green Solvents. Food Res. Int. 2023, 174. [Google Scholar] [CrossRef] [PubMed]
- Rincón-Cervera, M.Á.; Guil-Guerrero, J.L. Two-Step Enzymatic Synthesis of Structured Triacylglycerols from ARASCO© and Coconut Oil. Appl. Sci. 2024, 14. [Google Scholar] [CrossRef]
- Zhang, M.; Xu, B.; Zhao, D.; Shen, M.; Li, M.; Liu, D.; Liu, L. Production of Margarine Fat Containing Medium- and Long-Chain Triacylglycerols by Enzymatic Interesterification of Peony Seed Oil, Palm Stearin and Coconut Oil Blends. Foods 2024, 13. [Google Scholar] [CrossRef] [PubMed]
- Jeyakumar, S.M.; Damayanti, K.; Rajkumar Ponday, L.; Acharya, V.; Koppala, S.R.; Putcha, U.K.; Nagalla, B.; Vajreswari, A. Assessment of Virgin Coconut Oil in a Balanced Diet on Indicators of Cardiovascular Health in Non-Obese Volunteers: A Human Metabolic Study. Diabetes Metab. Syndr. Clin. Res. Rev. 2023, 17. [Google Scholar] [CrossRef] [PubMed]
- Thong, A.; Basri, N.; Chew, W. Comparison of Untargeted Gas Chromatography-Mass Spectrometry Analysis Algorithms with Implications to the Interpretation and Putative Identification of Volatile Aroma Compositions. J. Chromatogr. A 2024, 1713. [Google Scholar] [CrossRef] [PubMed]
- Degnan, D.J.; Bramer, L.M.; Flores, J.E.; Paurus, V.L.; Corilo, Y.E.; Clendinen, C.S. Evaluating Retention Index Score Assumptions to Refine GC-MS Metabolite Identification. Anal. Chem. 2023, 95, 7536–7544. [Google Scholar] [CrossRef] [PubMed]
- Bizzo, H.R.; Brilhante, N.S.; Nolvachai, Y.; Marriott, P.J. Use and Abuse of Retention Indices in Gas Chromatography. J. Chromatogr. A 2023, 1708. [Google Scholar] [CrossRef] [PubMed]
- Flores, J.E.; Bramer, L.M.; Degnan, D.J.; Paurus, V.L.; Corilo, Y.E.; Clendinen, C.S. Gaussian Mixture Modeling Extensions for Improved False Discovery Rate Estimation in GC-MS Metabolomics. J. Am. Soc. Mass Spectrom. 2023, 34, 1096–1104. [Google Scholar] [CrossRef] [PubMed]
- Wakoli, J.; Anjum, A.; Sajed, T.; Oler, E.; Wang, F.; Gautam, V.; Levatte, M.; Wishart, D.S. GCMS-ID: A Webserver for Identifying Compounds from Gas Chromatography Mass Spectrometry Experiments. Nucleic Acids Res. 2024, 52, W381–W389. [Google Scholar] [CrossRef] [PubMed]
- Chungchunlam, S.M.S.; Moughan, P.J. Comparative Bioavailability of Vitamins in Human Foods Sourced from Animals and Plants. Crit. Rev. Food Sci. Nutr. 2024, 64, 11590–11625. [Google Scholar] [CrossRef] [PubMed]
- Paat, F.J.; Kaunang, T.M.; Hatibie, M.J.; Faruk, M.; Oley, M.C. Spirost: An Anti-Inflammatory Compound Isolated from Cocos nucifera L. Solid Endosperm. J. Agroekoteknologi Ter. 2025, 110–119. [Google Scholar] [CrossRef]
- Paat, F.J.; Sintaro, S. Solvent-Dependent GC–MS Fingerprinting of Lipophilic Constituents in Syzygium Polyanthum Leaves: A Baseline Study for Future Greener Extraction Optimization. Molecules 2026, 31. [Google Scholar] [CrossRef] [PubMed]
Disclaimer/Publisher’s Note: The statements, opinions and data contained in all publications are solely those of the individual author(s) and contributor(s) and not of MDPI and/or the editor(s). MDPI and/or the editor(s) disclaim responsibility for any injury to people or property resulting from any ideas, methods, instructions or products referred to in the content. |
© 2026 by the authors. Licensee MDPI, Basel, Switzerland. This article is an open access article distributed under the terms and conditions of the Creative Commons Attribution (CC BY) license (http://creativecommons.org/licenses/by/4.0/).
Copyright: This open access article is published under a Creative Commons CC BY 4.0 license, which permit the free download, distribution, and reuse, provided that the author and preprint are cited in any reuse.