

Submitted:
05 August 2026
Posted:
07 August 2026
You are already at the latest version
Abstract
The northern part of Ethiopia is vulnerable to extreme droughts, which subsequently affect agricultural production and food security. This study therefore, analyzed the spatiotemporal variability of extreme temperature and rainfall across ten selected observation stations in the central and northwest zones of Tigray using a long-term climate data obtained from NASA POWER (1983-2023). The data were subjected to rigorous quality control analysis using the RClimDex v.1 software to detect potential erroneous or missing values. Trend analysis was performed on 21 of the 27 extreme temperature and rainfall indices recommended by the joint CCL/CLIVAR/JCOMM Expert Team on Climate Change Detection and Indices (ETCCDI). The non-parametric Mann-Kendall trend test and Sen’s slope estimator were employed to determine the trends in temperature and rainfall across the study areas over the past forty years. The trend analysis demonstrated a highly significant (p < 0.01) increase in warming indicators such as warm nights (TN90p), warm days (TX90p), maximum value of the daily maximum (TXx), and minimum (TNx) temperature ranges, while cooling indicator indices like cold spell duration indicator (CSDI), cool nights (TN10p), and cool days (TX10p) exhibited a highly significant negative trend over the study period. Furthermore, TXx and TNx increased at rates ranging from 0.02 to 0.025 °C per year and 0.013 to 0.016 °C per year, respectively. Annual rainfall showed an increasing trend ranging from 0.38 to 3.5 mm per year. Notably, the frequency of heavy (R10mm) and extremely heavy (R25 mm) rainfall events revealed a highly significant (p < 0.01) positive trend, raising risks of flooding, soil erosion, and crop failure for local farmers. These findings highlight the urgent need for adaptive strategies to protect Tigray’s agriculture and livelihoods under changing climatic conditions.
Keywords:
extreme climate indices
; Mann-Kendal test
; temperature
; rainfall
; Tigray
1. Introduction
Anthropogenic greenhouse gas emissions have driven global warming, raising surface temperatures by 1.1 °C above pre-industrial levels (1850–1900) from 2011 to 2020 [1]. Globally, the average temperature has increased by 10C since 1900, which can be attributed anthropogenic and natural processes [2]. Climate change is also projected to affect natural resources, human health, crop productivity and fisheries, requiring urgent climate action [1].
In Africa, climate change is highly affecting agricultural production, food security, and livelihoods [3]. In particular, the Sub-Saharan Africa is highly vulnerable to climate change and variability due to its dependence on rainfall [4], and notably affecting agriculture and food security [5,6]. The region is characterized by arid and semi-arid climates, where water scarcity is inevitable. Areas like Sudan and northern Ethiopia in the Great Horn of Africa, will experience a considerable increase in temperature, with comparatively lower increases in the coastal regions of Tanzania; even the smallest global warming target of 1.5 °C will still result in temperature rises of more than 0.5 °C across this region, with Sudan and northern Ethiopia experiencing up to 0.8 °C, indicating a faster warming rate than the global average [7].
Besides, future climate projections indicate that there will be an increasing warming towards the end of the 21st century in different parts of Ethiopia [8,9,10,11] with subsequent negative impacts on crop production [11,12,13,14], water resources [15]. Similarly, climate change percussions will cause rising temperatures, irregular rainfall patterns, food insecurity and malnutrition, destruction of infrastructures, and an increased frequency of droughts and floods [16]. Moreover, East African countries like Ethiopia, Kenya and Tanzania were found among the most vulnerable countries to climate change [17].
Recent studies indicate extreme temperature and rainfall are occurring in different parts of Ethiopia [18,19,20,21,22] causing multifaceted impacts on agriculture, and food security. It also been stated that maximum and minimum temperature ranges were significantly increasing in different parts of Ethiopia, causing multifaceted impacts on agriculture, and livelihood of the society [23,24], and will continue affecting agricultural production and food security in the future towards 2030 and 2050 in the region [24].
On the other hand, the Tigray regional state is a region one of the regions which are highly vulnerable to climate change. The economy of the region is heavily dependent on rain-fed agriculture, making it particularly sensitive to changes in temperature and rainfall. Tigray has already experienced an increase in the frequency and intensity of droughts in recent decades, leading to food insecurity [24]. Climate change is expected to further intensify these challenges, threatening the livelihoods and well-being of the population.
Even though changes in mean temperature and precipitation are key indicators of climate change, analyzing the trends in extreme climate events is critical due to their variable impacts on human and natural systems. Similarly, heavy rainfall events can lead to flooding, landslides, and significant distractions to livelihoods and infrastructure [25]. Hence, understanding these trends is essential for developing effective climate change adaptation and mitigation strategies to enhance resilience in affected regions [26].
This research focuses on the central and northwest zones of Tigray, which are particularly vulnerable to climate change impacts, and these zones heavily rely on rain-fed agriculture, making them highly sensitive to shifts in rainfall patterns and extreme weather events. Their proximity to arid and semi-arid regions exacerbates vulnerabilities, as recurrent droughts and erratic rainfall threaten crop production and food security [27]. Therefore, analyzing the trends in extreme temperature and rainfall indices in these zones provides critical insights into the specific challenges posed by climate change, informing targeted strategies to support local communities and sustainable agricultural practices.
While previous research has identified warming trends in Tigray [28], reported the spatiotemporal analyses of extreme temperature and rainfall indices in the central and northwestern zones remain limited. Therefore, this research aims to fulfill this gap by providing a comprehensive assessment of the changes in the abovementioned changes and variabilities in the central and northwest zones of Tigray. The findings will contribute to a better understanding of the impacts of climate change on the region and inform the development of suitable adaptation and mitigation strategies.
Cognizant that this research will provide valuable insights for decision-makers, researchers, and agricultural experts, and local communities on the changes and variability of extreme temperature and rainfall, and the trends over the last forty years in the central and northwest zones of Tigray. Hence, this study fills the research gap by analyzing 40 years of climate data on extreme climate indices to inform targeted adaptation strategies for farmers and policymakers in the Tigray region. Therefore, this study is conducted to analyze the trends and variability of extreme temperature and rainfall in the northwestern and central zones of Tigray.
2. Materials and Methods
2.1. Description of the Study Area
The Tigray Regional State has seven administrative zones, with an altitude ranging from 550 meters around Humera in the western part to 3988 meters above sea level in mount Tsibet in Maichew in the southern part. This study was conducted in the northwestern and central zones of Tigray covering latitudes 14.10 degrees North latitude and 38.28 degrees East longitude around Shire in the northwest zone of Tigray, and 13.62 degrees North latitude and 38.00 degrees East longitude around Abiy Adi in the central zone of Tigray (Table 1, Figure 1). Ten observational sites were selected across different agroecological niches, characterized by rugged topography consisting of highland and midland agroecology, which significantly influence the spatial and temporal patterns of temperature and rainfall, as well as the cropping systems. The sites are categorized as hot to warm semi-arid agroecology [29]. There is mono-modal rainfall pattern, which majority of the rainfall received during July and August in the main rainy season (kiremt), which occur from June to September. The average annual rainfall varies between 400-800mm, and annual temperature ranging from a minimum of 5.5 °C to a maximum of 41 °C depending on the agro-ecology of the areas.
The study area is characterized by a mixed crop-livestock farming systems. Cereal crops such as maize (Zea mays), taf or tef (Eragrostis tef), sorghum (Sorghum bicolor), finger millet and wheat (Triticum aestivum) are commonly cultivated as cereal crops, and faba bean (Viciafaba) and chick pea (Cicer aritienum L.) are the most commonly cultivated pulse crops in the northwest and central zones of Tigray. Farmers grow major vegetable crops like lettuce, swisschard, onion, tomato and cabbage as source of income during the dry season. Besides, major fruit crops like papaya, mango, avocado and citrus are grown across the study areas as perennial crops, substantially supporting the food security of smallholder farmers.
2.2. Methods and Analysis
2.2.1. Data Source and Quality Control
This study used a long-term climate data obtained from the National Aeronautic Space Administration (NASA) (https://power.larc.nasa.gov/data-access-viewer/) from 1983-2023, due to the absence of quality data from ground-based meteorological stations. In this view, it is difficult to obtain quality data in developing countries like Ethiopia, particularly in remote areas where meteorological stations are not available (Table 1). However, it is important to use satellite data as an alternative source. Therefore, research studies indicate that application of the NASA POWER climate data are essential for predicting climate change and variability ([30,31].
In order to prevent inaccurate data that could alter the seasonal cycle or affecting the homogeneity of the data, data for each station were examined and checked for missing values [32], using the RClimDex 1.10 software technique to ensure the data quality control [33]. The Meteorological Service of Canada’s Climate Research Branch’s Expert Team on Climate Change Detection Monitoring and Indices (ETCCDMI) created RClimDex to analyze 27 extreme temperature and rainfall indices. Both the daily maximum and minimum temperature were set to a missing value if the daily maximum temperature was less than the corresponding daily minimum temperature, and daily rainfall amounts less than 0 were eliminated.
Outliers are values that are outside of a region defined by the user, which is the mean plus or minus n times the standard deviation of the value for the day, that is (mean*std, or mean + n*std). Standard deviation (std) represents the standard deviation of the day and n is an input value selected by the user, and mean is the computed value from the climate data of the day [33]. Therefore, the number of standard deviations was set to be four, as the software detects the values that lie outside four standard deviations of the mean of the time series.
2.2.2. Trend Analysis
The Mann-Kendall and Sen’s slope estimator are commonly used tests for temperature and rainfall trend analysis [21,34,35]. The Mann–Kendal’s trend test [36] was applied to detect the trends in the different temperature and precipitation indices (Table 2). The Mann–Kendal’s test is a non-parametric test, with no requirements the data to be neither linear nor normal [37]. The Mann–Kendal statistic (S) measures the time series trend of the different temperature and rainfall extreme indices.
where the number of observations is denoted by n, while Yi and Yj are represented as the rank of ith(i = 1, 2, 3. …n − 1) and jth (j = i + 1, 2, 3. …n) observations [36,38].
The Mann-Kendal test statistic (S) is calculated by computing the difference between the later measured value and all earlier measured values following Equation 1 [37]. Where, sign (Yj–Yi) is equal to +1, 0 or −1. When the magnitude of the S is a large positive number, the later measured values tend to be larger than the earlier one, and an upward trend is indicated. Whereas, when the S is a large negative number, the measured values tend to be smaller than the earlier ones and the trend will be a downward one. (Yj–Yi), where j > I, and assign the integer 1, 0 or − 1 to positive difference, no difference, and negative differences, respectively. The S test statistic is computed as the sum of the integers (Equation 1). The magnitude of the slope of the trends from temperature and rainfall extremes was calculated using the Sen’s slope estimator (ß) [39]; which is the median of set of slopes using Equation 2 that j > 1.
The Z statistic is also another important parameter to measure significance of the trend for each parameter. The variance of S, for the situation where there may be ties (i.e., equal values) in the x values, is given by;
where, m is the number of tied groups in the data set and ti is the number of data points in the ith tied group. For n larger than 10, ZMK approximates the standard normal distribution [41,42] and computed as follows.
The presence of a statistically significant trend is evaluated using the ZMK value. In a two-sided test for trend, the null hypothesis Ho should be accepted if |ZMK| < Z1− /2 at a given level of significance. Z1-α/2 is the critical value of ZMK from the standard normal table. Example for 5% significance level, the value of Z1-α/2 is 1.96. If there is a linear trend time series, then the slope can be estimated using a simple non-parametric procedure known as Sen’s estimator [39]. The slope estimates of N pairs of data are first computed by;
where, Xj and Xk are data values at times j and k (j > k) respectively. The median of these N values of Qi is Sen’s estimator of slope. If N is odd, then Sen’s estimator is computed by Qmed = Q(N+1)/2 and if N is even, then Sen’s estimator is computed by Qmed = [(QN/2 + Q(N+2)/2)/2]. Finally, Qmed is tested by a two-sided test at the 100(1-¬α) % confidence interval and the true slope may be obtained by the non-parametric test.
2.2.3. Extreme Climate Indices
RClimDex software v.1.1 computes 27 extreme temperature and rainfall indices, based on the guidelines of the Expert Team on Climate Change Detection and Indices (ETCCDI) [33]. In this study, out of the 27 indices, we included 21 extreme temperature and rainfall indices to analyze the trends over the past 40 years in the northwest and central zones of Tigray (Table 2).
2.2.4. Spatial Data Analysis and Interpolation
Spatial distribution of extreme climate indices over the selected observational stations were analyzed using ArcMap 10.8 software. Interpolated maps were generated using the Inverse Distance Weighting (IDW) technique to visualize spatial variations and trends in selected temperature and rainfall indices across the ten observational stations. This technique is one of the most frequently used deterministic models in spatial interpolation [42].
3. Results
3.1. Extreme Temperature Indices
The results indicated the trends of extreme temperature indices across ten selected observation stations in the northwest and central zones of Tigray from 1983-2023. Monthly maximum and minimum temperatures ranges, as well as related climate indices, namely TX90p, TX10p, TN90p, TN10p, and other associated indices such as the WSDI, CSDI, and DTR were analyzed (Table 3).
Extremes in the monthly maximum temperatures (TXx) demonstrated a marked increase across several stations, with statistically significant (p varying from <0.01 to <0.05) increase over the last forty years. The result suggests an increasing frequency of extreme heat events in the area, which might have subsequent negative impact on agricultural productivity and human health. Similarly, the warm spell duration indicator (WSDI) showed an increasing trend with no statistical significance (p>0.05) for most stations.
There was a notable decrease in cooling indictors such as TXn and TNn (Figure 2), TX10p (Figure 4), CSDI and TN10p (Figure 3) across the study sites. This trend was statistically significant across several stations, particularly for TXx, TNx and TN90p (Table 3), reflecting reduced cold event occurrences in the study areas. Such shifts are likely associated with broader warming patterns and may be exacerbated by climate change. On the other hand, the diurnal temperature range (DTR) (Table 3, Figure 6), a measure of the difference between daily maximum and minimum temperatures, showed minimal change over the last 40 years with no significant change across most stations suggesting that while temperature extremes are increasing, the daily fluctuation between day and night temperatures has not shown a clear variability over the time span.
While the general trend indicates warming, the specific trends varied by location. Some stations like Shire-Endaselassie, Semema-Shire, and Beles showed strong positive trends in temperature extremes, while others exhibited weaker trends or no significant change. This variability underscores the heterogeneous nature of climate change impacts within the study region. The findings indicate that the northwest and central zones of Tigray have experienced significant warming, especially in terms of minimum temperatures and other extreme temperature indices. The observed increase in warm temperature extremes (TXx) and the reduction in cold temperature extremes (TXn, TNn) reflect a shifting climate pattern towards more frequent and intense heat events, potentially affecting local ecosystems, agriculture, and human well-being.
- Seasonal and annual variability of Cooling indicators
While maximum temperatures have shown a consistent, though not statistically significant, increase, minimum temperatures have demonstrated more pronounced and significant upward trends, suggesting a warming bias during the nighttime hours. The reduction in cold spells such as CSDI, TX10p (Figure 4) and TN10p (Figure 3) further suggests that the region is experiencing a general reduction in cooler climatic conditions, and vice versa is true.
The results also indicate a highly significant (p<0.01) decrease on TN10p ranging from -0.29 0C at Shire-Endaselassie, Semema-Shire, and Beles to -0.41 0 C at Selekleka, Zana, Axum, Semema-Adet, Wukro Maray, and Adwa, with Abiy Adi experiencing a highly significant (p<0.01) decrease of -0.36 0C per year over the past forty years (Table 3). Besides, the trends on TX10p also varied from -0.05 0C at Shire-Endaselassie, Beles and Semema in the northwest zone to -0.15 0C at Adwa and Abiy Adi in the central zone, and a moderate decrease of -0.12 0C at the remaining five observational stations within the two zones, highlighting the reduction in cool days over the study areas.
- 2.
- Seasonal and annual variability of warming indicators
The trend analysis on warm nights (TN90p) (Table 2) revealed a highly significant increase on warm nights 1983-2023, except at Shire-Endaselassie, Beles and Semema-Shire with no significant increase with 0.14 days per year. The average annual changes on TN90p varied from 0.18 days per year at Abiy Adi to 0.26 days per year at Selekleka, Zana, Wukro Maray, Aum, and Adwa.
The annual and seasonal TN90p indicated there was a considerable change over the last 40 years in the central and northwest zones of Tigray, with positive increase across Abiyadi, Axum, Shire, and Zana. The average annual TN90p highlight a warming trend over Shire-Endaselassie 32.64 warm nights in 2002, and Axum and Zana recorded 27.46 nights in 2019, and Abiyadi reaching 23.77 in 2002. Similarly, the seasonal changes showed and increasing changes, especially in July and September, which frequently exceed 40 warm nights, with exceptional values like 67.55 in Abiyadi and 80.25 in Axum and Zana during July 2019. The rising in TN90p signals a shifting climate, which substantially affecting agriculture, water resources, and livelihoods in the study areas (Figure 5).
Besides, there was also a considerable seasonal change on TN90p over the study areas from 1983-2023. Figure 6 illustrates the seasonal changes on TN90p at Abiy Adi, Shire-Endaselassie, Zana and Axum, which might negatively affect the livelihood of the communities, natural resources and agricultural production systems in the study areas. Besides, the TN90p was observed higher in 2019 (Figure 6) at Abiy Adi, Zana and Axum, whereas, the highest change on warm nights at Shire-Enadaselassie was observed in July in 2002 with 70.6 days, when compared with the other sites. On the other hand, there was also a considerable variability on WSDI, CSDI and DTR in the study areas. The highest (14.08 0C) and smallest (9.47 0C) changes on DTR were observed at Abiy Adi in 2004 and Semema-Shire in 2023 in the northwest and central zones of Tigray, respectively; indicating the highest and smallest changes between the maximum and minimum temperatures, respectively. Whereas, there was similar variability on DTR at Axum, Zana and Semema-Adiet.
3.2. Extreme Rainfall Indices
This study analyzed the trends in extreme rainfall indices across ten observation stations in the northwest and central zones of Tigray. The indices analyzed include, R10mm, R20mm, R25mm, CWD, CDD, R95p, R99p, and PRCPTOT (Table 4, Figure 7 and Figure 8). The results indicate varying trends across the stations, with some indices showing statistically significant changes offering valuable insights into the temporal changes in extreme rainfall events and their implications for the region.
Rx1Day exhibited significant positive trend at Shire-Endaselassie and Semema-Shire (p<0.05), suggesting an increase in the frequency and intensity of extreme 1-day rainfall events over the past 40 years. This suggests the region was experiencing more intense daily rainfall events that may lead to increased flood risks. Rx5Day did not show any statistically significant trends across the stations. The lack of significance indicates that, although there is variability, extended periods of heavy rainfall (over five days) have not increased in intensity or frequency during the study period.
R25mm showed significant positive trends at Shire-Endaselassie, Semema-Shire, Beles, and Zana (p<0.05). These stations are experiencing more frequent heavy rainfall days, which can lead to local flooding and soil erosion, increasing the risks to agricultural productivity and infrastructure. On the other hand, R10mm and R20mm did not show any statistically significant trends in the study area. Although some increases were observed at a few stations, these trends did not reach the significance level of p<0.05, indicating that the frequency of moderate to heavy rainfall events has not changed significantly over the study period.
On the other hand, CWD showed a negative trend with no significant variability in majority of the observation sites, except at Abiy Adi which is highly significant (p<0.01) change, highlighting a slight decrease in the length of wet spells. Similarly, CDD also showed a positive trend with no significant increase throughout the study areas.
Annual rainfall (PRCPTOT) did not show statistically significant (p<0.05) trends across most of the study area (Table 3, Figure 7). Some stations, such as Abiy Adi, exhibited slight fluctuations, but these were not significant enough to indicate a clear long-term change in total precipitation levels. Figure 7 illustrates there was a very small amount of rainfall from 1999 to 2005, and 2018, which contributed a substantial impact on crop production in the study areas.
Similarly, R95p exhibited significant positive trends at Shire-Endaselassie and Abiy Adi (p<0.05), signifying an increase in the intensity of the wettest days. These trends suggest that the most extreme rainfall events are becoming more frequent or intense in these regions. Whereas, R99pshowed highly significant increases at Shire-Endaselassie and Semema-Shire (p<0.001), highlighting a marked intensification of the most extreme rainfall events at these stations. Such increases suggest a heightened risk of catastrophic flooding and other extreme weather phenomena linked to rare, intense rainfall.
3.3. Spatial Variability of Extreme Temperature Indices
This study demonstrated there is a highly variability of extreme temperature across the study areas (Figure 9). In this view, the spatial distribution of the monthly maximum value of the daily minimum temperature (TXx) (Figure 9) indicates regions around Abiy Adi have experienced a gradual increase in TXx, with a rate of 0.02 °C per year. This rate of change is relatively lower than the 0.026 °C per year observed in the majority of the study areas, suggesting a more pronounced warming trend in these regions. Such warming could have significant implications for agricultural productivity with substantial negative impact on crop growth and yields, as well as contributing to the reduction of water bodies and posing risks to both human and animal health. Additionally, areas surrounding Selekleka, Wukro Maray, Axum, and Adwa have exhibited an accelerated increase in warm days (TX90p), with an average rise of 0.189 days per year over the study period. In contrast, regions around Shire-Endaselassie, Beles, Semema-Shire, and Abiy Adi have experienced a more moderate increase in TX90p, with a rate of 0.10 days per year in both zones.
An increasing trend (positive trend) in the monthly minimum of the daily minimum temperature (TNn) was observed across the study areas. Particularly, the TNn in areas in the vicinity of Abiy Adi exhibited a relatively modest increase of 0.013 °C per year, compared to the other study areas, where TNn increased at a rate of 0.016 °C per year. Whilst, the distribution of TN10p, which represents the frequency of cool nights, a notable and statistically significant decline was recorded over the time span. The smallest reduction -0.29 days per year, was observed in areas around Shire-Endaselassie, Semema-Shire, and Beles in the northwest zone. Conversely, a more pronounced and consistent decrease of approximately -0.41 days per year in TN10p was observed across the remaining stations, excluding Abiy Adi, indicating greater variability in the frequency of cool nights.
3.4. Spatial Variability of Extreme Rainfall Indices
The spatial interpolation of PRCPTOT indicates considerable annual rainfall variability, particularly in areas surrounding Shire, Shire-Endaselassie, Beles, and Semema-Shire, where the peak rainfall value reaches 3.5 mm per year (Figure 10). In contrast, the majority of the study area experiences relatively low variability, with moderate fluctuations observed near Abiy Adi. Figure 10 illustrates that the most significant changes in the frequency of consecutive wet days (CWD) are observed around Abiy Adi, with a decline of -0.71 days per year. Conversely, most regions show a more modest reduction in CWD frequency, averaging -0.37 days per year, suggesting an increasing occurrence of dry spells. This trend could negatively impact agricultural productivity and water resources by enhancing evapotranspiration rates.
On the other hand, the frequency of consecutive dry days (CDD) exhibits a consistent positive trend across all sites, with the smallest increase of 0.32 days per year recorded near Abiy Adi. However, there is notable spatial variability in CDD trends, with the northwest and central zones of Tigray experiencing the highest increase of 0.45 days per year, signifying a rise in the frequency of dry spells. Such changes could adversely affect crop growth and yields during the rainy season (Figure 10). Additionally, the frequency of R20mm rainfall has shown an upward trend in the regions around Shire-Endaselassie, Beles, and Semema, with a maximum increase of 0.109 days per year over the past four decades. In contrast, the frequency of such events decreases towards the central zone, with a minimal increase of 0.07 days per year around Abiy Adi.
The spatial interpolation of R95p indicates a consistent increasing trend in extreme precipitation across the study area over the past four decades. The most significant changes on the annual R95p were observed in areas around Shire-Endaselassie, Semema-Shire, and Beles in the northwest, as well as area around Abiy Adi in the central zone, with an annual increase of approximately 6.13 mm. In contrast, the remaining five stations across both zones exhibit a more moderate rise in R95p, with an average annual increase of 4.27 mm. These findings highlight the spatial distribution in the trends of extreme rainfall, with certain areas experiencing more pronounced changes than others. Similarly, the maximum rainfall recorded over five consecutive days (Rx5Day) demonstrated an upward increase of 1.07 mm per year observed in areas around Shire-Endaselassie, Semema, and Beles in the Northwest zone. Furthermore, areas including Selekleka, Zana, Wukro Maray, Axum, Semema-Adet, and Adwa exhibited a consistent increase in Rx5Day of 0.37 mm per year. In comparison, areas around Abiy Adi in the central zone, as well as Selekleka and Zana in the northwest zone, experienced moderate changes, reflecting lower rates of increase in the time span.
4. Discussions
4.1. Temporal Variability on Extreme Temperature
In this study eleven extreme temperature indices were analyzed for temporal variability and trends over the last forty years in the northwest and central zones of Tigray. The results demonstrated there was a highly significant temporal variability on extreme temperature indices in the selected stations. Warming indicators showed a significantly increasing trend in majority of the study areas, whereas, cooling indicator values resulted in a significant negative trend.
Recent studies indicate that there has been a substantial warming in different parts of Ethiopia including different part of Tigray [17,18,20,43,44], and will continue warming in the future climatic scenario [ 11; 45; 46; 47], which will subsequently affect crop production [11,13,24,46].
The results revealed there was a significant positive trend on warming indicator values like TX90p, TN90p, and WSDI, whereas a significant (p<0.05) decreasing trend on cooling indicator indices like TX10p, TN10p and CSDI across the study areas. The monthly maximum temperature significantly (p<0.01) increased by 0.02 to 0.026 0C across the study areas, whereas, the monthly minimum temperature did not show a significant variability across the study areas with annual variability ranging from 0.013 to 0.0166 0C per year.
According to 17 (2019), warm nights (TN90p) and warm days (TX90p) were significantly increasing by 0.19 and 0.34% per year, respectively, accompanied with a significant decrease on cool days with 0.29%/year, and an increasing and a decreasing trend on WSDI and CSDI of 0.36 and 0.14 days per year, respectively in Ethiopia; which is in line with the results obtained in this study. Similarly, recent studies also indicate that there is an increasing trend on warming indicator and a decreasing trend on extreme temperature indices across different parts of Ethiopia, with WSDI, TN90p, and TX90p; and TN10p and TX10p, respectively [48,49,50]. Similarly, there was an increasing trend in warming indicator indices and a decreasing trend in cooling indicator values in different parts of Ethiopia, which might have a substantial impact on water loss through increasing evapotranspiration, surface and groundwater bodies, and human health [51].
4.2. Temporal Variability of Extreme Rainfall Indices
The annual rainfall (PRCPTOT) varied from 0.38 to 3.5 mm per year across the study areas, with the highest variability observed in the northwest zone of Tigray with 3.5 mm per annum. On the other hand, the frequency of obtaining a heavy rainfall (R10mm), very heavy rainfall (R20 mm) and extremely heavy rainfall (R25 mm) revealed an irregular pattern across the study areas, with a decreasing trend of R10 mm varying from -0.02 to -0.12 days per year in majority of the study areas, accompanied with an increasing trend in areas around Shire-Endaselassie, Beles and Semema-Shire in the Tahtay Korarowereda with 0.09 days per year. Particularly, the frequency of obtaining an extremely heavy rainfall has a higher probability over across the study areas.
Compelling evidences indicate extreme rainfall indices have no uniform variability across different parts of the world such as Iran [52, Turkey [53], Indonesia [34], Kenya, Tanzania and Ethiopia [17]. Similarly, research studies also indicate that Ethiopia has a highly variable rainfall pattern due to its high agro-ecological diversity with coefficient of variation (CV) ranging from 11.3% around Southern Nations, Nationalities and Peoples (SNNP) (Old Regional State) to 40.0% at Somali Regional State [54], and from 23.52 to 47.30% around the Giba river in the northern Ethiopia in Tigray [28]. On the other hand, annual rainfall also revealed a negative trend (ranging from -0.02 mm at Dangla to -2.23 mm per year at Injibara) [20], with some areas revealing a positive trend varying from 1.10 mm at Gondar to 1.34 mm per year at Addis Zemen, which is similar to the trends observed in this study. It has also been stated that annual rainfall in the upper Awash basin showed irregular pattern with increasing and decreasing trends from 1983 to 2016, varying from -1.7 to 5.9 mm per year [49].
Similar studies indicate that there was an irregular pattern of R20 mm in different parts of Ethiopia. It has been stated that there was a positive trend up to 24 days South-west Ethiopia, and, and a significant negative trend up to -13 days per year in areas around Afar, Harerge and Fik [17], which can subsequently affect grazing lands and crop growth and yield. Similarly, there was also a positive trend on R10 mm and R20 mm in Koka dam and Addis Alem, and a significant decreasing trend in R20 mm at Ginchi and Sendafa stations in the upper Awash basin [49]. On the other hand, a negative trend of R20 mm was also observed in western parts of Tigray varying from -0.07 at Adigoshu to -0.27 days per year at Maygaba [19], indicating that the frequency of R20 mm does not have uniform pattern in different parts of the country.
According to [22] (2020), there was an increasing trend on CDD with 0.074 days per year, and a decreasing trend on wet days indicator values of CWD and PRCPTOT with -0.034 days per year and -0.28 mm per year in Addis Ababa Bole station, and an increasing trend with 0.054 days per year and a 1.08 mm per year at Addis Ababa Tikur Ambesa Observatory station, which subsequently cause a multifaceted impact on the community. Similarly, multi-model projections indicate there will be an increase and decrease on the frequency of CDD and CWD, respectively in the horn of Africa under the 1.5 and 2 0C Global Warming Levels (GWL), except in some coastal regions [7]. The results obtained in this study also are in agreement with results reported by [55] (2025) which PRCPTOT revealed a positive trend in different parts of Ethiopia with a 1.7 mm per year. The reduction in the amount of rainfall, and wet and dry spell changes will negatively affect coastal cities, lake regions, highland and arid and semiarid areas in Kenya, Ethiopia, Tanzania, Sudan Somali [7].
The results also indicate the intensity of R99p was highly significantly (p<0.01) in majority of the study areas and moderately significant (p<0.05) over the past forty years varying from 3.23 to 5.25 mm per year, whereas, R95p did not show a significant positive trend while increased by 4.27 to 6.13 mm per year across the study areas in the northwest and central zones of Tigray. In this view, studies also indicate that R95p and R99p revealed a significant increase up to 16 days (R95p) and 12 days (R99p) in different parts of Kenya, Southern Ethiopia and the northern and central parts of Tanzania; accompanied with significant negative trends in R95p up to -9 days and R99p up to -6 days per year in some parts of Eastern Ethiopia around Afar and southern parts of Tanzania [17]. On the other hand, there was also a considerable variability in the trends of R95p and R99p in different parts of Ethiopia, with a 66% (negative trend) and 33% (positive trend) of R95p and 52.43% (negative trend) and 42.72% (positive trend) of R99p, out of 103 meteorological stations in different parts of the country [55]; and such variability affects agricultural productivity [44].
4.3. Spatial Variability of Extreme Temperature and Rainfall Indices
The spatial interpolation for extreme temperature indices such as TXx, TX90p, TX10p, TN90p, TN10p, and TNn, and extreme rainfall indices like PRCPTOT, CWD, CDD, R20mm, Rx5Day, and R95p indicate there is a considerable spatial variability in across the study areas. The highest changes or warming occurs in the northwest zone of Tigray, particularly in areas around Shire-Endaselassie, Beles and Semema-Shire (Figure 9). Similarly, there is a high possibility of increasing rainfall occurrence in areas around Shire-Endaselassie with the highest value 3.5 mm per year when compared with majority of the study areas.
In line with these, there is a possibility of warming in different parts of Ethiopia, where increasing extreme temperature indices were reported across different parts of the country [11,17,22,24,49]. The results obtained in this study align with the IPCC report [1], which highlight a warming of the Earth by 1.10C from 2011-2020 which might be attributed through land use and land use changes, and lack of sustainable energy consumption. Besides, high extreme temperature variability was observed in the upper Awash Basin form 1983-2016, particularly on TXx, TXn, TNx, TNn, TX90p, TX10p, TN90p, and TN109 [49], which subsequently cause negative impacts on the livelihood of the community and agricultural production.
Recent studies conducted in different parts of Ethiopia [17,49], revealed that there is a notable spatial variability of extreme rainfall indices, such as CDD, CWD, PRCPTOT, R20mm, Rx5Day, R10mm and R95p in the upper Awash Basin [49], and in areas around the northwest and western zones of Tigray from 1983-2016 [19]. It is worth understanding that these changes have an inevitable negative impact on agricultural production and food security.
5. Conclusions
In this study, a long-term climate data focusing on extreme temperature and annual rainfall were analyzed. There results demonstrated the northwest and central zones of Tigray experienced a considerable warming trend and an increased likelihood of extreme rainfall events over the past forty years. These changes caused a substantial negative impact on agriculture, risk on flooding and water logging over the study areas, which align with the world trends on extreme climatic indices [1]. Particularly, areas around Shire-Endaselassie, Beles and Semema_Shire experienced a highly significant warming and substantial increase in the annual rainfall when compared with the other sites. These findings suggest a consistent warming trend coupled with more frequent extreme heat events. Such changes in temperature patterns could have significant implications for agricultural production, water resources, and climate adaptation strategies in the region. Long-term monitoring and adaptive measures will be essential to mitigate the potential impacts of extreme temperature trends. On the other hand, the spatial variability of extreme temperature and rainfall might also be associated with agro-ecological niche of the areas. These changes are expected to have a substantial effect on agricultural production and food security.
Spatiotemporal changes and variabilities require suitable adaptation strategies like crop selection, irrigation water management, soil and water conservation practices to reduce erosion and land degradation, thereby to ensure sustainable agricultural production and livelihood of the farming community. Besides, this research suggests farther research, monitoring and collaborative works with stakeholders and decision-makers to effectively address the negative impacts of climate change and vulnerability, and identify suitable climate change adaptation strategies in the study areas.
Author Contributions
Abadi B.: Conceptualization, writing the original draft, data acquisition and analysis, spatial data interpolation and visualization. Mehari H.: Spatial interpolation and mapping. Esayas A., Tadesse G., Redae E. and Letemichael G.: Editorial and review final draft.
Funding
This study was financially sponsored by Aksum University.
Institutional Review Board Statement
Not Applicable.
Informed Consent Statement
Not Applicable.
Data Availability Statement
Data will be made available on request.
Acknowledgments
This work is part of research project funded by Aksum University, we, the authors would like to thank Aksum University for financially supporting the project.
Conflicts of Interest
The authors declare there is no conflict of interest.
References
- Calvin, et al. IPCC, 2023: Climate Change 2023: Synthesis Report, Summary for Policymakers. Contribution of Working Groups I, II and III to the Sixth Assessment Report of the Intergovernmental Panel on Climate Change [Core Writing Team, H. Lee and J. Romero (eds.)]; Arias, P., Bustamante, M., Elgizouli, I., Flato, G., Howden, M., Méndez-Vallejo, C., Pereira, J. J., Pichs-Madruga, R., Rose, S. K., Saheb, Y., Sánchez Rodríguez, R., Ürge-Vorsatz, D., Xiao, C., Yassaa, N., Romero, J., Kim, J., Haites, E. F., Jung, Y., Stavins. Y. Park, R., Eds.; IPCC: Geneva, Switzerland, 2023. [Google Scholar] [CrossRef]
- Lenssen, N. J. L.; Schmidt, G. A.; Hansen, J. E.; Menne, M. J.; Persin, A.; Ruedy, R.; Zyss, D. Improvements in the GISTEMP Uncertainty Model. J. Geophys. Res. Atmos. 2019, 124(12), 6307–6326. [Google Scholar] [CrossRef]
- Fonjong, L.; Matose, F.; Sonnenfeld, D. A. Climate change in Africa: Impacts, adaptation, and policy responses. In Global Environmental Change; Elsevier Ltd, 2024. [Google Scholar] [CrossRef]
- Omotoso, A. B.; Omotayo, A. O. The interplay between agriculture, greenhouse gases, and climate change in Sub-Saharan Africa. In Regional Environmental Change; Springer Science and Business Media Deutschland GmbH, 2024; Vol. 24, Issue 1. [Google Scholar] [CrossRef]
- Kotir, J. H. Climate change and variability in Sub-Saharan Africa: A review of current and future trends and impacts on agriculture and food security. Environment, Development and Sustainability 2011, 13(Issue 3), 587–605. [Google Scholar] [CrossRef]
- Serdeczny, O.; Adams, S.; Baarsch, F.; Coumou, D.; Robinson, A.; Hare, W.; Schaeffer, M.; Perrette, M.; Reinhardt, J. Climate change impacts in Sub-Saharan Africa: from physical changes to their social repercussions. Reg. Environ. Change 2017, 17(6), 1585–1600. [Google Scholar] [CrossRef]
- Osima, S.; Indasi, V. S.; Zaroug, M.; Endris, H. S.; Gudoshava, M.; Misiani, H. O.; Nimusiima, A.; Anyah, R. O.; Otieno, G.; Ogwang, B. A.; Jain, S.; Kondowe, A. L.; Mwangi, E.; Lennard, C.; Nikulin, G.; Dosio, A. Projected climate over the Greater Horn of Africa under 1.5 °c and 2 °c global warming. Environ. Res. Lett. 2018, 13(6). [Google Scholar] [CrossRef]
- Alaminie, A. A.; Tilahun, S. A.; Legesse, S. A.; Zimale, F. A.; Tarkegn, G. B.; Jury, M. R. Evaluation of past and future climate trends under CMIP6 scenarios for the UBNB (Abay), Ethiopia. Water 2021, 13(15). [Google Scholar] [CrossRef]
- Debalke, D. B.; Abebe, J. T. Maize yield forecast using GIS and remote sensing in Kaffa Zone, South West Ethiopia. Environ. Syst. Res. 2022, 11(1). [Google Scholar] [CrossRef]
- Gebrekiros, G.; Araya, A.; Yemane, T. Modeling Impact of Climate Change and Variability on Sorghum Production in Southern Zone of Tigray, Ethiopia. J. Earth Sci. Clim. Change 2015, 07(01). [Google Scholar] [CrossRef]
- Gebresamuel, G.; Abrha, H.; Hagos, H.; Elias, E.; Haile, M. Empirical modeling of the impact of climate change on altitudinal shift of major cereal crops in South Tigray, Northern Ethiopia. J. Crop Improv. 2022, 36(2), 169–192. [Google Scholar] [CrossRef]
- Alemayehu, S.; Olago, D.; Opere, A.; Zeleke, T. T.; Dejene, S. W. Evaluating Wheat Cultivation Potential in Ethiopia Under the Current and Future Climate Change Scenarios. Land 2024, 13(11). [Google Scholar] [CrossRef]
- Eshetu, Z.; Gebre, H.; Lisanework, N. Impacts of climate change on sorghum production in North Eastern Ethiopia. Afr. J. Environ. Sci. Technol. 2020, 14(2), 49–63. [Google Scholar] [CrossRef]
- Hadgu, G. Trend and variability of rainfall in Tigray, Northern Ethiopia: Analysis of meteorological data and farmers’ perception. Acad. J. Agric. Res. 2013, 1(6), 88–100. [Google Scholar] [CrossRef]
- Balcha, S. K.; Awass, A. A.; Hulluka, T. A.; Bantider, A.; Ayele, G. T. Assessment of future climate change impact on water balance components in Central Rift Valley Lakes Basin, Ethiopia. J. Water Clim. Change 2023, 14(1), 175–199. [Google Scholar] [CrossRef]
- Kumar, P.; Tokas, J.; Kumar, N.; Lal, M.; Singal, H.; Praveen Kumar, C. Climate change consequences and its impact on agriculture and food security. 124. Int. J. Chem. Stud. 2018, 6(6), 124–133. [Google Scholar]
- Gebrechorkos, S. H.; Hülsmann, S.; Bernhofer, C. Long-term trends in rainfall and temperature using high-resolution climate datasets in East Africa. Sci. Rep. 2019, 9(1). [Google Scholar] [CrossRef] [PubMed]
- Belay, A.; Demissie, T.; Recha, J. W.; Oludhe, C.; Osano, P. M.; Olaka, L. A.; Solomon, D.; Berhane, Z. Analysis of climate variability and trends in Southern Ethiopia. Climate 2021, 9(6). [Google Scholar] [CrossRef]
- Berhane, A.; Hadgu, G.; Worku, W.; Abrha, B. Trends in extreme temperature and rainfall indices in the semi-arid areas of Western Tigray, Ethiopia. Environ. Syst. Res. 2020, 9(1), 3. [Google Scholar] [CrossRef]
- Birara, H.; Pandey, R. P.; Mishra, S. K. Trend and variability analysis of rainfall and temperature in the tana basin region, Ethiopia. J. Water Clim. Change 2018, 9(3), 555–569. [Google Scholar] [CrossRef]
- Jiqin, H.; Gelata, F. T.; Gemeda, S. C. Application of MK trend and test of Sen’s slope estimator to measure impact of climate change on the adoption of conservation agriculture in Ethiopia. J. Water Clim. Change 2023, 14(3), 977–988. [Google Scholar] [CrossRef]
- Mekonen, A. A.; Berlie, A. B. Spatiotemporal variability and trends of rainfall and temperature in the Northeastern Highlands of Ethiopia. Model. Earth Syst. Environ. 2020, 6(1), 285–300. [Google Scholar] [CrossRef]
- Elzopy, K. A.; Chaturvedi, A. K.; Chandran, K. M.; Gopinath, G.; Naveena, K.; Surendran, U. Trend analysis of long-term rainfall and temperature data for Ethiopia. South Afr. Geogr. J. 2021, 103(3), 381–394. [Google Scholar] [CrossRef]
- Hadgu, G.; Tesfaye, K.; Mamo, G. Analysis of climate change in Northern Ethiopia: implications for agricultural production. Theor. Appl. Climatol. 2015, 121(3–4), 733–747. [Google Scholar] [CrossRef]
- Hailekiros Assefa, T. Flood Risk Assessment in Ethiopia. 10(1). www.iiste.org. 2018; 10, 1.
- Field, C. B.; Barros, V. R.; Dokken, D. J.; Mach, K. J.; Mastrandrea, M. D.; Bilir, T. E.; Chatterjee, M.; Yuka, K. L. E.; Estrada, O.; Genova, R. C.; et al. Climate Change 2014 Impacts, Adaptation, and Vulnerability Part A: Global and Sectoral Aspects Working Group II Contribution to the Fifth Assessment Report of the Intergovernmental Panel on Climate Change Edited by. 2014. Available online: www.cambridge.org/9781107641655.
- Conway, D.; Schipper, E. L. Adaptation to climate change in Africa: Challenges and opportunities identified from Ethiopia. Glob. Environ. Change 2011, 21, 227–237. [Google Scholar] [CrossRef]
- Kiros, G.; Shetty, A.; Nandagiri, L. Extreme rainfall signatures under changing climate in semi-arid northern highlands of Ethiopia. Cogent Geosci. 2017, 3(1), 1353719. [Google Scholar] [CrossRef]
- Haftom, H.; Haftu, A.; Goitom, K.; Meseret, H. Agroclimatic zonation of Tigray region of Ethiopia based on aridity index and traditional agro-climatic zones. J. Agrometeorol. 2019, Vol. 21(2), 176–181. [Google Scholar] [CrossRef]
- Halimi, A. H.; Karaca, C.; Büyüktaş, D. Evaluation of NASA POWER Climatic Data against Ground-Based Observations in the Mediterranean and Continental Regions of Turkey. J. Tekirdag Agric. Fac. 2023, 20(1), 104–114. [Google Scholar] [CrossRef]
- Rodrigues, G. C.; Braga, R. P. Evaluation of nasa power reanalysis products to estimate daily weather variables in a hot summer mediterranean climate. Agronomy 2021, 11(6). [Google Scholar] [CrossRef]
- Abbas, F. Analysis of a historical (1981-2010) temperature record of the Punjab Province of Pakistan. Earth Interact. 2013, 17(15), 1–23. [Google Scholar] [CrossRef]
- Xuebin Zhang, B.; Yang, F.; Alexander, L.; Zwiers, F.; Gleason, B.; Stephenson, D.; Klan Tank, A.; New, M.; Vincent, L. RClimDex (1.0) User Manual; 2004. [Google Scholar]
- Aditya, F.; Gusmayanti, E.; Sudrajat, J. Rainfall trend analysis using Mann-Kendall and Sen’s slope estimator test in West Kalimantan. IOP Conf. Ser. Earth Environ. Sci. 2021, 893(1). [Google Scholar] [CrossRef]
- Agarwal, S.; Suchithra, A. S.; Singh, S. P. Analysis and Interpretation of Rainfall Trend using Mann-Kendall’s and Sen’s Slope Method. Indian J. Ecol. 2021, Vol. 48(Issue 2). [Google Scholar]
- Mann, H. B. NONPARAMETRIC TESTS AGAINST TREND; 1945; Volume 13, 3. [Google Scholar]
- Yue, S.; Wang, C. The Mann-Kendall Test Modified by Effective Sample Size to Detect Trend in Serially Correlated Hydrological Series; 2004. [Google Scholar]
- Praveen, B.; et al. Analyzing trend and forecasting of rainfall changes in India using non-parametrical and machine learning approaches. Sci. Reports 2020, 10(1), 1–21. [Google Scholar] [CrossRef] [PubMed]
- Sen, P. K. Estimates of the Regression Coefficient Based on Kendall’s Tau. J. Am. Stat. Assoc. 1968, 63(324), 1379–1389. [Google Scholar] [CrossRef]
- Partal, T.; Kahya, E. Trend analysis in Turkish precipitation data. Hydrol. Process. 2006, 20(9), 2011–2026. [Google Scholar] [CrossRef]
- Yenigün, K.; Gümüş, V.; Bulut, H. Trends in streamflow of the Euphrates basin, Turkey. Proc. Inst. Civ. Eng. Water Manag. 2008, 161(4), 189–198. [Google Scholar] [CrossRef]
- Lu, G. Y.; Wong, D. W. An adaptive inverse-distance weighting spatial interpolation technique. In Computers and Geosciences; 2008; Volume 34, 9, p. 1044–1055. Alemu, T., & Mengistu, A. (2019). Impacts of Climate Change on Food Security in Ethiopia: Adaptation and Mitigation Options: A Review. In Climate Change Management (pp. 397–412). Springer. https://doi.org/10.1007/978-3-319-75004-0_23. [Google Scholar] [CrossRef]
- Asfaw, A.; Simane, B.; Hassen, A.; Bantider, A. Variability and time series trend analysis of rainfall and temperature in northcentral Ethiopia: A case study in Woleka sub-basin. Weather Clim. Extrem. 2018, 19, 29–41. [Google Scholar] [CrossRef]
- Getnet, G. T.; Dagnew, A. B.; Ayal, D. Y. Spatiotemporal variability and trends of rainfall and temperature in the tropical moist montane ecosystem: Implications to climate-smart agriculture in Geshy watershed, Southwest Ethiopia. Clim. Serv. 2023, 30. [Google Scholar] [CrossRef]
- Abebe, T.; Bekele, L.; Hessebo, M. T. Assessment of Future Climate Change Scenario in Halaba District, Southern Ethiopia. Atmos. Clim. Sci. 2022, 12(02), 283–296. [Google Scholar] [CrossRef]
- Gangadhara Bhat, H.; Moges, D. M. Climate change and its implications for rainfed agriculture in Ethiopia. J. Water Clim. Change 2021, 12(4), 1229–1244. [Google Scholar] [CrossRef]
- Mekonen, A. A.; Berlie, A. B. Rural households’ livelihood vulnerability to climate variability and extremes: a livelihood zone-based approach in the Northeastern Highlands of Ethiopia. Ecol. Process. 2021, 10(1). [Google Scholar] [CrossRef]
- Fiseha Mekonnen, E.; Abera Assefa, M.; Gochaw Ayele, A. Trends of Extreme Temperature and Rainfall Indices for Addis Ababa City, Ethiopia. J. Environ. Sci. Agric. Res. 2024, 1–9. [Google Scholar] [CrossRef]
- Gebremichael, H. B.; Raba, G. A.; Beketie, K. T.; Feyisa, G. L.; Siyoum, T. Changes in daily rainfall and temperature extremes of upper Awash Basin, Ethiopia. Sci. Afr. 2022, 16. [Google Scholar] [CrossRef]
- Mekasha, A.; Tesfaye, K.; Duncan, A. J. Trends in daily observed temperature and precipitation extremes over three Ethiopian eco-environments. Int. J. Climatol. 2014, 34(6), 1990–1999. [Google Scholar] [CrossRef]
- Wubaye, G. B.; Gashaw, T.; Worqlul, A. W.; Dile, Y. T.; Taye, M. T.; Haileslassie, A.; Zaitchik, B.; Birhan, D. A.; Adgo, E.; Mohammed, J. A.; Lebeza, T. M.; Bantider, A.; Seid, A.; Srinivasan, R. Trends in Rainfall and Temperature Extremes in Ethiopia: Station and Agro-Ecological Zone Levels of Analysis. Atmosphere 2023, 14(3). [Google Scholar] [CrossRef]
- Fathian, F.; Ghadami, M.; Haghighi, P.; Amini, M.; Naderi, S.; Ghaedi, Z. Assessment of changes in climate extremes of temperature and precipitation over Iran. Theor. Appl. Climatol. 2020, 141(3–4), 1119–1133. [Google Scholar] [CrossRef]
- Das, J.; Mandal, T.; Rahman, A. T. M. S.; Saha, P. Spatio-temporal characterization of rainfall in Bangladesh: an innovative trend and discrete wavelet transformation approaches. Theor. Appl. Climatol. 2021, 143, 1557–1579. [Google Scholar] [CrossRef]
- Gummadi, S.; Rao, K. P. C.; Seid, J.; Legesse, G.; Kadiyala, M. D. M.; Takele, R.; Amede, T.; Whitbread, A. Spatio-temporal variability and trends of precipitation and extreme rainfall events in Ethiopia in 1980–2010. Theor. Appl. Climatol. 2018, 134(3–4), 1315–1328. [Google Scholar] [CrossRef]
- Mohammed, E. A.; Zhi, X.; Abdela, K. A. Extreme Weather Patterns in Ethiopia: Analyzing Extreme Temperature and Precipitation Variability. Atmosphere 2025, 16(2). [Google Scholar] [CrossRef]
Figure 1.
Map of the study areas in the northwest and central zones of Tigray.
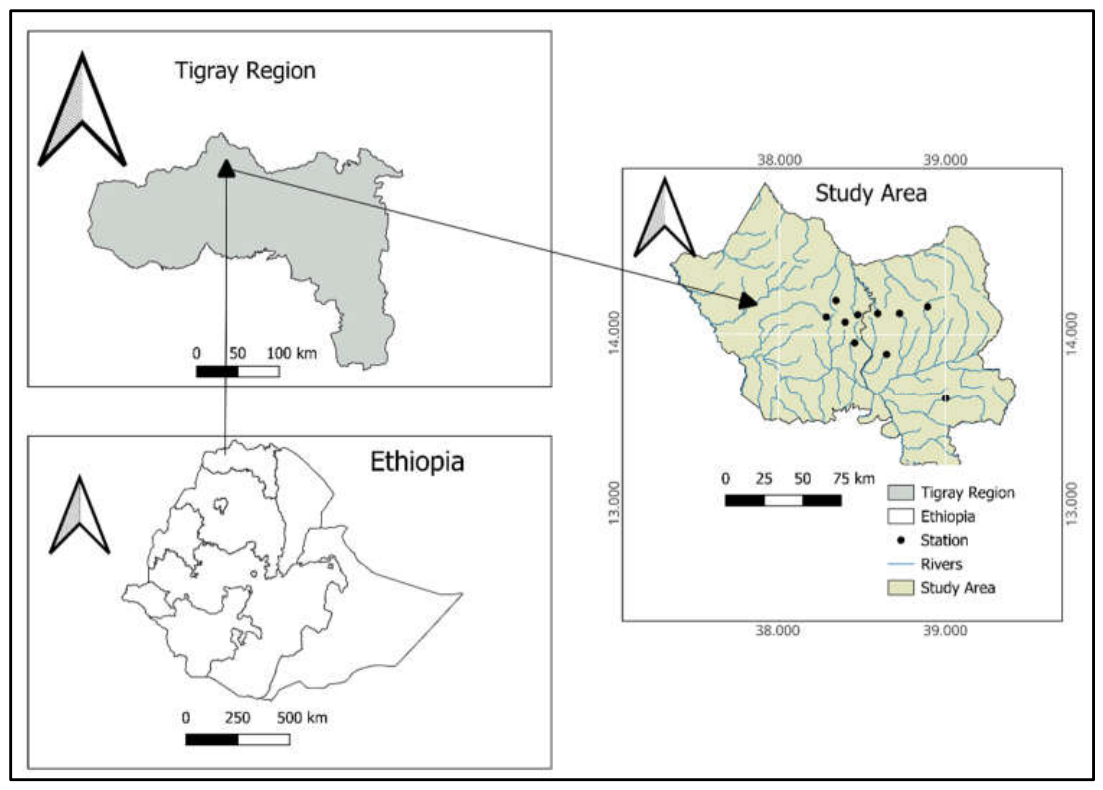
Figure 2.
Monthly minimum and maximum variability of the minimum and maximum temperature variability.
Figure 2.
Monthly minimum and maximum variability of the minimum and maximum temperature variability.
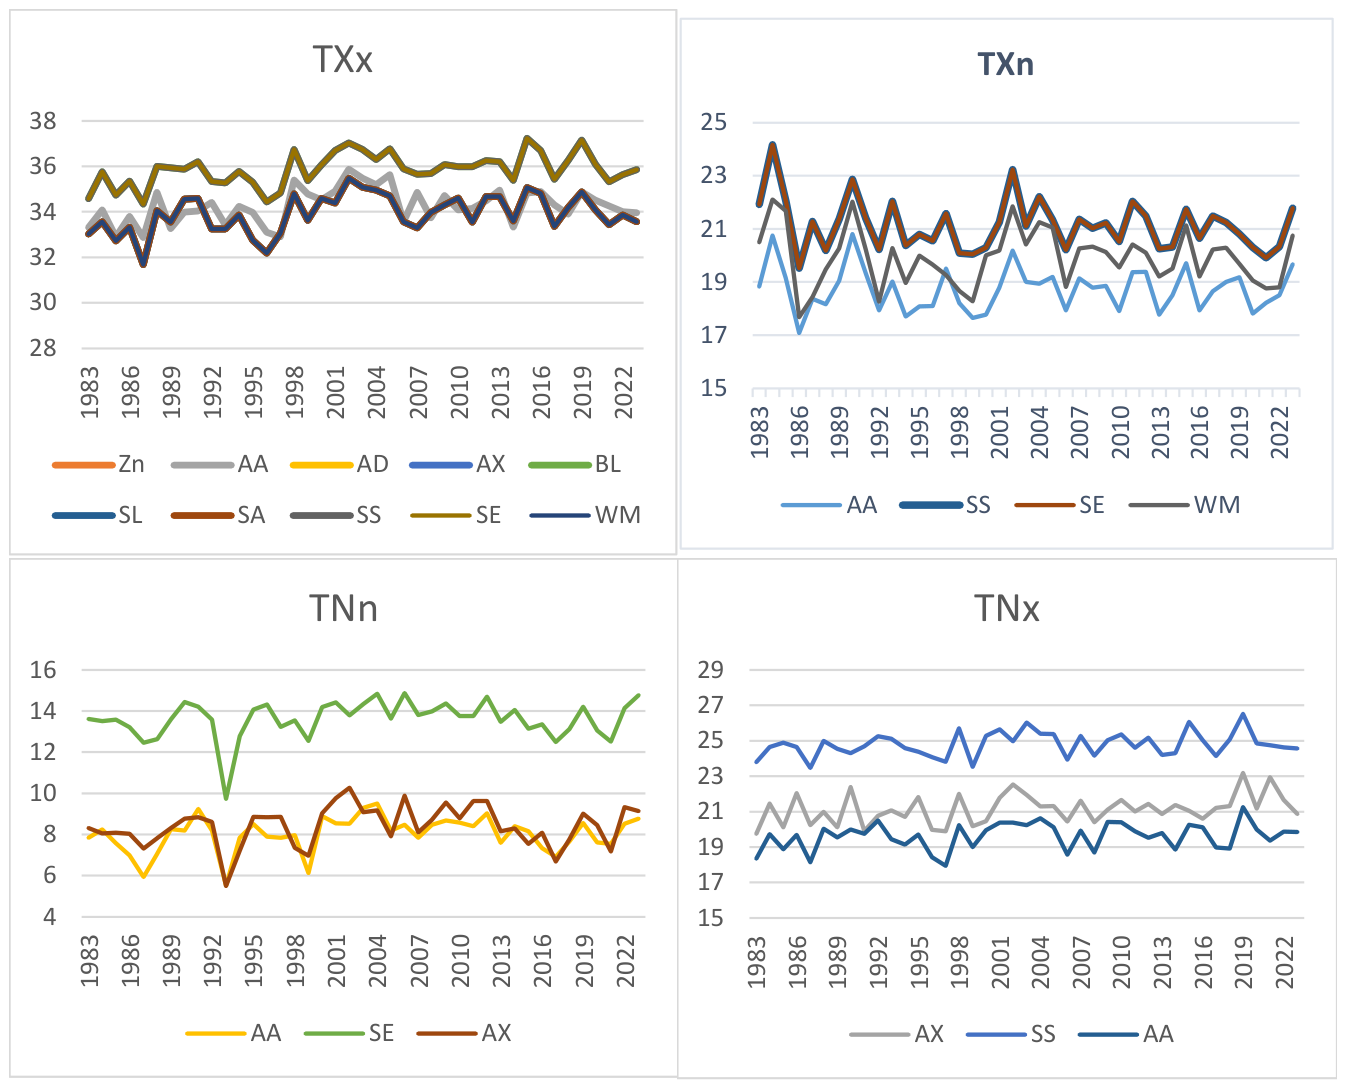
Figure 3.
Seasonal and annual variability of cool nights (TN10p).
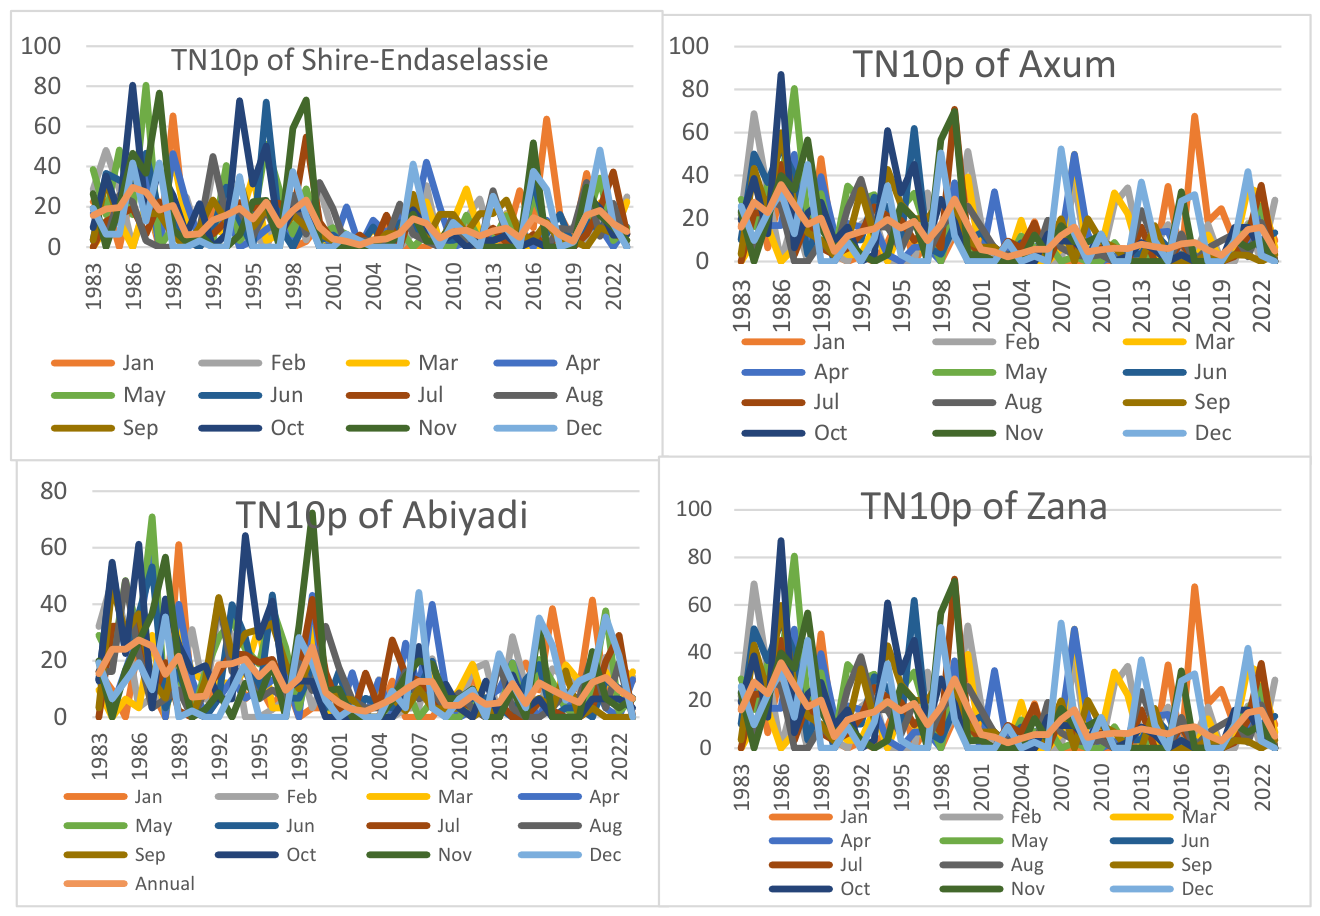
Figure 4.
Seasonal and annual variability of cool days in the study areas.
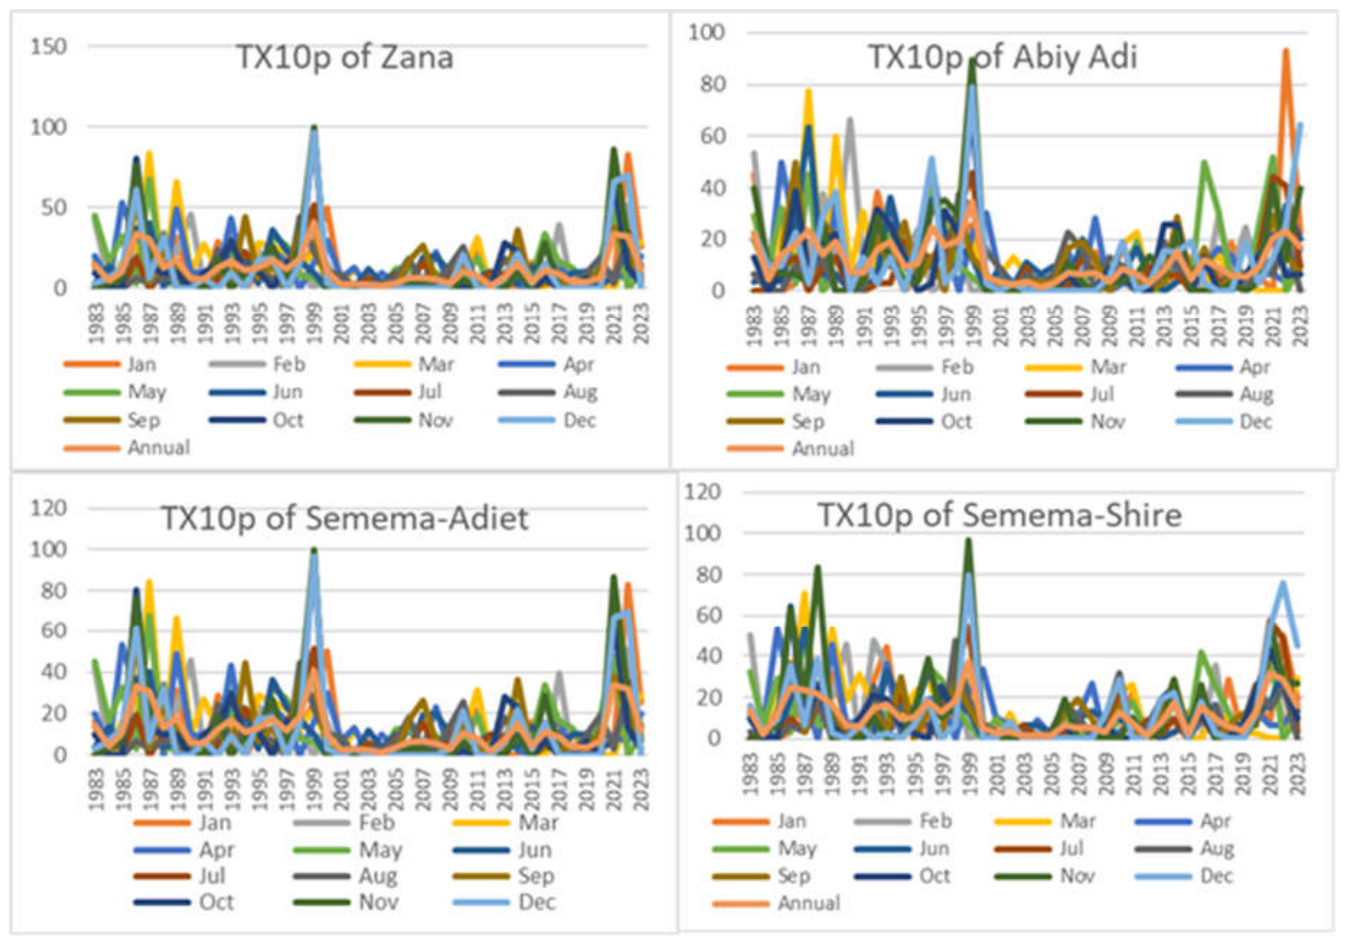
Figure 5.
Seasonal and annual variability of the warm nights (TN90p).
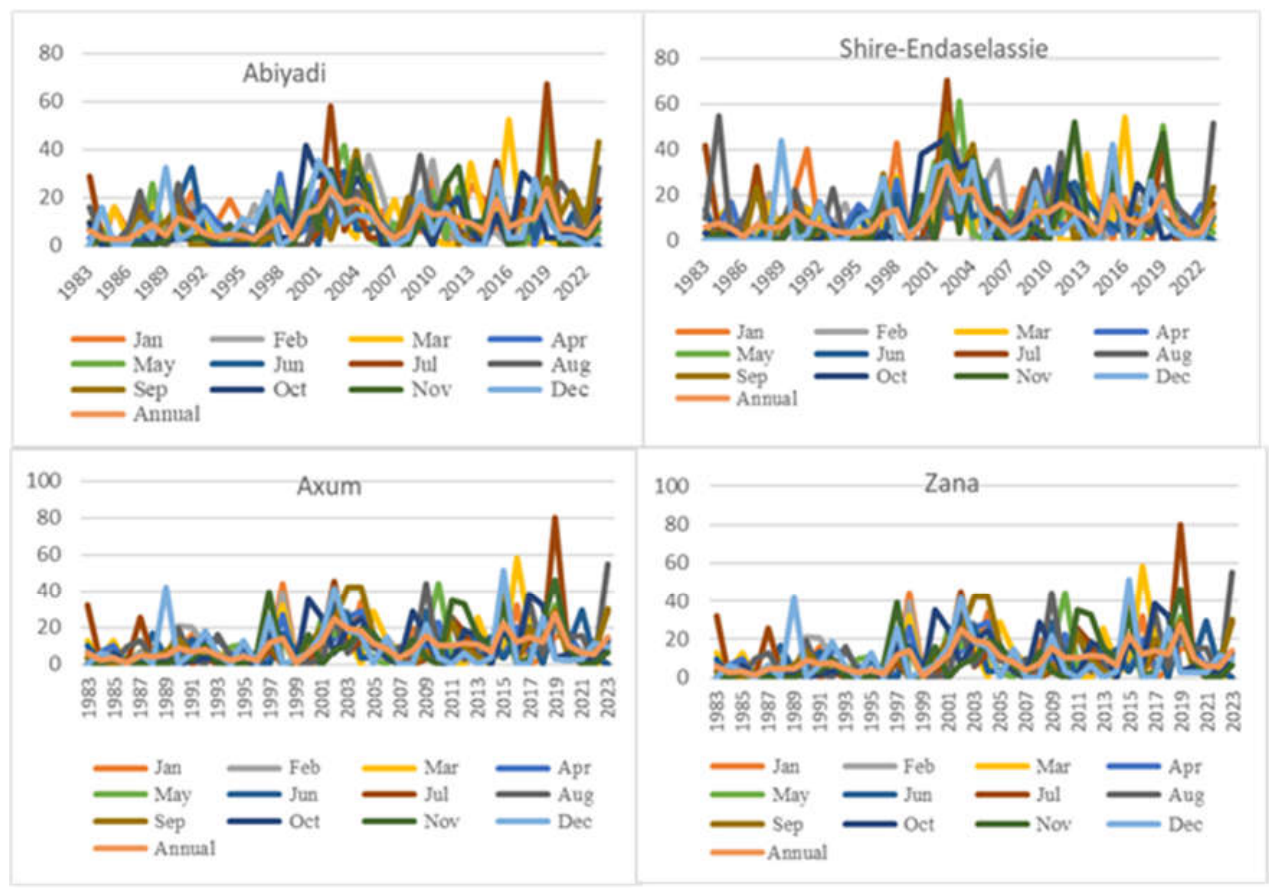
Figure 6.
Warm spell duration indicator, cold spell duration indicator and diurnal temperature range (DTR).
Figure 6.
Warm spell duration indicator, cold spell duration indicator and diurnal temperature range (DTR).
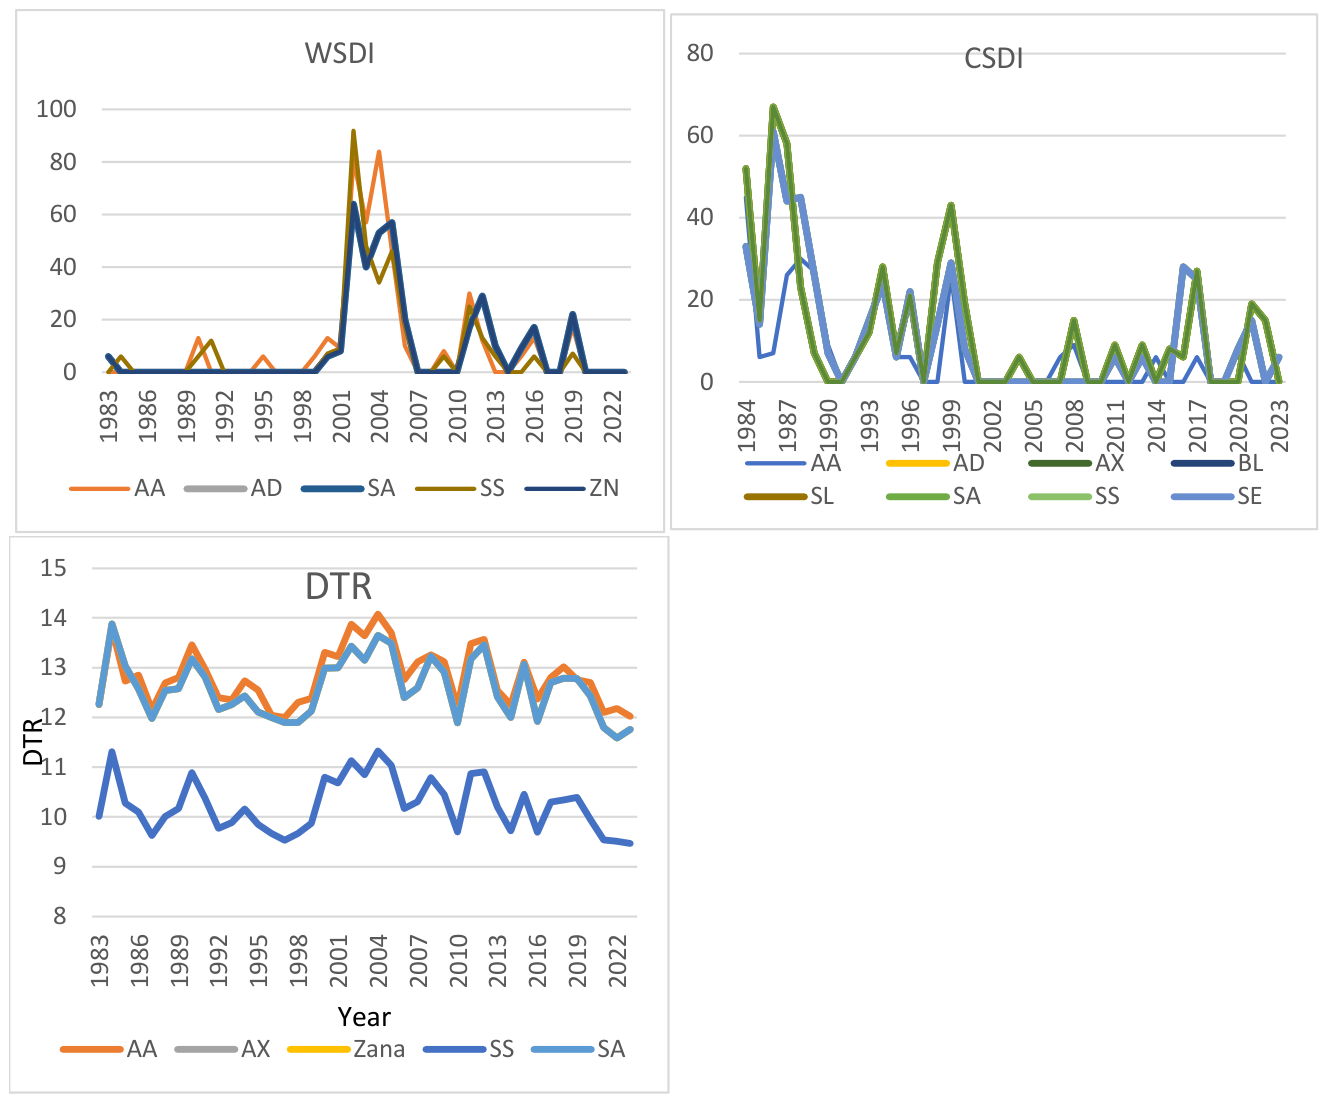
Figure 7.
Rainfall indices variability in the study areas from 1983-2023.
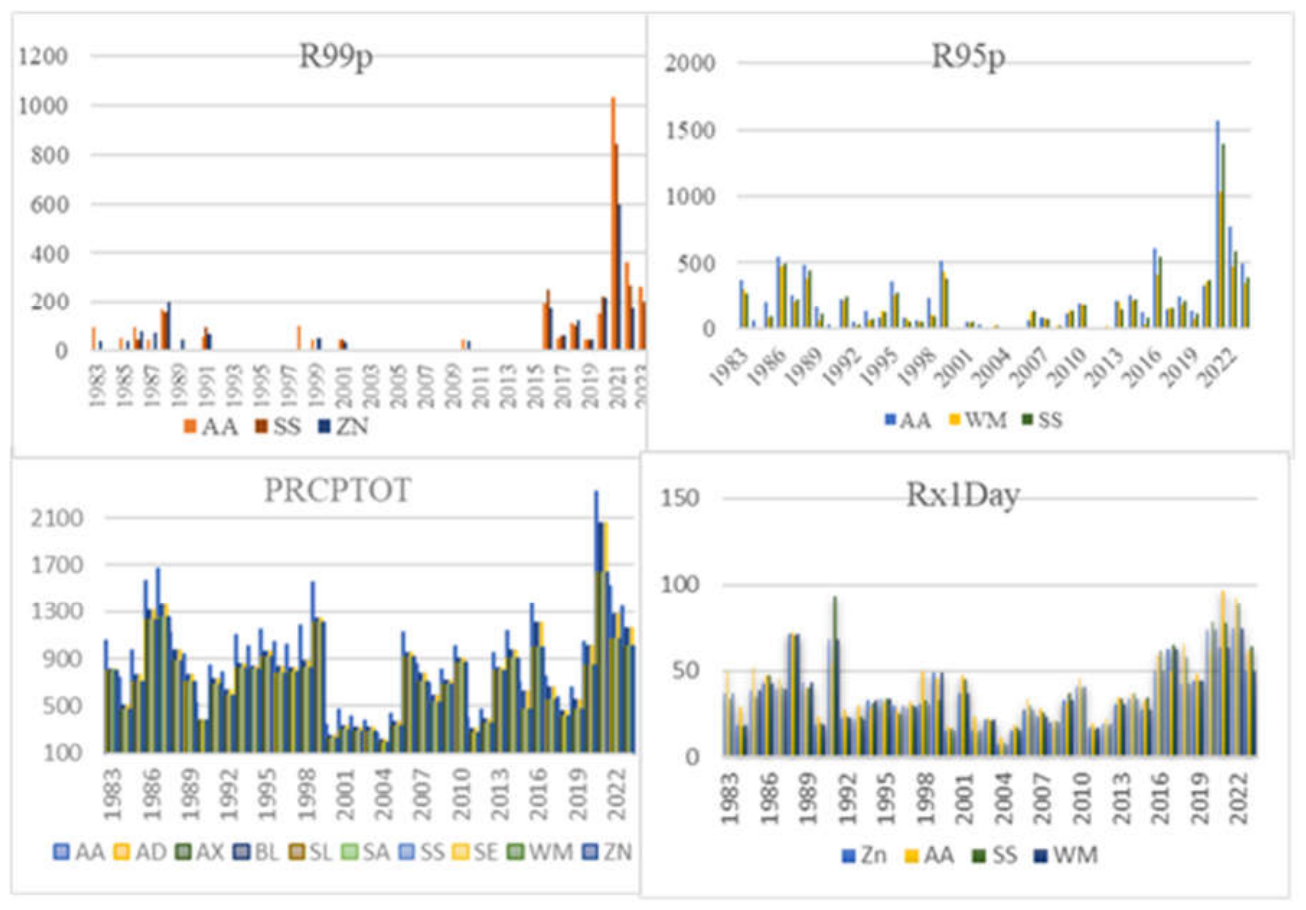
Figure 8.
Temporal variability of extreme rainfall indices of selected stations from 1983-2023.
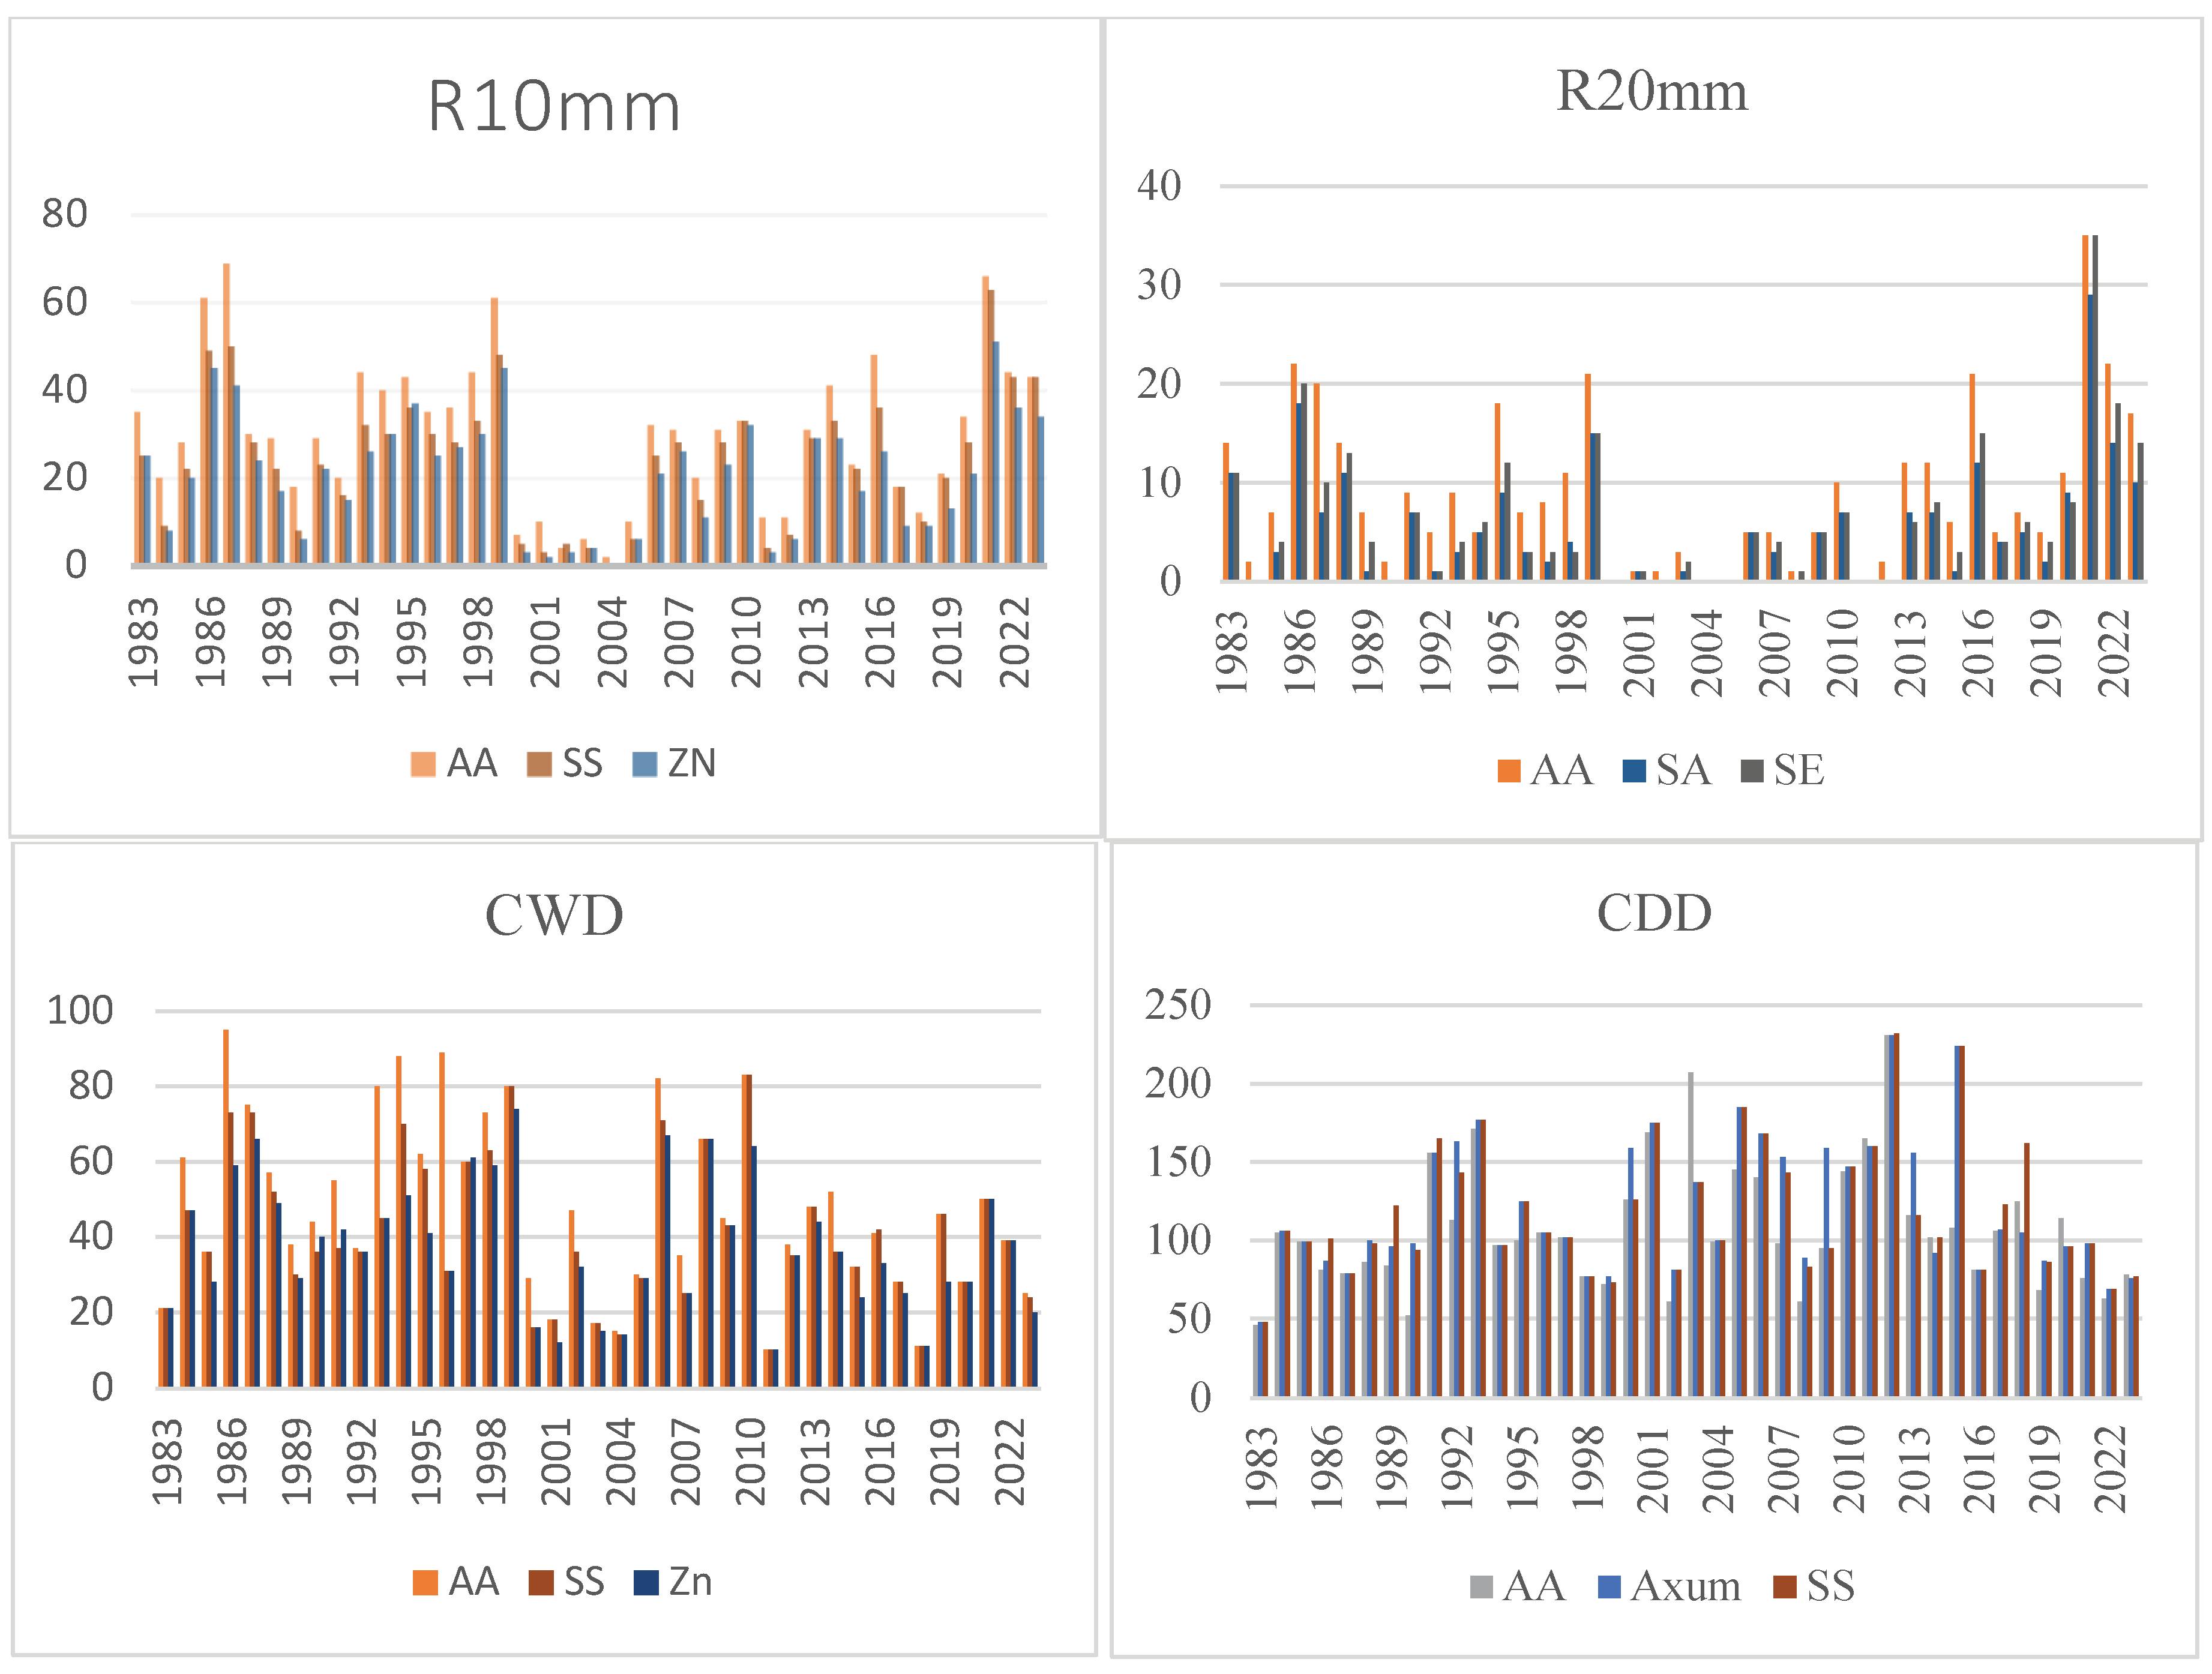
Figure 9.
Spatial variability of TN10p, TN90p, TX10p, TX90p, TNn and TXxfrom 1983-2023.
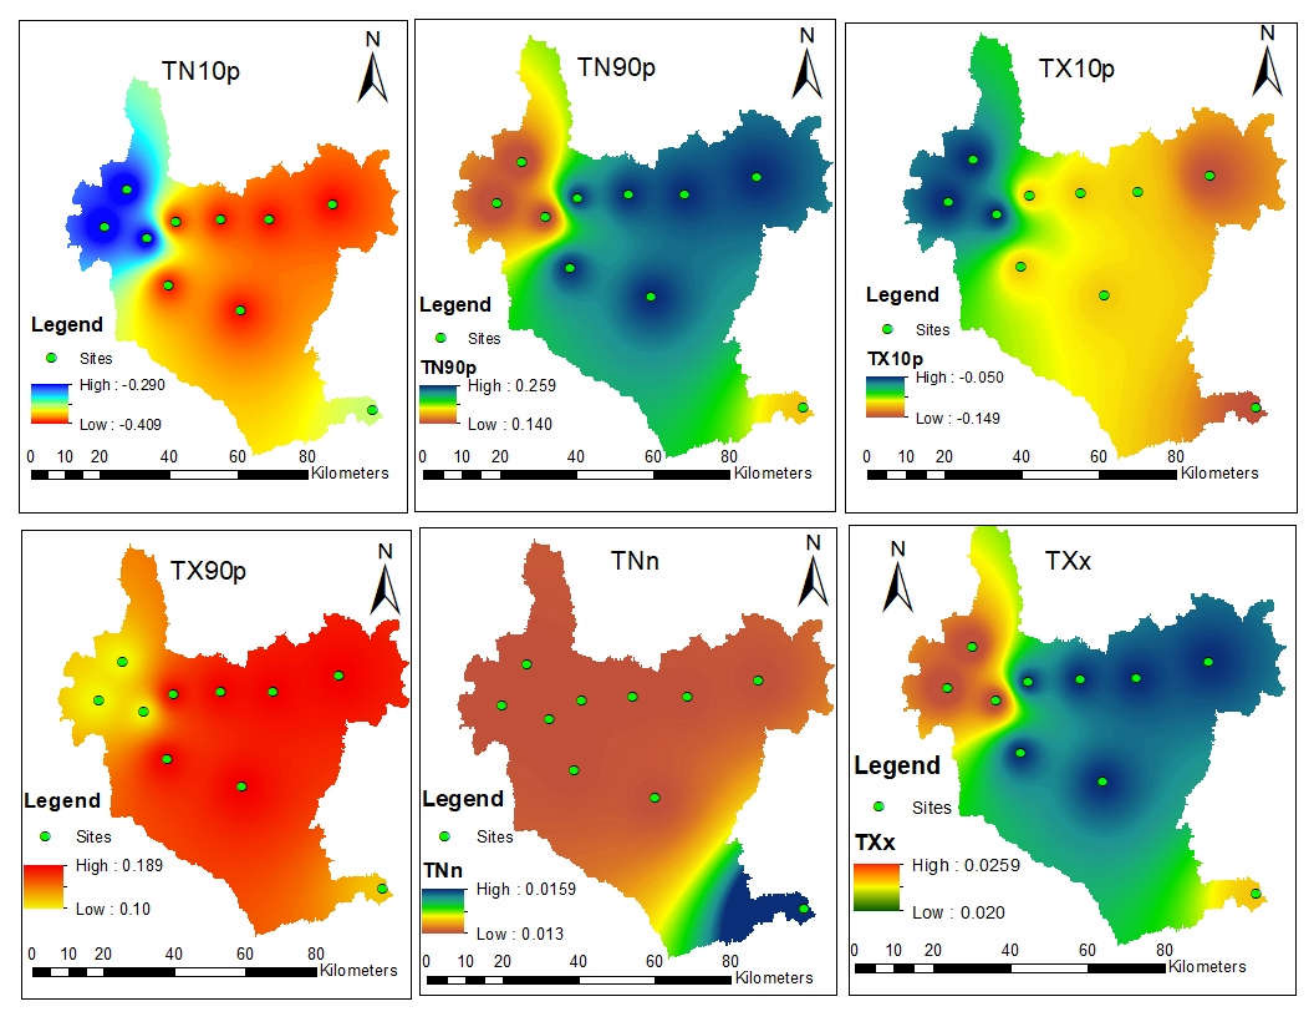
Figure 10.
Spatial variability of extreme rainfall indices in the northwest and central zones of Tigray from 1983-2023.
Figure 10.
Spatial variability of extreme rainfall indices in the northwest and central zones of Tigray from 1983-2023.
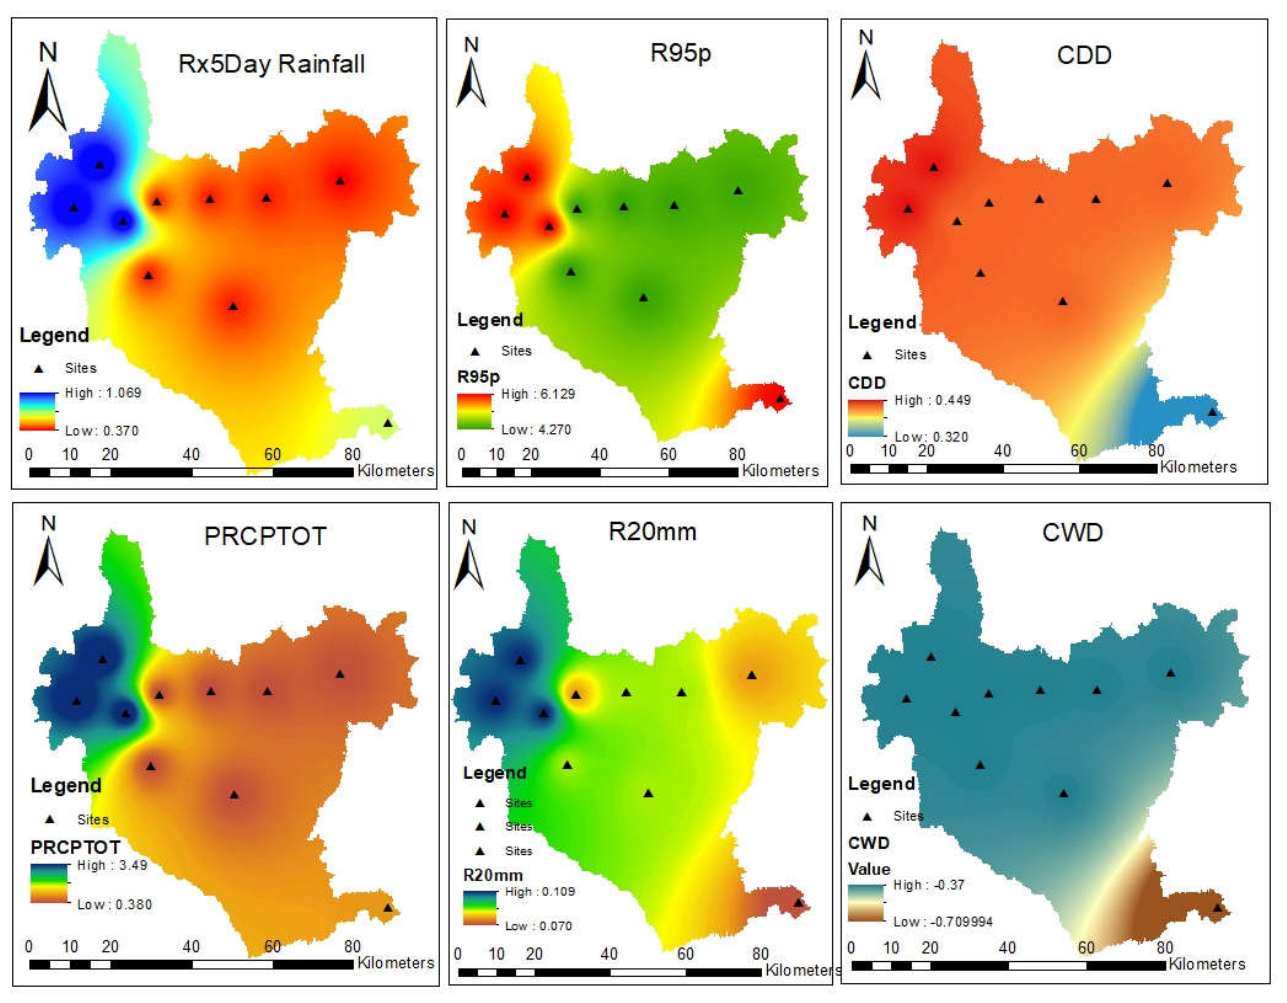

Table 1.
Data availability and spatial referencing of the observation stations.
| Site | Zone | Latitude | Longitude | Elevation | Data Availability |
|---|---|---|---|---|---|
| Shire_Endaselassie | Northwest | 14.1016 | 38.2836 | 1913.3 | 1983-2023 |
| Selekleka | Northwest | 14.1152 | 38.473 | 1981 | 1983-2023 |
| Semema | Northwest | 14.1986 | 38.3421 | 1956 | 1983-2023 |
| Beles | Northwest | 14.0716 | 38.3971 | 1963.5 | 1983-2023 |
| Zana | Northwest | 13.9507 | 38.4545 | 1942.8 | 1983-2023 |
| Axum | Central | 14.1238 | 38.7245 | 2142.4 | 1983-2023 |
| Semema_Adiet | Central | 13.8839 | 38.6465 | 2080.4 | 1983-2023 |
| Adwa | Central | 14.1628 | 38.893 | 1877.3 | 1983-2023 |
| Abiy Adi | Central | 13.6231 | 39.0017 | 1865 | 1983-2023 |
| WukiroMaray | Central | 14.1227 | 38.5929 | 2257 | 1983-2023 |
Table 2.
Extreme temperature and rainfall indices and their definition.
| Code | Indicator name | Definitions | Units |
|---|---|---|---|
| TXx | Max Tmax | Monthly maximum value of daily maximum temp | ºC |
| TNx | Max Tmin | Monthly maximum value of daily minimum temp | ºC |
| TXn | Min Tmax | Monthly minimum value of daily maximum temp | ºC |
| TNn | Min Tmin | Monthly minimum value of daily minimum temp | ºC |
| TN10p | Cool nights | Percentage of days when TN<10th percentile | Days |
| TX10p | Cool days | Percentage of days when TX<10th percentile | Days |
| TN90p | Warm nights | Percentage of days when TN>90th percentile | Days |
| TX90p | Warm days | Percentage of days when TX>90th percentile | Days |
| WSDI | Warm spell duration indicator | Annual count of days with at least 6 consecutive days when TX>90th percentile | Days |
| CSDI | Cold spell duration indicator | Annual count of days with at least 6 consecutive days when TN<10th percentile | Days |
| DTR | Diurnal temperature range | Monthly mean difference between TX and TN | ºC |
| RX1day | Max 1-day precipitation amount | Monthly maximum 1-day precipitation | Mm |
| Rx5day | Max 5-day precipitation amount | Monthly maximum consecutive 5-day precipitation | Mm |
| R10 | Number of heavy precipitation days | Annual count of days when PRCP>=10mm | Days |
| R20 | Number of very heavy precipitation days | Annual count of days when PRCP>=20mm | Days |
| R25 | Number of days above 25 mm | Annual count of days when PRCP>=25 mm | Days |
| CDD | Consecutive dry days | Maximum number of consecutive days with RR<1mm | Days |
| CWD | Consecutive wet days | Maximum number of consecutive days with RR>=1mm | Days |
| R95p | Very wet days | Annual total PRCP when RR>95th percentile | Mm |
| R99p | Extremely wet days | Annual total PRCP when RR>99th percentile | mm |
| PRCPTOT | Annual total wet-day precipitation | Annual total PRCP in wet days (RR>=1mm) | mm |
Table 3.
trends in extreme temperature indices in the study areas.
| Site | TXx | TXn | TNx | TNn | TX90p | TX10p | TN90p | TN10p | WSDI | CSDI | DTR |
|---|---|---|---|---|---|---|---|---|---|---|---|
| Shire_Endaselassie | 0.025** | -0.02 | 0.015 | 0.013 | 0.10 | -0.05 | 0.14 | -0.29** | 0.05 | -0.61** | -0.005 |
| Selekleka | 0.026* | -0.008 | 0.024* | 0.013 | 0.19 | -0.12 | 0.26** | -0.41** | 0.21 | -0.63** | -0.007 |
| Semema_Shire | 0.025** | -0.02 | 0.015 | 0.013 | 0.10 | -0.05 | 0.14 | -0.29** | 0.05 | -0.61** | -0.005 |
| Beles | 0.025** | -0.02 | 0.015 | 0.013 | 0.1 | -0.05 | 0.14 | -0.29** | 0.05 | -0.61** | -0.005 |
| Zana | 0.026* | -0.008 | 0.024* | 0.013 | 0.19 | -0.12 | 0.26** | -0.41** | 0.21 | -0.63** | -0.007 |
| Axum | 0.026* | -0.008 | 0.024* | 0.013 | 0.19 | -0.12 | 0.26** | -0.41** | 0.21 | -0.63** | -0.007 |
| Semema_Adiet | 0.026* | -0008 | 0.024* | 0.013 | 0.19 | -0.12 | 0.26** | -0.41** | 0.21 | -0.63** | -0.007 |
| Adwa | 0.026* | -0.009 | 0.024* | 0.013 | 0.19 | -0.15 | 0.26** | -0.41** | 0.21 | -0.63** | -0.007 |
| Abiy Adi | 0.02* | -0.003 | 0.016 | 0.016 | 0.12 | -0.15 | 0.18** | -0.36** | 0.13 | -0.49** | -0.003 |
| WukiroMaray | 0.026* | -0.008 | 0.024* | 0.013 | 0.19 | -0.12 | 0.26** | -0.41** | 0.21 | -0.63** | -0.007 |
**Highly significant (p<0.001) and *significant (p<0.05).
Table 4.
Trends on selected extreme rainfall indices from 1983 to 2023 in ten observation stations.
| Site | Rx1Day | Rx5Day | R10mm | R20mm | R25mm | CWD | CDD | R95p | R99p | PRCPTOT |
|---|---|---|---|---|---|---|---|---|---|---|
| Shire_Endaselassie | 0.57* | 1.07 | 0.09 | 0.11 | 0.15* | -0.37 | 0.45 | 6.13 | 5.25** | 3.50 |
| Selekleka | 0.35 | 0.38 | -0.02 | 0.08 | 0.12* | -0.37 | 0.44 | 4.27 | 3.23* | 0.38 |
| Semema_Shire | 0.57* | 1.07 | 0.09 | 0.11 | 0.15* | -0.37 | 0.45 | 6.13 | 5.25** | 3.50 |
| Beles | 0.57* | 1.07 | 0.09 | 0.11 | 0.15* | -0.37 | 0.44 | 6.13 | 5.24** | 3.50 |
| Zana | 0.35 | 0.38 | -0.02 | 0.09 | 0.12* | -0.37 | 0.44 | 4.27 | 3.23* | 0.38 |
| Axum | 0.35 | 0.38 | -0.02 | 0.09 | 0.12* | -0.37 | 0.44 | 4.27 | 3.23* | 0.38 |
| Semema_Adiet | 0.35 | 0.38 | -0.02 | 0.09 | 0.12* | -0.37 | 0.44 | 4.27 | 3.23* | 0.38 |
| Adwa | 0.35 | 0.37 | -0.02 | 0.08 | 0.12* | -0.37 | 0.44 | 4.3 | 3.23* | 0.38 |
| Abiy Adi | 0.46 | 0.65 | -0.12 | 0.07 | 0.011 | -0.71* | 0.32 | 6.12 | 5.27* | 0.91 |
| Wukiro Maray | 0.35 | 0.38 | -0.02 | 0.09 | 0.12* | -0.37 | 0.44 | 4.27 | 3.23* | 0.38 |
Disclaimer/Publisher’s Note: The statements, opinions and data contained in all publications are solely those of the individual author(s) and contributor(s) and not of MDPI and/or the editor(s). MDPI and/or the editor(s) disclaim responsibility for any injury to people or property resulting from any ideas, methods, instructions or products referred to in the content. |
© 2026 by the authors. Licensee MDPI, Basel, Switzerland. This article is an open access article distributed under the terms and conditions of the Creative Commons Attribution (CC BY) license (http://creativecommons.org/licenses/by/4.0/).
Copyright: This open access article is published under a Creative Commons CC BY 4.0 license, which permit the free download, distribution, and reuse, provided that the author and preprint are cited in any reuse.