
Submitted:
06 August 2026
Posted:
06 August 2026
You are already at the latest version
Abstract
Glutathione S-transferases (GSTs) plays pivotal roles in plant growth, abiotic stress responses, detoxification of xenobiotics, and maintenance of redox homeostasis. In this study, transcriptomic analysis was employed to identify differentially expressed genes (DEGs) in pea of DX27 under low temperature stress(-4°C) at 3, 6, and 12 h. GO and KEGG enrichment analyses of global transcriptomic data further revealed that DEGs were significantly enriched in oxidation-reduction processes, stress responses, glutathione metabolism, and secondary metabolite biosynthesis—functional categories. A total of 52 PsatGST genes were identified and classified into nine subfamilies based on phylogenetic relationships. Chromosomal localization revealed a non-random distribution across seven chromosomes. Promoter cis-element analysis indicated that PsatGST genes harbor diverse regulatory elements associated with light responsiveness, hormone signaling (auxin, abscisic acid, gibberellin, salicylic acid, and MeJA), and abiotic/biotic stress responses (low-temperature, wounding, and anaerobic induction). PsatGSTU18 and PsatGSTF2 expression analysis showing pronounced up-regulation at 12 h under low temperature stress (-4°C) at 3, 6, and 12 h. These findings provide a foundational framework for understanding the evolutionary history and functional diversification of the PsatGSTs gene family and offer valuable candidate genes for breeding stress-tolerant pea varieties.
Keywords:
pea
; glutathione S-transferase
; genome-wide identification
; low temperature stress
; transcriptome
; expression analysis
1. Introduction
Glutathione S-transferases (GSTs, EC 2.5.1.18) are a multifunctional superfamily in plants, playing an important in abiotic stress tolerance, detoxification of xenobiotic, and maintenance of cellular redox regulation [1,2]. These enzymes catalyze the conjugation of reduced glutathione (GSH) to electrophilic substrates, thereby facilitating their sequestration into vacuoles or the apoplast [3,4]. Among the various GST classes, the plant-specific Phi (GSTF) and Tau (GSTU) members have been demonstrated to contribute to stress defense through multiple mechanisms [5]. They not only mediate detoxification via GSH conjugation but also directly scavenge reactive oxygen species (ROS) and participate in hormone signaling and stress-responsive kinase regulation [6].
Substantial evidence has shown that GST expression and activity are significantly altered in response to various abiotic stresses [7]. For example, plants employ GSTs and other antioxidant enzymes to counteract excessive ROS accumulation induced by drought [8,9]. Under low-temperature stress, elevated ROS levels can damage proteins and compromise membrane integrity [10]. GSTs mitigate such damage by catalyzing the conjugation of GSH with lipid peroxides [2]. Similarly, in herbicide detoxification, GSTs catalyze the nucleophilic attack of GSH on electrophilic groups of hydrophobic compounds, conferring herbicide resistance and selectivity [11,12]. Collectively, these findings underscore the central role of GST-mediated glutathione conjugation in plant adaptation to environmental stresses [5].
The GST gene family has been systematically characterized in several plant species, including Arabidopsis thaliana [13], Oryza sativa [14], Glycine max [15], and Triticum aestivum [16]. These studies have revealed that GST families have expanded through tandem duplication events, with different subfamilies exhibiting distinct expression patterns and functional divergences [17]. However, comprehensive genome-wide identification and low-temperature-responsive expression analysis of the GST family have not yet been reported in pea (Pisum sativum L.), a legume crop with moderate cold tolerance but limited genomic resources.
Pea is a cool-season crop well suited for early spring planting in northern China [18]. However, spring frost and low temperature stress during seedling establishment remain major constraints on pea productivity and geographical distribution [19]. In this study, we performed the first systematic characterization of the PsatGST family, including phylogeny, conserved motifs, chromosomal distribution, promoter elements, and time-dependent expression profiles under freezing stress. Our central hypothesis is that specific PsatGST subfamilies—particularly the Tau and Phi classes—are transcriptionally activated under low-temperature stress and contribute to redox regulation and stress defense in pea. This work provides a foundational resource for functional studies and offers candidate genes for breeding cold-tolerant legume varieties.
2. Materials and Methods
2.1. Plant Materials and Stress Treatment
The pea (Pisum sativum L.) cultivar DX27, provided by Gansu Academy of Agricultural Sciences, was selected as the experimental material for studying cold stress. Uniform, plump seeds were surface-sterilized with 75% (v/v) ethanol for 30 s and 10% (v/v) sodium hypochlorite for 10 min, followed by five rinses with sterile distilled water. The seeds were then germinated on moist filter paper at 25 °C in darkness for 3 days. Germinated seedlings were first grown hydroponically in nutrient solution (without solid substrate), and then transplanted into Hoagland nutrient solution and cultivated in an artificial climate chamber under controlled conditions: 16 h light/8 h dark photoperiod, light intensity of 200 μmol·m⁻²·s⁻¹ (cool white fluorescent lamps), day/night temperature of 25 °C/18 °C, and relative humidity of 60%–70%. At the three-leaf seedling stage, healthy and uniform seedlings were selected for low-temperature stress treatment. The treatment group was transferred to a climate chamber set at -4 °C, while the control group (CK) was maintained at 25 °C, with the same light and humidity conditions. Leaf tissues were collected at 3, 6, and 12 h after stress initiation, with three biological replicates per time point (each consisting of leaves pooled from five seedlings). All samples were immediately frozen in liquid nitrogen and stored at -80 °C for subsequent RNA extraction and transcriptome sequencing.
2.2. RNA Extraction and Transcriptome Sequencing
Total RNA was isolated from pea leaf tissues with the RNAprep Pure Plant Plus Kit (Tiangen Biotech, Beijing, China) in strict accordance with the manufacturer’s instructions. RNA purity and integrity were assessed using 1% agarose gel electrophoresis and a NanoDrop 2000 spectrophotometer (Thermo Fisher Scientific, Waltham, MA, USA). Only RNA samples with an RNA integrity number ≥ 8.0 were retained for downstream library construction. Sequencing libraries were generated using the NEBNext® Ultra™ RNA Library Prep Kit for Illumina® (New England Biolabs, Ipswich, MA, USA). In brief, poly(A)-tailed mRNA was captured from total RNA using oligo(dT) magnetic beads and fragmented into short segments with fragmentation buffer. First-strand cDNA was synthesized using random hexamer primers, followed by second-strand cDNA generation with DNA polymerase I and dNTPs. The double-stranded cDNA was then purified, end-repaired, adenylated at the 3′ ends, and ligated with Illumina sequencing adaptors. The ligated products were enriched via PCR amplification, and the qualified cDNA libraries were sequenced on the Illumina NovaSeq 6000 platform (Illumina, San Diego, CA, USA) by Biomarker Technologies Co., Ltd. (Beijing, China) to produce 150 bp paired-end reads.
2.3. Identification and Analysis of Differentially Expressed Genes (DEGs)
Clean reads were aligned to the pea reference genome (Pisum sativum v1a) using HISAT2 [20]. Raw read counts per gene were obtained, and genes with <10 counts in all samples were excluded. Differentially expressed genes (DEGs) between cold-stressed and control groups were identified using DESeq2 [21] with |log₂FC| ≥ 1 and Padj < 0.05 (Benjamini-Hochberg). FPKM values from StringTie [22] were used solely for heatmap visualization. DEG overlaps and expression trends were visualized using the VennDiagram R package and bar charts.
2.4. GO and KEGG Enrichment Analyses
Functional enrichment analysis based on Gene Ontology (GO) was carried out for DEGs using cluster Profiler R package (v4.8.3) [23]. All GO terms were categorized into three independent ontologies: Biological Process (BP), Cellular Component (CC), and Molecular Function (MF). Pathway enrichment was implemented performed using the same tool against the Kyoto Encyclopedia of Genes and Genomes (KEGG) database to assign DEGs to relevant metabolic and signal transduction pathways. A false discovery rate (FDR) < 0.05 was employed as the threshold for identifying significantly enriched GO terms and KEGG pathways. The enrichment results were visualized as bubble plots and bar charts using the ggplot2 R package(v3.4.4) [24].
2.5. Genome-Wide Identification, Clustering and Chromosomal Localization of the Pea GST Gene Family
Using Pisum sativum v1a reference genome (Phytozome) as the reference database, the GSTs gene family members were identified. The Hidden Markov Model (HMM) profiles of the GST conserved domains (GST-N: PF02798, GST-C: PF00043) were downloaded from the Pfam database (http://pfam.xfam.org) [25]. HMMER 3.0 [26] was used to search the pea protein database with the HMM profiles (E-value ≤ 1e-5). Candidate sequences were required to contain at least one complete GST-N (PF02798) or GST-C (PF00043) domain, as verified by Pfam scan (E-value ≤ 1e-5). Redundant isoforms from alternative splicing were removed by retaining the longest transcript. Sequences with incomplete domains or <50 amino acids were discarded.
Multiple sequence alignment of the PsatGSTs amino acid sequences was performed using ClustalW [27]. Based on the aligned sequences, a phylogenetic tree was constructed with the Neighbor-Joining (NJ) method implemented in MEGA 7.0 software [28]. The resulting phylogenetic tree was further visualized, edited, and optimized using the online tool Evolview (https://evolgenius.info//evolview-v2/#login) [29]. The chromosomal start coordinates of each PsatGST gene were retrieved from the Pisum sativum v1a genome database, and the physical distribution of these genes across pea chromosomes was graphically mapped using MapChart software [30].
2.6. Identification of Conserved Motifs and Cis-Acting Elements in the Promoters of the PsatGST Gene Family
The full-length coding sequences of PsatGST genes were retrieved, and the 2000-bp promoter regions upstream of the translation initiation site (ATG) were extracted for each gene. Putative cis-acting regulatory elements were predicted and analyzed using the PlantCARE online database (http://bioinformatics.psb.ugent.be/webtools/plantcare/html/) [31], and corresponding regulatory element diagrams were constructed. Conserved motifs within PsatGST proteins were identified using the MEME online tool (http://meme-suite.org) [32], with the maximum number of motifs set to 10 and other parameters maintained at default settings. All motif and gene structure visualizations were carried out using TBtools software [33].
2.7. Expression Pattern Analysis of PsatGSTs Genes Under Low temperature Stress
Expression patterns of PsatGST genes under low-temperature stress were visualized using FPKM values and used exclusively for heatmap generation. Expression data were normalized via log₂-transformation, and a heatmap illustrating PsatGST expression at 3 h, 6 h, and 12 h under control and cold-stress conditions was generated using TBtools [33]. The expression profiles of key PsatGST genes were further characterized and interpreted by integrating heatmap visualization and differential l expression statistics calculated from raw counts with DESeq2.
2.8. Statistical Analysis
All experiments were performed with three biological replicates and three technical replicates for molecular experiments. Graphs were generated using Tbtools and R packages (ggplot2, pheatmap) [34].
3. Results
- Identification of differentially expressed genes(DEGs) in Pea under low temperature stress
To elucidate transcriptional changes in leaves under low-temperature stress(-4 °C ), differential expression analysis was performed using the cultivar DX27 as the experimental material, with normal temperature (25 °C, CK) as the control. Correlation analysis and principal component analysis (PCA) were conducted to simplify transcriptome data complexity and evaluate the repeatability among biological replicates. Samples from identical treatments were clearly clustered, and the largest separation between control and stressed groups in the PCA plot was detected at 12 h (Figure 1A). The correlation coefficients for the three replicates of the four samples were all close to 1, indicating a high similarity in expression patterns among the samples (Figure 1B). Boxplot visualization of the data demonstrated consistency among samples within the same treatment group, confirming the reliability of biological replicates (Figure 1C). In total, 30,118 differentially expressed genes (DEGs) were detected across all sampling time points, with the threshold set at |log₂FC| ≥ 1 and Padj < 0.05. Compared with CK, 9,849 DEGs (5,612 up-regulated, 4,237 down-regulated), 10,100 DEGs (5,612 up-regulated, 4,488 down-regulated), and 10,169 DEGs (5,571 up-regulated, 4,598 down-regulated) were detected at 3, 6, and 12 h of low temperature stres (Figure 1D).
3.2. Functional and Pathway Enrichment Analysis of DEGs Under Low Temperature Stress
GO enrichment analysis classified the DEGs into three primary categories: Biological Process (BP), Cellular Component (CC), and Molecular Function (MF), revealing shared functional characteristics and time-dependent transcriptional changes across the three sampling time points (Figure 2). In CK_vs_3h comparison, the top enriched Cellular Component terms were Cytosolic ribosome (GO:0022626), Ribosomal subunit (GO:0044391) and Cytosolic large ribosomal subunit (GO:0022625); The Molecular Function domain showed enrichment in the following categories: Protein kinase activity (GO:0004672), Phosphotransferase activity, alcohol group as acceptor (GO:0016773) and Kinase activity (GO:0016301). The Biological Process domain revealed the following top enriched terms: Phosphorylation (GO:0016310), Defense response (GO:0006952) and Response to stimulus (GO:0050896) (Figure 2A). In CK_vs_6h, the top enriched term were in the Cellular Component (CC) category, chloroplast (GO:0009507) and plastid (GO:0009536), ribosome (GO:0005840) thylakoid (GO:0009579); in the Molecular Function (MF) domain, the most prominently enriched term was protein kinase activity (GO:0004672), structural constituent of ribosome (GO:0003735) and oxidoreductase activity (GO:0016491); in the Biological Process (BP) category, photosynthesis (GO:0015979), response to stimulus (GO:0050896), defense response (GO:0006952), and response to chemical (GO:0042221) (Figure 2B). In CK_vs_12h, the top enriched term were membrane (GO:0016020), plasma membrane (GO:0005886) and cell peripher (GO:0071944) In the Cellular Component (CC) category; the Molecular Function (MF) domain, DNA-binding transcription factor activity (GO:0003700), protein kinase activity(GO:0004672) and tetrapyrrole binding (GO:0046906); in the Biological Process (BP) category response to stimulus (GO:0050896), followed by defense response (GO:0006952) and response to chemical (GO:0042221) (Figure 2C).
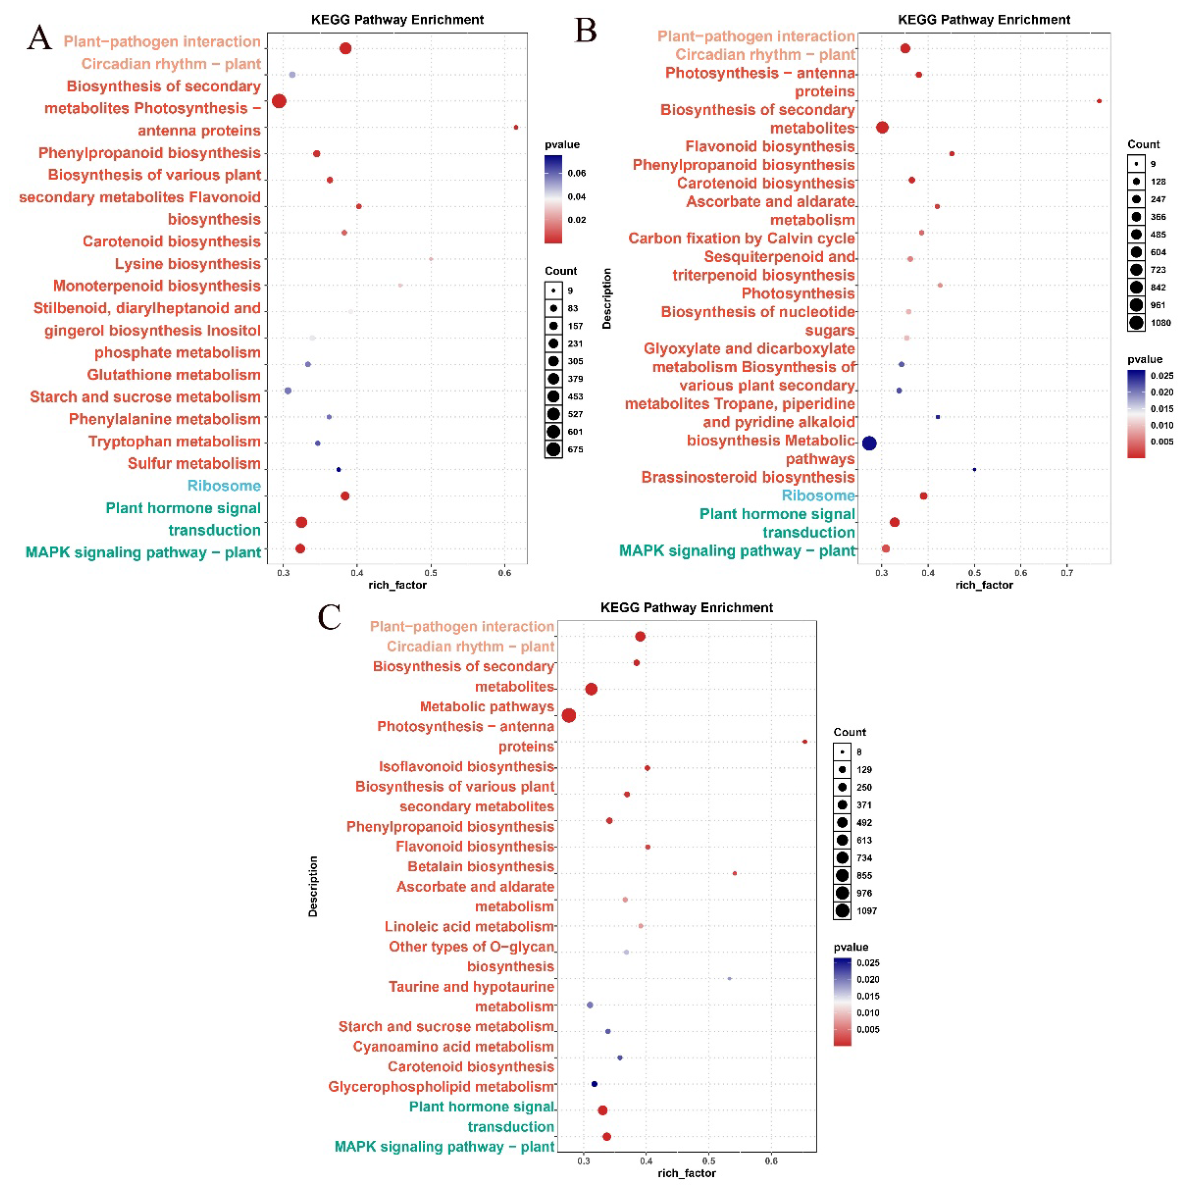
KEGG pathway enrichment analysis was performed on the differentially expressed genes. In CK_vs_3h comparison, Biosynthesis of secondary metabolites(ko01110), Glutathione metabolism (ko00480) Plant hormone signal transduction(ko04075), MAPK signaling pathway – plant(ko04016) and Ribosome (ko03010) pathway were significantly up-regulated, as indicated by positive z-scores. RNA degradation (ko03018), and Spliceosome (ko03040), were enriched with negative z-scores, suggesting down-regulation. In the CK_vs_6h comparison, the Biosynthesis of secondary metabolites (ko01110), Plant hormone signal transduction (ko04075), MAPK signaling pathway – plant (ko04016), and Ribosome (ko03010) pathways were significantly up-regulated, as indicated by strong positive z-scores (4.95, 5.38, 2.87, and 6.21, respectively). Conversely, several pathways involved in RNA processing and protein trafficking were enriched with negative z-scores, suggesting down-regulation. These included Spliceosome (ko03040), Nucleocytoplasmic transport (ko03013), mRNA surveillance pathway (ko03015), Protein processing in endoplasmic reticulum (ko04141), Endocytosis (ko04144), and RNA degradation (ko03018). In the CK_vs_12h comparison, the Biosynthesis of secondary metabolites (ko01110), Plant hormone signal transduction (ko04075), and MAPK signaling pathway – plant (ko04016) pathways remained significantly up-regulated,. In striking contrast, the Ribosome (ko03010) pathway, which was up-regulated at 3h and 6h, exhibited a strong negative z-score of –8.23 at 12h, indicating a pronounced down-regulation of translation. Conversely, several pathways involved in RNA processing and protein trafficking continued to show negative z-scores, suggesting sustained down-regulation. These included Spliceosome (ko03040), Nucleocytoplasmic transport (ko03013), mRNA surveillance pathway (ko03015), Protein processing in endoplasmic reticulum (ko04141), Endocytosis (ko04144), and RNA degradation. Glutathione metabolism, identified as a major pathway involved in cold stress response, warrants further investigation.
Figure 3.
KEGG pathway enrichment analysis of DEGs in pea leaves under low-temperature stress for 3, 6, and 12 h. Note: (A) KEGG pathway enrichment analysis of DEGs in CK_vs_3h; (B) KEGG pathway enrichment analysis of DEGs in CK_vs_6h; (C) KEGG pathway enrichment analysis of DEGs in CK_vs_12h.
Figure 3.
KEGG pathway enrichment analysis of DEGs in pea leaves under low-temperature stress for 3, 6, and 12 h. Note: (A) KEGG pathway enrichment analysis of DEGs in CK_vs_3h; (B) KEGG pathway enrichment analysis of DEGs in CK_vs_6h; (C) KEGG pathway enrichment analysis of DEGs in CK_vs_12h.
3.3. Identification of the Pea GSTs Gene Family
A total of 52 members of the GSTs gene family were identified from the pea genome using the hidden Markov model (HMM) profiles corresponding to the conserved GST domains (GST-N: PF02798; GST-C: PF00043). All identified proteins contained complete GST-N or GST-C conserved domains. Phylogenetic analysis further classified these 52 PsatGSTs genes into 9 distinct subfamilies, which were then systematically designated.
3.4. Phylogenetic Analysis of the Pea PsatGSTs Gene Family
To clarify the phylogenetic relationships among the 52 identified PsatGST proteins, multiple sequence alignment was carried out, followed by construction of a neighbor-joining phylogenetic tree with 1000 bootstrap replications. As depicted in Figure 4, these PsatGST genes were divided into nine distinct subfamilies. The Tau subfamily was the largest, comprising 31 members (accounting for 59.6% of the total), followed by the Phi subfamily with 6 members (11.5%). The DHAR subfamily contained 4 members (7.7%), while the Lambda contained 3 members (5.8%), Zeta, Theta, and EF1G subfamilies each contained 2 members (3.9%). The GHR and TCHQD branches each contained only 1 member (1.9%). This subfamily distribution pattern is consistent with observations in other plant species, where Tau and Phi classes typically constitute the largest subfamilies.
3.5. Conserved Motif and Gene Structure Analysis of the PsatGSTs Gene Family
To investigate the structural diversification of the PsatGSTs gene family in pea, comprehensive comparative analyses were conducted on the 52 PsatGSTs sequences to characterize conserved motifs and gene structures. As illustrated in Figure 5, the MEME suite identified 10 conserved motifs across all family members. Most PsatGSTs harbored 3 to 6 conserved motifs, and motif 3 was detected in nearly all proteins, indicating a high degree of evolutionary conservation, although its exact biochemical role remains to be verified experimentally. The Tau, Phi, and Lambda subfamilies shared an identical arrangement of motif 1, motif 3, motif 4, and motif 5, implying conserved structural features within these clades. Notably, the Phi subfamily uniquely possessed motif 7, which may contribute to substrate specificity or subfamily-specific functional specialization. The conserved motif distribution within each subfamily suggests that these motifs are critical for the physiological functions of corresponding PsatGST proteins.
Gene structure analysis revealed that all 52 PsatGST genes family members contained introns, indicating that pea PsatGSTs family members may have undergone multiple evolutionary trajectories with certain subfamily-specific features. Among them, Lambda subfamily members had the highest number of introns (9 introns each). Tau subfamily members consistently contained only 1 intron with relatively short intron lengths. Tau subfamily members consistently contained only one intron with relatively short intron lengths, which might hypothetically enable more rapid transcriptional activation under stress, but this remains to be tested experimentally. Phi subfamily members generally contained 2 introns, while other family members exhibited 2-8 introns. The distinct intron-exon patterns among subfamilies reflect their evolutionary divergence and potential functional specialization.
3.6. Chromosomal Localization of the PsatGSTs Gene Family
Chromosomal mapping analysis showed that PsatGST genes were unevenly distributed across the pea genome. A total of 52 PsatGSTs gene family members were mapped onto seven assembled chromosomes(Figure 6). Among these, chromosome 3LG5 harbored the highest number of genes, forming a high-density gene cluster. The lowest number of genes was observed in 2LG1 and 4LG4, with only 4 genes mapped.
3.7. Promoter Cis-Element Analysis of the PsatGSTs Gene Family
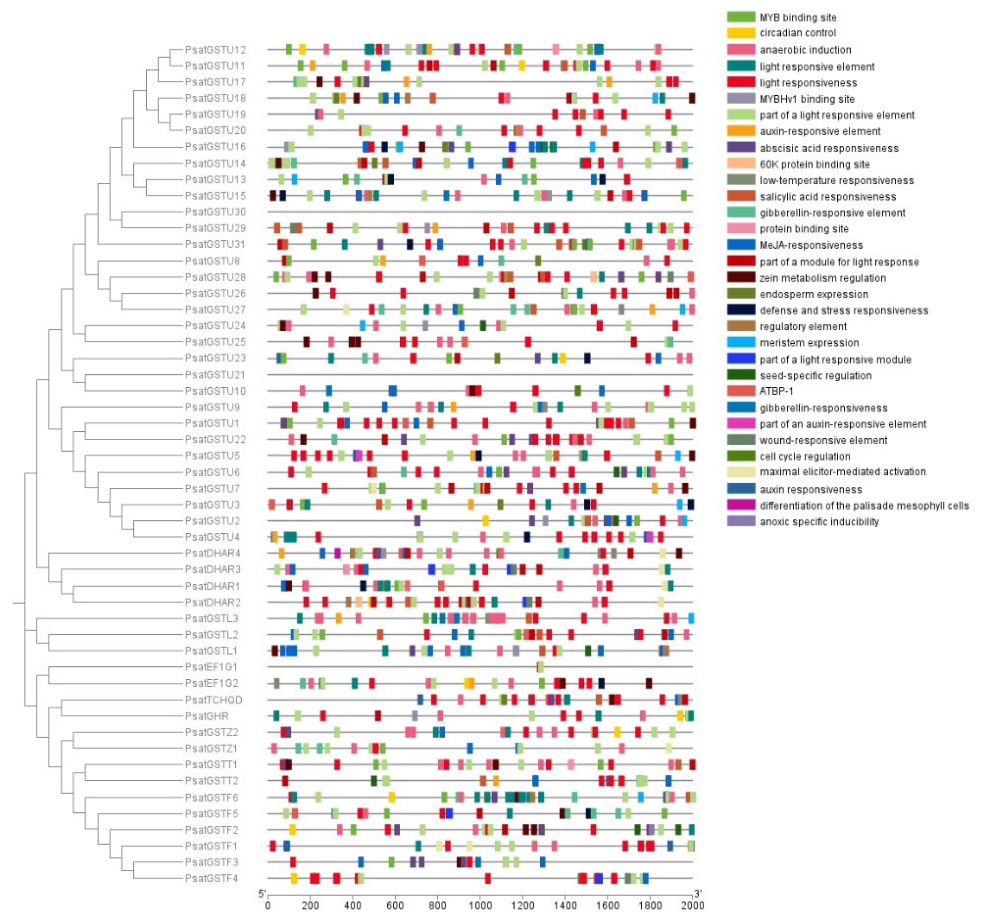
To explore potential regulatory clues underlying PsatGSTs transcription, the 2000bp promoter sequences upstream of the transcription start site of each PsatGST gene were extracted and subjected to cis-element prediction via the online PlantCARE database. Identified cis-acting elements were visualized using TBtools software. As shown in Figure 7, numerous regulatory motifs associated with plant growth and development, hormone signal transduction and stress responses were broadly distributed across these promoter regions. The widespread occurrence of these light-related cis-elements only reveals a latent regulatory link to light signal cascades, while direct participation of PsatGSTs in light signaling pathways requires further experimental validation. Furthermore, multiple stress-associated motifs were also identified, including anaerobic induction element (ARE), low-temperature responsive element (LTR), wound-responsive WUN motif, and TC rich repeats linked to defense responses. The presence of these stress-related cis-elements merely suggests that PsatGST genes may receive diverse abiotic and biotic stress signals at the transcriptional level. Definite biological roles of PsatGSTs in stress adaptation cannot be concluded solely based on promoter motif distribution.
3.8. Expression Pattern Analysis of the Pea PsatGSTs Gene Family Under Low temperature Stress
To explore the transcriptional responses of PsatGST genes to low-temperature stress, their expression profiles were analyzed based on transcriptome sequencing data. The sequencing was performed at 3 h, 6 h, and 12 h under low-temperature treatment (-4 °C), with samples cultured at 25 °C set as the control group. Genes with raw counts < 10 in all samples were defined as non-expressed genes; accordingly, only 31 PsatGSTs genes were expressed in the transcriptome, 21 genes were not expressed. Hierarchical clustering revealed distinct expression dynamics among different subfamilies and individual genes (Figure 8). Several genes, including PsatDHAR1, PsatGSTF2, PsatGSTU5,PsatGSTU9 and PsatGSTU15 were significantly and persistently up-regulated under low temperature stress. In sharp contrast, PsatGSTL2,PsatGSTU13, PsatGSTU22 and PsatGSTU33 were significantly and persistently down-regulated under low temperature stress. PsatGSTU29 was down-regulated at 6h under low temperature stress. PsatGSTF1 was down-regulated at 12h under low temperature stress.
Figure 8.
Expression profiling of PsatGSTs genes in leaves under low temperature stress. Note: Heatmap showing log₂-transformed values of PsatGSTs genes at 3 h, 6 h, and 12 h under control (25 °C) and low temperature stress (-4 °C) conditions. Color scale represents relative expression levels from low (geeen) to high (red).
Figure 8.
Expression profiling of PsatGSTs genes in leaves under low temperature stress. Note: Heatmap showing log₂-transformed values of PsatGSTs genes at 3 h, 6 h, and 12 h under control (25 °C) and low temperature stress (-4 °C) conditions. Color scale represents relative expression levels from low (geeen) to high (red).
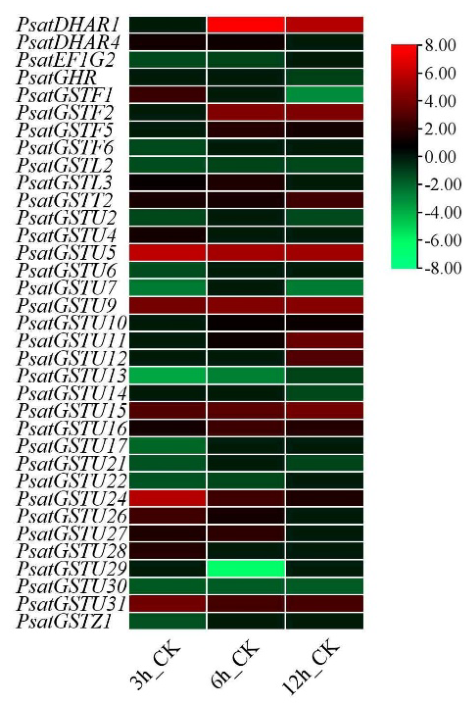
Figure 9.
Expression profiling of PsatGSTs genes in leaves under low temperature stress. Note: Different letters indicate significant differences between time points (p < 0.05).
Figure 9.
Expression profiling of PsatGSTs genes in leaves under low temperature stress. Note: Different letters indicate significant differences between time points (p < 0.05).
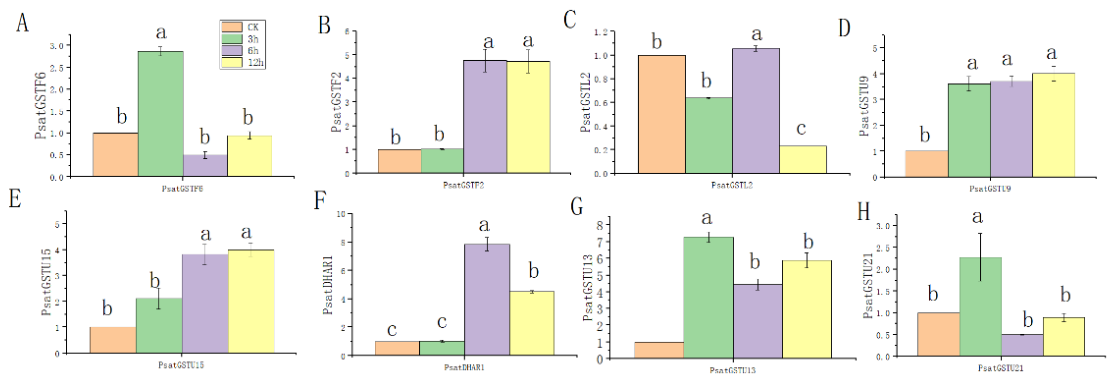
To comprehensively characterize the expression patterns of pea glutathione S-transferase family genes under low-temperature stress, quantitative real-time PCR (qRT-PCR) was used to measure the relative transcript levels of eight PsatGST genes in pea leaves. The eight tested PsatGST genes displayed diverse expression changes under low-temperature stress. Their expression trends were highly consistent with the transcriptome sequencing results.
4. Discussion
Transcriptomic profiling revealed functional differentiation and stage-specific transcriptional patterns of the PsatGST gene family in leaves of DX27 under low-temperature stress. GO enrichment analysis showed highly consistent functional enrichment categories across all treatment groups, dominated by oxidation-reduction processes, stress responses, membrane-related biological functions and catalytic activities. This overall enrichment profile shares high similarity with the canonical biological functions of GST proteins reported in previous research [23]. Continuous enrichment of oxidation-reduction processes in the BP category and oxidoreductase activity in the MF category at all sampling time points only provides transcriptomic background associated with GST-mediated redox homeostasis, rather than definitive functional evidence for individual PsatGST genes.
In this study, a total of 52 PsatGST members were identified and classified into nine distinct subfamilies. Genes within the same subfamily shared conserved gene structures and protein motifs, and the majority of members belonged to Phi and Tau subfamilies, two subgroups frequently reported to participate in plant abiotic stress responses in other plant species. Minor structural divergence across different subfamilies may underlie potential functional differentiation of the pea GST family. The uneven distribution of PsatGST genes on seven pea pseudochromosomes is consistent with the evolutionary characteristics of GST families in other higher plants.
Promoter cis-element analysis provides preliminary clues about transcriptional regulation of PsatGST genes. The widespread presence of light-responsive motifs (G-box, GT1-motif, I-box) in promoter regions only indicates a potential regulatory linkage between light signaling and cold response pathways. Previous studies have proven that light can modulate plant stress tolerance by regulating antioxidant systems in other crops [35,36,37]. The frequent occurrence of MYB binding sites in PsatGST promoters corresponds to published evidence that MYB transcription factors mediate the expression of numerous stress-responsive genes under cold and drought conditions [38]. Direct regulatory relationships between these cis-motifs and cold-induced transcription of PsatGSTs require further experimental verification.
As a unique branch of the GST superfamily, DHAR functions as a vital enzyme in the ascorbate-glutathione (AsA-GSH) cycle, catalyzing the regeneration of ascorbic acid (AsA) from dehydroascorbic acid [39]. AsA is the most abundant non-enzymatic antioxidant in plant cells; sustained DHAR activity is required to regenerate AsA for scavenging excess ROS and maintaining intracellular redox balance under cold stress [40]. Persistently elevated transcript levels of PsatDHAR1 and PsatDHAR4 throughout cold treatment imply potential continuous activation of the AsA-GSH antioxidant cycle to alleviate cold-triggered oxidative damage.
Consistent correlations between GST expression and cold adaptation have been observed across various plant species. Thirty-nine CmGST genes were identified in melon (Cucumis melo); cold-adapted melon varieties exhibited higher GST enzyme activity and upregulated expression of 28 stress-responsive GST genes mainly from Tau, Phi and DHAR subfamilies [41]. In walnut (Juglans regia), transgenic plants overexpressing JrGSTU1 displayed significantly higher GST enzyme activity relative to wild-type and RNAi lines, showing that elevated GST abundance can enhance cold tolerance in heterologous systems [42]. In winter rapeseed (Brassica napus), multiple GST genes (including BnaA02g35760D, BnaC06g20450D, BnaC06g35490D) were markedly induced under freezing conditions in cold-adapted accessions, with stably expressed genes (BnaA03g26130D, BnaC03g30880D) and transiently induced genes (BnaC01g39170D, BnaC08g37940D) showing distinct expression trends during cold acclimation [43]. Cold stress strongly induced BraGSTF2 in winter turnip rape, further supporting that Phi-subfamily GSTs are commonly linked to cold response processes across plant taxa [34].
The Tau subfamily constitutes the largest subgroup of pea PsatGSTs, containing 31 members (60.8%) with highly diversified expression patterns, including constitutively high expression, low basal expression, early cold induction and late cold induction. Such broad transcriptional heterogeneity suggests the Tau subfamily makes major contributions to the cold-triggered transcriptional reprogramming of DX27, reflecting evolutionary plasticity of the PsatGST family. Divergent temporal expression profiles of PsatGSTU27 and PsatGSTU4 imply coordinated transcriptional activation among Tau members across cold treatment stages, which may sequentially participate in early stress signal perception and subsequent cold acclimation processes.
RNA-seq was used to characterize transcriptional changes of the PsatGST family in the moderately cold-tolerant pea cultivar DX27 under low-temperature stress. Multiple genes including PsatDHAR1, PsatGSTF2, PsatGSTU5, PsatGSTU9 and PsatGSTU15 were significantly upregulated under cold treatment compared with the control group. A set of genes with sustained expression during freezing exposure was screened: PsatDHAR1, PsatGSTF2, PsatGSTU5, PsatGSTU9, PsatGSTU15, PsatGSTL2, PsatGSTU13, PsatGSTU22, PsatGSTU33, PsatGSTU29 and PsatGSTF1. Collectively, transcriptome and qRT-PCR results only identify a panel of cold-associated PsatGST candidate genes with altered expression correlations under low-temperature. In addition, some PsatGSTs exhibited opposite expression trends under cold versus freezing stress, suggesting that different genes respond to distinct types of stress. Conversely, other genes showed similar expression patterns under both stress conditions, reflecting both functional specificity and pleiotropy of GST genes [44]. These findings indicate that PsatGSTs play important roles in defending against low-temperature stress.
Author Contributions
Conceptualization, Z.N. and Z. C.; methodology, Z. C., L.Z., and; formal analysis, J.L. and Z.N.; data curation, B.S., Z. C., and Y.S.; writing—original draft preparation, Z. C.; writing—review and editing, B.S. and L.Z.; project administration, Z.N. and Z. C.; funding acquisition, Z.N., and Z. C. All authors have read and agreed to the published version of the manuscript.
Funding
This research was funded by the Gansu Academy of Agricultural Sciences Doctoral Fund, grant number 2024GAAS30; the Gansu Provincial Department of Agriculture and Rural Affairs Science and Technology Support Program, grant number KJZC-2026-27; the National Natural Science Foundation of China, grant number 32260483.
Institutional Review Board Statement
Not applicable.
Informed Consent Statement
Not applicable.
Data Availability Statement
Not applicable.
Conflicts of Interest
Not applicable.
References
- Dixon, D.P.; Edwards, R. Glutathione transferases. Arab. Book 2010, 8, e0131. [Google Scholar] [CrossRef] [PubMed]
- Jing, X.-Q.; Zhou, M.-R.; Nie, X.-M.; Zhang, L.; Shi, P.-T.; Shalmani, A.; Miao, H.; Li, W.-Q.; Liu, W.-T.; Chen, K.-M. OsGSTU6 Contributes to Cadmium Stress Tolerance in Rice by Involving in Intracellular ROS Homeostasis. J. Plant Growth Regul. 2020, 40, 945–961. [Google Scholar] [CrossRef]
- Hussain, B.; Riaz, L.; Javed, K.; Umer, M.J.; Abbas, A.; Rao, U.; Khan, S.W.; Abbas, Q.; Din, S.U.; Batool, R. Plant glutathione transferases and their role in the mitigation of abiotic stresses. In Antioxidant Defense in Plants; Springer, 2022; pp. 235–258. [Google Scholar]
- Basantani, M.; Srivastava, A. Plant glutathione transferases — a decade falls short. Can. J. Bot. 2007, 85, 443–456. [Google Scholar] [CrossRef]
- Edwards, R.; Dixon, D.P.; Lapthorn, A.; Edwards, R. Plant glutathione transferases. Methods Enzymol. 2002, 401, 169–186. [Google Scholar]
- Han, X.M. Functional divergence of phi GST gene family in Populus; Beijing Forestry University, 2014. [Google Scholar]
- Iqbal, N.; Khan, V.; Singh, R.; Saffeullah, P.; Umar, S.; Gupta, R. Reactive Oxygen Species and Glutathione-Mediated Regulation of Phytohormone Signaling in the Activation of Plant Immunity. J. Plant Growth Regul. 2025, 45, 1661–1676. [Google Scholar] [CrossRef]
- Srivastava, S.; Singh, A.; Srivastava, A.K.; Suprasanna, P.; Eapen, S. Plant glutathione transferase mediated stress tolerance: functions and biotechnological applications. Plant Cell Rep. 2017, 36, 791–805. [Google Scholar] [CrossRef] [PubMed]
- Rao, M.J.; Duan, M.; Zhou, C.; Jiao, J.; Cheng, P.; Yang, L.; Zheng, B. Antioxidant defense system in plants: reactive oxygen species production, signaling, and scavenging during abiotic stress-induced oxidative damage. Horticulturae 2025, 11(5), 477. [Google Scholar] [CrossRef]
- Laxa, M.; Liebthal, M.; Telman, W.; Chibani, K.; Dietz, K.-J. The Role of the Plant Antioxidant System in Drought Tolerance. Antioxidants 2019, 8, 94. [Google Scholar] [CrossRef] [PubMed]
- Liu, L.; Feng, M.; Li, J.; Wang, J.; Guo, R.; Chai, J.; Si, L.; Sun, N.; Guo, C. ABA Accumulation Confers Cross-Adaptation to Saline-Alkali and Cold Stresses in Alfalfa. Plant Cell Environ. 2026, 49, 6106–6123. [Google Scholar] [CrossRef] [PubMed]
- Santelia, D.; Soranzo, N.; Mizzi, L.; Pè, M.E. Analysis of the GST genes clusters in Arabidopsis. In Proceedings of the XLV Italian Society of Agricultural Genetics Annual Congress, 2001. [Google Scholar]
- Jain, M.; Tyagi, A.K.; Khurana, J.P. Genome-wide identification of glutathione S-transferase gene family in rice and Arabidopsis. BMC Genom. 2010, 11(1), 35. [Google Scholar]
- Vaish, S.; Awasthi, P.; Tiwari, S.; Tiwari, S.K.; Gupta, D. Genome-wide analysis and transcript profiling identify several abiotic and biotic stress-responsive glutathione S-transferase genes in soybean. Plant Gene 2020, 23, 100239. [Google Scholar] [CrossRef]
- Hao, Y.; Xu, S.; Lyu, Z.; Wang, H.; Kong, L.; Sun, S. Comparative Analysis of the Glutathione S-Transferase Gene Family of Four Triticeae Species and Transcriptome Analysis of GST Genes in Common Wheat Responding to Salt Stress. Int. J. Genom. 2021, 2021, 1–11. [Google Scholar] [CrossRef] [PubMed]
- Hasan, M.S.; Singh, V.; Islam, S.; Islam, M.S.; Ahsan, R.; Kaundal, A.; et al. Genome-wide identification and expression profiling of glutathione S-transferase family under multiple abiotic and biotic stresses in Medicago truncatula L. PLoS ONE 2021, 16(2), e0247170. [Google Scholar] [CrossRef] [PubMed]
- Zhang, C.L.; Nan, J.S.; Qin, H.Y.; An, J.H.; Xu, Z.P.; Han, B. Evaluation of production performance and nutritional value of mixed sowing of oat and common vetch in semi-arid cool region of Inner Mongolia. Pratacultural Sci. 2024, *41*(5), 1189–1200. [Google Scholar]
- Liu, F.; Feng, G.; Liu, Z.; Chen, Y.; Yang, F. Spring sowing high-yield cultivation techniques of pea cultivar ‘Jinwan 5’ in northern Shanxi region. J. North. Agric. 2012, 40(4), 112. [Google Scholar] [CrossRef]
- Kim, D.; Langmead, B.; Salzberg, S.L. HISAT: A fast spliced aligner with low memory requirements. Nat. Methods 2015, 12, 357–360. [Google Scholar] [CrossRef] [PubMed]
- Love, M.I.; Huber, W.; Anders, S. Moderated estimation of fold change and dispersion for RNA-seq data with DESeq2. Genome Biol. 2014, 15(12), 550. [Google Scholar] [CrossRef] [PubMed]
- Pertea, M.; Pertea, G.M.; Antonescu, C.M.; Chang, T.-C.; Mendell, J.T.; Salzberg, S.L. StringTie enables improved reconstruction of a transcriptome from RNA-seq reads. Nat. Biotechnol. 2015, 33, 290–295. [Google Scholar] [CrossRef] [PubMed]
- Yu, G.; Wang, L.-G.; Han, Y.; He, Q.-Y. clusterProfiler: An R Package for Comparing Biological Themes Among Gene Clusters. OMICS J. Integr. Biol. 2012, 16, 284–287. [Google Scholar] [CrossRef] [PubMed]
- Wickham, H. ggplot2: Elegant Graphics for Data Analysis; Springer Verlag New York, 2016. [Google Scholar]
- Finn, R.D.; Bateman, A.; Clements, J.; Coggill, P.; Eberhardt, R.Y.; Eddy, S.R.; Heger, A.; Hetherington, K.; Holm, L.; Mistry, J.; et al. Pfam: the protein families database. Nucleic Acids Res. 2014, 42, D222–D230. [Google Scholar] [CrossRef] [PubMed]
- Eddy, S.R. Accelerated Profile HMM Searches. PLoS Comput. Biol. 2011, 7, e1002195. [Google Scholar] [CrossRef] [PubMed]
- Thompson, J.D.; Higgins, D.G.; Gibson, T.J. CLUSTAL W: Improving the sensitivity of progressive multiple sequence alignment through sequence weighting, position-specific gap penalties and weight matrix choice. Nucleic Acids Res. 1994, 22, 4673–4680. [Google Scholar] [CrossRef] [PubMed]
- Kumar, S.; Stecher, G.; Tamura, K. MEGA7: Molecular Evolutionary Genetics Analysis version 7.0 for bigger datasets. Mol. Biol. Evol. 2016, 33(7), 1870–1874. [Google Scholar] [CrossRef] [PubMed]
- Subramanian, B.; Gao, S.; Lercher, M.J.; Hu, S.; Chen, W.-H. Evolview v3: a webserver for visualization, annotation, and management of phylogenetic trees. Nucleic Acids Res. 2019, 47, W270–W275. [Google Scholar] [CrossRef] [PubMed]
- Voorrips, R.E. MapChart: Software for the graphical presentation of linkage maps and QTLs. J. Hered. 2002, 93, 77–78. [Google Scholar] [CrossRef] [PubMed]
- Lescot, M.; Déhais, P.; Thijs, G.; Marchal, K.; Moreau, Y.; Van de Peer, Y.; Rouzé, P.; Rombauts, S. PlantCARE, a database of plant cis-acting regulatory elements and a portal to tools for in silico analysis of promoter sequences. Nucleic Acids Res. 2002, 30, 325–327. [Google Scholar] [CrossRef] [PubMed]
- Bailey, T.L.; Boden, M.; Buske, F.A.; Frith, M.; Grant, C.E.; Clementi, L.; Ren, J.; Li, W.W.; Noble, W.S. MEME SUITE: Tools for motif discovery and searching. Nucleic Acids Res. 2009, 37, w202–w208. [Google Scholar] [CrossRef] [PubMed]
- Chen, C.J.; Chen, H.; Zhang, Y.; Thomas, H.R.; Frank, M.H.; He, Y.H.; Xia, R. TBtools: An Integrative Toolkit Developed for Interactive Analyses of Big Biological Data. Mol. Plant 2020, 13, 1194–1202. [Google Scholar] [CrossRef] [PubMed]
- Kolde, R. pheatmap: Pretty Heatmaps. R package version 1.0.12. 2019. [Google Scholar]
- Wei, L.; Zhu, Y.; Liu, R.; Zhang, A.; Zhu, M.; Xu, W.; Lin, A.; Lu, K.; Li, J. Genome wide identification and comparative analysis of glutathione transferases (GST) family genes in Brassica napus. Sci. Rep. 2019, 9, 1–13. [Google Scholar] [CrossRef] [PubMed]
- Niu, Z.; Liu, L.; Yue, J.; Wu, J.; Wang, W.; Pu, Y.; Ma, L.; Fang, Y.; Sun, W. Genome-Wide Identification of GSTs Gene Family and Functional Analysis of BraGSTF2 of Winter Rapeseed (Brassica rapa L.) under Cold Stress. Genes 2023, 14, 1689. [Google Scholar] [CrossRef] [PubMed]
- Kayum, A.; Nath, U.K.; Park, J.-I.; Biswas, M.K.; Choi, E.K.; Song, J.-Y.; Kim, H.-T.; Nou, I.-S. Genome-Wide Identification, Characterization, and Expression Profiling of Glutathione S-Transferase (GST) Family in Pumpkin Reveals Likely Role in Cold-Stress Tolerance. Genes 2018, 9, 84. [Google Scholar] [CrossRef] [PubMed]
- Wang, X.; Niu, Y.; Zheng, Y. Multiple Functions of MYB Transcription Factors in Abiotic Stress Responses. Int. J. Mol. Sci. 2021, 22, 6125. [Google Scholar] [CrossRef] [PubMed]
- Heshiki, R.; Mizumoto, K.B.; Naomasa, R.F.; Matsumura, T.; Yamasaki, H. Ascorbate Recycling as a Molecular Redox Capacitor: A Sulfur-Centered Perspective on Dehydroascorbate Reduction in Biological Systems. Cells 2026, 15, 1391. [Google Scholar] [CrossRef]
- Sachdev, S.; Ansari, S.A.; Ansari, M.I.; Fujita, M.; Hasanuzzaman, M. Abiotic Stress and Reactive Oxygen Species: Generation, Signaling, and Defense Mechanisms. Antioxidants 2021, 10, 277. [Google Scholar] [CrossRef] [PubMed]
- Islam, S.; Das Sajib, S.; Jui, Z.S.; Arabia, S.; Islam, T.; Ghosh, A. Genome-wide identification of glutathione S-transferase gene family in pepper, its classification, and expression profiling under different anatomical and environmental conditions. Sci. Rep. 2019, 9, 1–15. [Google Scholar] [CrossRef] [PubMed]
- Song, W.; Zhou, F.; Shan, C.; Zhang, Q.; Ning, M.; Liu, X.; Zhao, X.; Cai, W.; Yang, X.; Hao, G.; et al. Identification of Glutathione S-Transferase Genes in Hami Melon (Cucumis melo var. saccharinus) and Their Expression Analysis Under Cold Stress. Front. Plant Sci. 2021, 12. [Google Scholar] [CrossRef] [PubMed]
- Yang, G.; Xu, Z.; Peng, S.; Sun, Y.; Jia, C.; Zhai, M. In planta characterization of a tau class glutathione S-transferase gene from Juglans regia (JrGSTTau1) involved in chilling tolerance. Plant Cell Rep. 2015, 35, 681–692. [Google Scholar] [CrossRef] [PubMed]
- Ma, L.; Bai, J.; Zhao, Y.H.; Sun, B.L.; Hou, X.F.; Fang, Y.; Wang, W.T.; Pu, Y.Y.; Liu, L.J.; Xu, J.; Tao, X.L.; Sun, W.C.; Wu, J.Y. Identification and analysis of expressed proteins and the BnGSTs gene family in winter rapeseed (Brassica napus) under cold stress. Acta Agron. Sin. 2023, 49, 153–169. [Google Scholar]
- Kayum, A.; Nath, U.K.; Park, J.-I.; Biswas, M.K.; Choi, E.K.; Song, J.-Y.; Kim, H.-T.; Nou, I.-S. Genome-Wide Identification, Characterization, and Expression Profiling of Glutathione S-Transferase (GST) Family in Pumpkin Reveals Likely Role in Cold-Stress Tolerance. Genes 2018, 9, 84. [Google Scholar] [CrossRef] [PubMed]
Figure 1.
Figure 1. Principal component analysis (PCA)(A), sample correlation analysis(B), Boxplot visualization(C) and DEG statistics(D) in different sample groups.
Figure 1.
Figure 1. Principal component analysis (PCA)(A), sample correlation analysis(B), Boxplot visualization(C) and DEG statistics(D) in different sample groups.
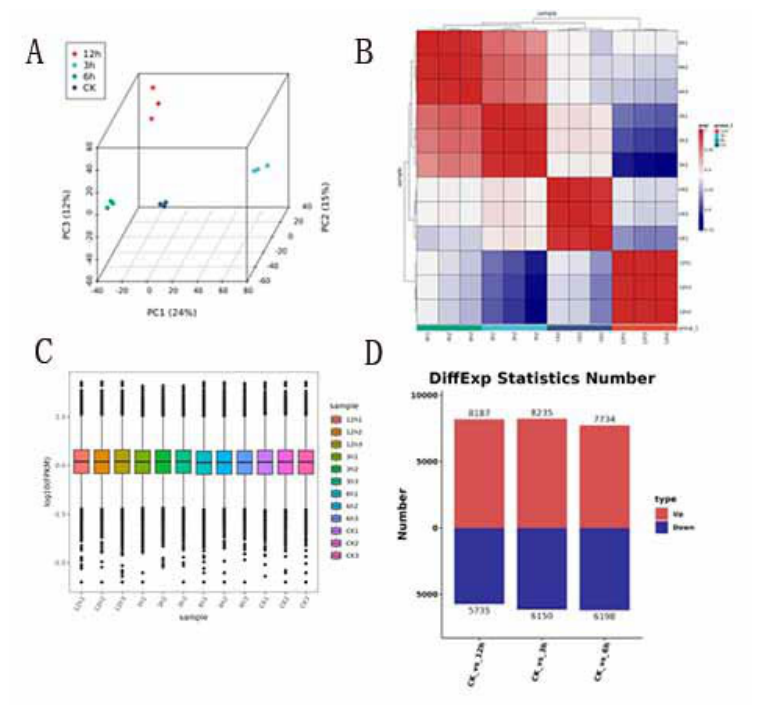
Figure 2.
Gene Ontology (GO) enrichment analysis of DEGs in pea leaves under low temperature stress (−4 °C). Note: (A) GO enrichment analysis of DEGs in CK_vs_3h; (B) GO enrichment analysis of DEGs in CK_vs_6h; (C) GO enrichment analysis of DEGs in CK_vs_12h.
Figure 2.
Gene Ontology (GO) enrichment analysis of DEGs in pea leaves under low temperature stress (−4 °C). Note: (A) GO enrichment analysis of DEGs in CK_vs_3h; (B) GO enrichment analysis of DEGs in CK_vs_6h; (C) GO enrichment analysis of DEGs in CK_vs_12h.
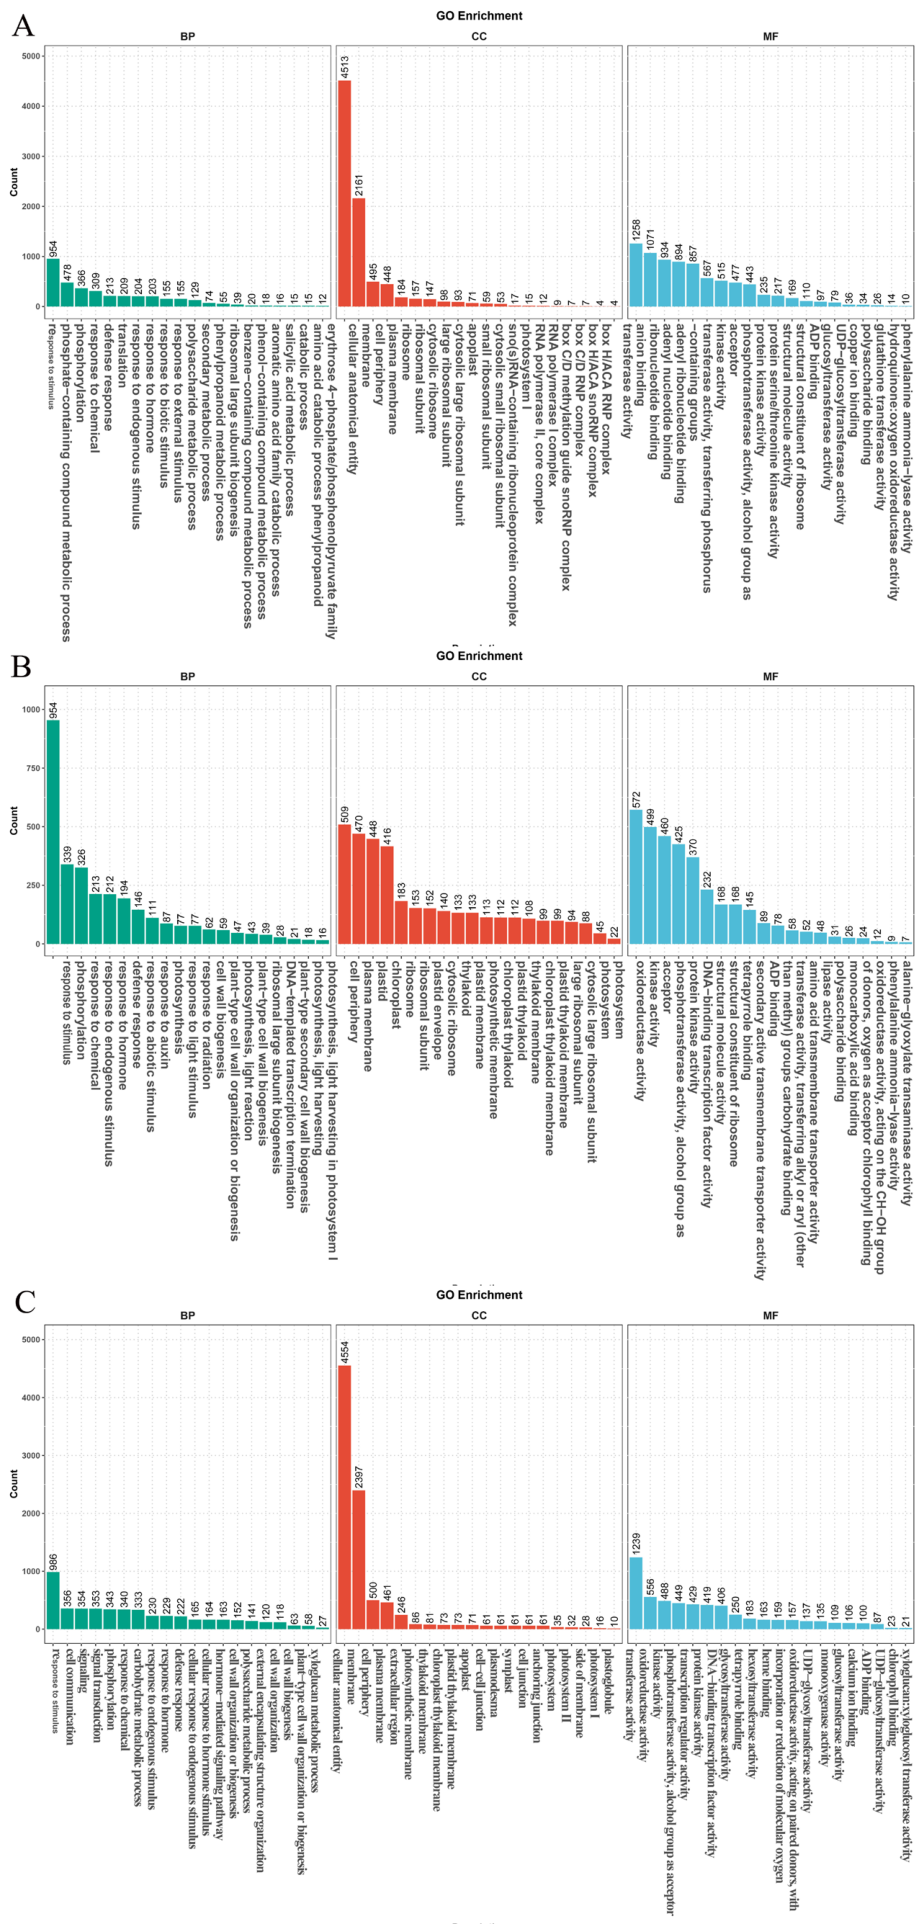
Figure 4.
Phylogenetic tree of the pea and Arabidopsis thaliana GSTs gene family.
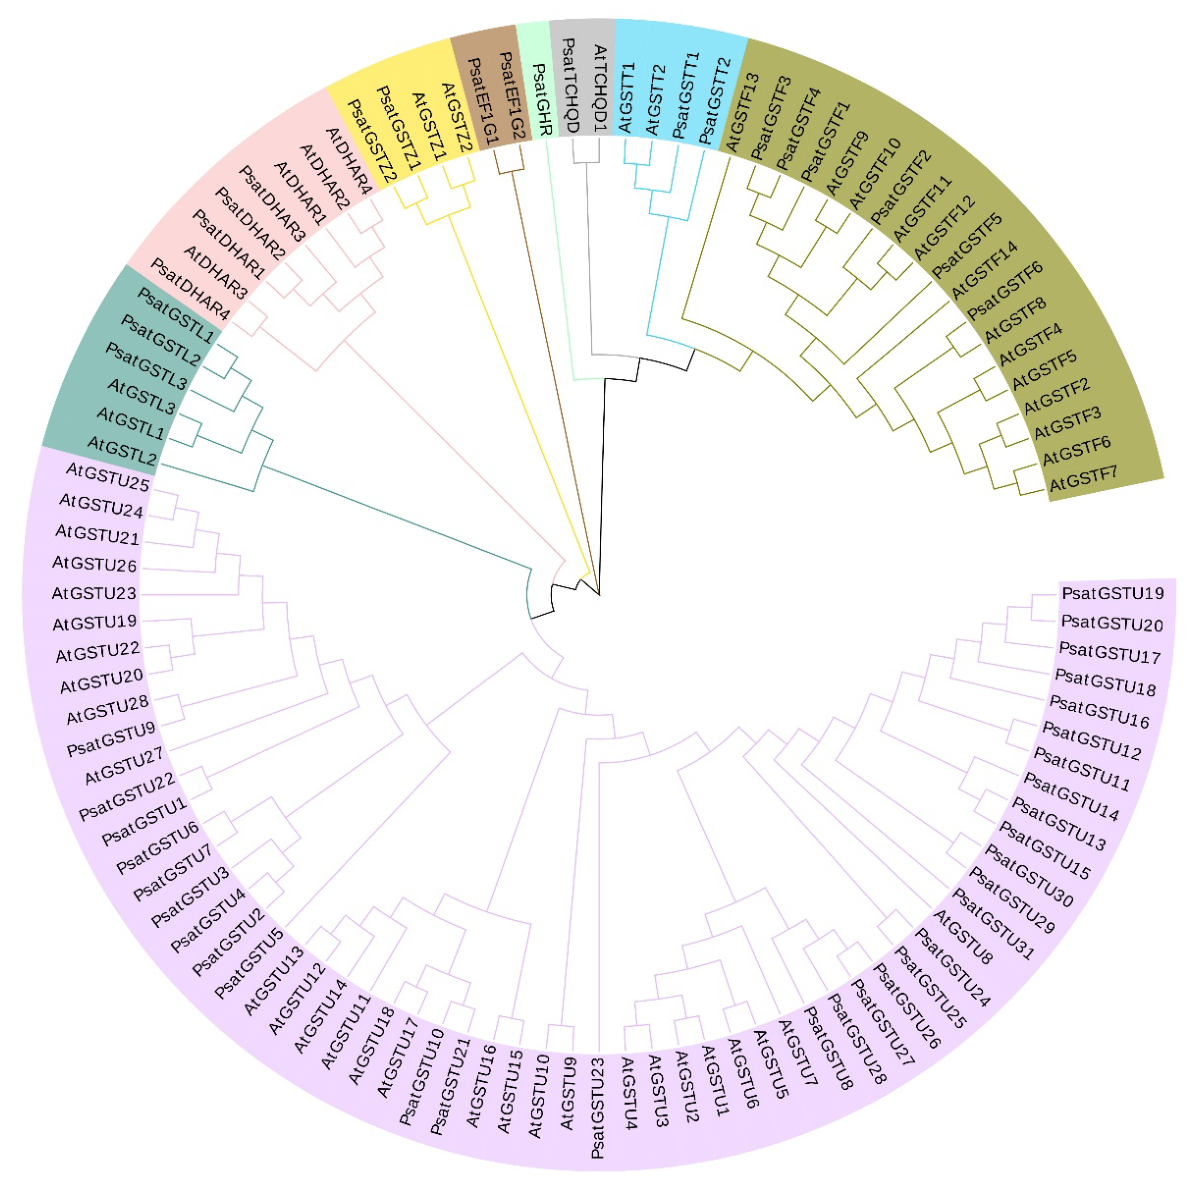
Figure 5.
Conserved motifs and gene structures of PsatGST genes. (A) Phylogenetic tree of PsatGSTs genes. (B) Distribution of conserved motifs. Different colored boxes represent distinct conserved motifs. (C) Exon–intron structures. Yellow boxes indicate exons, and black lines represent introns.
Figure 5.
Conserved motifs and gene structures of PsatGST genes. (A) Phylogenetic tree of PsatGSTs genes. (B) Distribution of conserved motifs. Different colored boxes represent distinct conserved motifs. (C) Exon–intron structures. Yellow boxes indicate exons, and black lines represent introns.
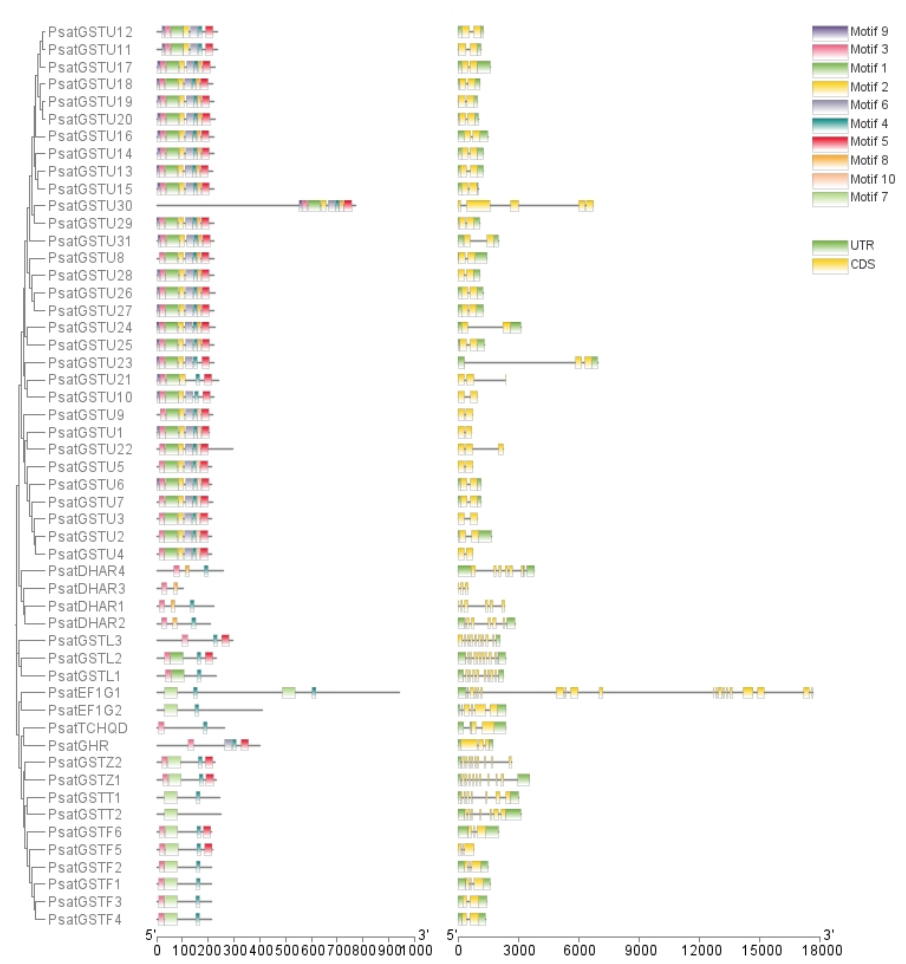
Figure 6.
Chromosomal distribution of pea PsatGST genes.
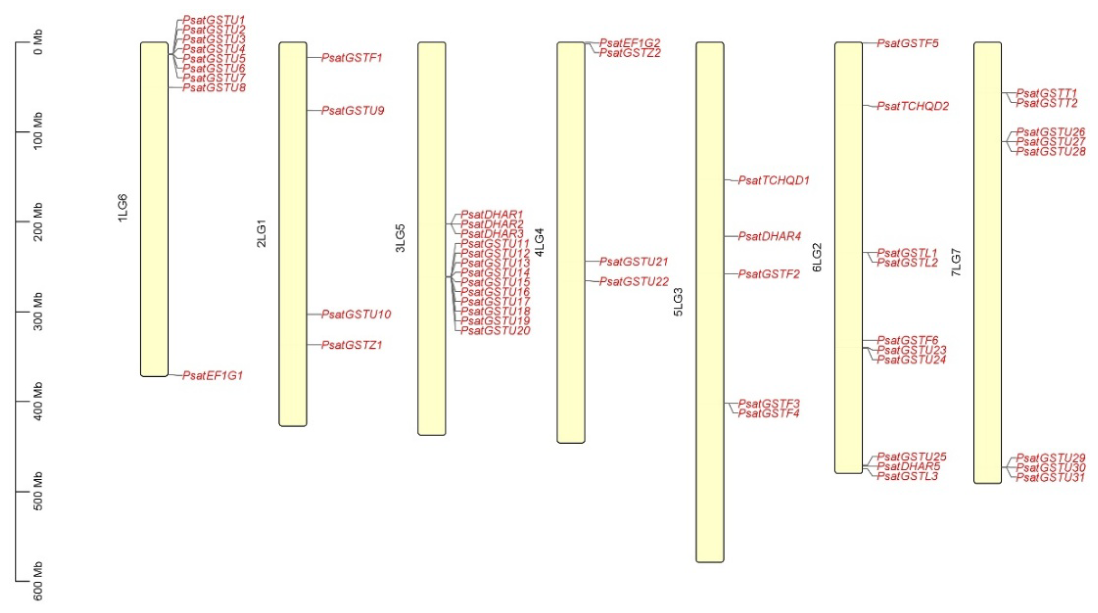
Figure 7.
Cis-acting regulatory elements in the promoter regions of pea PsatGSTs genes. The 2000 bp upstream sequences of each PsatGSTs gene were retrieved and analyzed for cis-element identification, with different colored boxes corresponding to distinct types of cis-acting elements.
Figure 7.
Cis-acting regulatory elements in the promoter regions of pea PsatGSTs genes. The 2000 bp upstream sequences of each PsatGSTs gene were retrieved and analyzed for cis-element identification, with different colored boxes corresponding to distinct types of cis-acting elements.
Disclaimer/Publisher’s Note: The statements, opinions and data contained in all publications are solely those of the individual author(s) and contributor(s) and not of MDPI and/or the editor(s). MDPI and/or the editor(s) disclaim responsibility for any injury to people or property resulting from any ideas, methods, instructions or products referred to in the content. |
© 2026 by the authors. Licensee MDPI, Basel, Switzerland. This article is an open access article distributed under the terms and conditions of the Creative Commons Attribution (CC BY) license (http://creativecommons.org/licenses/by/4.0/).
Copyright: This open access article is published under a Creative Commons CC BY 4.0 license, which permit the free download, distribution, and reuse, provided that the author and preprint are cited in any reuse.