

Submitted:
06 August 2026
Posted:
06 August 2026
You are already at the latest version
Abstract
Quantitative image analysis is an important basis for turning microscopy observations into reproducible data. Its throughput and reproducibility depend on the analysis software, and CellProfiler is useful because it builds an analysis pipeline by combining modules at a relatively low cost, without requiring programming. In the gonad of the nematode Caenorhabditis elegans, germ cells are arranged along the distal–proximal axis in an order that reflects their developmental stage. Yet this highly organized arrangement has rarely been quantified, though its disruption could reveal mutant phenotypes. In this study, we built a CellProfiler pipeline that measures the nuclear area and the centroid-to-centroid distance between germ-cell nuclei in the C. elegans gonad. We first examined the object-detection conditions and found that the minimum and maximum diameter settings, together with visual confirmation, are important for reliable recognition. Applying the pipeline to DAPI-stained germ-cell nuclei in the distal arm at the late L4 stage, adult day 1, and adult day 3, we found that the nuclear size was small at the L4 stage and did not differ between adult day 1 and day 3. This pipeline enables quantitative analysis of germline development within the animal and of abnormalities revealed by mutant analysis.
Keywords:
CellProfiler
; fluorescence microscopy
; confocal microscopy
; image analysis
; image segmentation
; Caenorhabditis elegans
; germline
; meiotic germ cells
; gonad
; larval development
1. Introduction
In life science research, image analysis that quantifies the shape, number, and spatial arrangement of cells and subcellular structures from microscopy images is becoming more important as a foundational technique that turns descriptive observations into objective and reproducible data [1,2]. In particular, as fluorescence microscopy has advanced and large-scale imaging has become common, the amount of image data obtained has increased greatly. Establishing analysis methods that quantify these data under consistent criteria is now a key factor for the throughput and reproducibility of research [3,4].
Several image analysis software packages meet this need. Among them, Fiji/ImageJ is widely used as a standard platform for image analysis, and many plugins have been developed and shared by researchers around the world [5]. However, building an analysis procedure suited to a given image often requires repeating operations through the GUI, and simplifying this requires writing macros, so it depends in part on the user's programming skills. In contrast, CellProfiler provides each processing step as a module and uses a design in which these modules are combined to build an analysis "pipeline" [6]. This design keeps coding to a minimum, lets an analysis procedure be assembled flexibly according to the target and the purpose, and can achieve reproducible quantitative analysis at a relatively low setup cost. For this reason, concrete examples of how to build a pipeline and how accurate it is are practically valuable, because they help researchers introduce and validate the tool.
In this study, as a target for building and validating such a pipeline, we focused on the germ cells in the gonad of the nematode Caenorhabditis elegans. C. elegans is a model organism that consists mainly of hermaphrodites, and because its body is transparent, it allows various events in the living animal—for example, the maturation of germ cells—to be observed over time [7]. The surface of the gonad is covered by sheath cells (Figure 1). Germ cells proliferate near the stem cell niche at the distal end of the gonad, move toward the proximal side while progressing through meiotic prophase, and differentiate into mature oocytes in the proximal gonad, which are then fertilized in the spermatheca; they thus form an assembly-line-like arrangement (Figure 1) [8,9,10]. Because the spatial axis of the gonad corresponds to the temporal axis of meiosis and gametogenesis, analyzing the spatial features of germ-cell nuclei is a useful way to describe the progression of meiotic prophase. However, this highly organized arrangement has rarely been quantified, even though measuring its disruption could provide a useful indicator of mutant phenotypes. We therefore focused on the germ-cell nuclei in the distal arm, which are arranged around the rachis along the outer circumference, and tried to quantify their arrangement and size. A method that quantifies the arrangement of germ-cell nuclei in the distal gonad could become a foundational technique for evaluating the dynamics of the germline stem/progenitor cell pool and reproductive aging.
Specifically, we aimed to build a CellProfiler pipeline that combines several modules to quantify the nuclear area and the centroid-to-centroid distance between nuclei (i.e., the inter-nuclear distance) of germ-cell nuclei in C. elegans. We first examined the nuclear detection conditions to evaluate the validity of object recognition. We then applied the pipeline to the distal gonad at the late L4 stage, adult day 1, and adult day 3, in which nuclei were stained with DAPI, to show that changes in germ-cell nuclear size with developmental and aging stages can be quantified. This study focuses on building a pipeline that enables such quantitative analysis and on validating it as a two-dimensional image analysis.
2. Materials and Methods
2.1. Worm Synchronization, Fixation, and Staining
Nematodes (N2 strain from Caenorhabditis Genetics Center, Minneapolis, MN, USA) were handled using standard methods and cultured at 20°C [11,12]. To synchronize development, gravid adults were treated with an alkaline sodium hypochlorite solution (0.25 M NaOH, 20% NaOCl; ~1% available chlorine) to release eggs. Eggs were hatched overnight in M9 buffer at 20°C with gentle agitation. One day after bleach synchronization, the hatched larvae were cultured on NGM seeded with Escherichia coli OP50 (Caenorhabditis Genetics Center) as a food source, and were collected at the late L4 stage, adult day 1, and adult day 3 stages by suspension and washing in M9 buffer. Animals were fixed in 3% paraformaldehyde (PFA) buffered with 100 mM HEPES-KOH (pH 7.5) at 25°C for 3 h, and then washed three times with TBS (pH 7.4) (Nippon Gene, Tokyo, Japan). Samples were permeabilized with acetone at −30°C for 5 min and washed with PBS. DAPI (0.1 µg/µl in PBS; Dojindo Laboratories, Kumamoto, Japan) was then added, and the samples underwent repeated five freeze–thaw cycles at −80°C to yield specimens for observation.
2.2. Confocal Microscopy
The suspension of DAPI-stained worms was placed on a single-well glass-bottom dish (No. 1S, 3971-101, AGC Techno Glass, Shizuoka, Japan) and observed with an LSM 510 META laser scanning confocal microscope (Carl Zeiss, Jena, Germany) equipped with a C-Apochromat 40×/1.2 NA W Korr. UV-VIS-IR M27 water immersion objective (Carl Zeiss). DAPI was excited at 405 nm, and the emitted photons, passing through an HFT 405/488 beam splitter and an LP 420 long-pass filter, were detected with a photomultiplier tube (Figure 2a). The zoom factor was 1.0, and the confocal pinhole was set to 60 µm (1.0 Airy unit). Images were acquired at 512 × 512 pixels in the x- and y-directions.
2.3. Image Analysis with CellProfiler
Image analysis was performed using CellProfiler 4.2.8 installed on a PC running Windows 10 Home and equipped with an Intel Core i7-4770S CPU and 16 GB of RAM. LSM images were cropped to the region of interest in Fiji/ImageJ 1.54p and saved as TIFF files for analysis.
2.4. Statistics
Statistical analysis was performed by one-way ANOVA followed by Tukey's post hoc test using OriginPro 2025b (OriginLab, Northampton, MA, USA). Significance was set at p < 0.05.
3. Results & Discussion
3.1. Optimizing Nuclear Detection Conditions in CellProfiler
In CellProfiler, the success of an analysis is determined by how the "protocol" of the image analysis is built into an executable "pipeline." CellProfiler includes a module called MeasureObjectSizeShape, which is useful for image analysis of subcellular structures and is used to quantify the area and shape of target objects. However, this module does not have a function to segment the target objects in an image. In CellProfiler, segmentation and measurement require separate modules to be combined. In this study, we aimed to measure the shape and spacing of nuclei within the worm, so we used the IdentifyPrimaryObjects module to segment the nuclei and define objects, and the MeasureObjectSizeShape module to quantify these objects. In addition, the ExportToSpreadsheet module, which exports the analysis results to a spreadsheet such as Excel, is important for outputting the final values. We thus built a CellProfiler pipeline that combines these modules to measure the shape and spacing of nuclei quantitatively (Figure 2b).
First, we examined the detection conditions for germ-cell nuclei in the gonad of an adult day 1 animal using the IdentifyPrimaryObjects module. PFA-fixed worms were stained with DAPI and observed by confocal fluorescence microscopy, and part of the image was cropped and used for analysis (Figure 3a). When the values of "Typical diameter of objects, in pixel units (Min, Max)" were set far from the actual nuclear size, objects with shapes different from reality were detected. We therefore manually measured the range of nuclear diameters in the image beforehand (minimum diameter 10 to maximum diameter 30 pixels) and set the min and max values so that objects were recognized within this range, which improved the measurement accuracy (Figure 3b). When the minimum value (Min) was set smaller than the diameter of the target nuclei, a single nucleus was incorrectly split into small objects (Figure 3c). Next, when a value smaller than the diameter of the target nuclei was set as the maximum value (Max), objects were not recognized (Figure 3d). In contrast, setting a value larger than the diameter of the target nuclei as the maximum value did not reduce the recognition accuracy (Figure 3e). These results indicate that setting the minimum and maximum values is an important step in quantifying the number and shape of objects. For targets in which nuclei overlapped and formed a figure-eight shape, there were cases in which they were not recognized (Figure 3b, orange line). When the Min value was reduced to 8, they were recognized as two independent objects (Figure 3f). In this way, it is necessary to look for a condition, while changing the Min value, under which all objects are recognized, but no single condition recognizes all objects ideally. Therefore, the accuracy of the recognized objects should be checked manually, and it is important to select the correct measurement results from those obtained by entering several typical-diameter values, and to use them as the final quantitative data (Figure 3g).
It is a basic point in image analysis, but nuclei placed at the edge of the image with a missing part are not recognized as objects. Therefore, if such nuclei need to be measured, each whole nucleus should be placed within the image, either when taking the image under the microscope or when cropping the image for analysis. This can be solved by imaging a wider area using, for example, tile scanning. Because input values must also be set in the module, automating this process is not simple. However, combining it with other shape-determination algorithms, such as PunctaFinder [13] or spatial image correlation spectroscopy after binarization [14], to estimate the nuclear size approximately is expected to be useful for building a procedure toward automated quantification.
Finally, for the recognized objects, we quantified the nuclear area using the MeasureObjectSizeShape module and output the results as a CSV file using the ExportToSpreadsheet module. Note that the nuclear area is the value of interest. This analysis targets confocal fluorescence microscopy images, but there is no guarantee that all germ-cell nuclei are contained within the same confocal optical section. In other words, the interpretation of the measured area changes between the case in which most of the volume of a nucleus is contained in the optical section and the case in which only part of a nucleus is contained. This suggests that some adjustment is needed—for example, acquiring a z-stack during imaging to check how much of each nucleus is contained in the optical section and correcting the measured value, obtaining the volume by voxel analysis, or generating a projection image from the z-stack and then measuring the area. At least in this study, we examined the validity of a two-dimensional image analysis pipeline, and volume measurement is an important item for future work.
3.2. Quantifying Germ-Cell Nuclear Arrangement During Development and Aging
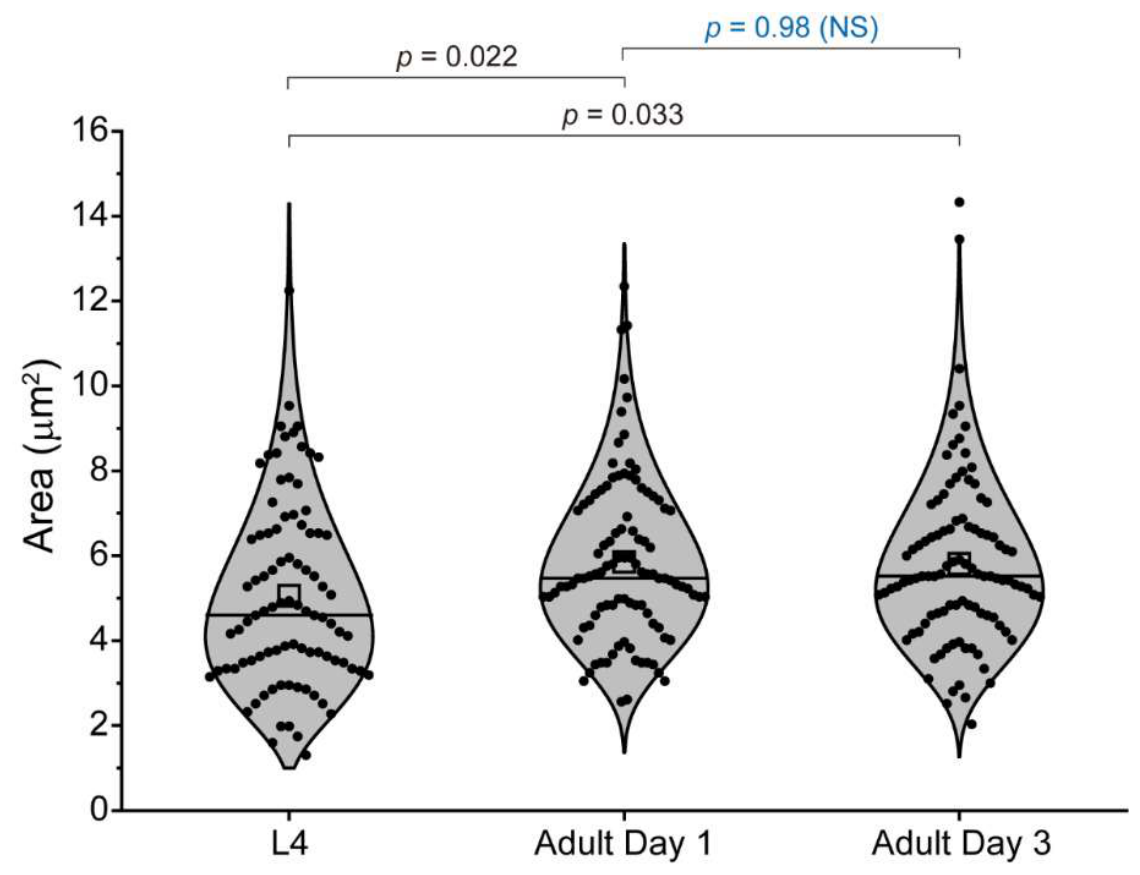
C. elegans is a nematode that consists mainly of hermaphrodites, and its egg-laying peaks in early adulthood (around day 1). Germ cells are formed at the distal end of the gonad and move toward the proximal side; after maturing into oocytes, they are fertilized within the body and become zygotes. Quantifying the arrangement of these germ cells at each age could become a foundational technique for evaluating their maturation process. For this purpose, we stained the nuclei of the germ cells that are arranged around the rachis along the outer circumference, in the distal arm of the gonad, at the late L4 stage, adult day 1, and adult day 3 with DAPI and quantified the nuclear size using the CellProfiler-based image analysis method established here. The nuclear size was small at the L4 stage, and no difference was seen between adult day 1 and day 3 (Figure 4). This marked increase in nuclear size from the L4 stage to adult day 1 is consistent with the rapid expansion and maturation of the germline during the L4-to-young-adult transition [8,15]. By early adulthood, the adult germline architecture and the stem/progenitor pool have largely been established and are maintained during the early reproductive period [16], which may explain the relatively small difference between adult day 1 and day 3. Because egg-laying continues at day 3, albeit reduced, the persistence of germ cells and the similarity of their nuclear size to day 1 are reasonable.
Because of the simplicity of the CellProfiler-based analysis, we measured only the meiotic germ cells held around the rachis. For example, by analyzing the mitotic cells in the progenitor zone, it is also possible to quantify the arrangement and size of the various germ-cell lineages inside the nematode gonad; however, the nuclei in the progenitor zone are densely located, so more precise condition settings would likely be required to separate them and recognize each nucleus as a distinct object for reliable quantification. Regions where germ cells overlapped in the image required manual correction and were excluded from the analysis. For such germ-cell overlap, using a higher-resolution z-axis observation method than confocal microscopy, such as super-resolution microscopy, and taking the three-dimensional arrangement into account would make it possible to quantify the germ-cell arrangement more precisely.
In addition, for increasing the amount of information through multicolor imaging, the CellProfiler-based analysis has a large advantage because of its speed. If the cost of establishing a single-color analysis method is taken as α, the total cost of extending it to m colors is α × m, and the increment is α × (m − 1). Alternatively, by observing fluorescent proteins expressed in living animals, it is also possible to quantify various stages of germ cells and their intranuclear localization at the same time; even so, simplifying the pipeline construction is effective for reducing the analysis cost.
3.3. Advantages and Limitations of CellProfiler, and Future Perspectives
CellProfiler is freeware and has the advantage of being easy to introduce. Fiji/ImageJ is also an excellent image analysis tool; many plugins have been developed by researchers around the world, and many of them are distributed for free. However, when arranging an analysis procedure suited to one's own images, building a macro is often required. In this respect, software such as CellProfiler, which lets one create an analysis pipeline by combining modules that are already fairly complete, is important for maintaining a diversity of analyses that can meet the varied purposes of researchers and the varied nature of the target images. In addition, because CellProfiler does not necessarily require binarization of the image, it allows an analysis that makes use of the rich gray-level information. Commercial software, in turn, is useful because the invested development costs sometimes make high-accuracy measurement using machine learning readily available, although the need for a purchase cost is a drawback. Because improving measurement accuracy with machine learning, and the fully automated image analysis that lies beyond it, are important issues for increasing throughput, a low introduction cost is not the only advantage. Therefore, each researcher should make a trade-off among introduction cost, the difficulty of pipeline construction, and measurement accuracy. Practical examples of image analysis are, on their own, often not thought worth publishing as original papers. Like clinical case reports, however, they deserve to be shared more widely as peer-reviewed original articles. In this sense, an increase in reports of image analysis measurements in the future would reduce the verification burden on each user and contribute to the development of the image-based spectroscopy field. This would, in turn, benefit scientific and technological research worldwide, and life science research in particular.
4. Conclusion
In this study, we built a CellProfiler pipeline that combines several modules to quantify the nuclear area and the inter-nuclear distance of germ-cell nuclei in the C. elegans gonad. By examining the object-detection conditions, we showed that the minimum and maximum diameter settings are important for correct recognition, and that checking the recognized objects manually and selecting results from several settings are needed for reliable quantification. Applying the pipeline to the distal arm at the late L4 stage, adult day 1, and adult day 3, we found that the nuclear size was small at the L4 stage and did not differ between adult day 1 and day 3. These results show that the pipeline can quantify germ-cell nuclear size across developmental and aging stages. This practical, low-cost pipeline provides a basis for quantifying germ-cell nuclear features, and extending it to volume measurement from z-stacks and to multicolor imaging remains important for future work.
Author Contributions
Conceptualization, A.Kitamura; methodology, H.O. and A.Kitamura; software, H.O. and A.Kitamura; validation, H.O. and A.Kitamura; formal analysis, H.O. and A.Kitamura; investigation, H.O., A.Kasai and A.Kitamura; resources, A.Kitamura; data curation, H.O., A.Kasai and A.Kitamura; writing—A.Kitamura; writing—review and editing, H.O. and A.Kitamura; visualization, A.Kasai and A.Kitamura; supervision, A.Kitamura; project administration, A.Kitamura; funding acquisition, A.Kasai and A.Kitamura. All authors have read and agreed to the published version of the manuscript.
Funding
A. Kasai was supported by grants from Japan Society for Promotion of Science (JSPS) Grant-in-Aid for Early-Career Scientists (24K20721). A. Kitamura was supported by grants from JSPS Grant-in-Aid for Transformative Research Areas (A) (24H02286) and Forming Japan's Peak Research Universities (J-PEAKS) (JPJS00420230001); the Japan Agency for Medical Research and Development (JP22gm6410028); Suhara-kinenn Zaidan Co., Ltd.; Hagiwara Foundation of Japan; and Hokkaido University L-Station.
Institutional Review Board Statement
Not applicable.
Informed Consent Statement
Not applicable.
Data Availability Statement
The original contributions presented in this study are included in the article. Further inquiries can be directed to the corresponding author.
Conflicts of Interest
The authors declare no conflicts of interest.
Acknowledgments
During the preparation of this manuscript, the authors used Claude Opus 4.8 for English editing. The authors have reviewed and edited the output and take full responsibility for the content of this publication.
Abbreviations
The following abbreviations are used in this manuscript:
| NGM | Nematode growth medium |
| TBS | Tris-buffered saline |
| PBS | Phosphate-buffered saline |
| GUI | Graphical User Interface |
| DAPI | 4′,6-diamidino-2-phenylindole |
| NaOH | Sodium hydroxide |
| NaOCl | Sodium hypochlorite |
| HEPES | 4-(2-hydroxyethyl)-1-piperazineethanesulfonic acid |
| KOH | Potassium hydroxide |
| CPU | Central processing unit |
| RAM | Random-access memory |
| HFT | Hauptfarbteiler |
| PFA | Paraformaldehyde |
References
- Zhanghao, K.; Li, M.; Chen, X.; Liu, W.; Li, T.; Wang, Y.; Su, F.; Wu, Z.; Shan, C.; Wu, J.; et al. Fast segmentation and multiplexing imaging of organelles in live cells. Nat. Commun. 2025, 16, 2769. [Google Scholar] [CrossRef] [PubMed]
- Prakash, K.; Baddeley, D.; Eggeling, C.; Fiolka, R.; Heintzmann, R.; Manley, S.; Radenovic, A.; Shroff, H.; Smith, C.; Schermelleh, L. Resolution in super-resolution microscopy - facts, artifacts, technological advancements and biological applications. J. Cell Sci. 2025, 138. [Google Scholar] [CrossRef] [PubMed]
- Cimini, B.A.; Bankhead, P.; D'Antuono, R.; Fazeli, E.; Fernandez-Rodriguez, J.; Fuster-Barcelo, C.; Haase, R.; Jambor, H.K.; Jones, M.L.; Jug, F.; et al. The crucial role of bioimage analysts in scientific research and publication. J. Cell Sci. 2024, 137. [Google Scholar] [CrossRef] [PubMed]
- Marcotti, S.; Gerontogianni, L.; Kelly, G.; Barry, D.J. Practical statistics for bioimage analysis - a guide to experimental design and data interpretation. J. Cell Sci. 2026, 139. [Google Scholar] [CrossRef] [PubMed]
- Schindelin, J.; Arganda-Carreras, I.; Frise, E.; Kaynig, V.; Longair, M.; Pietzsch, T.; Preibisch, S.; Rueden, C.; Saalfeld, S.; Schmid, B.; et al. Fiji: an open-source platform for biological-image analysis. Nat. Methods 2012, 9, 676–682. [Google Scholar] [CrossRef] [PubMed]
- Carpenter, A.E.; Jones, T.R.; Lamprecht, M.R.; Clarke, C.; Kang, I.H.; Friman, O.; Guertin, D.A.; Chang, J.H.; Lindquist, R.A.; Moffat, J.; et al. CellProfiler: image analysis software for identifying and quantifying cell phenotypes. Genome Biol. 2006, 7, R100. [Google Scholar] [CrossRef] [PubMed]
- Markaki, M.; Tavernarakis, N. Caenorhabditis elegans as a model system for human diseases. Curr. Opin. Biotechnol. 2020, 63, 118–125. [Google Scholar] [CrossRef] [PubMed]
- Hubbard, E.J. Caenorhabditis elegans germ line: a model for stem cell biology. Dev. Dyn. An. Off. Publ. Am. Assoc. Anat. 2007, 236, 3343–3357. [Google Scholar] [CrossRef] [PubMed]
- Kimble, J.; Seidel, H. C. elegans germline stem cells and their niche. In StemBook; Cambridge (MA), 2008. [Google Scholar]
- Kim, S.; Spike, C.; Greenstein, D. Control of oocyte growth and meiotic maturation in Caenorhabditis elegans. Adv. Exp. Med. Biol. 2013, 757, 277–320. [Google Scholar] [CrossRef] [PubMed]
- Brenner, S. The genetics of behaviour. Br. Med. Bull. 1973, 29, 269–271. [Google Scholar] [CrossRef] [PubMed]
- Kitamura, A.; Fujimoto, A.; Kawashima, R.; Lyu, Y.; Sasaki, K.; Hamada, Y.; Moriya, K.; Kurata, A.; Takahashi, K.; Brielmann, R.; et al. Hetero-oligomerization of TDP-43 carboxy-terminal fragments with cellular proteins contributes to proteotoxicity. Commun. Biol. 2024, 7, 743. [Google Scholar] [CrossRef] [PubMed]
- Terpstra, H.M.; Gomez-Sanchez, R.; Veldsink, A.C.; Otto, T.A.; Veenhoff, L.M.; Heinemann, M. PunctaFinder: An algorithm for automated spot detection in fluorescence microscopy images. Mol. Biol. Cell 2024, 35, mr9. [Google Scholar] [CrossRef] [PubMed]
- Kitamura, A.; Shimizu, H.; Kinjo, M. Determination of cytoplasmic optineurin foci sizes using image correlation spectroscopy. J. Biochem. 2018, 164, 223–229. [Google Scholar] [CrossRef] [PubMed]
- Pazdernik, N.; Schedl, T. Introduction to germ cell development in Caenorhabditis elegans. Adv. Exp. Med. Biol. 2013, 757, 1–16. [Google Scholar] [CrossRef] [PubMed]
- Hubbard, E.J.A.; Schedl, T. Biology of the Caenorhabditis elegans Germline Stem Cell System. Genetics 2019, 213, 1145–1188. [Google Scholar] [CrossRef] [PubMed]
Disclaimer/Publisher's Note: The statements, opinions and data contained in all publications are solely those of the individual author(s) and contributor(s) and not of MDPI and/or the editor(s). MDPI and/or the editor(s) disclaim responsibility for any injury to people or property resulting from any ideas, methods, instructions or products referred to in the content. |
Figure 1.
Schematic diagram of the C. elegans gonad. The gonad is covered by sheath cells (nucleus color: cyan). Germ cells are connected to the rachis, a shared cytoplasmic core. Germ cells that have undergone mitosis in the progenitor zone (nucleus color: magenta) move into the meiotic zone and become meiotic germ cells (nucleus color: dark blue). They then become mature oocytes and, passing through the spermatheca, become fertilized eggs that reach the uterus. The orange box indicates a typical region analyzed by image analysis in this study.
Figure 1.
Schematic diagram of the C. elegans gonad. The gonad is covered by sheath cells (nucleus color: cyan). Germ cells are connected to the rachis, a shared cytoplasmic core. Germ cells that have undergone mitosis in the progenitor zone (nucleus color: magenta) move into the meiotic zone and become meiotic germ cells (nucleus color: dark blue). They then become mature oocytes and, passing through the spermatheca, become fertilized eggs that reach the uterus. The orange box indicates a typical region analyzed by image analysis in this study.
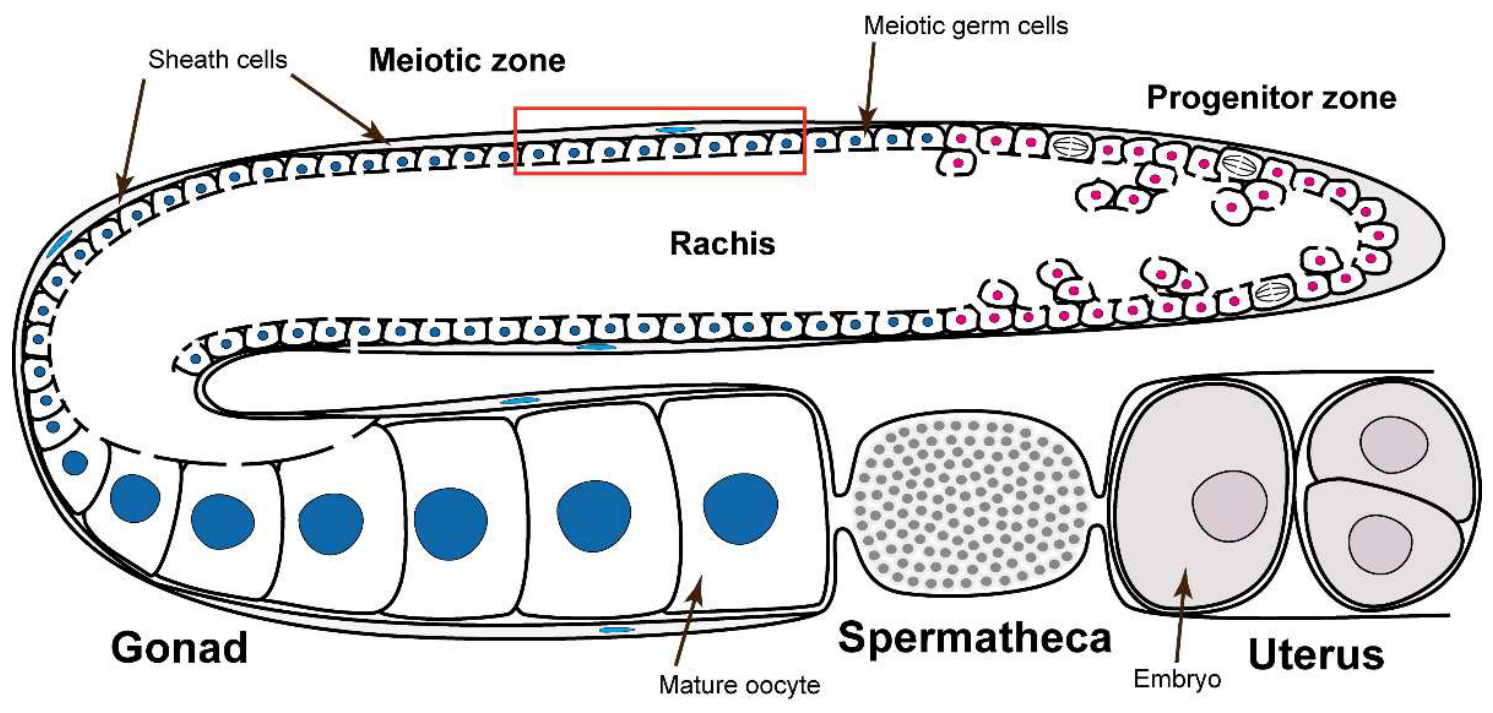
Figure 2.
Overview of the pipeline for CellProfiler analysis. (a) Excitation and emission spectra of DAPI, retrieved from Fluorescence SpectraViewer (Thermo Fisher Scientific). Purple line, the excitation laser wavelength used in this study; cyan shading, the range of emission wavelengths detected in this study. (b) Top: confocal fluorescence microscopy image around the gonad of a DAPI-stained C. elegans (bar = 20 µm). The gray box indicates the region cropped for image analysis.
Figure 2.
Overview of the pipeline for CellProfiler analysis. (a) Excitation and emission spectra of DAPI, retrieved from Fluorescence SpectraViewer (Thermo Fisher Scientific). Purple line, the excitation laser wavelength used in this study; cyan shading, the range of emission wavelengths detected in this study. (b) Top: confocal fluorescence microscopy image around the gonad of a DAPI-stained C. elegans (bar = 20 µm). The gray box indicates the region cropped for image analysis.
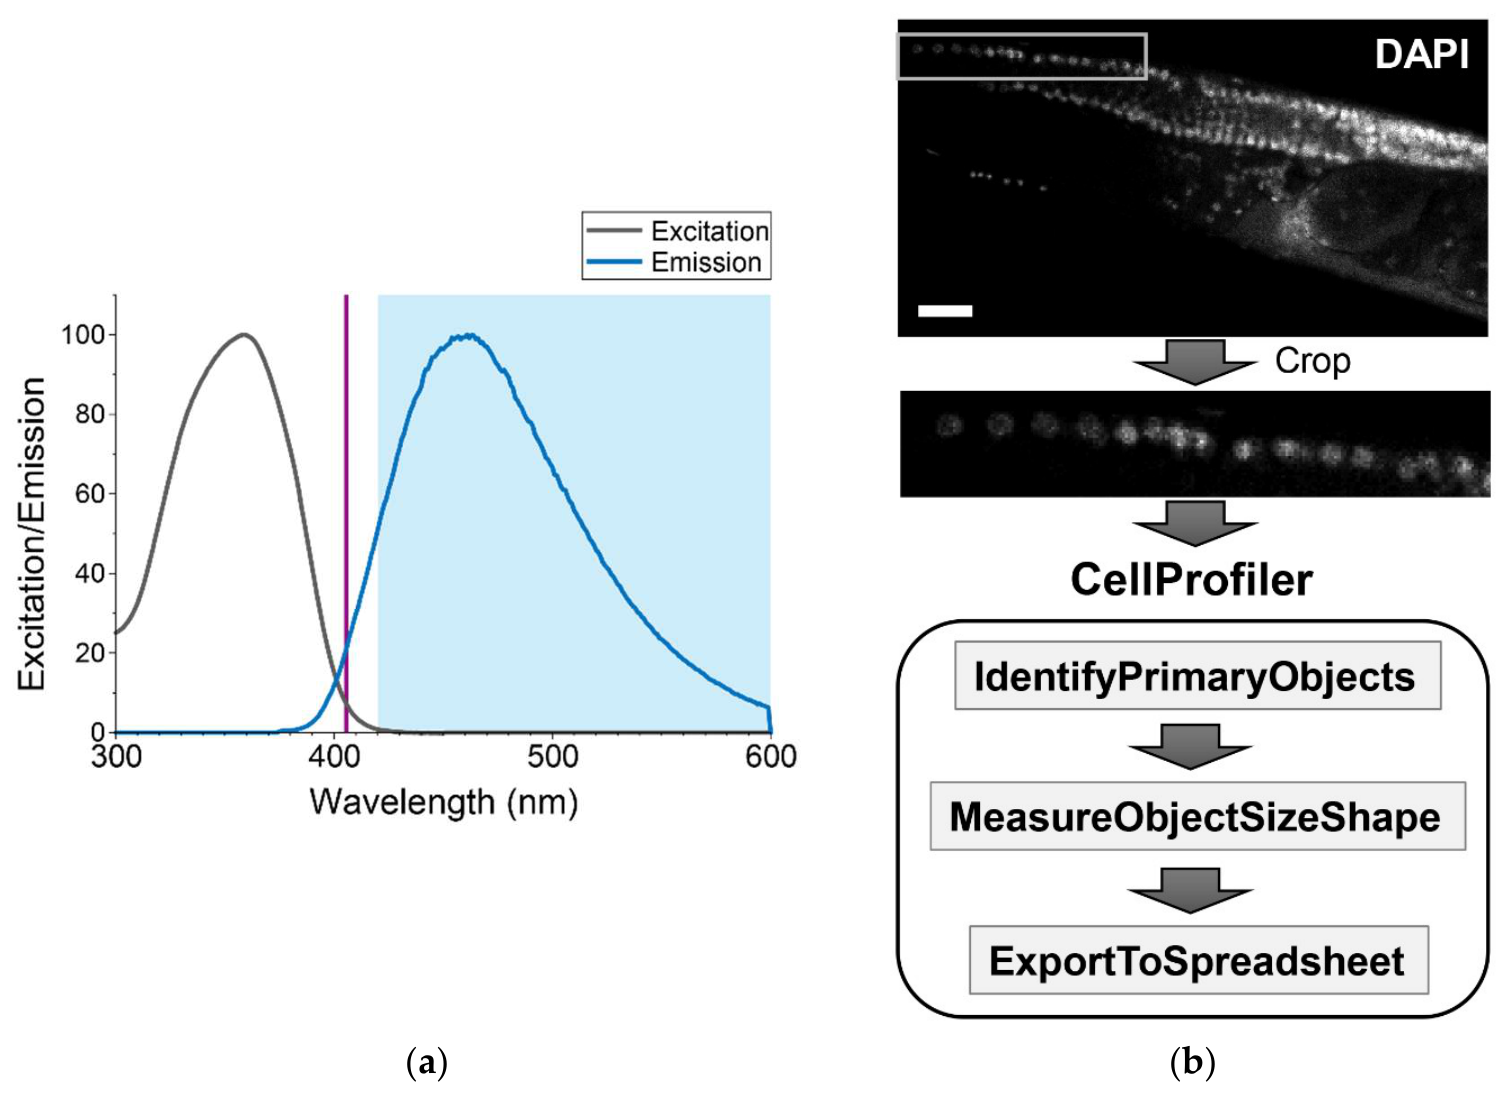
Figure 3.
Figure 3. Measurement of DAPI-stained images of C. elegans germ cells by CellProfiler. (a) Original DAPI-stained image used for the examination. (b–f) Examples of objects recognized by the IdentifyPrimaryObjects module of CellProfiler. Green lines, correct recognition; orange lines, multiple objects recognized as connected; magenta lines, incorrect recognition. (g) Inter-nuclear centroid distance (Distance) and nuclear area (Area) measured after correcting the false recognitions of the recognized objects. The numbers in the microscopy image correspond to the Object # in the table below. The cyan arrowhead indicates a sheath-cell nucleus, which was excluded from this analysis. Bar, 5 µm.
Figure 3.
Figure 3. Measurement of DAPI-stained images of C. elegans germ cells by CellProfiler. (a) Original DAPI-stained image used for the examination. (b–f) Examples of objects recognized by the IdentifyPrimaryObjects module of CellProfiler. Green lines, correct recognition; orange lines, multiple objects recognized as connected; magenta lines, incorrect recognition. (g) Inter-nuclear centroid distance (Distance) and nuclear area (Area) measured after correcting the false recognitions of the recognized objects. The numbers in the microscopy image correspond to the Object # in the table below. The cyan arrowhead indicates a sheath-cell nucleus, which was excluded from this analysis. Bar, 5 µm.
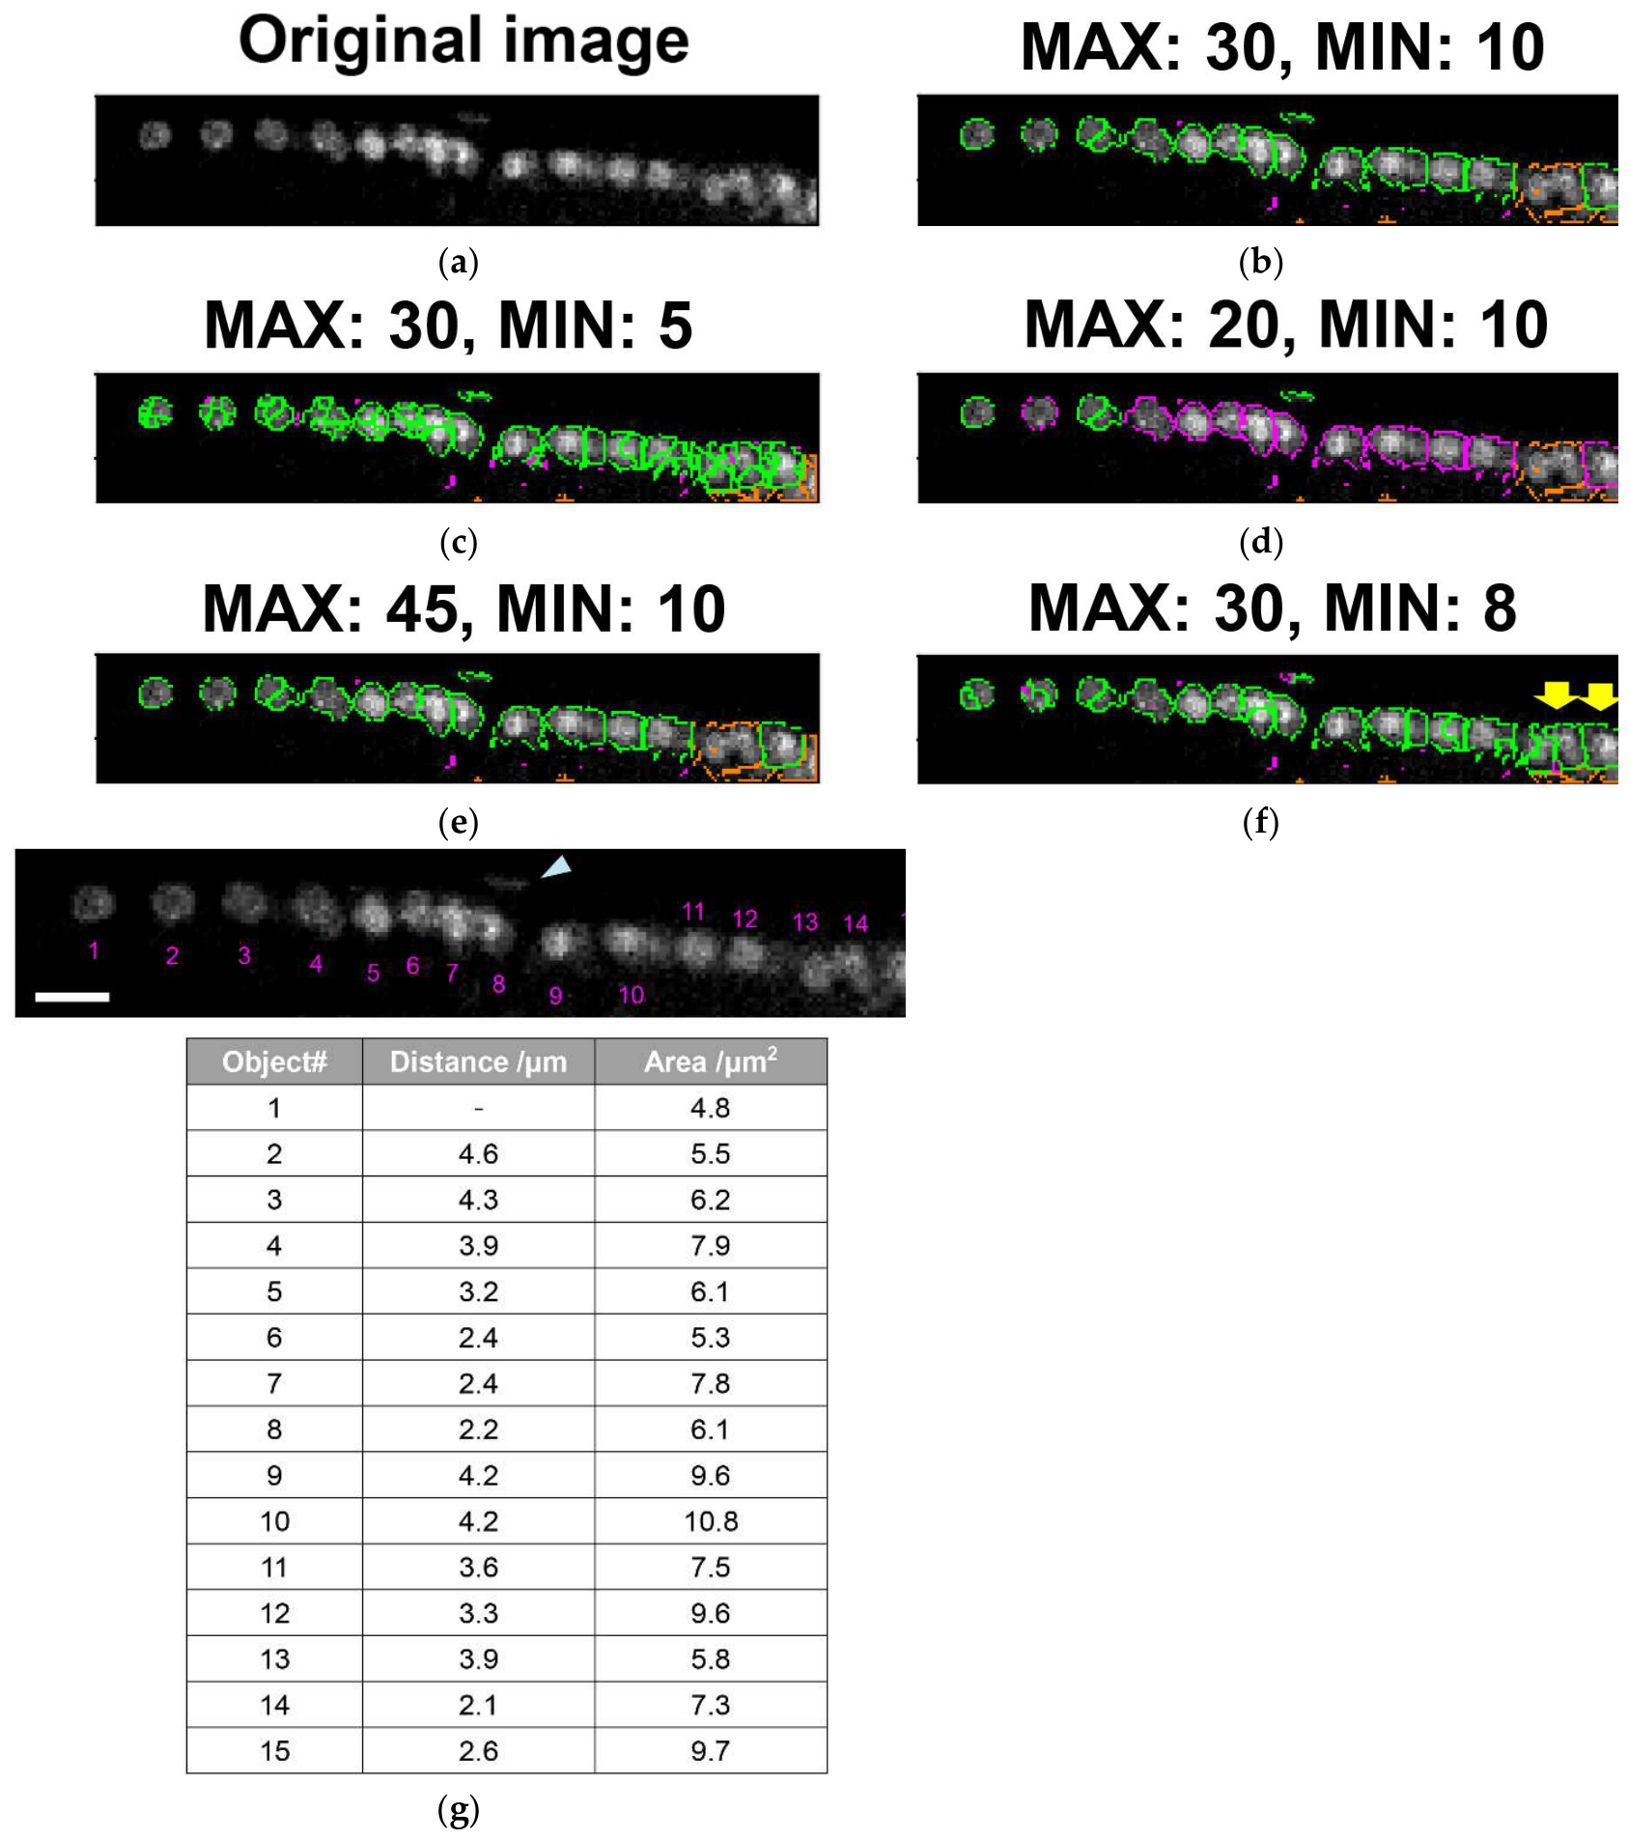
Figure 4.
Comparison of the nuclear area of meiotic germ cells at the L4 stage and on adult days 1 and 3. Three animals were measured for each group. For each animal, two fields of view were independently selected and used as images for analysis. Each data point corresponds to an individual germ-cell nucleus (L4: 89, day 1: 101, day 3: 103). Open squares indicate the mean, and the line indicates the median. A fitted gamma distribution is overlaid. P values from one-way ANOVA with Tukey's test between groups are shown.
Figure 4.
Comparison of the nuclear area of meiotic germ cells at the L4 stage and on adult days 1 and 3. Three animals were measured for each group. For each animal, two fields of view were independently selected and used as images for analysis. Each data point corresponds to an individual germ-cell nucleus (L4: 89, day 1: 101, day 3: 103). Open squares indicate the mean, and the line indicates the median. A fitted gamma distribution is overlaid. P values from one-way ANOVA with Tukey's test between groups are shown.
Disclaimer/Publisher’s Note: The statements, opinions and data contained in all publications are solely those of the individual author(s) and contributor(s) and not of MDPI and/or the editor(s). MDPI and/or the editor(s) disclaim responsibility for any injury to people or property resulting from any ideas, methods, instructions or products referred to in the content. |
© 2026 by the authors. Licensee MDPI, Basel, Switzerland. This article is an open access article distributed under the terms and conditions of the Creative Commons Attribution (CC BY) license (http://creativecommons.org/licenses/by/4.0/).
Copyright: This open access article is published under a Creative Commons CC BY 4.0 license, which permit the free download, distribution, and reuse, provided that the author and preprint are cited in any reuse.