

Submitted:
05 August 2026
Posted:
06 August 2026
You are already at the latest version
Abstract
We present an extension of our study on the discovery of useful journal-to-journal associations from bibliography data. Association Rule Mining (ARM) is applied under the market basket analysis (MBA) paradigm: cited journals are treated as "items" within an article’s "transaction", and the traditional market basket model is enhanced with a numerical dimension, namely the weight of referencing (WoR): the percentage of an article’s references to journals that target a given journal. The predictive ability of the ARM output is enhanced by ranking the rules by means of a Skyline operator that integrates the interdependence of the numerical variables involved (Spearman’s rho) with the ARM conviction interestingness measure. The approach is evaluated against a standard ARM-only implementation on the bibliographic record of the Hellenic Academic Libraries Link (HEAL-Link) consortium, and the enhanced results are integrated into the publicly available HEAL-Link J2J-GR web service (https://j2j.heal-link.gr/j2javis/).
Keywords:
bibliographic data analysis
; journal to journal associations
; association rule mining
; Skyline Numerical Association Rule Mining
1. Introduction
The Hellenic Academic Libraries Link (HEAL-Link) consortium comprises the microcosm within which the present study is conducted. HEAL-Link plans and manages the journal subscriptions of the Greek academic and research institutions, and the usage its member community makes of the subscribed scholarly journals is registered, in a durable and machine-readable form, in the bibliographies of the publications the community itself produces. The academics and researchers who (co-)author scholarly publications while affiliated with a Greek academic/research institution comprise the Target Authors Group (TAG) of the consortium; every reference a TAG-authored article makes to an article published with a given journal constitutes one recorded unit of usage of the latter. In this respect, the bibliography sections of the TAG publications comprise a usage dataset native to the consortium: it registers which journals the community actually draws upon, at what intensity, and in what combinations.
An earlier stage of this research established the value of that dataset for subscription decision support. Citation analysis and data visualization were conducted on the research bibliography titles referenced by the TAG: first over nearly 63,000 publications of the 2010 to 2018 period [1], and subsequently over nearly 93,000 publications of the 2010 to 2020 period [2]. Both studies reveal and visualize journal-to-journal (J2J) associations as the latter are shaped by the references TAG (co-)authored works make. The two studies deliver the J2J-GR (Journal-to-Journal references by Greek Researchers) web service, which renders the latter associations by means of interactive network graphs and subject-category charts; its components are reviewed in Section 2. The information such associations provide is of direct operational use: a journal that is heavily and persistently referenced by the TAG represents an asset for HEAL-Link, and the visualized association context of a journal facilitates the decision to acquire, retain, or discontinue the corresponding subscription.
The associations revealed at that stage are, however, exploratory (descriptive) in nature: they register and count the references and citations exchanged between journals, yet no association carries implication semantics, namely no association states that the referencing of journal A favors the referencing of journal B. A need therefore arises for directed J2J associations of the (antecedent, consequent) type, read as "articles that reference journal A tend to also reference journal B", where the two roles are not interchangeable. Directed associations answer questions the exploratory analysis cannot pose: which journals act as gateways to which others, whether a rarely-cited journal consistently accompanies the flagship journal of its field, and which journals bridge across disciplines. Pispiringas et al. [2] name the identification and exploitation of causal associations between scholarly journals as the next goal of the research; the present work carries it out.
The goal of the research reported herewith is the application of ARM analysis to the (numeric type) bibliographic data of HEAL-Link, in order to identify useful information concerning directed associations of scholarly journals in relation to how the latter are used by the research community of the consortium, namely the TAG. The conventional (binary) market basket model is enhanced with a numerical dimension, and the discovered rules are ranked by means of a Skyline-based technique that recovers part of the information the standard ARM workflow discards. In the following, we will be using the terms association and rule interchangeably.
The remainder of the paper is structured as follows. Section 2 comprises a brief review of the relevant literature, namely the analytical processing of bibliographic data, ARM analysis in general, and ARM analysis on numeric data. In Section 3 we present the modeling of the bibliographic data under the market basket paradigm, the weight of referencing (WoR) innovation, the Skyline-enhanced rule ranking, and the Postulate that guides the interpretation of the output. Section 4 describes the harvesting, organization, and preparation of the bibliographic data, and Section 5 discusses the discretization filters and the role Spearman’s plays in association ranking. Section 6 registers the data volumes and the software used, and describes the user interface of J2JAVis, the Shiny (R) Web application that embodies the approach. Section 7 reports the results obtained for indicative parameter settings and discusses the latter in the light of the Postulate. Finally, in Section 8 we comment on the current stage of the research and identify its next steps.
2. Related Work
Established bibliometric practice rates a scholarly journal on the basis of the citations it receives, which translate directly to its impact in the advancement of research [2]. The instruments of that practice are global by construction, building on the two subscription-based citation databases (Web of Science1, Scopus2) and on the evaluation tools derived from them, namely InCites by Clarivate3, which benchmarks institutional productivity against peer institutions, and the SCImago Journal & Country Rank by SCImago Lab4, a portal of journal and country indicators drawn from Scopus. The supporting tradition is science mapping, namely the construction of bibliometric maps of how disciplines and research fields are conceptually, intellectually, and socially structured [3], realized by means of citation, co-citation, and bibliographic-coupling networks [4,5,6]. Co-citation itself, namely the tendency of two documents to be cited together, dates to Small [7] and remains the relational primitive of the field. Symmetric journal-relatedness measures belong to the same family: Pudovkin and Garfield [8] compute a relatedness factor from aggregated journal citation data to locate the journals semantically closest to a starting journal, a measure that, like co-citation, is commutative by construction. Throughout this tradition, the unit of value is the journal’s standing in the global scientific record.
The J2J-GR approach of Pispiringas et al. [1,2] breaks with the global frame deliberately: a journal’s value is considered not in the context of the global academic community but in that of the microcosm of a libraries consortium. The comparative pattern is common to both studies: the more references the TAG makes to articles published with a given journal, the higher the value of the latter as a source of scientific information. Pispiringas et al. [2] additionally formalize the TAG construct, widen the corpus from nearly 63,000 publications (2010 to 2018) to nearly 93,000 (2010 to 2020), and report a discoverable-reference match rate of 83.29%.
The associations revealed comprise exploratory data analysis results over the references the TAG works make: Pispiringas et al. [1] generate interactive network graphs of the references made by TAG (co-)authored articles published with a chosen central node journal, and Pispiringas et al. [2] extend the service with (a) the interactive citations network graph, of the fan-in type, complementing the fan-out references graph, (b) cited-by/references bar charts grouped by subject category under the ASJC (All Science Journal Classification) schema, namely the journal subject classification of the Scopus database, and (c) co-cited journals lollipop charts, the latter registering, per journal pair, a frequency/probability of joint occurrence in TAG (co-)authored works, with co-citation defined after Small [7]. The same charts carry a first indication of journal interdisciplinarity: The Lancet journal, for instance, is registered to cover a single ASJC category ("Medicine"), yet its bar charts reveal references and citations exchanged with works across further subject categories [2].
These are genuine results, yet descriptive ones: counts and joint-occurrence frequencies reveal nothing of implication, namely of whether the referencing of one journal favors the referencing of the other; Pispiringas et al. [2] mark this ceiling themselves, naming the identification and exploitation of causal associations between scholarly journals as their next goal.
The J2J-GR approach is not the only one that treats journal value as a community-bound, data-informed quantity. Studies on consortial collection management generally fall into two categories: those focusing on daily operations, and those forecasting future needs. On the operational side, facing the cost of the bundled subscription (the "Big Deal"), the sixty (60) SUNY libraries restructured their Elsevier ScienceDirect package into a curated title list [9]. The latter was assessed over three years by means of multiple usage and access indicators, the reported verdict being that continual yearly review proved less sustainable than the stability of the curated package itself. In an Iranian consortium, the method of access to a cited journal is linked both to the quality quartile of that journal and to the average citations it receives [10]. On the predictive side, Coughlin and Jansen [11] model full-text downloads across 1,510 journals from a split of global (impact factor, Eigenfactor) and local (local citation counts) metrics. The two classes combined comprise the strongest model, outperforming the global metrics alone. Evidently, a community-local signal carries evaluative information the global record does not.
What this literature lacks is the relational object: it evaluates journals one at a time against usage or cost, whereas the J2J-GR approach evaluates a journal through its associations with other journals.
To the best of our knowledge, the journal-to-journal question in the consortial setting has not been revisited in the published literature since Pispiringas et al. [2]; subsequent consortial studies examine the correlation between downloads and citations at the journal level, with mixed results [12,13], rather than mine directed journal-to-journal associations. In this respect, the causal-mining extension announced in the former has stood as an open agenda item, one the present work takes up.
Association Rule Mining (ARM) supplies the required directed object. ARM algorithms, namely Apriori [14], Eclat [15], FP-Growth [16], and others, enjoy wide applicability and extract information in the form of association rules, denoted as X → Y, each rule involving antecedent (left hand side, LHS) and consequent (right hand side, RHS) components. The interestingness of a discovered rule is quantified by means of dedicated measures, the standard ones being support, confidence, lift, and conviction. Their characteristics differ materially with respect to the ranking of the discovered rules. Support and confidence cannot exclude rules whose LHS and RHS are frequent yet statistically independent; lift (like support) is commutative, therefore insufficient for determining the direction of the association (causality). Conviction [17] is free of both drawbacks, which renders it the measure of choice when the objective is to rank rules by the strength of the directed implication they express. That no single measure is optimal across domains is a standing conclusion of the relevant survey literature [18,19], so the selection of conviction for the present domain is a domain-informed decision, not a default.
ARM analysis on numeric data faces an additional obstacle. ARM operates on categorical data, so a numeric variable must undergo a discretization stage against a threshold before mining, and the discretization stage obscures information relating to the interdependence of the numeric variables involved [20]. Consequently, a ranking that consults conviction alone may order two rules in the opposite direction to the one their original numeric values justify; Kelesidis et al. [20] demonstrate the inversion on a worked example. The lineage of this problem runs from Quantitative ARM [21] to the now more common Numerical ARM (NARM). The systematic surveys of the NARM area sort its methods into families: Kaushik et al. [22] into Discretization, Optimization, and Statistical, and the earlier meta-study of thirty (30) algorithms into Discretization, Distribution, and Optimization [23]; both flag discretization-induced information loss as a limitation attaching to the Discretization family. That the selection of an interestingness measure itself remains open is attested by the foundational survey of Geng and Hamilton [18], which catalogues the objective, subjective, and semantics-based measures and the strategies for choosing among them, and by the most recent survey [19], which tabulates the strengths, limitations, and domains of applicability of each measure. The point is demonstrated empirically by a behavior-based clustering of sixty-one (61) measures over one hundred and ten (110) datasets: equivalences are proven within the resulting clusters, yet the differences among the clusters persist, confirming that domain knowledge is essential to selecting a measure for a particular task [24].
A remedy to the discretization loss is introduced in Kelesidis et al. [20] in the form of a technique code-named SNARM (Skyline Numerical ARM). SNARM operates in an effort to recover part of the information lost during the discretization stage. This is done by combining ARM’s conviction, which quantifies the causal strength of a rule, with Spearman’s rho (), which quantifies the interdependence of the numeric variables involved, and using the two as a two-dimensional input to the Skyline operator [25]. The Skyline output is used to rank the association rules as follows: the rules are organized into Skyline levels, each level dominating those below it, and are ranked first by level and then within each level. This two-tier scheme (a non-dominance partition refined by a within-level scoring order) instantiates, for rule ranking, the reconciliation of skyline and ranking queries that Ciaccia and Martinenghi [26] develop formally. SNARM comes in two (2) variants, SNARM-c and SNARM-s, where "-c" and "-s" signify the within-level ordering ("-c" by conviction then ; "-s" the reverse); the values are computed on the original numeric dataset, not on its discretized form. It is noted that, to date, the two SNARM variants have been compared against the ARM-only setup solely with respect to the predictive ability of the rules each ranks in the top positions; on the two real numeric datasets of that evaluation, both variants consistently outperform the ARM-only baseline [20]. Kelesidis et al. [20] further identify journal-to-journal associations as one of the future stages of SNARM applicability.
The discovered rules inform subscription decisions only through the form in which they are presented to the analyst, so the visualization of the ARM output comprises part of the problem. On the presentation side, Fister et al. [27] review the visualization methods available for ARM output and observe an interactivity divide: popular implementations of the traditional methods already offer interactive tools (hover, zoom, drill-down), whereas the newer generation of methods usually lacks them, its future development being tied to (a) restored interactivity and (b) independence from the attribute types. In this respect, the present work sits on the favorable side of the divide: SNARM belongs to the newer generation of numerical ARM techniques, and its output is delivered through the interactive interface the J2J-GR service of Pispiringas et al. [2] already supplies, which the present work reuses.
In summary, the reviewed literature leaves the following open: (a) the community-bound evaluation work has not treated the numeric dimension native to citation data as a numeric variable, (b) the causal-mining extension announced in Pispiringas et al. [2] was identified to comprise a research objective and has remained open to date, and (c) Kelesidis et al. [20] name the journals application of SNARM as a future stage without executing it. The present work takes up all three: it applies SNARM to the HEAL-Link bibliographic data and integrates the result into the existing J2J-GR service.
3. Methodology
The present study applies the SNARM technique of Kelesidis et al. [20] to the bibliographic data of the HEAL-Link consortium, under a quantitative, data-driven, comparative approach: the association rules that comprise the ARM output are ranked for interestingness in accordance with the ARM-only (i.e., by conviction) and the two SNARM variants [20]. The three approaches are evaluated on how effectively they promote interesting journal-to-journal associations to top rank positions.
The bibliographic data are modeled under the market basket analysis (MBA) paradigm as follows: each article comprises one "transaction" and each journal referenced by the article comprises an "item purchased" by the transaction in question. The numeric dimension of the model registers, for each (article, journal) pair, the number of articles published with the given journal cited by the article in question.
In addition to conducting Skyline Numerical ARM (SNARM) analysis on bibliographic data, the present study contributes to the introduction of the Weight of Referencing (WoR) measure.
Definition.For a given (article_id, journal) pair, Weight of Referencing (WoR) is defined as the percentage of journal article references article_id makes that relate to the journal in question.
Whereas the raw reference count registers absolute intensity, WoR quantifies the intensity of each journal reference relative to all journal references in the article. The rationale is one of normalization: articles differ widely in bibliography length, and a journal receiving, for example, five references within a twenty-reference bibliography weighs more, as a source of the citing article, than five references within a two-hundred-reference bibliography. WoR renders the (article, journal) values comparable across articles. As detailed below, this measure is used to calculate the statistical correlation between the antecedent and consequent parts of the journal-to-journal associations.
Association rules of length two are extracted in the output of the ARM analysis, each rule of the X → Y type involving one antecedent (LHS) journal and one consequent (RHS) journal. The restriction is deliberate: the object of the study is the pairwise association between co-cited journals. Each association involves exactly two journals, and association rules of greater length lie outside the scope of the present work. The discovered rules are then ranked under three setups: ARM-only (namely, ranking by conviction only), comprising the classical baseline, and two SNARM variants. In SNARM, the (conviction, ) pair of each rule is supplied to the Skyline operator, the rules are ordered by Skyline level, and by conviction and within each level. In SNARM-c, within-level ordering is prioritized first by conviction and secondarily by , whereas SNARM-s reverses this priority.
The rationale rests on a known limitation of the ARM-only approach: the data discretization stage obscures information relating to the interdependence of the numeric variables involved, and conviction only quantifies the cause and effect relationship of the antecedent and consequent parts of an association. It does not quantify the influence that an increase in the antecedent’s value has on the value of the consequent, and vice versa (namely, the correlation of the numeric variables involved). Spearman’s quantifies this type of numeric interdependence. The value of each rule is calculated on the original (pre-discretized) WoR values of the same dataset.
An additional contribution of this study is the evaluation of the ranked output based on the following postulate:
Postulate.Journal-to-journal associations featuring highly-cited journals in the antecedent and rarely-cited journals in the consequent tend to be of a higher information value.
The reasoning is as follows. Directed associations whose consequent is a heavily cited journal largely restate what the consortium already knows: flagship journals are highly-cited and their subscriptions are not in question. An association that points, instead, towards a rarely-cited journal reveals usage the aggregate citation counts conceal, namely that the journal participates, in a directed and systematic manner, in the referencing behavior of the community; precisely the journals for which the subscription decision is non-obvious. The Postulate accordingly directs the analysis towards the rules that involve journals of low popularity.
All analysis operates on the WoR-adjusted numeric data throughout: the ARM stage uses the WoR values to discretize each (article, journal) pair to 0/1, and the SNARM variants use the same WoR values to compute the of each rule. The ARM analysis is conducted under two discretization scenarios: (a) threshold-free (threshold "0.0", whereby every (article, journal) pair with a nonzero WoR value is mapped to 1), and (b) thresholded, whereby a minimum WoR share is required, with Section 7 comparing the two scenarios.
Under each scenario, the three ranking configurations are compared by means of descriptive measures:
- 1.
- the count of flagged rules present in the Top-20 and Top-50 positions of each ranking,
- 2.
- the rank promotions individual rules receive when moving from the ARM-only to a SNARM ordering, and,
- 3.
- head-to-head counts of which SNARM variant ranks each flagged rule higher.
The process is repeated across the discretization parameter settings of Section 4, and the exact parameter values used are stated together with every reported result. The choice of any single discretization threshold is subject to discussion; the thresholded scenario is therefore run at two settings ("0" and "0.02") and support is varied across two settings ("0.0005" and "0.0002"), and the corresponding sensitivity results are reported in Section 7.
4. Data Preparation
Bibliographic metadata were collected for research publications involving at least one (co-)author affiliated to a Greek academic/research institution. The latter comprise the TAG of the HEAL-Link consortium. In the early stages of this study, publication metadata were retrieved from two services, namely Scopus and the Crossref5 REST API6, the former a subscription-based bibliographic index whose coverage is bounded by a proprietary, curated source list. For the present study Crossref was retained, Scopus was replaced by the OpenAIRE Graph7, and the entire dataset was re-created on this basis, covering publication years 2010 to 2025. The OpenAIRE Graph [28] is an open aggregation of scholarly metadata and links harvested from approximately 155,000 trusted data sources (publication repositories, data archives, and aggregators), and it affords broader, openly-licensed coverage of the literature authored at the Greek institutions than the proprietary index it replaces. Crossref, queried by means of its REST API as before, is used to enrich each harvested record and to resolve its reference list.
Metadata harvesting was conducted by a purpose-built, three-stage pipeline. In the first stage, publication records were harvested from the OpenAIRE Graph API, filtered by record type (publication), country of author affiliation, peer-review status, and publication date range. In the second stage, the harvested records were enriched via the Crossref REST API and the Crossref reference lists were aggregated into each record. In the third stage, each record’s reference list was parsed and Crossref metadata were retrieved per referenced DOI, producing one output record per (article, referenced article) pair, including the referenced journal’s title and its ISSN numbers. Post-processing comprised (a) deduplication on the combined value of (article identifier, normalized DOI), retaining the record with the richest set of metadata, and (b) a re-enrichment pass for records with missing ISSN values. The collection is organized in the PostgreSQL RDBMS, and each journal is coupled with its subject categories under the ASJC (All Science Journal Classification) schema. The second classification level is adopted, which comprises 27 subject categories. From a total of 155,843 publications 5,114,580 journal references were extracted, namely the references resolving to an identified journal, involving 24,022 distinct journals. The latter comprise 82.44% of the references harvested, a rate comparable to the 83.29% discoverable-reference match rate reported for the earlier collection [2].
Next, the dataset to be analyzed is extracted from the collection created. For each (article, referenced journal, reference year) triplet, the total number of references is registered. A first, fixed, cleansing filter removes self-citations (references from a journal to itself) and records with missing journal identifiers. For example, assuming that article 34 was published in 2025, the corresponding triplets look like this: (34, A, 2010):4, (34, A, 2021):1, (34, A, 2022):2, (34, B, 2013):1, (34, B, 2023):1, (34, C, 2024):6. A through C denote the referenced journals for the specific years. The number following each triplet denotes the number of references to the given journal in the given year from article 34.
A second, selectable, filter restricts the analysis to a chosen data section: in the default configuration, articles published in 2024 to 2025 with references falling within a five-year range preceding each article. Records are then aggregated to one row per (article, journal) pair and a WoR value. To continue the previous example, the default configuration keeps the records pertaining to article 34 since it was published in 2025 and the five-year range discards records (34, A, 2010):4 and (34, B, 2013):1 since the publishing years are out of range. Finally, the resulting (article, journal) pairs with the computed WoR are: (34, A):3/10, (34, B):1/10 and (34, C):6/10.
The default data section yields 261,372 such pairs. A second data section (article years 2020 to 2025) is used to verify the stability of the findings, and the entire dataset is retained as a complementary setting.
In addition to the analysis dataset, every journal in the collection is assigned a popularity level. Journal popularity is defined as the total number of references the journal has received over the entire dataset, namely the sum of its per-reference-year reference counts across every citing article (all article years). The measure is descriptive, so it is computed on the references-received counts directly, dropping only records with a NULL journal identifier and retaining all references (self-citations included); it is computed over the entire dataset rather than the analysis data section defined above. A data section-dependent journal popularity measure would shift whenever the analysis data section changes, combining the descriptive labeling of journals with the mining configuration; the entire-dataset count retains the levels stable and independent of the rules they are used to characterize.
The popularity values are binned into four (4) levels. The binning is by magnitude, not by rank, and the cut points are chosen on a logarithmic scale, for two reasons. First, equal-width binning on the raw reference counts is degenerate: the counts span five orders of magnitude (from single references up to 46,610 for the most-cited journal), so a linear partition assigns nearly all journals (99.8%) to the lowest bin. Second, equal-count (quantile) binning was rejected because it severs the level from any absolute notion of how cited a journal is: a level would then encode a journal’s rank, not its magnitude. The three inner cut points are set to "10", "100", and "5,000" references, producing four levels:
- 1.
- Level 1 (L1), the least-referenced journals (up to 10 references), comprising 9,096 journals,
- 2.
- Level 2 (L2), 10 to 100 references, comprising 8,240 journals,
- 3.
- Level 3 (L3), 100 to 5,000 references, comprising 6,486 journals, and
- 4.
- Level 4 (L4), the elite tier with above 5,000 references (range 5,010 to 46,610), comprising 133 journals.
The first two levels are the populous ones, while L4 isolates a small, clearly-demarcated elite; the latter a deliberate effect of raising the top cut to "5,000" (at "1,000" the elite tier would instead admit 1,247 journals).
As explained in detail in Section 5, prior to mining, the (article, journal) pairs of the selected data section are discretized into a binary transactions representation: pairs with a rating equal to or greater than the discretization threshold are mapped to 1, and the rest to 0. The substantive threshold is set to "0.02", requiring a journal to account for at least 2% of an article’s references; one additional setting, "0" (every reference counts) is used for sensitivity analysis.
5. Discretization and Numeric Interdependence
The association rule mining (ARM) stage operates on transactions and items: a transaction comprises one article, and an item comprises a journal referenced by the latter. The weight attached to each item is the WoR, namely the reference share of the article to the journal, and can be used during the discretization phase that determines the itemsets. The reference shares (sum of referenced journal WoRs) of each article add up to 1. A low-share reference is accordingly one for which the WoR is small, namely a journal that accounts for only a small fraction of the references of the article; in the limiting case the journal receives a single reference from the article.
The importance of retaining numeric interdependence is best illustrated by means of an example. Table 1 lists a compact excerpt of eight (8) articles (A1 to A8) and twelve (12) journals (J1 to J12) in the three representations the pipeline produces: the original Numeric (WoR) representation, the Discretized representation at threshold "0.02", and the MBA model (transaction itemsets) representation. Not every article references every journal (a dash denotes a journal the article does not reference), and the WoR values of each article sum to 1 across the journals the latter references. Journal self-citations have also been removed, i.e., assuming article A1 has been published in journal J1, references of A1 to articles in J1 are excluded. We assume that all articles belong to the chosen analysis data section and the table computes (article, journal) WoRs for the chosen year range (e.g., up to five years before the publication year of a given article). For the purpose of the illustration, let J1 denote an elite, highly-cited journal, J2 another highly-cited journal of the same field, and J5 a rarely-cited journal.
Discretization maps each WoR share to 1 when the latter clears the threshold "0.02" and to 0 otherwise, whereupon a low-share reference is dropped: the reference of A8 to J3 (WoR = "0.012", namely 1.2% of the in-window references of the article) falls below the bar and is mapped to 0, so that J3 does not enter the itemset of A8. ARM analysis is conducted on the MBA model representation and produces rules of the X → Y type, whose implication strength is quantified by the conviction measure. For the two associations J2 → J1 and J5 → J1 the conviction is identical (1.88 for each, at support="0.625" and confidence="0.8"): on the discretized representation alone the latter are indistinguishable.
The interdependence that separates the two associations is present only in the Numeric (WoR) representation. Spearman’s rho (), computed on the WoR shares across the articles co-citing each pair, amounts to = "0.95" for J5 → J1, where the two shares rise and fall together, against = "0.20" for J2 → J1, where they do not, namely exactly the numeric interdependence that discretization discards.
SNARM (Skyline Numerical ARM) recovers the latter by combining conviction with as a two-parameter (2D) input to a Skyline operator, so that the association carrying the genuinely higher proportional interdependence (J5 → J1) is promoted above the one that merely co-occurs (J2 → J1), which conviction ranks equally. This motivates the two SNARM approaches evaluated throughout this section, namely SNARM-s and SNARM-c, where "-s" and "-c" signify that the ordering within each Skyline level is -primary and conviction-primary, respectively.
The discretization stage retains an item only when its WoR clears a threshold, and two threshold settings are considered in turn. Both are threshold settings, differing only in the bar they impose: the threshold-free setting adopts threshold "0", whereby every journal with a nonzero WoR becomes an item (every reference is admitted, including the low-share ones); the thresholded setting adopts threshold "0.02", whereby a journal is retained only when it amounts to at least 2% of the in-window references of the article to journals. We begin with the threshold-free setting, since it is the one that broadens the discovery net.
6. Testbed and Implementation Environment
The principal data files of the study comprise: (a) the references CSV produced by the harvesting pipeline (647.1 MB, 5,114,580 rows), (b) the analysis dataset of the default data section (261,372 (article, journal) pairs), (c) the entire-collection transactions set (155,801 transactions), and (d) the journal popularity table (24,022 journals).
On the software side, the harvesting pipeline is implemented as a Spring Boot (Java) application; the collection is organized in the PostgreSQL RDBMS; and all analysis processing is implemented in R. The analysis engine and its visual front end comprise a Web application code-named J2JAVis (Journal-to-Journal Associations Visualization), developed with the R Shiny framework. For the J2J domain, J2JAVis implements the SNARM technique of Kelesidis et al. [20], under the market basket reading of citation data established in Section 3; a first version of the application is integrated in the HEAL-Link J2J-GR service which is publicly available at https://j2j.heal-link.gr/j2javis/. J2JAVis has not been developed from scratch: it reuses, by design, the user interface and the software libraries of the J2J-GR web service [2], itself an extension of the J2J-GR prototype [1].
The service operates on the analysis dataset and the journal popularity levels defined in Section 4; these are not re-derived here. The control panel (Figure 1) separates the mining parameters, which require a "Run Analysis" (marked "9" in Figure 1), from the live display filters. The mining parameters comprise: the analysis data section, namely the article years range (marked "1" in Figure 1) and the reference window (marked "2" in Figure 1); the ranking, ARM-only / SNARM-c / SNARM-s (marked "3" in Figure 1); the discretization threshold on WoR (marked "5" in Figure 1); and the Apriori run, namely maxlen (marked "4" in Figure 1), support (marked "6" in Figure 1), confidence (marked "7" in Figure 1), and the minimum-conviction floor (marked "8" in Figure 1). The display filters comprise: Top-N, namely how many top-ranked rules to draw, up to fifty (50) (marked "10" in Figure 1); an isolate-a-journal control that restricts the view to a single journal as antecedent (outbound, LHS), as consequent (inbound, RHS), or either (marked "11" in Figure 1); a subject-category filter, same / different second-level ASJC (marked "12" in Figure 1); and a popularity-flow filter that restricts the view by the direction of the rules across the popularity levels (marked "13" in Figure 1). Each rule is rendered as X → Y, read as "articles that cite the antecedent journal (LHS) tend, in proportion, to also cite the consequent journal (RHS)".
The principal output is an interactive directed graph, in which nodes are journals of uniform size and shape (circles), and edges are the mined rules, drawn from antecedent (LHS) to consequent (RHS). The encodings comprise: (a) the arrow label is the rule’s rank, namely its position in the active ordering; (b) the arrow thickness is proportional to the rule’s confidence, uniformly across the three (3) rankings, rescaled across the rules displayed; (c) the arrow colour encodes the subject relation between the two journals, namely green when the latter share at least one second-level ASJC category (same ASJC), red when they share none (different ASJC, comprising a cross-field, interdisciplinary bridge), and grey when the relation is undetermined; and (d) the node colour encodes the journal’s popularity level, by means of a fading ramp running from pale (L1, the least referenced) to deep blue (L4, the elite tier), with the levels defined in Section 4.
Hovering a node reveals the journal name, its entire-dataset total references received, its popularity level, and its ASJC subject categories; hovering an arrow reveals the rule together with its subject relation, conviction, Spearman’s , support, and confidence. Two display conventions apply to the latter values: an infinite conviction (namely, a rule of confidence equal to one) is rendered as "Infinite", and an undefined (namely, a zero-variance pair) is rendered as "n/a", the latter arising only under the threshold-free scenario and leaving the Skyline ordering complete.
The graph title (marked "14" in Figure 2) reports the parameter values of the run that produced the displayed rules, namely a snapshot captured at each Run, so that the title cannot disagree with the graph; the legend (marked "15" in Figure 2) restates the encodings, namely those exemplified by the node (marked "16" in Figure 2) and the connecting arrow marked (marked "17" in Figure 2).
Below the graph, a rule table lists, per rule: the rank, namely the arrow number (marked "18" in Figure 3), antecedent (LHS), consequent (RHS), subject category, conviction, Spearman’s , support, confidence, and, under the two SNARM rankings, the active ranking score, "SNARM-c score" or "SNARM-s score" (marked "19" in Figure 3), higher comprising the better rank; the ARM-only ranking adds no such column, its measure, conviction, being already listed. The rank is computed at Run time by sorting the rule base in descending order of the active measure, with the top rule ranked one (1); the live display filters hide rules without renumbering the remainder, so a rule’s rank identifies it consistently across views. The SNARM scores derive from the Skyline levels computed over the (conviction, ) pairs, ordered by level and then within each level, with the top rule scoring N, namely the size of the rule base. A separate "Journal Popularity" tab lists every journal of the collection with its entire-dataset total references received and its popularity level.
7. Results and Discussion
All figures reported in this section originate from actual runs of the three ranking approaches (ARM-only, SNARM-c, and SNARM-s) within J2JAVis on the analysis dataset (references made within Greek-authored publications), and not from estimates; the exact parameter values used are stated with each result. The Postulate of Section 3, can be used to identify interesting journal-to-journal associations, namely, higher-to-lower level journal to journal associations. This section also examines whether the SNARM approaches, and SNARM-s in particular, tend to promote to higher-ranked positions associations that are ranked low by ARM-only.
The reporting is organized into thematic groups, following the design of Section 3: associations and journal popularity (subsection 7.1), interdisciplinary associations (subsection 7.2), SNARM-c against SNARM-s (subsection 7.3), and parameter and scale sensitivity (subsection 7.4).
7.1. Associations and Journal Popularity
In this subsection, we focus on associations and the flow of journal popularity they represent, namely, in other words we check whether:
- The RHS of the association is a journal belonging to a lower level that the journal of the LHS, and we call that an ascending association,
- The other way around, and we call that a descending association,
- Both journals belong to the same level, and we call that a same-level association.
Ascending associations express the fact that if a paper published with journal X cites journal A, it tends to also cite journal B which is more frequently cited than journal A. This indicates that B is an indispensable universal baseline across the scientific ecosystem, even when authors are reaching into niche literature. We expect this type of association to be very common. Authors citing niche journal A naturally reach for the broader experimental framework or general context literature in journal B.
Descending associations express the fact that if a paper published with journal X cites journal A, it tends to also cite a niche journal B which is less frequently cited than journal A. This reveals either cross-disciplinary bridging (a field is not just citing A for general background; it also pairs A with B to solve a very specific interdisciplinary problem) or that authors cannot cite a generic result from A in isolation; they must cite B to prove how that generic result applies to their specific field. We expect this type of association to represent an intriguing and statistically uncommon pattern in citation data.
Table 2 reveals a strong regularity. Ascending associations comprise approximately 55% to 60% of the total number of discovered associations, same-level associations comprise approximately 40% to 44%, and only approximately 0.4% are descending associations. Moreover, every descending rule, in every data section (and on the entire dataset), drops exactly one popularity level, namely L4 → L3. With the chosen parameter settings, the consequent is never at level L1 or L2, so that the effective consequent floor comprises level L3. Hence, for the bibliographic dataset considered, a very small number of associations are interesting, in accordance with the Postulate in Section 3.
The handful of descending rules, comprise L4 → L3 associations whose two journals share the same ASJC category; articles that devote a substantive share of their references to the L4 journal tend to also devote a substantive share to an L3 journal (see Table 3).
SNARM-s improves the ranking only where is high: it raises Hypertension → Journal of Hypertension (="0.653", #949 → #254), whereas the four (4) remaining rules, whose ranges from "0.235" to "0.386", are ranked lower than under ARM-only. The descending set therefore remains a small intra-discipline category, none of its members reaches the top-50 under any of the three approaches.
The ARM support measure determines how far down the ranked list the descending rules can be reached. A level L2 journal (at most 100 references received over the whole dataset) can only appear as a consequent in a rule if the minimum support is low enough for it to be mined at all. At support=0.0002, which for article publication years 2024 to 2025 corresponds to approximately four (4) co-occurrences, the mining returns eight (8) descending rules, three (3) of which are L3 → L2, namely the first rarely-cited consequents to appear. All three rules associate two journals of the same subject category, and the strongest of the latter shows the same numeric interdependence in the downward direction: for Clinical Otolaryngology → Laryngoscope Investigative Otolaryngology (conviction=2.14, = "0.95", confidence=0.53) the reference shares of the two journals co-vary almost perfectly, yet the conviction is modest, so that ARM-only ranks the rule #3240 whereas SNARM-s ranks it #1559.
Setting all three parameters to lower values (support=0.0002, confidence=0.2, min-conviction=1.0, article years 2024 to 2025) yields 38,422 rules, of which 712 descend. The distribution of the latter over the popularity levels is reported in Table 4.
Two limits hold under every setting examined, no matter how low the support, confidence, and min-conviction values are. Firstly, a level L1 journal does not show up as consequent: the rarest journals (at most 10 references received over the entire dataset) are never predicted by any antecedent, since the confidence of a rule predicting so rare a journal cannot reach the required level. Secondly, the drop never exceeds that of two popularity levels: a deviation of two levels (L4 → L2) occurs only at the lowest parameter values and only twice, both instances being Physical Review A predicting a small quantum-computing journal of the same subject category. Of the 224 rules involving L3 and L2 journals, 215 comprise two journals of the same ASJC category and 9 different ASJC category, so that the descending direction is not only shallow but also predominantly intradisciplinary.
In summary, descending rules are few, they mainly represent a drop of one to two popularity levels, and they associate journals of the same discipline. SNARM-s remains useful here: it promotes the descending rules of high and demotes those of low .
7.2. Interdisciplinary Journal-to-Journal Associations
Interdisciplinary associations comprise the second finding of the WoR-adjusted analysis. An association is characterized as interdisciplinary (a cross-field, cross-citation case) when its antecedent and consequent journals share no second-level subject category under the Scopus All Science Journal Classification (ASJC), namely when the rule bridges two distinct fields. Such rules are rare: at the default data section (same default settings) thirty-seven (37) of the 1,234 rules mined are interdisciplinary, namely 3% of the rule base.
The three approaches place these rules very differently, and the comparison is repeated over three (3) analysis data sections. As shown in Table 5, at threshold "0.02" the interdisciplinary count does not grow when the data section widens (37 → 28 → 37). The reason lies in the WoR normalization: the wider the data section, the more in-window references each article accumulates, so the WoR share of every journal shrinks and fewer cross-field associations reach the threshold. Additional interdisciplinary rules appear instead at threshold "0" (37 → 107 in the default data section; 887 on the entire dataset). The SNARM advantage at the top of the ranking is modest: ARM-only places at most one (1) interdisciplinary rule in the visible Top-50 list, whereas SNARM-c and SNARM-s each place up to six (6).
SNARM elevates the interdisciplinary rules to considerably higher-ranked positions. The promoted rules share a recurring shape, namely a specialized domain journal in the antecedent and a general megajournal (Nature, Scientific Reports, Nature Communications) or an adjacent-field highly-cited journal in the consequent. The reference share of the domain journal co-varies tightly with that of the partner (high ), while the implication strength (conviction) remains modest, so ARM-only strands exactly these rules in the tail. Table 6 lists the cross-field rules that SNARM-s promotes.
Each of these rules sits between rank #118 and rank #1233 under ARM-only, namely outside any list an analyst would inspect, and between rank #5 and rank #324 under SNARM-s. Consequently, the interdisciplinary bridges the consortium would want to notice comprise precisely the associations the classical ranking conceals. SNARM-s recovers exactly these cross-discipline bridges.
The cross-field bridges are reproduced via the HEAL-Link J2J-GR web service as follows: set the default settings and then set ASJC (rules) = "different ASJC". The edges drawn in red (the different-ASJC arrow colour) that connect a domain journal to a deep-blue general megajournal comprise the interdisciplinary associations, and under SNARM-s the latter are high-ranked (see Figure 4; thickness encodes confidence).
7.3. SNARM-c Versus SNARM-s
Both SNARM approaches outperform ARM-only at surfacing interdisciplinary rules, so the question that remains is which of the two comprises the sharper method. The measurement is taken over all interdisciplinary rules of the two data sections (see Table 7).
The comparison is dependent on the selected dataset section. SNARM-s clearly prevails in the narrow, recent data section (2024 to 2025: 28:9, namely approximately 76% of the pairwise comparisons, and it beats ARM-only on the median, 605 against 850), yet not in the wide data section (2015 to 2025: 17:18, SNARM-c marginally prevailing, and neither SNARM approach beating the ARM-only median of 662). The reason is visible in the column: interdisciplinary is high in the recent data section (top-20 mean 0.59, cor(rank, )=−0.84) but weak over 2015 to 2025 (top-20 mean 0.39, cor=−0.48). The weaker the proportional signal available to exploit, the smaller the edge of SNARM-s, until conviction (SNARM-c) performs as well or better.
The mechanism is unchanged across the two variants. The rules where SNARM-c beats SNARM-s comprise interdisciplinary associations with high conviction but low or negative : they co-occur, yet their reference shares do not co-vary (e.g. Genetic Epidemiology → Nature Genetics: conviction=5.40, ="0.08", SNARM-c #71 against SNARM-s #97; Aerosol Science and Technology → Atmospheric Chemistry and Physics: conviction=2.43, ="−0.19"). SNARM-c keeps the latter high on conviction, whereas SNARM-s correctly demotes them, on the reasoning that a bridge without proportional interdependence is not a genuine bridge. The rules where SNARM-s prevails are the mirror image, namely high-, modest-conviction genuine bridges.
For the purpose of identifying meaningful interdisciplinary association in a data section where proportional signal exists (recent years, ≈ 0.6 and above), SNARM-s comprises the sharper tool: it reserves the top for cross-field associations with real proportional interdependence and pushes down spurious high-conviction-yet-uncorrelated co-occurrences. SNARM-c comprises the safer default where is weak (wide data section), in that the latter will not drop a high-conviction rule on a marginal deficit. Kelesidis et al. [20] report SNARM-s to perform at least as well as SNARM-c throughout, on both of their datasets; the journals data qualify the latter finding, namely that the advantage of SNARM-s holds where the proportional signal is strong and recedes where it is weak.
7.4. Parameter and Scale Sensitivity
Support determines how far down the popularity levels the descending associations can reach. At the default setting (support=0.0005) the descending associations comprise five (5) rules in every regime, all of the one-level L4 → L3 pattern, and none of the latter enters the Top-50. Associations whose consequent lies at the rarely-cited levels appear only when the support is lowered to 0.0002. To study descending associations, therefore, the support must be kept low. The discretization threshold acts more mildly than support; threshold "0" broadens the coverage (approximately 1.7 times the rules) and threshold "0.02" restricts it to journals holding at least 2% of a bibliography. The findings hold at every setting.
As for the discretization threshold, the lower it is set, the more associations are retained. The full battery, re-run at threshold "0" against threshold "0.02" (article years 2024 to 2025, reference window 5), is shown in Table 8.
What changes, and what does not, across the two thresholds is captured in three (3) points:
- 1.
- The absence of a threshold yields approximately 1.7 times the rule base, since the low-share single references become items too.
- 2.
- The structural laws are threshold-invariant, in that upward flow still dominates (even more so at threshold "0": 65.4% against 59.6% ascending), the descending rules remain exactly five (5), still all descend by a single popularity level, namely L4 → L3 and the consequent floor of L3 holds either way.
- 3.
- Threshold "0" broadens the discovery, so interdisciplinary associations roughly double (3% → 5%), whereupon the interdisciplinary edge of SNARM-c /SNARM-s becomes visible at the top-50 rules.
Scale is examined by running on the entire dataset with no year or references window filter, at both thresholds (support=0.0005) (see Table 9).
Two lessons emerge. First, the interdisciplinary story persists and SNARM still prevails, yet the signal sits deeper. Interdisciplinary rules grow in both absolute and relative terms (84, namely 3%, at threshold "0.02"; 887, namely 12%, at threshold "0"), and SNARM-s retains its approximately 2:1 head-to-head edge (49:33, 591:293). The rank improvements are correspondingly larger on the wider rule base, e.g. IEEE Network → IEEE Communications Surveys and Tutorials (="0.645") rises from ARM-only #6014 to SNARM-s #391; Icarus → Nature (="0.589") from #3409 to #400; and Cellular and Molecular Gastroenterology and Hepatology → Nature Communications (="0.702") from #6715 to #121. None, however, reaches the top-50: the sheer size of the rule base means the absolute top is owned by the strongest same-field highly-cited-to-highly-cited associations, and SNARM-s lifts the cross-field rules from the thousands into the hundreds, a large relative gain rather than entry into the visible top.
Second, the structural laws hold on the entire dataset. Upward and same-level flow dominates (47% to 57% ascending, 42% to 52% same-level); the descending rules remain a handful, still all descend by a single popularity level, namely L4 → L3; the consequent floor is L3; and is never undefined. In summary, the entire dataset is to be used in order to study interdisciplinary association at scale, where SNARM-s outranks SNARM-c on approximately twice as many interdisciplinary associations, though these occupy the mid-ranks rather than the top-50.
7.5. Concluding Thoughts
ARM-only is not "wrong"; it ranks the associations by the strength of the implication each one expresses. Conviction, however, is computed on the discretized representation, so it carries no information on the interdependence of the WoR values involved. Consequently, the descending associations the Postulate values, namely those carrying a rarely-cited journal in the consequent, are ranked low by ARM-only even where their is high; SNARM-s consults exactly the information conviction lacks and promotes the latter to higher-ranked positions (Hypertension → Journal of Hypertension, = "0.653", #949 → #254; Clinical Otolaryngology → Laryngoscope Investigative Otolaryngology, = "0.95", #3240 → #1559).
Two refined conclusions follow, both robust to the WoR rework. First, out of the total number of discovered associations, ascending associations are approximately 55% to 60%, same-level ones approximately 40% to 44%, and only approximately 0.4% are descending associations, the latter being exclusively descending by a single popularity level L4 → L3 top-tier → associations within a single discipline (same ASJC category); rarely-cited (L1/L2) journals are never consequents (a rare RHS cannot be predicted with high confidence), and appear on the LHS predicting the highly-cited journal they accompany. SNARM does not alter this structure; it alters the ranking, so that the interesting ascending and interdisciplinary associations rise.
Second, SNARM’s clearest contribution concerns the interdisciplinary associations, namely rules whose antecedent comprises a journal of a specific discipline and whose consequent a highly-cited journal of general scope (General ASJC category). The latter rules combine high values with modest conviction, so they remain low-ranked under ARM-only. SNARM-s promotes them to higher-ranked positions when the values involved are high, namely in the recent data sections and at threshold "0"; over the wide data sections, where the values of the interdisciplinary associations are low, SNARM-c performs at least as well. In both cases SNARM, and SNARM-s in particular, where the values involved are high, recovers the information on the interdependence of the WoR values that the discretization stage hides; the identification of such associations comprises the intended use of J2JAVis.
8. Conclusion and Future Work
We report on the current stage of our research effort on the usage-based evaluation of academic journals in the microcosm of the HEAL-Link consortium. The innovative contribution is summarized as follows:
- 1.
- The market basket model of the consortium’s bibliographic data is extended to include a numerical dimension, namely the weight of referencing (WoR), registering the percentage of an article’s journal references directed at a given journal.
- 2.
- SNARM is applied, for the first time, to bibliographic data: the journals application, named as a future stage of SNARM applicability in Kelesidis et al. [20], is designed and carried out in full, delivering directed, Skyline-ranked journal-to-journal associations and demonstrating that the technique’s advantage over the ARM-only baseline carries over to the citation domain ("Results and Discussion" Section).
- 3.
- The approach is embodied in J2JAVis, a first version of which is publicly available within the HEAL-Link J2J-GR web service (https://j2j.heal-link.gr/j2javis/).
Evaluated against the ARM-only baseline at the settings reported in "Results and Discussion" Section, SNARM-s helps promote interesting rules in higher ranks when they have relatively high . It additionally recovers the interdisciplinary bridges from the deep tail. The reported comparisons are descriptive by design: they quantify the re-orderings the three rankings produce over one and the same rule base, at settings that are stated in full with every result and are therefore reproducible. The formal significance testing of the observed differences comprises the first-in-order goal of the future work that follows.
Future work will focus on:
- 1.
- Subjecting the reported Top-N differences to formal significance testing.
- 2.
- A predictive-ability evaluation of the SNARM-versus-ARM-only comparison on the journals’ data, analogous to the one conducted in Kelesidis et al. [20].
- 3.
- Re-specifying support as an absolute co-occurrence count (in place of the relative value), so that rarely-cited journals remain analysable on the entire collection.
- 4.
- Extending the J2JAVis service with per-journal subscription-support reporting, so that the directed associations feed the consortium’s decision-making process directly.
Author Contributions
Conceptualization, L.P., K.K., D.A.D, and G.E.; methodology, L.P., K.K., D.A.D., G.E.; software, L.P. and K.K.; validation, L.P., D.A.D, and G.E.; formal analysis, L.P., K.K., D.A.D, and G.E.; resources, L.P.; data curation, L.P.; writing—original draft preparation, L.P.; writing—review and editing, L.P., K.K., D.A.D, and G.E.; supervision, D.A.D, and G.E.; All authors have read and agreed to the published version of the manuscript.
Funding
This research received no external funding.
Data Availability Statement
All data used in this research were obtained from open access APIs, namely, OpenAIRE Graph (https://api.openaire.eu/graph/) and Crossref REST API (https://api.crossref.org/).
Acknowledgments
During the preparation of this manuscript/study, the author(s) used Claude Fable 5 and Opus 5 (Anthropic, claude.ai) for the purposes of proofreading and improving the academic tone of the final manuscript. The authors have reviewed and edited the output and take full responsibility for the content of this publication.
Conflicts of Interest
The authors declare no conflicts of interest.
Abbreviations
The following abbreviations are used in this manuscript:
| ASJC | All Science Journal Classification |
| ARM | Association Rule Mining |
| SNARM | Skyline Numerical Association Rule Mining |
| WoR | Weight of Referencing |
| J2J | Journal to Journal |
| HEAL-Link | Hellenic Academic Libraries Link |
| DOI | Digital Object Identifier |
References
- Pispiringas, L.; Dervos, D.A.; Evangelidis, G. J2J-GR: Journal-to-journal references by Greek researchers. In Proceedings of the Model and Data Engineering (MEDI 2019). Springer, 2019, Vol. 11815, LNCS, pp. 83–95. [CrossRef]
- Pispiringas, L.; Dervos, D.A.; Evangelidis, G. Citation based journal-to-journal associations in the microcosm of an academic libraries consortium. The Journal of Academic Librarianship 2022, 48, 102463. [CrossRef]
- Cobo, M.J.; López-Herrera, A.G.; Herrera-Viedma, E.; Herrera, F. Science mapping software tools: Review, analysis, and cooperative study among tools. Journal of the American Society for Information Science and Technology 2011, 62, 1382–1402. [CrossRef]
- van Eck, N.J.; Waltman, L. Software survey: VOSviewer, a computer program for bibliometric mapping. Scientometrics 2010, 84, 523–538. [CrossRef]
- Börner, K.; Huang, W.; Linnemeier, M.; Duhon, R.J.; Phillips, P.; Ma, N.; Zoss, A.M.; Guo, H.; Price, M.A. Rete-netzwerk-red: analyzing and visualizing scholarly networks using the Network Workbench Tool. Scientometrics 2010, 83, 863–876. [CrossRef]
- Chen, C. Science mapping: A systematic review of the literature. Journal of Data and Information Science 2017, 2, 1–40. [CrossRef]
- Small, H. Co-citation in the scientific literature: A new measure of the relationship between two documents. Journal of the American Society for Information Science 1973, 24, 265–269. [CrossRef]
- Pudovkin, A.I.; Garfield, E. Algorithmic procedure for finding semantically related journals. Journal of the American Society for Information Science and Technology 2002, 53, 1113–1119. [CrossRef]
- Peters, C.S.; Tovstiadi, E.; Pritting, S. After the Big Deal: Data-informed management of unbundled journal packages in a consortial environment. The Serials Librarian 2024, 85, 265–276. [CrossRef]
- Damerchiloo, M.; Haghparast, A.; Ramezani, A.; Zeinali, V.; Vazifeshenas, N.; Jafari, B. Impact of the e-journals of academic libraries consortium on research productivity: An Iranian consortium experience. Collection Management 2020, 45, 235–251. [CrossRef]
- Coughlin, D.M.; Jansen, B.J. Modeling journal bibliometrics to predict downloads and inform purchase decisions at university research libraries. Journal of the Association for Information Science and Technology 2016, 67, 2263–2273. [CrossRef]
- Fernández-Ramos, A.; Travieso-Rodríguez, C.; Rodríguez-Bravo, B. Faculty use of subscribed journals in a Spanish library consortium: Downloads and citations in the field of psychology. Serials Review 2022, 48, 121–136. [CrossRef]
- Fernández-Ramos, A.; Rodríguez-Bravo, B.; Diez-Diez, Á. Use of scientific journals in Spanish universities: Analysis of the relationship between citations and downloads in two university library consortia. Scientometrics 2023, 128, 2489–2505. [CrossRef]
- Agrawal, R.; Srikant, R. Fast algorithms for mining association rules in large databases. In Proceedings of the Proceedings of the 20th International Conference on Very Large Data Bases (VLDB ’94), Santiago de Chile, 1994; pp. 487–499.
- Zaki, M.J.; Parthasarathy, S.; Ogihara, M.; Li, W. New algorithms for fast discovery of association rules. In Proceedings of the Proceedings of the 3rd International Conference on Knowledge Discovery and Data Mining (KDD-97). AAAI Press, 1997, pp. 283–286.
- Han, J.; Pei, J.; Yin, Y. Mining frequent patterns without candidate generation. SIGMOD Record 2000, 29, 1–12. [CrossRef]
- Brin, S.; Motwani, R.; Ullman, J.D.; Tsur, S. Dynamic itemset counting and implication rules for market basket data. SIGMOD Record 1997, 26, 255–264. [CrossRef]
- Geng, L.; Hamilton, H.J. Interestingness measures for data mining: A survey. ACM Computing Surveys 2006, 38, 9. [CrossRef]
- Eldin, A.M.; Salem, E.; El-Saber, N.; Eldrandaly, K. Objective and subjective measures for extracting interesting association rules: A survey. Iran Journal of Computer Science 2026, 9, Article 32. [CrossRef]
- Kelesidis, K.; Pispiringas, L.; Dervos, D.A.; Karamitopoulos, L. Skyline-enhanced association rule mining for numeric datasets. SN Computer Science 2026, 7, Article 594. [CrossRef]
- Srikant, R.; Agrawal, R. Mining quantitative association rules in large relational tables. SIGMOD Record 1996, 25, 1–12. [CrossRef]
- Kaushik, M.; Sharma, R.; Fister, I.; Draheim, D. Numerical association rule mining: A systematic literature review. arXiv 2023, 2307.00662. [CrossRef]
- Kaushik, M.; Sharma, R.; Arakkal Peious, S.; Shahin, M.; Ben Yahia, S.; Draheim, D. A systematic assessment of numerical association rule mining methods. SN Computer Science 2021, 2, 348. [CrossRef]
- Tew, C.; Giraud-Carrier, C.; Tanner, K.; Burton, S. Behavior-based clustering and analysis of interestingness measures for association rule mining. Data Mining and Knowledge Discovery 2014, 28, 1004–1045. [CrossRef]
- Börzsönyi, S.; Kossmann, D.; Stocker, K. The Skyline operator. In Proceedings of the Proceedings 17th International Conference on Data Engineering, 2001, pp. 421–430. [CrossRef]
- Ciaccia, P.; Martinenghi, D. Reconciling skyline and ranking queries. Proceedings of the VLDB Endowment 2017, 10, 1454–1465. [CrossRef]
- Fister, I.J.; Fister, I.; Fister, D.; Podgorelec, V.; Salcedo-Sanz, S. A comprehensive review of visualization methods for association rule mining: Taxonomy, challenges, open problems and future ideas. Expert Systems with Applications 2023, 233, 120901. [CrossRef]
- Manghi, P.; Atzori, C.; Bardi, A.; Baglioni, M.; Schirrwagen, J.; Dimitropoulos, H.; La Bruzzo, S.; Foufoulas, I.; Mannocci, A.; Horst, M.; et al. OpenAIRE Research Graph Dataset, 2022. A new version of this dataset is published every 6 months. The content available on the OpenAIRE EXPLORE and CONNECT portals might be more up-to- date with respect to the data you find here., . [CrossRef]
| 1 | |
| 2 | |
| 3 | |
| 4 | |
| 5 | |
| 6 | |
| 7 |
Figure 1.
The J2JAVis interface: the control panel (mining parameters above the Run button; live display filters below).
Figure 1.
The J2JAVis interface: the control panel (mining parameters above the Run button; live display filters below).
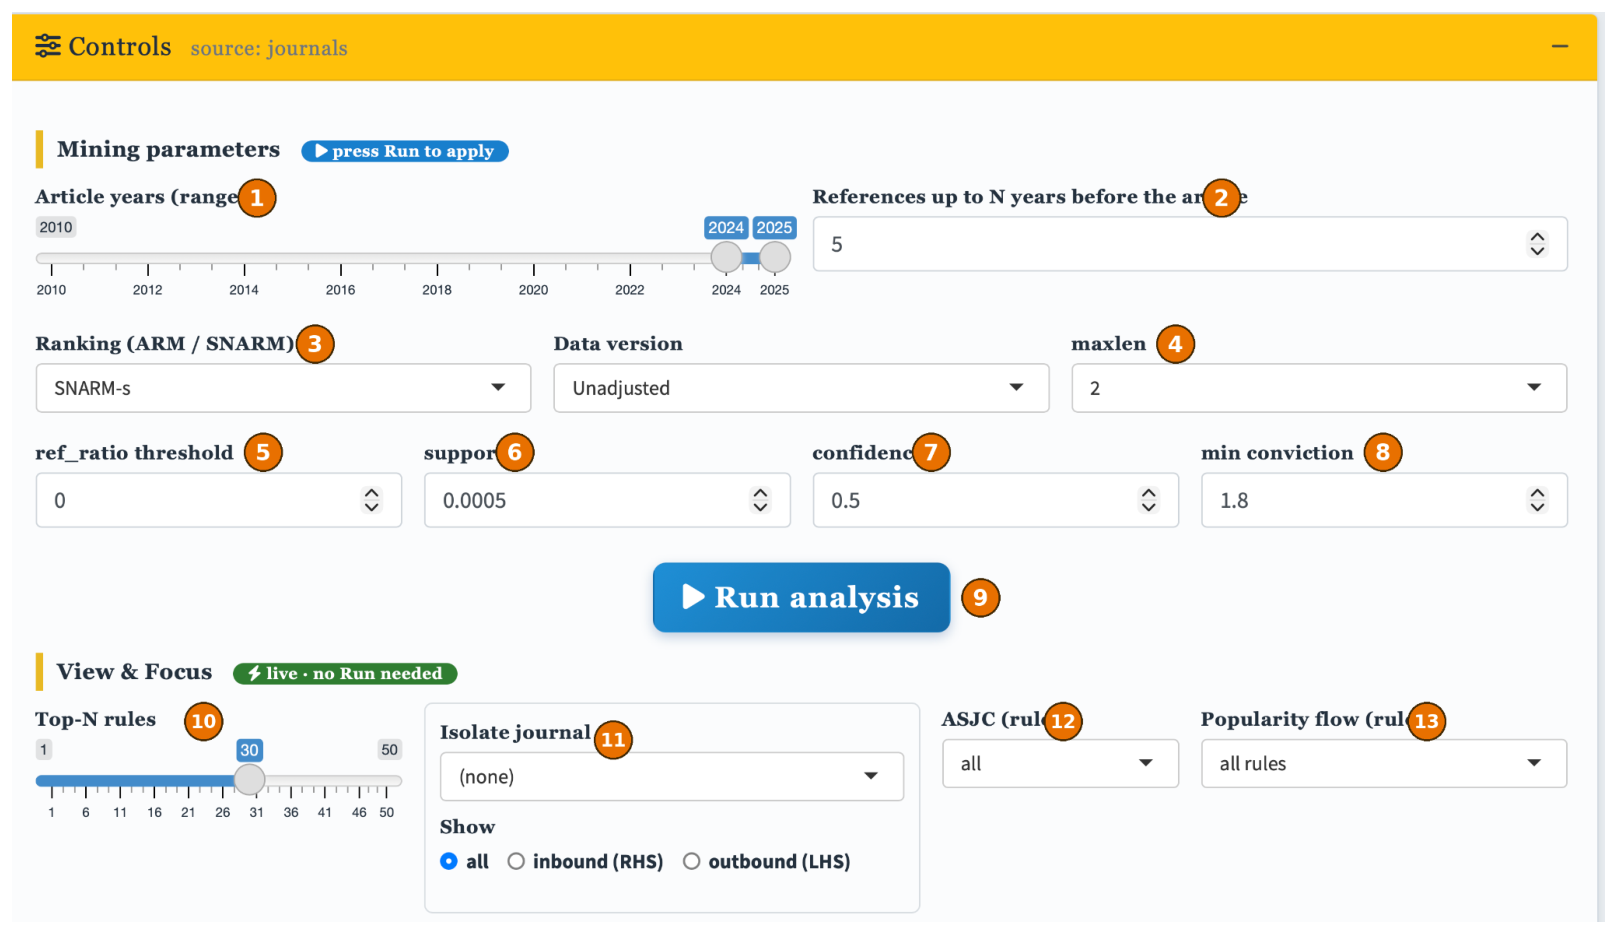
Figure 2.
The Associations-graph canvas and the legend.
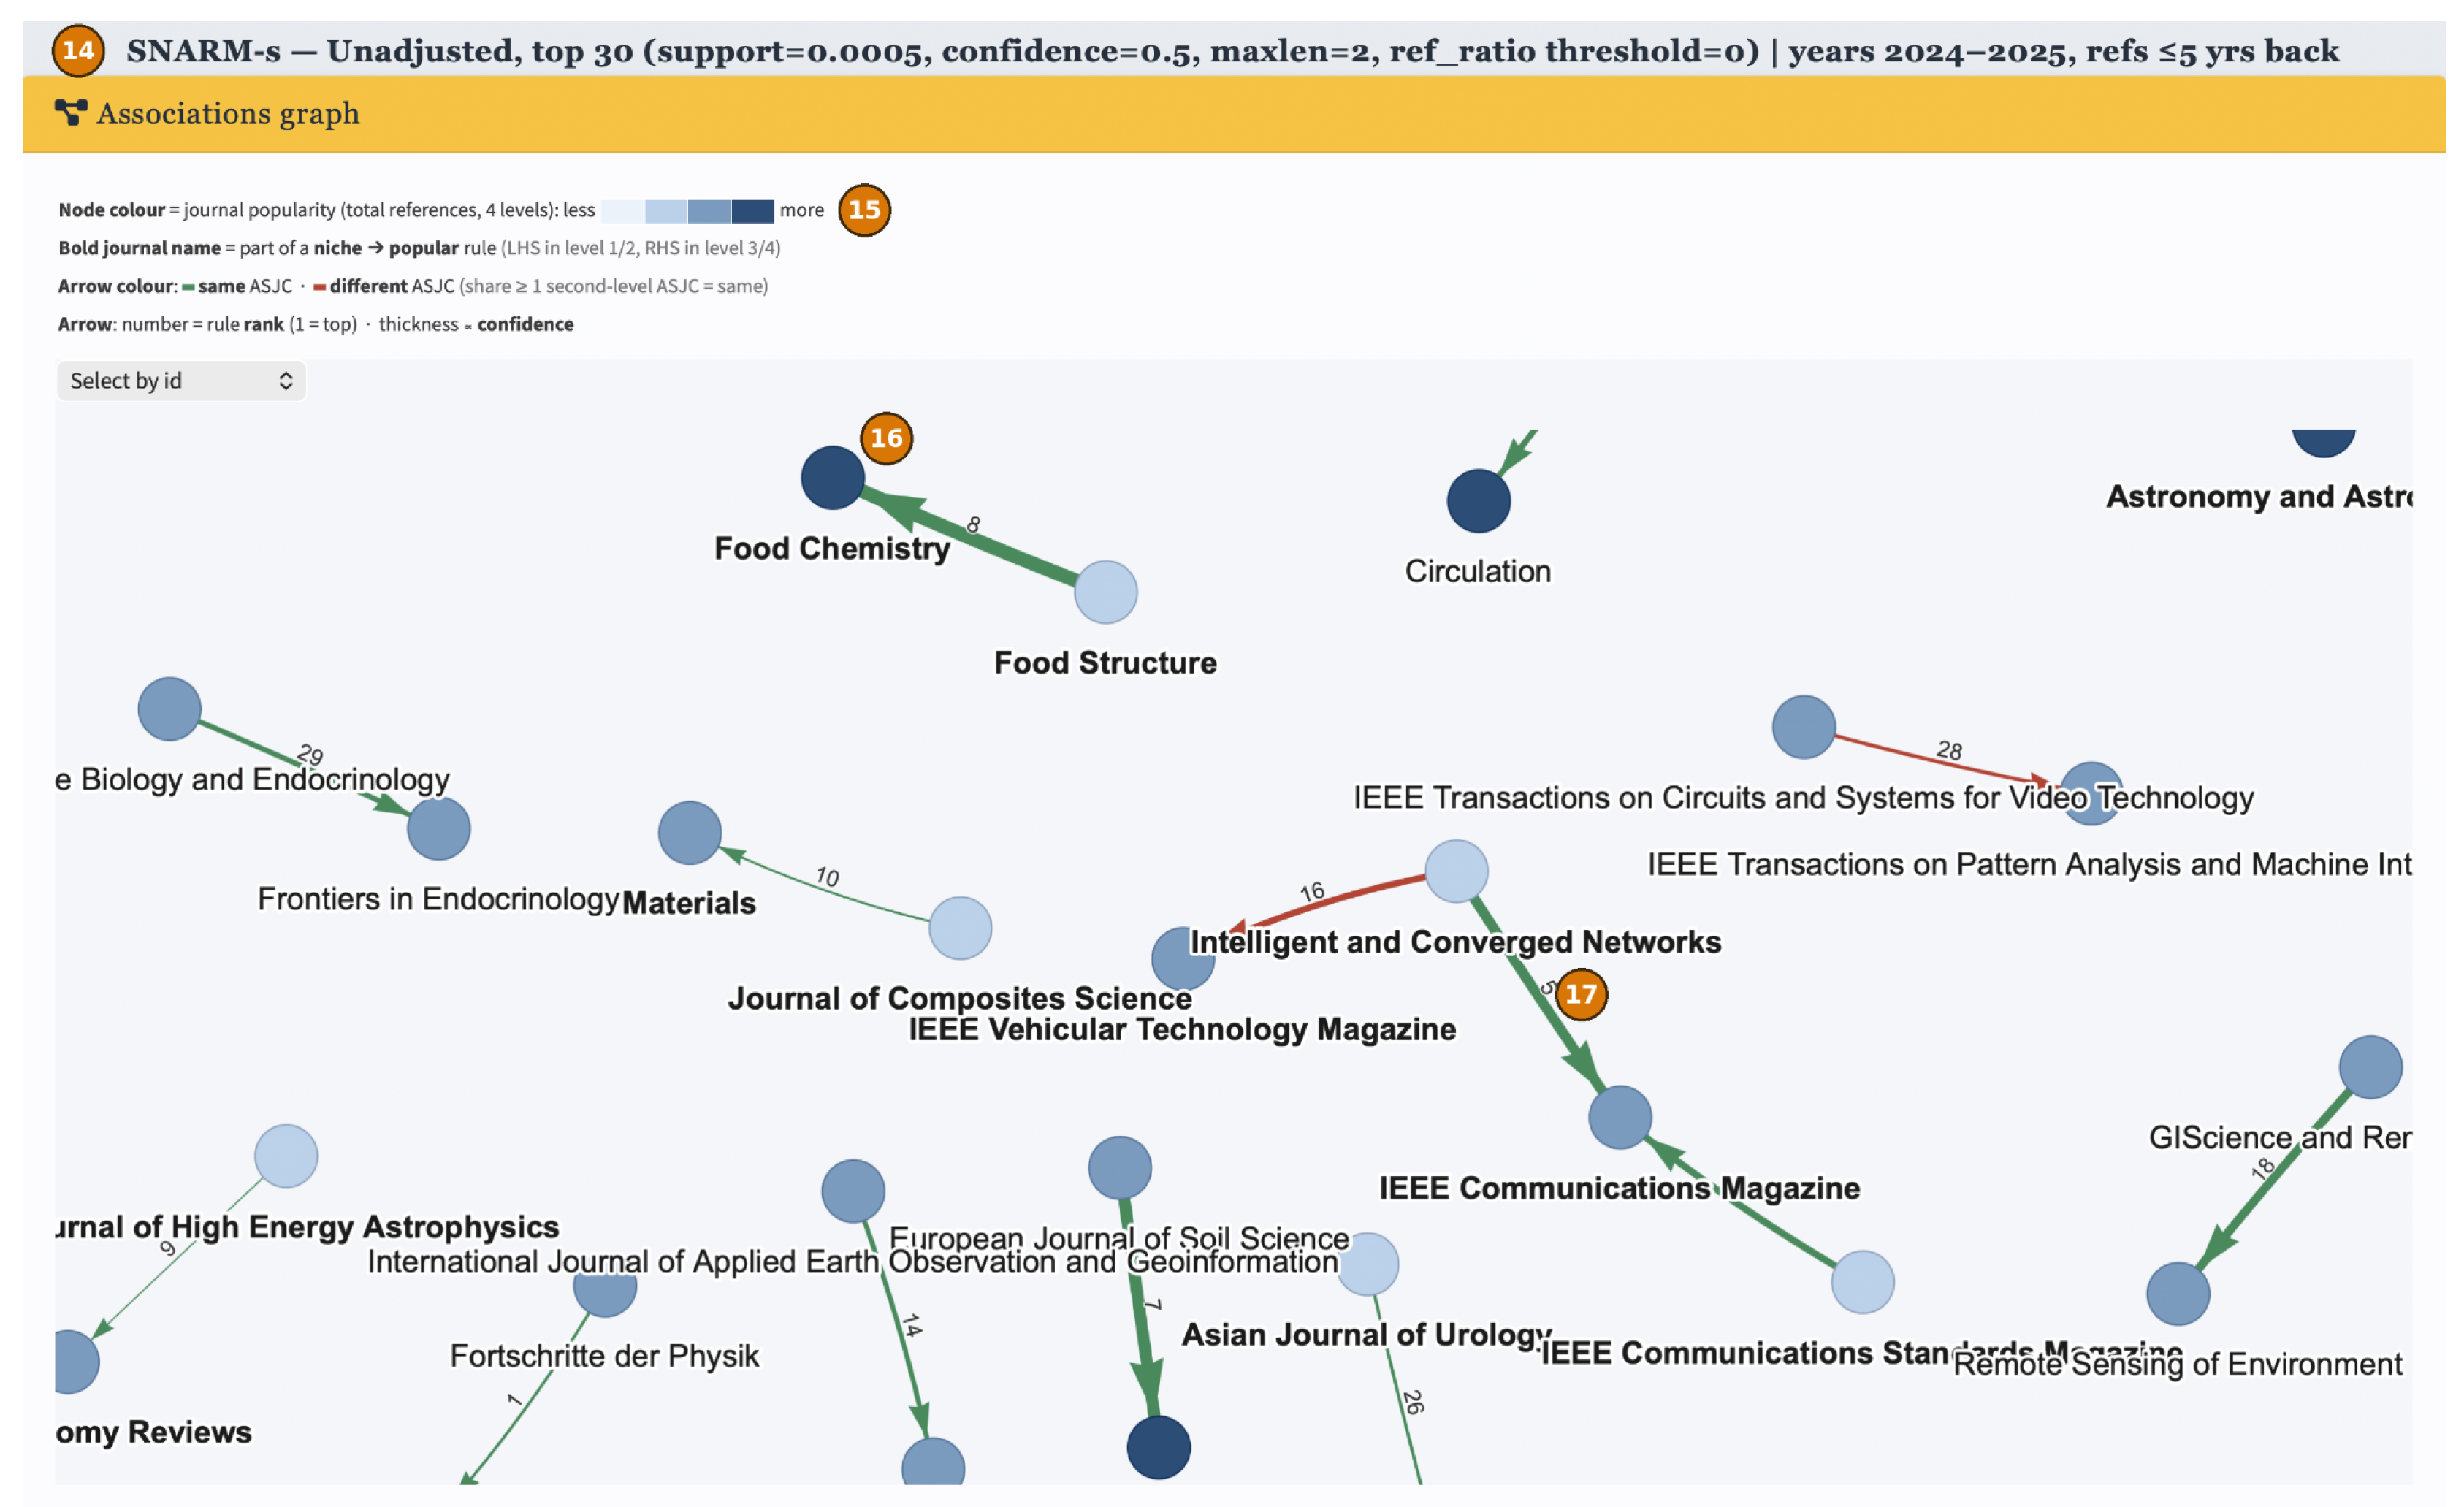
Figure 3.
The rule table.
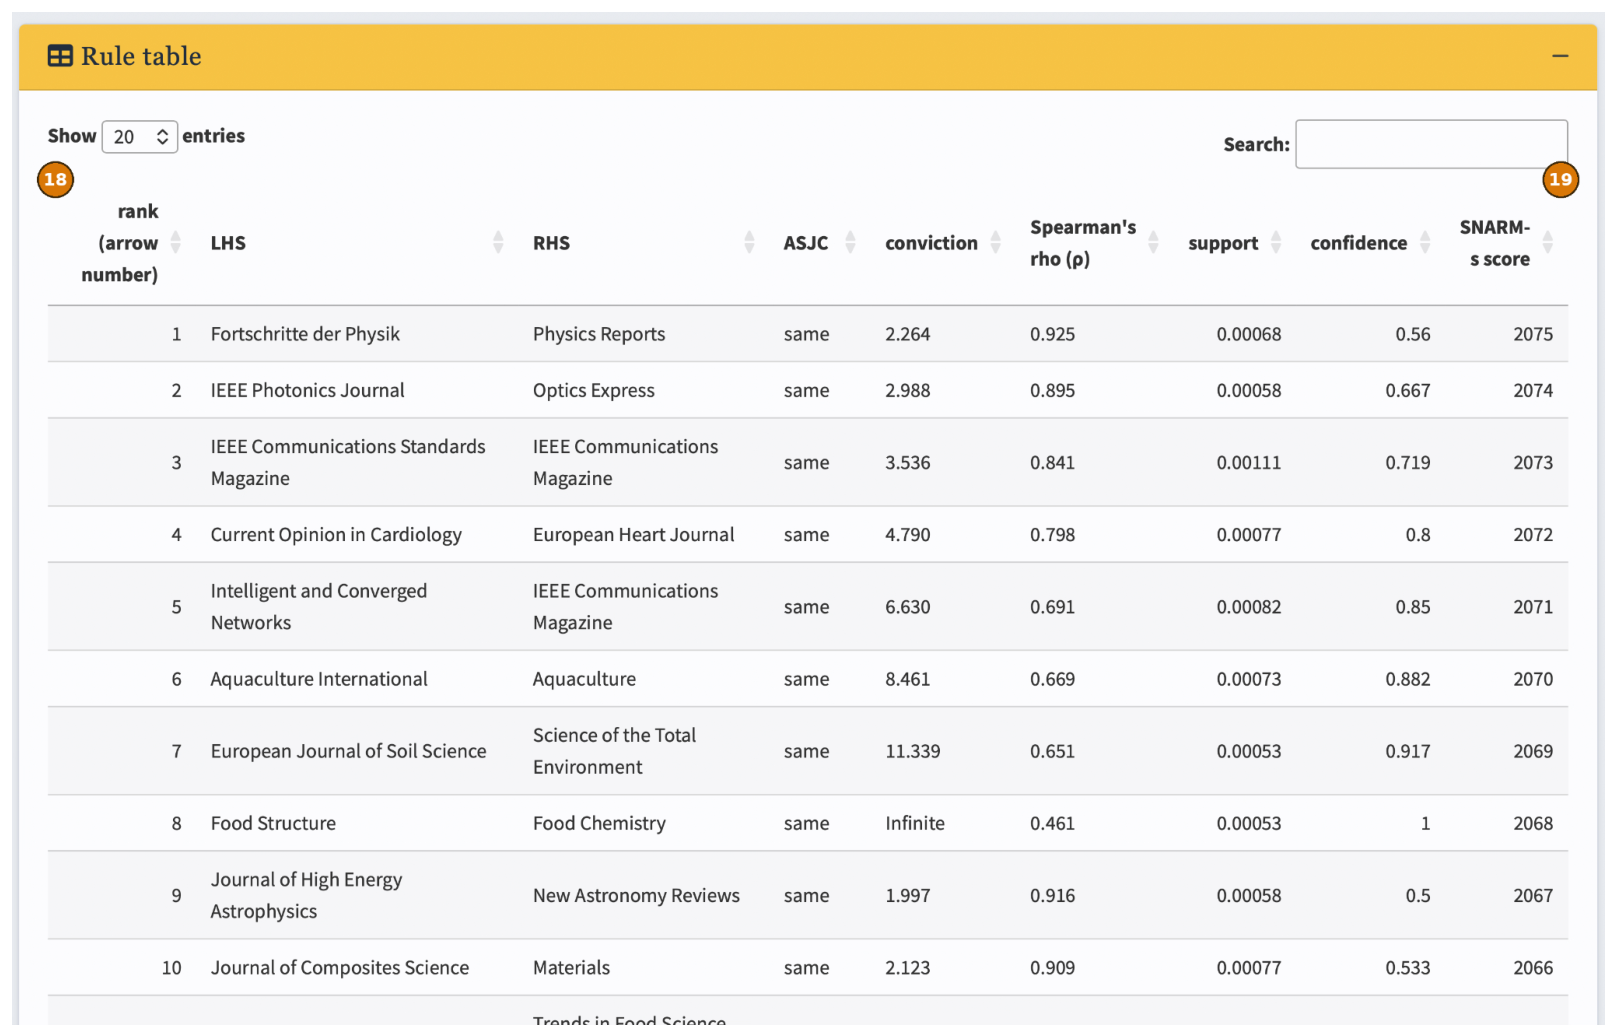
Figure 4.
Interdisciplinary associations under SNARM-s, namely the red arrows (different subject category) connecting a domain journal to a deep-blue general megajournal.
Figure 4.
Interdisciplinary associations under SNARM-s, namely the red arrows (different subject category) connecting a domain journal to a deep-blue general megajournal.
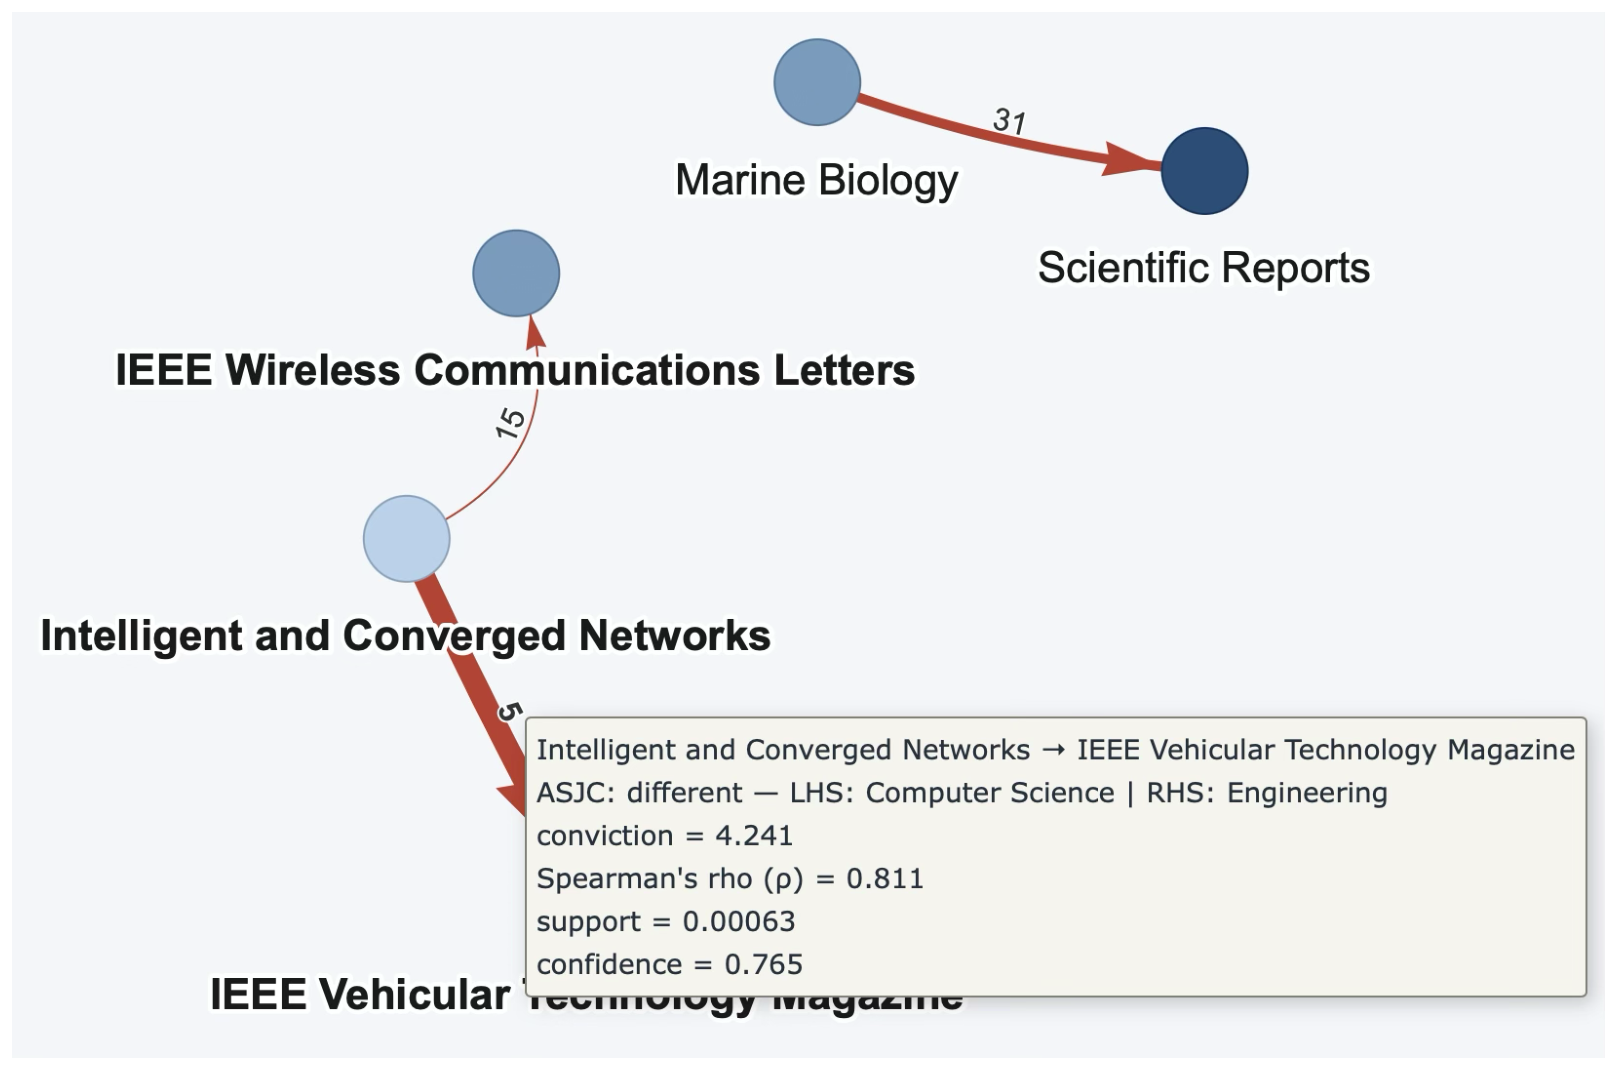

Table 1.
Running example: original (Numeric, WoR), binarized (Discretized, threshold "0.02"), and market basket analysis (MBA model) representations, for eight (8) articles and twelve (12) journals (a dash denotes a journal the article does not reference).
Table 1.
Running example: original (Numeric, WoR), binarized (Discretized, threshold "0.02"), and market basket analysis (MBA model) representations, for eight (8) articles and twelve (12) journals (a dash denotes a journal the article does not reference).
| Article | Numeric (WoR share) | Discretized (WoR ≥ "0.02") | MBA model | ||||||||||||||||||||||
| J1 | J2 | J3 | J4 | J5 | J6 | J7 | J8 | J9 | J10 | J11 | J12 | J1 | J2 | J3 | J4 | J5 | J6 | J7 | J8 | J9 | J10 | J11 | J12 | ||
| A1 | – | 0.346 | 0.115 | – | 0.115 | – | 0.231 | – | 0.192 | – | – | – | 0 | 1 | 1 | 0 | 1 | 0 | 1 | 0 | 1 | 0 | 0 | 0 | J2, J3, J5, J7, J9 |
| A2 | 0.242 | 0.091 | – | 0.242 | 0.212 | 0.152 | – | 0.061 | – | – | – | – | 1 | 1 | 0 | 1 | 1 | 1 | 0 | 1 | 0 | 0 | 0 | 0 | J1, J2, J4, J5, J6, J8 |
| A3 | 0.097 | 0.226 | 0.258 | – | – | – | – | – | – | 0.161 | 0.258 | – | 1 | 1 | 1 | 0 | 0 | 0 | 0 | 0 | 0 | 1 | 1 | 0 | J1, J2, J3, J10, J11 |
| A4 | – | – | – | 0.042 | – | 0.375 | 0.167 | – | – | – | 0.125 | 0.292 | 0 | 0 | 0 | 1 | 0 | 1 | 1 | 0 | 0 | 0 | 1 | 1 | J4, J6, J7, J11, J12 |
| A5 | 0.067 | 0.067 | – | – | 0.133 | – | – | 0.467 | – | 0.267 | – | – | 1 | 1 | 0 | 0 | 1 | 0 | 0 | 1 | 0 | 1 | 0 | 0 | J1, J2, J5, J8, J10 |
| A6 | 0.133 | 0.200 | – | 0.167 | 0.133 | – | 0.267 | – | – | – | 0.100 | – | 1 | 1 | 0 | 1 | 1 | 0 | 1 | 0 | 0 | 0 | 1 | 0 | J1, J2, J4, J5, J7, J11 |
| A7 | – | – | 0.308 | – | – | 0.269 | – | 0.154 | 0.077 | – | – | 0.192 | 0 | 0 | 1 | 0 | 0 | 1 | 0 | 1 | 1 | 0 | 0 | 1 | J3, J6, J8, J9, J12 |
| A8 | 0.238 | – | 0.012 | – | 0.179 | – | – | – | – | 0.095 | 0.202 | 0.274 | 1 | 0 | 0 | 0 | 1 | 0 | 0 | 0 | 0 | 1 | 1 | 1 | J1, J5, J10, J11, J12 |
Table 2.
Direction of the popularity flow across three (3) analysis data sections (support=0.0005, confidence=0.5, maxlen=2, min-conviction=1.8, WoR threshold=0.02).
Table 2.
Direction of the popularity flow across three (3) analysis data sections (support=0.0005, confidence=0.5, maxlen=2, min-conviction=1.8, WoR threshold=0.02).
| article years (references window in years) | rules | ascending (RHS↑) | same-level | descending (RHS↓) |
|---|---|---|---|---|
| descending pattern | ||||
| 2024 to 2025 (5) | 1,234 | 736 (59.6%) | 493 (39.9%) | 5 (0.4%) |
| all L4→L3, same discipline | ||||
| 2020 to 2025 (5) | 917 | 508 (55.4%) | 407 (44.4%) | 2 (0.2%) |
| all L4→L3, same discipline | ||||
| 2015 to 2025 (6) | 988 | 553 (56%) | 430 (43.5%) | 5 (0.5%) |
| all L4→L3, same discipline |
Table 3.
The descending rules (L4 → L3), with their rank under ARM-only against SNARM (article years 2024 to 2025, reference window 5).
Table 3.
The descending rules (L4 → L3), with their rank under ARM-only against SNARM (article years 2024 to 2025, reference window 5).
| descending rule (L4 → L3) | conviction | ARM → SNARM-c → SNARM-s | |
|---|---|---|---|
| Journal of Vascular Surgery→Eur. J. of Vascular & Endovascular Surgery | 2.69 | 0.235 | #431 → #724 → #740 |
| Arthritis and Rheumatology→Rheumatology | 2.21 | 0.313 | #773 → #948 → #954 |
| Allergy→J. Allergy Clin. Immunol.: In Practice | 2.13 | 0.295 | #879 → #1,001 → #998 |
| Hypertension→Journal of Hypertension | 2.08 | 0.653 | #949 → #283 → #254 |
| Annals of the Rheumatic Diseases→Rheumatology | 2.07 | 0.386 | #968 → #957 → #945 |
Table 4.
The descending rules by popularity level pair at the lowest parameter values (support=0.0002, confidence=0.2, maxlen=2, min-conviction=1.0, article years 2024 to 2025, reference window 5 years).
Table 4.
The descending rules by popularity level pair at the lowest parameter values (support=0.0002, confidence=0.2, maxlen=2, min-conviction=1.0, article years 2024 to 2025, reference window 5 years).
| descending level pair | count |
|---|---|
| L4 → L3 | 486 |
| L3 → L2 | 224 |
| L4 → L2 (two popularity levels deviation) | 2 |
| any level → L1 | 0 |
Table 5.
Interdisciplinary rules across three (3) analysis data sections, and their presence in the Top-50 positions of each approach (same default settings). threshold "0.02 vs 0".
Table 5.
Interdisciplinary rules across three (3) analysis data sections, and their presence in the Top-50 positions of each approach (same default settings). threshold "0.02 vs 0".
| article years (ref window in years) | rules | interdisciplinary | in Top-50: ARM-only / SNARM-c / SNARM-s |
|---|---|---|---|
| 2024 to 2025 (5) | 1,234 vs 2,075 | 37 vs 107 | 0 / 3 / 3 vs 0 / 5 / 6 |
| 2020 to 2025 (5) | 917 vs 1,630 | 28 vs 108 | 0 / 0 / 0 vs 0 / 2 / 2 |
| 2015 to 2025 (6) | 988 vs 1,685 | 37 vs 115 | 1 / 0 / 0 vs 1 / 2 / 2 |
| entire 2015 to 2025 (no window) | 2,858 vs 7,298 | 84 vs 887 | 0 / 0 / 0 vs 0 / 0 / 0 |
Table 6.
Representative interdisciplinary rules and their ranks under ARM-only against SNARM-s (same default settings).
Table 6.
Representative interdisciplinary rules and their ranks under ARM-only against SNARM-s (same default settings).
| rule (LHS → RHS) | shape | conviction | ARM → SNARM-s | |
|---|---|---|---|---|
| Intelligent and Converged Networks→IEEE Vehicular Technology Magazine | Computer Science → Engineering | 4.24 | 0.81 | #118 → #5 |
| Intelligent and Converged Networks→IEEE Wireless Communications Letters | Computer Science → Engineering | 3.39 | 0.78 | NA → #15 |
| Marine Biology→Scientific Reports | Agr. & Biol. Sciences; Env. Science → General | 3.36 | 0.72 | #216 → #31 |
| Intelligent and Converged Networks→IEEE Transactions on Communications | Computer Science → Engineering | 2.82 | 0.71 | #371 → #67 |
| GigaScience→Nature Communications | Agr. & Biol. Sciences; Env. Science → General | 1.86 | 0.665 | #1233 → #324 |
| Environmental Science: Atmospheres→Atmospheric Measurement Techniques | Env. Science → Earth science | 2.99 | 0.60 | #310 → #113 |
Table 7.
SNARM-c against SNARM-s on the interdisciplinary rule set of the two analysis data sections.
Table 7.
SNARM-c against SNARM-s on the interdisciplinary rule set of the two analysis data sections.
| metric (interdisciplinary rules) | 2015 to 2025 (37 rules) | 2024 to 2025 (37 rules) |
|---|---|---|
| per-rule wins, SNARM-s : SNARM-c : tie | 17 : 18 : 2 | 28 : 9 : 0 |
| median rank, SNARM-c / SNARM-s / ARM | 727 / 705 / 662 | 616 / 605 / 850 |
| mean rank, SNARM-c / SNARM-s / ARM | 651 / 648 / 653 | 628 / 617 / 788 |
| cor(rank, ) under SNARM-s | −0.48 | −0.84 |
| cor(rank, conviction) under SNARM-c | −0.55 | −0.62 |
| top-20 mean conviction, SNARM-c / SNARM-s | 2.44 / 2.44 | 2.54 / 2.54 |
| top-20 mean , SNARM-c / SNARM-s | 0.39 / 0.39 | 0.59 / 0.59 |
Table 8.
Threshold sensitivity, WoR ≥ "0.02" against WoR ≥ "0" (article years 2024 to 2025, reference window 5, support=0.0005).
Table 8.
Threshold sensitivity, WoR ≥ "0.02" against WoR ≥ "0" (article years 2024 to 2025, reference window 5, support=0.0005).
| metric | thr 0.02 | thr 0.00 |
|---|---|---|
| rules | 1,234 | 2,075 |
| undefined | 0 | 0 |
| ascending / same-level / descending (counts) | 736 / 493 / 5 | 1,358 / 712 / 5 |
| ascending / same-level / descending (%) | 59.6% / 39.9% / 0.4% | 65.4% / 34.3% / 0.2% |
| descending pattern | all one level L4→L3 (5) | all one level L4→L3 (5) |
| descending in top-50 (ARM / SNARM-c / SNARM-s) | 0 / 0 / 0 | 0 / 0 / 0 |
| interdisciplinary | 37 (3%) | 107 (5%) |
| interdisciplinary in top-50 (ARM / SNARM-c / SNARM-s) | 0 / 3 / 3 | 0 / 5 / 6 |
| interdisciplinary head-to-head, SNARM-s : SNARM-c : tie | 28 : 9 : 0 | 71 : 35 : 1 |
Table 9.
Threshold sensitivity, WoR ≥ "0.02" against WoR ≥ "0" (article years 2010 to 2025, no reference window), support=0.0005.
Table 9.
Threshold sensitivity, WoR ≥ "0.02" against WoR ≥ "0" (article years 2010 to 2025, no reference window), support=0.0005.
| metric | 2024-25 (thr 0.02) | ENTIRE (thr 0.02) | ENTIRE (thr 0.00) |
|---|---|---|---|
| transactions | 20,676 | 155,817 | 155,817 |
| rules | 1,234 | 2,858 | 7,132 |
| absolute support count (= support × txns) | ≈ 10 | ≈ 78 | ≈ 78 |
| ascending / same-level / descending | 59.6% / 39.9% / 0.4% | 47.4% / 52.4% / 0.2% | 57.4% / 42.5% / 0.1% |
| descending pattern | all one level L4→L3 (5) | all one level L4→L3 (6) | all one level L4→L3 (10) |
| interdisciplinary | 37 (3%) | 84 (3%) | 887 (12%) |
| interdisciplinary head-to-head SNARM-s : SNARM-c | 28 : 9 | 49 : 33 | 591 : 293 |
| undefined | 0 | 0 | 0 |
Disclaimer/Publisher’s Note: The statements, opinions and data contained in all publications are solely those of the individual author(s) and contributor(s) and not of MDPI and/or the editor(s). MDPI and/or the editor(s) disclaim responsibility for any injury to people or property resulting from any ideas, methods, instructions or products referred to in the content. |
© 2026 by the authors. Licensee MDPI, Basel, Switzerland. This article is an open access article distributed under the terms and conditions of the Creative Commons Attribution (CC BY) license (http://creativecommons.org/licenses/by/4.0/).
Copyright: This open access article is published under a Creative Commons CC BY 4.0 license, which permit the free download, distribution, and reuse, provided that the author and preprint are cited in any reuse.