

Submitted:
03 August 2026
Posted:
06 August 2026
You are already at the latest version
Abstract
Group-level molecular-interaction evidence is often reduced to pairwise protein-protein interaction graphs before protein-complex detection, potentially discarding experiment membership and over-weighting large groups. Yet prior higher-order studies typically changed the representation, objective, output granularity, and evaluation protocol simultaneously. We isolate the operator-level contribution of higher-order representation by comparing an inverse-size-weighted clique graph, the normalized Zhou hypergraph operator, and a degree-aware penalized hypergraph operator on identical experiment-derived groups. Hyperedges were split by size into training, validation, and test sets; the training split alone defined the protein universe and operators; regularization was selected on validation data; and recovery was evaluated against held-out test hyperedges. Across nine IntAct-derived thematic PSI–MITAB collections and 25 paired initializations per dataset, the penalized hypergraph increased mean held-out symmetric best-match F1 on six datasets after within-dataset Benjamini–Hochberg correction, was indistinguishable on two, and was lower by 0.0015 on Cancer. Positive mean differences ranged from 0.0098 to 0.0356. However, the across-dataset Friedman test did not reach significance (χ2 = 5.20, p = 0.074), and the graph–penalized-hypergraph Nemenyi comparison was non-significant (p = 0.111). The penalized operator had the best mean rank (1.39), but secondary metrics and eigengap-selected cluster counts exposed dataset-dependent trade-offs. Observed recovery exceeded degree-preserving and hyperedge-size-preserving nulls on eight of nine datasets. Gene Ontology coherence was high for both representations, with no aspect-level difference surviving multiplicity correction and substantial pooled term overlap (Jaccard 0.78–0.86). Higher-order modeling is therefore conditionally beneficial rather than universally superior: it is most defensible when group membership is retained, regularization is validation-supported, and output granularity is controlled
Keywords:
protein complexes
; higher-order networks
; hypergraphs
; spectral clustering
; held-out benchmarking
; matched-k comparison
; Gene Ontology
1. Introduction
Protein complexes coordinate transcription, signalling, metabolism, transport, and many other cellular processes. Computational recovery of these assemblies remains difficult because molecular-interaction data are incomplete, heterogeneous, noisy, and dependent on the representation used before clustering. IntAct provides expert-curated molecular-interaction records under the International Molecular Exchange framework and distributes thematic collections in PSI-MITAB format (del Toro et al. 2022; Orchard et al. 2014, 2012). Most complex-detection pipelines transform these records into pairwise protein-protein interaction (PPI) graphs and search for dense, flow-coherent, or modular subgraphs. Graph methods remain strong baselines: MCL is robust under several perturbation regimes, while the relative performance of MCL, spectral clustering, and neighbourhood-based methods changes with the benchmark and metric (Brohée and van Helden 2006; Moschopoulos et al. 2011; Wu et al. 2020).
The pairwise abstraction is nevertheless lossy for affinity-purification/mass-spectrometry, co-immunoprecipitation, and curated co-complex evidence. One experiment may identify a bait together with multiple associated proteins, whereas clique expansion converts that group into many pairwise edges, removes the identity of the originating experiment, and can make large groups dominate the projected graph. Bipartite and hypergraph models were proposed to retain complex-protein incidence structure (Ding et al. 2004; Lee et al. 2011; Ramadan 2008; Ramadan et al. 2004). Incidence-based AP-MS pipelines such as CODEC, bait-clustering methods, and CACHET reported large gains over projected-graph baselines (Cai et al. 2012; Geva and Sharan 2011; Wu et al. 2012). Those comparisons are biologically important, but they simultaneously change the representation, scoring rule, search objective, overlap policy, and effective number of clusters. Consequently, they do not identify how much performance is attributable specifically to higher-order representation.
Explicit higher-order studies also suggest a task-dependent rather than universal advantage. Hypergraphlets capture functional information beyond graphlets (Gaudelet et al. 2018); higher-order motifs improve protein-module recovery on several but not all networks (Hu et al. 2021); and hypergraph learning can improve selected neural graph baselines when sequence features and supervision are included (Xia et al. 2024). In a cleaner operator-level setting outside protein-complex recovery, hypergraph-native spectral methods outperform clique-projected spectral clustering when hyperedge sizes encode distinctive community information (Chodrow et al. 2023). Conversely, representation-aware analyses show that hypergraph, bipartite, and projected descriptions can produce different modules, hub rankings, and computational costs without guaranteeing that one representation dominates every downstream objective (Eriksson et al. 2021; Klimm et al. 2021).
Evaluation design is a second source of ambiguity. A complex used to build the representation should not also determine tuning and reported performance. Cluster count is especially consequential because a method returning hundreds of small communities is not directly comparable with a method constrained to 15 clusters. In addition, benchmark complexes can be sample-dependent, and fully assembled reference complexes may not match the subcomplexes present in a particular experiment (Teng et al. 2015; Yang et al. 2025). A defensible graph-hypergraph comparison must therefore control the input groups, the vertex universe, output granularity, model selection, and test data.
This study asks a narrow question: when identical training hyperedges and identical cluster counts are used, does a hypergraph operator improve recovery of held-out experiment-derived protein groups relative to an inverse-size-weighted clique graph? We compare graph spectral clustering, the unregularized Zhou hypergraph operator (Zhou et al. 2007), and a degree-aware penalized hypergraph operator. The design uses size-stratified train/validation/test splits, validation-only regularization, 25 paired initializations, structural null models, graph baselines with native granularity, and stability-medoid partitions for functional interpretation. The contribution is not a claim that one representation universally solves protein-complex detection. Rather, it is a controlled estimate of when higher-order incidence information and degree-aware regularization alter held-out recovery within the same spectral family.
2. Materials and Methods
2.1. Study Design and Leakage Control
Each dataset was converted from interaction records into experiment-level protein groups. Hyperedges were split into training, validation, and test sets with a fixed random seed and stratification by cardinality: size 2-3, size 4-6, and size greater than 6. The nominal split fractions were 0.60/0.20/0.20. Training hyperedges defined the protein universe and were the only groups used to construct graph and hypergraph operators. Validation and test hyperedges were restricted to proteins observed in training, and groups with fewer than two retained proteins were excluded. Validation data selected the hypergraph penalty and a validation-optimal cluster count. Test groups were not accessed until final scoring. The workflow is summarized in Figure 1.
2.2. Data Sources and Group Reconstruction
Nine target-specific collections were analysed as archived IntAct-derived PSI-MITAB 2.7 snapshots: Affinomics, BioCreative, Cancer, Cardiac, Chromatin, Coronavirus, Crohn’s disease, Cyanobacteria, and Diabetes (del Toro et al. 2013, 2022). IntAct is a continuously curated IMEx platform rather than an immutable benchmark; therefore, file checksums, retrieval metadata, and the archived snapshots define the reproducible inputs (Orchard et al. 2012, 2007; Porras et al. 2020). The Coronavirus collection additionally reflects the dedicated IMEx coronavirus curation effort (Perfetto et al. 2020).
UniProt identifiers were canonicalized, and isoform suffixes were collapsed. Taxonomy identifiers were ranked by occurrence across both interactors; the three most frequent taxonomies in each collection were retained, and an interaction survived when at least one interactor belonged to a retained taxonomy. Rows were treated as group-forming when their metadata represented physical association, spoke or matrix expansion, or a bait role. Records were grouped by publication, host, interaction type, expansion method, and bait. The union of proteins within each key formed one hyperedge; hyperedges with fewer than two proteins were removed.
2.3. Graph and Hypergraph Operators
Let denote the training hyperedges over vertices . Both representations were constructed from this same set.
Inverse-size clique graph.
Each hyperedge contributed to every internal pair with weight :
This scaling makes the total weighted degree contributed to each member by a hyperedge independent of hyperedge size. With , the normalized graph Laplacian was
Hypergraph operators.
Let be the incidence matrix, the diagonal vertex-degree matrix, the diagonal matrix of hyperedge sizes, and the hyperedge-weight matrix. The normalized Zhou operator was (Zhou et al. 2007)
The penalized family added a low-degree-sensitive diagonal term,
The penalty is largest for vertices supported by few training hyperedges and is zero-equivalent to the standard Zhou operator when .
2.4. Spectral Clustering and Model Selection
For each Laplacian, the smallest non-trivial eigenvectors were computed with sparse symmetric eigensolvers. The embedding rows were normalized to unit length and clustered with k-means using 10 internal starts. Twenty-five external random seeds (42-66) were evaluated for each spectral operator. Downstream clustering was identical after operator construction.
The validation search evaluated and , selecting the pair with the highest validation symmetric best-match ; ties favoured the smaller penalty and then the smaller k. In the primary matched-k experiment, all three spectral operators received
which yielded for eight datasets and for Crohn’s disease. This comparison isolates the operator at a common granularity. A separate practical analysis allowed graph and penalized-hypergraph operators to select k from their eigengaps. The test split was not used to select or k.
2.5. Evaluation Metrics and Statistical Analysis
The primary endpoint was symmetric best-match (). For every predicted cluster, its maximum against a held-out test hyperedge was size-weighted; the reverse gold-to-prediction score was computed analogously, and the two directions were averaged. Secondary measures were pairwise precision/recall/, overlapping , normalized mutual information (NMI), adjusted Rand index (ARI), and mean held-out hyperedge recovery .
Graph and penalized-hypergraph outcomes were paired by dataset and external seed. Within each dataset, two-sided Wilcoxon signed-rank tests quantified sensitivity to stochastic initialization, rank-biserial correlations summarized direction and magnitude, and paired bootstrap intervals summarized the mean difference. The nine within-dataset p-values were adjusted by the Benjamini-Hochberg procedure (Benjamini and Hochberg 1995; Wilcoxon 1945). These tests characterize algorithmic stability within each archived dataset; they do not create nine biological replicates from the 25 seeds. Generalization across datasets was assessed separately with a Friedman test and Nemenyi post-hoc comparisons over the three matched-k spectral operators (Demšar 2006).
2.6. Graph Baselines and Structural Null Models
Louvain, Leiden, and MCL were evaluated on the weighted clique graph with their native numbers of communities (Blondel et al. 2008; Enright et al. 2002; Traag et al. 2019). Louvain and Leiden used five seeds; MCL was deterministic in the implemented configuration and was run once. Because their cluster counts differ markedly from matched-k spectral clustering, these methods provide practical context rather than a representation-controlled inferential comparison.
Two randomized controls were processed through the same held-out evaluation. The degree-preserving graph null rewired the clique graph while retaining degree structure. The hyperedge-size-preserving null retained the observed cardinality sequence but randomized protein membership. Ten seeds were generated for each null and dataset. These controls test whether recovery is explained only by low-order degree or hyperedge-size distributions.
2.7. Gene Ontology Coherence and Semantic Reduction
Functional analysis used the stability-medoid partition for each of graph spectral and penalized hypergraph clustering: the seed with the highest mean pairwise ARI to all other seed partitions. Direct GO cross-references parsed from PSI-MITAB were canonicalized against the frozen GO Basic release dated 19 May 2026 (SHA-256 recorded in the run manifest). The primary analysis propagated annotations through is_a and part_of; a sensitivity analysis included the regulatory relations permitted by GO Basic. GO Basic is acyclic and is intended for safe upward propagation in annotation tools (The Gene Ontology Consortium 2026).
Biological process (BP), cellular component (CC), and molecular function (MF) were analysed separately. Graph and hypergraph partitions used the same annotated protein background. One-sided hypergeometric tests were applied per cluster and aspect to terms represented by at least five background proteins and at least two cluster proteins. Benjamini-Hochberg FDR was controlled within dataset × operator × aspect at . Across-dataset inference used the dataset as the independent unit and exact sign-flip tests with BH correction across the nine aspect-metric combinations.
Redundant significant terms were summarized with a local REVIGO-style procedure (Supek et al. 2011). Dataset-specific information content was estimated from propagated background annotations, Lin semantic similarity was computed within each aspect (Lin 1998), and the union of graph and hypergraph terms was jointly reduced by average-linkage clustering at similarity 0.70. One representative per semantic group was selected deterministically using q-value, recurrence, fold enrichment, and GO identifier. Classical multidimensional scaling embedded the joint term set, ensuring that graph-only, hypergraph-only, and shared terms were displayed in the same coordinate system. Functional enrichment was interpreted as coherence, not as independent biological ground truth, because GO and interaction curation can share provenance (Klopfenstein et al. 2018; Wadi et al. 2016).
3. Results
3.1. The Benchmark Spans Small, Dense Group Collections and Large Sparse Interactomes
The nine datasets contained 144-6,952 reconstructed groups before splitting and 71-5,481 proteins in their training universes (Table 1). After restriction to the training vertex universe, 21-1,242 validation and 24-1,238 test hyperedges remained evaluable. Direct GO coverage ranged from 0.856 to 0.971. Validation selected a non-zero penalty in six datasets, ranging from to 10, and selected in Affinomics, Cancer, and Cardiac. The stability-medoid partitions used for GO analysis were reproducible for most datasets: mean pairwise seed ARI ranged from 0.82 to 1.00 for seven datasets, while BioCreative was less stable, particularly for the graph partition (0.50).
3.2. Penalized Hypergraph Recovery Improves in Six Datasets, But Not Universally
At matched k, penalized-hypergraph mean exceeded graph spectral clustering on seven of nine datasets, with six differences surviving BH correction (Table 2; Figure 2). The largest improvement occurred in Chromatin (, 95% paired-bootstrap CI 0.0334-0.0374, rank-biserial ). Cyanobacteria (), Affinomics (), Coronavirus (), Crohn’s disease (), and Diabetes () also improved. BioCreative showed a small, non-significant increase (, ), and Cardiac a small, non-significant decrease (, ). Cancer was the only significant negative case, but the absolute difference was (), occurring at a low performance floor.
The positive pattern should not be interpreted as across-dataset proof of universal superiority. The penalized hypergraph had the lowest mean rank (1.39), followed by the unregularized hypergraph (2.28) and graph spectral clustering (2.33), but the Friedman test was not significant (, ). The Nemenyi p-value was 0.111 for penalized hypergraph versus graph and 0.143 for penalized versus unregularized hypergraph (Figure 3). Thus, the final run supports strong dataset-specific gains and a favourable rank trend, not a representation-independent ordering across biological collections.
3.3. Regularization Explains Several Gains, But Representation and Penalty Are Not Separable in Every Dataset
Validation selected non-zero for six datasets (Figure 4a). Penalization produced large increments over the unregularized hypergraph in Chromatin (0.243 versus 0.209), Coronavirus (0.245 versus 0.234), Crohn’s disease (0.544 versus 0.526), and Cyanobacteria (0.494 versus 0.473), and it rescued the lower unregularized result in BioCreative (0.194 versus 0.184). Diabetes was different: the unregularized operator achieved the highest mean (0.240), while the validation-selected penalty reduced it to 0.236, still above the graph mean of 0.226. Affinomics selected and therefore represents a higher-order gain without penalization. The most accurate conclusion is consequently that degree-aware regularization is an important, dataset-dependent component of the higher-order pipeline, not that the hypergraph representation or the penalty alone is sufficient in all settings.
Secondary metrics reinforced the conditional interpretation. NMI increased for the penalized hypergraph in eight datasets and ARI in seven, but pairwise improved only in Affinomics and Chromatin and declined in several datasets with broad or overlapping reference groups. Mean held-out hyperedge recovery improved in Affinomics, BioCreative, Coronavirus, Crohn’s disease, Cyanobacteria, and Diabetes, but decreased slightly in Cancer, Cardiac, and Chromatin. Best-match is therefore the most favourable view of the penalized operator; alternative metrics emphasize different aspects of cluster size, overlap, and granularity.
3.4. Observed Signal Exceeds Randomized Structure on Eight Datasets
The observed penalized-hypergraph result exceeded both randomized controls in eight of nine datasets (Figure 4b). The margin was large in Chromatin (0.243 observed versus 0.079 degree-rewire and 0.087 hyperedge-size-preserving), Coronavirus (0.245 versus 0.066 and 0.070), Cyanobacteria (0.494 versus 0.173 and 0.176), and Diabetes (0.236 versus 0.061 and 0.052). Cancer was the exception: observed recovery (0.0475) was comparable to the degree-preserving null (0.0490) and only modestly above the hyperedge-size null (0.0373). This confirms that the Cancer graph-hypergraph difference occurs at a structural floor rather than between two high-recovery solutions.
3.5. Eigengap Selection Is Less Reliable for the Hypergraph Operator
When each spectral method selected its own k by eigengap, the graph exceeded the penalized hypergraph in six datasets, the methods were nearly tied in Cardiac, the hypergraph was slightly higher in Cancer, and Cyanobacteria strongly favoured the hypergraph. The largest failures occurred when the hypergraph eigengap selected very coarse partitions: in Chromatin (), in Coronavirus (), in Crohn’s disease (), and in Diabetes (). By contrast, the graph selected on average in Chromatin, 8 in Coronavirus, 14 in Crohn’s disease, and 15 in Diabetes. Cyanobacteria reversed the pattern: the graph selected (), whereas the hypergraph selected (). These results separate two questions. At matched granularity, the penalized operator is often advantageous; under an unsupervised eigengap rule, the complete hypergraph pipeline is less reliable.
3.6. Native Graph Methods Show That Output Granularity Can Dominate Absolute Recovery
Louvain and Leiden returned 13-141 communities, while MCL returned 16-3,426 clusters depending on dataset. These methods exceeded the matched-k spectral operators on most collections, particularly Affinomics (MCL 0.410), BioCreative (0.523), Cancer (0.237), Cardiac (0.319), Chromatin (0.371), and Crohn’s disease (0.552). MCL was lower on Coronavirus (0.188) and Cyanobacteria (0.365), where Louvain/Leiden were stronger. The baseline comparison does not invalidate the operator experiment: it demonstrates that unconstrained output granularity can have a larger effect on absolute complex recovery than the graph–hypergraph operator difference. Claims of superiority therefore remain restricted to the matched-k spectral comparison.
3.7. GO Coherence Is High for Both Operators and Does Not Explain Structural Gains
Across BP, CC, and MF, most eligible clusters in the medium and large datasets contained at least one significant term, whereas Crohn’s disease and Diabetes were less uniformly enriched. Dataset-specific graph-hypergraph differences were mixed (Figure 5a). Exact across-dataset tests found no difference that survived BH correction across the nine aspect-metric combinations (Figure 5b). The strongest unadjusted pattern was lower BP protein coverage for the hypergraph (exact sign-flip ), but the corrected value was 0.281. MF cluster and protein coverage also tended to be lower, with corrected for both. CC differences were centred near zero.
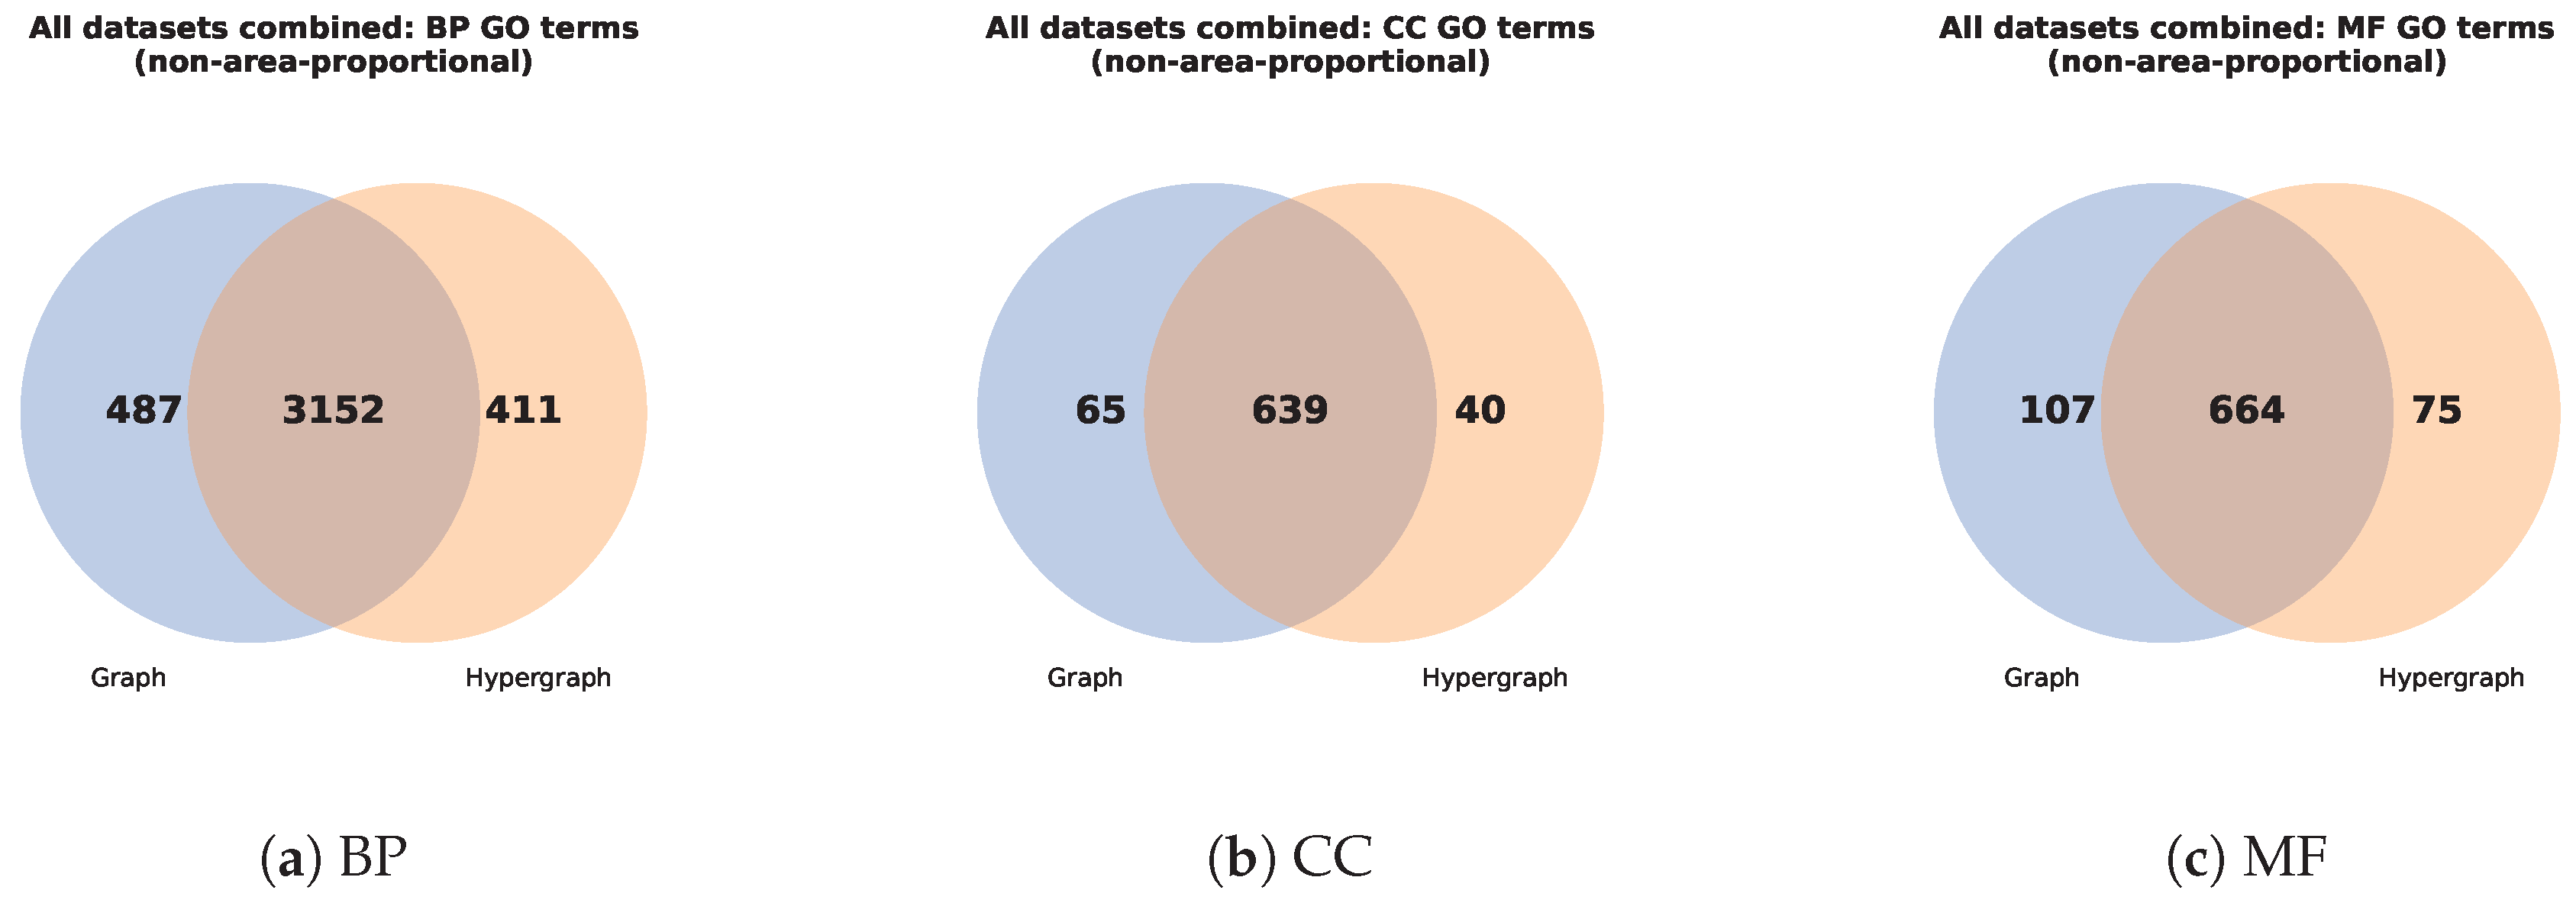
The two representations nevertheless recovered substantially overlapping functional vocabularies. Pooled significant-term Jaccard similarity was 0.778 for BP, 0.859 for CC, and 0.785 for MF. Shared terms outnumbered operator-specific terms in all aspects: 3,152 shared BP terms versus 487 graph-only and 411 hypergraph-only; 639 shared CC terms versus 65 and 40; and 664 shared MF terms versus 107 and 75 (Figure 5c). These pooled counts are descriptive because GO terms are hierarchically dependent. Joint semantic maps likewise showed broad overlap with local operator-specific branches rather than wholesale functional separation (Figure 6). Functional coherence therefore validates both partitions but does not account for the matched-k recovery gains.
4. Discussion
4.1. A Conditional Higher-Order Advantage
The final benchmark yields a deliberately narrower conclusion than many whole-pipeline incidence studies. Penalized hypergraph clustering improved primary held-out recovery in six datasets after correction for seed-paired comparisons, with mean gains up to 0.0356, but it was neutral in two and marginally lower in Cancer. The across-dataset omnibus test did not cross the conventional 0.05 threshold. This combination is important: the repeated-seed results show that several improvements are stable within specific archived collections, while the nine-dataset analysis does not establish universal superiority over new datasets.
The effect sizes are smaller than gains reported by CODEC, CACHET, and related incidence pipelines (Cai et al. 2012; Geva and Sharan 2011; Wu et al. 2012). That difference is expected. Those methods replace the representation, reliability model, search objective, overlap policy, and granularity simultaneously. The present design changes the operator while matching the input hyperedges and cluster count. It estimates the incremental value of a particular higher-order spectral representation, not the benefit of an entirely redesigned AP-MS pipeline.
4.2. Regularization, Group Structure, and Dataset Scale
The results show that higher-order representation and degree-aware regularization interact. Affinomics improved with , demonstrating that incidence structure alone can matter. Chromatin, Coronavirus, Crohn’s disease, and Cyanobacteria gained substantially when a non-zero penalty was applied, whereas Diabetes performed best without the selected penalty. BioCreative illustrates a different role: regularization restored performance from below the graph baseline to statistical parity. A practical workflow should therefore retain in the validation grid and report both the unregularized and selected operators.
The largest positive differences occurred in datasets with repeated group structure or validation-supported regularization, whereas Cancer remained at a null-like floor and Cardiac was neutral. The correlations between improvement and protein count, training-hyperedge count, or selected penalty were moderate and non-significant with only nine datasets; mechanistic claims from those correlations would be premature. Still, the pattern is consistent with prior theory showing that hypergraph methods benefit when hyperedge organization carries information not captured by a projected graph (Chodrow et al. 2023). It also aligns with the observation that clique projection can change biological topology without ensuring that every hypergraph objective is superior (Klimm et al. 2021).
4.3. Granularity Is a First-Order Modeling Decision
The adaptive-k and native-baseline analyses expose the central role of output granularity. Eigengap selection produced severe under-partitioning for the hypergraph operator in several datasets, eliminating matched-k gains. Conversely, MCL, Louvain, and Leiden often achieved higher absolute recovery by returning many more communities. A fair representation experiment must therefore match k, but a practical complex detector should optimize granularity using validation data and may require overlapping clusters. Fixed is intentionally a controlled operator setting, not a claim of optimal biological resolution for networks containing thousands of proteins.
Metric dependence further reinforces this point. Symmetric best-match rewards close local matches in both prediction-to-reference and reference-to-prediction directions. Pairwise penalizes large within-cluster pair sets and therefore favours different size distributions. NMI and ARI require a hard reference assignment even though test complexes overlap. The mixed secondary metrics do not invalidate the primary endpoint, but they show that no single score fully characterizes protein-complex recovery. A Q1-standard benchmark should report multiple metrics and state which one determined the primary inference.
4.4. Functional Similarity Despite Structural Differences
GO analysis did not separate the operators. Most medium and large datasets produced highly enriched partitions under both graph and hypergraph models, no aspect-level difference survived multiplicity correction, and pooled term overlap was high. This result is biologically plausible: alternative partitions can divide a functionally coherent protein set differently while retaining similar broad annotations. It also cautions against treating the number of significant GO terms as an independent accuracy measure. GO terms are nested and dependent, enrichment is sensitive to cluster size, and interaction curation may share evidence sources with annotations. The semantic maps are therefore interpretive summaries rather than a second gold standard.
The primary is_a+part_of analysis and the broader GO-Basic relation sensitivity analysis led to the same qualitative conclusion: functional coherence was high and no general graph-hypergraph difference emerged. Freezing and checksumming the ontology release is important because enrichment results can change as ontologies and annotations evolve (The Gene Ontology Consortium 2026; Wadi et al. 2016).
4.5. Limitations
Several limitations constrain the scope of the conclusions. First, the benchmark evaluates one normalized hypergraph family and one diagonal penalty; nonbacktracking operators, learned hyperedge weights, tensor methods, and overlapping hypergraph objectives may behave differently. Second, the 25 seeds quantify stochastic optimization stability, not biological replication. The across-dataset test has only nine units and limited power, while the datasets are heterogeneous thematic collections rather than samples from one population. Third, training-universe restriction removes test proteins unseen in training and therefore evaluates recovery conditional on observed vertices. Fourth, the fixed matched-k rule under-segments the largest interactomes, whereas native graph methods use much finer granularity. Fifth, reference hyperedges reconstructed from curation metadata are not guaranteed to represent complete in vivo complexes, and benchmark assemblies may be context-specific (Yang et al. 2025). Sixth, GO enrichment is not independent of curation provenance and should not be interpreted causally.
Finally, the thematic IntAct collections are living resources. Dataset names alone are insufficient for reproduction; the archived input files, checksums, preprocessing configuration, software versions, and frozen ontology release must accompany the paper. The supplied run manifest records these elements, including Python 3.12 and the versions of NumPy, SciPy, pandas, scikit-learn, NetworkX, igraph, Leiden, and MCL used in the completed analysis.
4.6. Implications and Future Work
For controlled spectral clustering, an inverse-size clique graph is a strong default. A penalized hypergraph is justified when experiment-level group membership is available, validation supports the selected regularization, and matched-granularity evaluation shows a stable benefit. The unregularized hypergraph should remain an explicit ablation. In deployment, cluster count should be selected on validation data rather than by an unverified eigengap rule, and overlapping outputs should be considered because biological complexes share proteins.
The most informative extensions are: (i) overlapping graph and hypergraph clustering under matched output-complex counts; (ii) validation of nonbacktracking and alternative normalized hypergraph operators; (iii) evidence-weighted hyperedges that use experimental confidence without test leakage; (iv) evaluation on canonical AP-MS benchmarks used by incidence methods under the same held-out splits; and (v) decomposition of modern hypergraph neural systems into representation, sequence features, supervision, and architecture (Xia et al. 2024). These experiments would distinguish whether larger reported gains arise from higher-order structure itself or from the broader learning pipeline.
5. Conclusion
A leakage-controlled, matched-k comparison shows that higher-order modeling can improve held-out protein-group recovery, but not as a universal rule. The validation-selected penalized hypergraph produced six significant positive within-dataset differences, two neutral outcomes, and one small negative outcome relative to graph spectral clustering. Its mean rank was best, yet the across-dataset omnibus comparison was non-significant, secondary metrics were mixed, and unsupervised eigengap selection was unreliable in several datasets. Structural nulls confirmed non-random signal in eight datasets, while GO analysis showed high and substantially overlapping functional coherence for both representations. The defensible recommendation is conditional: preserve incidence structure and validate degree-aware regularization when group evidence is informative, but retain the weighted graph as a strong baseline, control cluster granularity, and report neutral and negative datasets alongside positive results.
Author Contributions
Kazi Hafiz Md Asad: Conceptualization, Methodology, Software, Formal Analysis, Investigation, Data Curation, Visualization, Project Administration, Writing-Original Draft, Writing-Review & Editing. Rafi Majid: Validation, Writing-Review & Editing. Md Tanjeelur Rahman Labib: Validation, Writing-Review & Editing. Ahsanur Rahman: Supervision, Conceptualization, Resources, Funding Acquisition, Writing-Review & Editing.
Funding
This research received no specific grant from any funding agency in the public, commercial, or not-for-profit sectors. The study originated as an extended course project and was subsequently developed into a full research investigation based on the authors’ academic interest in the topic.
Data and Code Availability
The complete computational workflow, final configuration, processed tables, vector figures, per-seed metrics, structural controls, run manifests, input checksums, and frozen GO-release metadata are contained in the accompanying research archive, available at https://github.com/donnowhattodo/graph-vs-hypergraph-protein-complexes. The repository is currently private and will be made publicly available upon publication. Supplementary analysis files, including GO enrichment tables, cluster assignment CSVs, and REVIGO summarization outputs, are available at https://drive.google.com/drive/folders/1QCUZMTi5fqXoIgLCC077S-y4-99nfEnz?usp=drive_link. IntAct source records remain available from the IntAct/IMEx resources (del Toro et al. 2022; Orchard et al. 2012).
Acknowledgments
The authors acknowledge the Department of Electrical & Computer Engineering at North South University and the maintainers of IntAct, IMEx, and the Gene Ontology resources used in this study.
Ethics Statement
The study analysed publicly available molecular-interaction records and did not involve new human participants, identifiable private information, or animal experimentation.
A. Embedded Supplementary Information
This appendix is included in the review PDF for completeness. It can be separated into a journal-specific supplementary file without changing the main manuscript.
A.1. Adaptive Eigengap Results

Table 3.
Adaptive eigengap-selected spectral clustering. Values are mean held-out best-match ; k is the mean number of clusters over 25 seeds.
Table 3.
Adaptive eigengap-selected spectral clustering. Values are mean held-out best-match ; k is the mean number of clusters over 25 seeds.
| Dataset | Graph | Graph k | Penalized hypergraph | Hypergraph k |
|---|---|---|---|---|
| Affinomics | 0.099 | 6.0 | 0.076 | 4.0 |
| BioCreative | 0.129 | 9.0 | 0.101 | 6.0 |
| Cancer | 0.039 | 9.0 | 0.040 | 9.0 |
| Cardiac | 0.096 | 11.0 | 0.096 | 11.0 |
| Chromatin | 0.198 | 12.4 | 0.104 | 2.0 |
| Coronavirus | 0.196 | 8.0 | 0.120 | 3.0 |
| Crohn’s disease | 0.530 | 14.0 | 0.297 | 6.0 |
| Cyanobacteria | 0.160 | 2.0 | 0.492 | 14.0 |
| Diabetes | 0.220 | 15.0 | 0.064 | 3.0 |
A.2. Native Graph Baselines
Table 4.
Native-granularity graph baselines. Louvain and Leiden are means over five seeds; MCL is one deterministic run. Parentheses show the mean number of clusters.
Table 4.
Native-granularity graph baselines. Louvain and Leiden are means over five seeds; MCL is one deterministic run. Parentheses show the mean number of clusters.
| Dataset | Louvain (k) | Leiden (k) | MCL (k) |
|---|---|---|---|
| Affinomics | 0.320 (54.2) | 0.326 (55.0) | 0.410 (116) |
| BioCreative | 0.484 (94.0) | 0.484 (94.0) | 0.523 (107) |
| Cancer | 0.084 (137.6) | 0.084 (140.8) | 0.237 (3,426) |
| Cardiac | 0.215 (62.8) | 0.219 (63.2) | 0.319 (574) |
| Chromatin | 0.297 (46.8) | 0.305 (48.2) | 0.371 (742) |
| Coronavirus | 0.260 (32.2) | 0.259 (30.8) | 0.188 (2,164) |
| Crohn’s disease | 0.528 (13.0) | 0.528 (13.0) | 0.552 (16) |
| Cyanobacteria | 0.506 (18.0) | 0.506 (18.0) | 0.365 (110) |
| Diabetes | 0.241 (20.0) | 0.241 (20.0) | 0.284 (581) |
A.3. GO Aspect-Level Statistics
Table 5.
Across-dataset GO comparisons using exact sign-flip tests and BH correction. Differences are hypergraph minus graph.
Table 5.
Across-dataset GO comparisons using exact sign-flip tests and BH correction. Differences are hypergraph minus graph.
| Aspect | Metric | Graph median | Hypergraph median | Median difference | BH-adjusted p |
|---|---|---|---|---|---|
| BP | Enriched eligible clusters (%) | 100.0 | 93.3 | 0.0 | 0.281 |
| BP | Proteins in enriched clusters (%) | 97.3 | 96.7 | -0.31 | 0.281 |
| BP | Significant unique terms | 721 | 746 | 16 | 0.848 |
| CC | Enriched eligible clusters (%) | 90.0 | 93.3 | 0.0 | 0.848 |
| CC | Proteins in enriched clusters (%) | 97.3 | 99.5 | 0.0 | 0.750 |
| CC | Significant unique terms | 135 | 158 | -2 | 0.783 |
| MF | Enriched eligible clusters (%) | 100.0 | 93.3 | -6.67 | 0.281 |
| MF | Proteins in enriched clusters (%) | 94.8 | 92.1 | -2.53 | 0.281 |
| MF | Significant unique terms | 94 | 110 | -7 | 0.696 |
A.4. Additional GO Figures
Figure 7.
Overall GO over-representation comparison for stability-medoid graph and hypergraph partitions.
Figure 7.
Overall GO over-representation comparison for stability-medoid graph and hypergraph partitions.
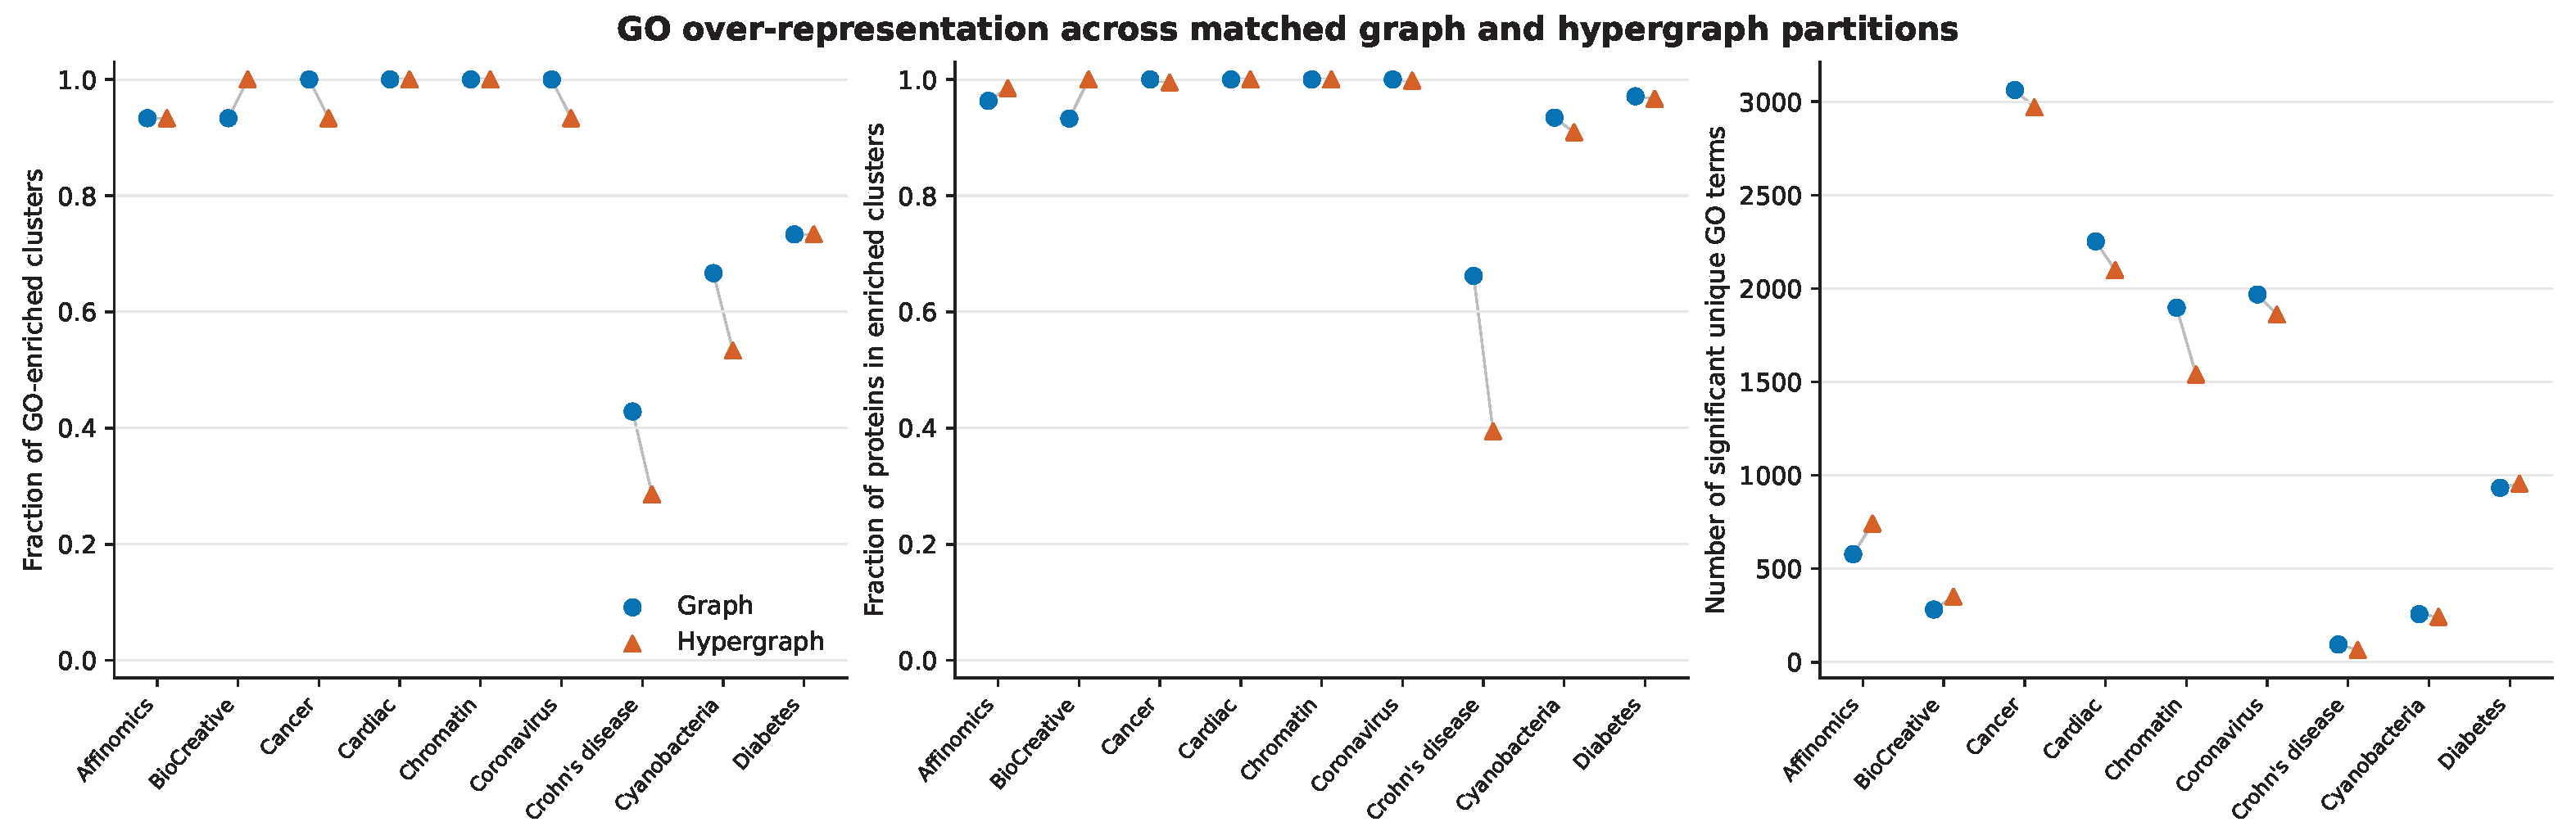
Figure 8.
Joint semantic maps of non-redundant CC terms.
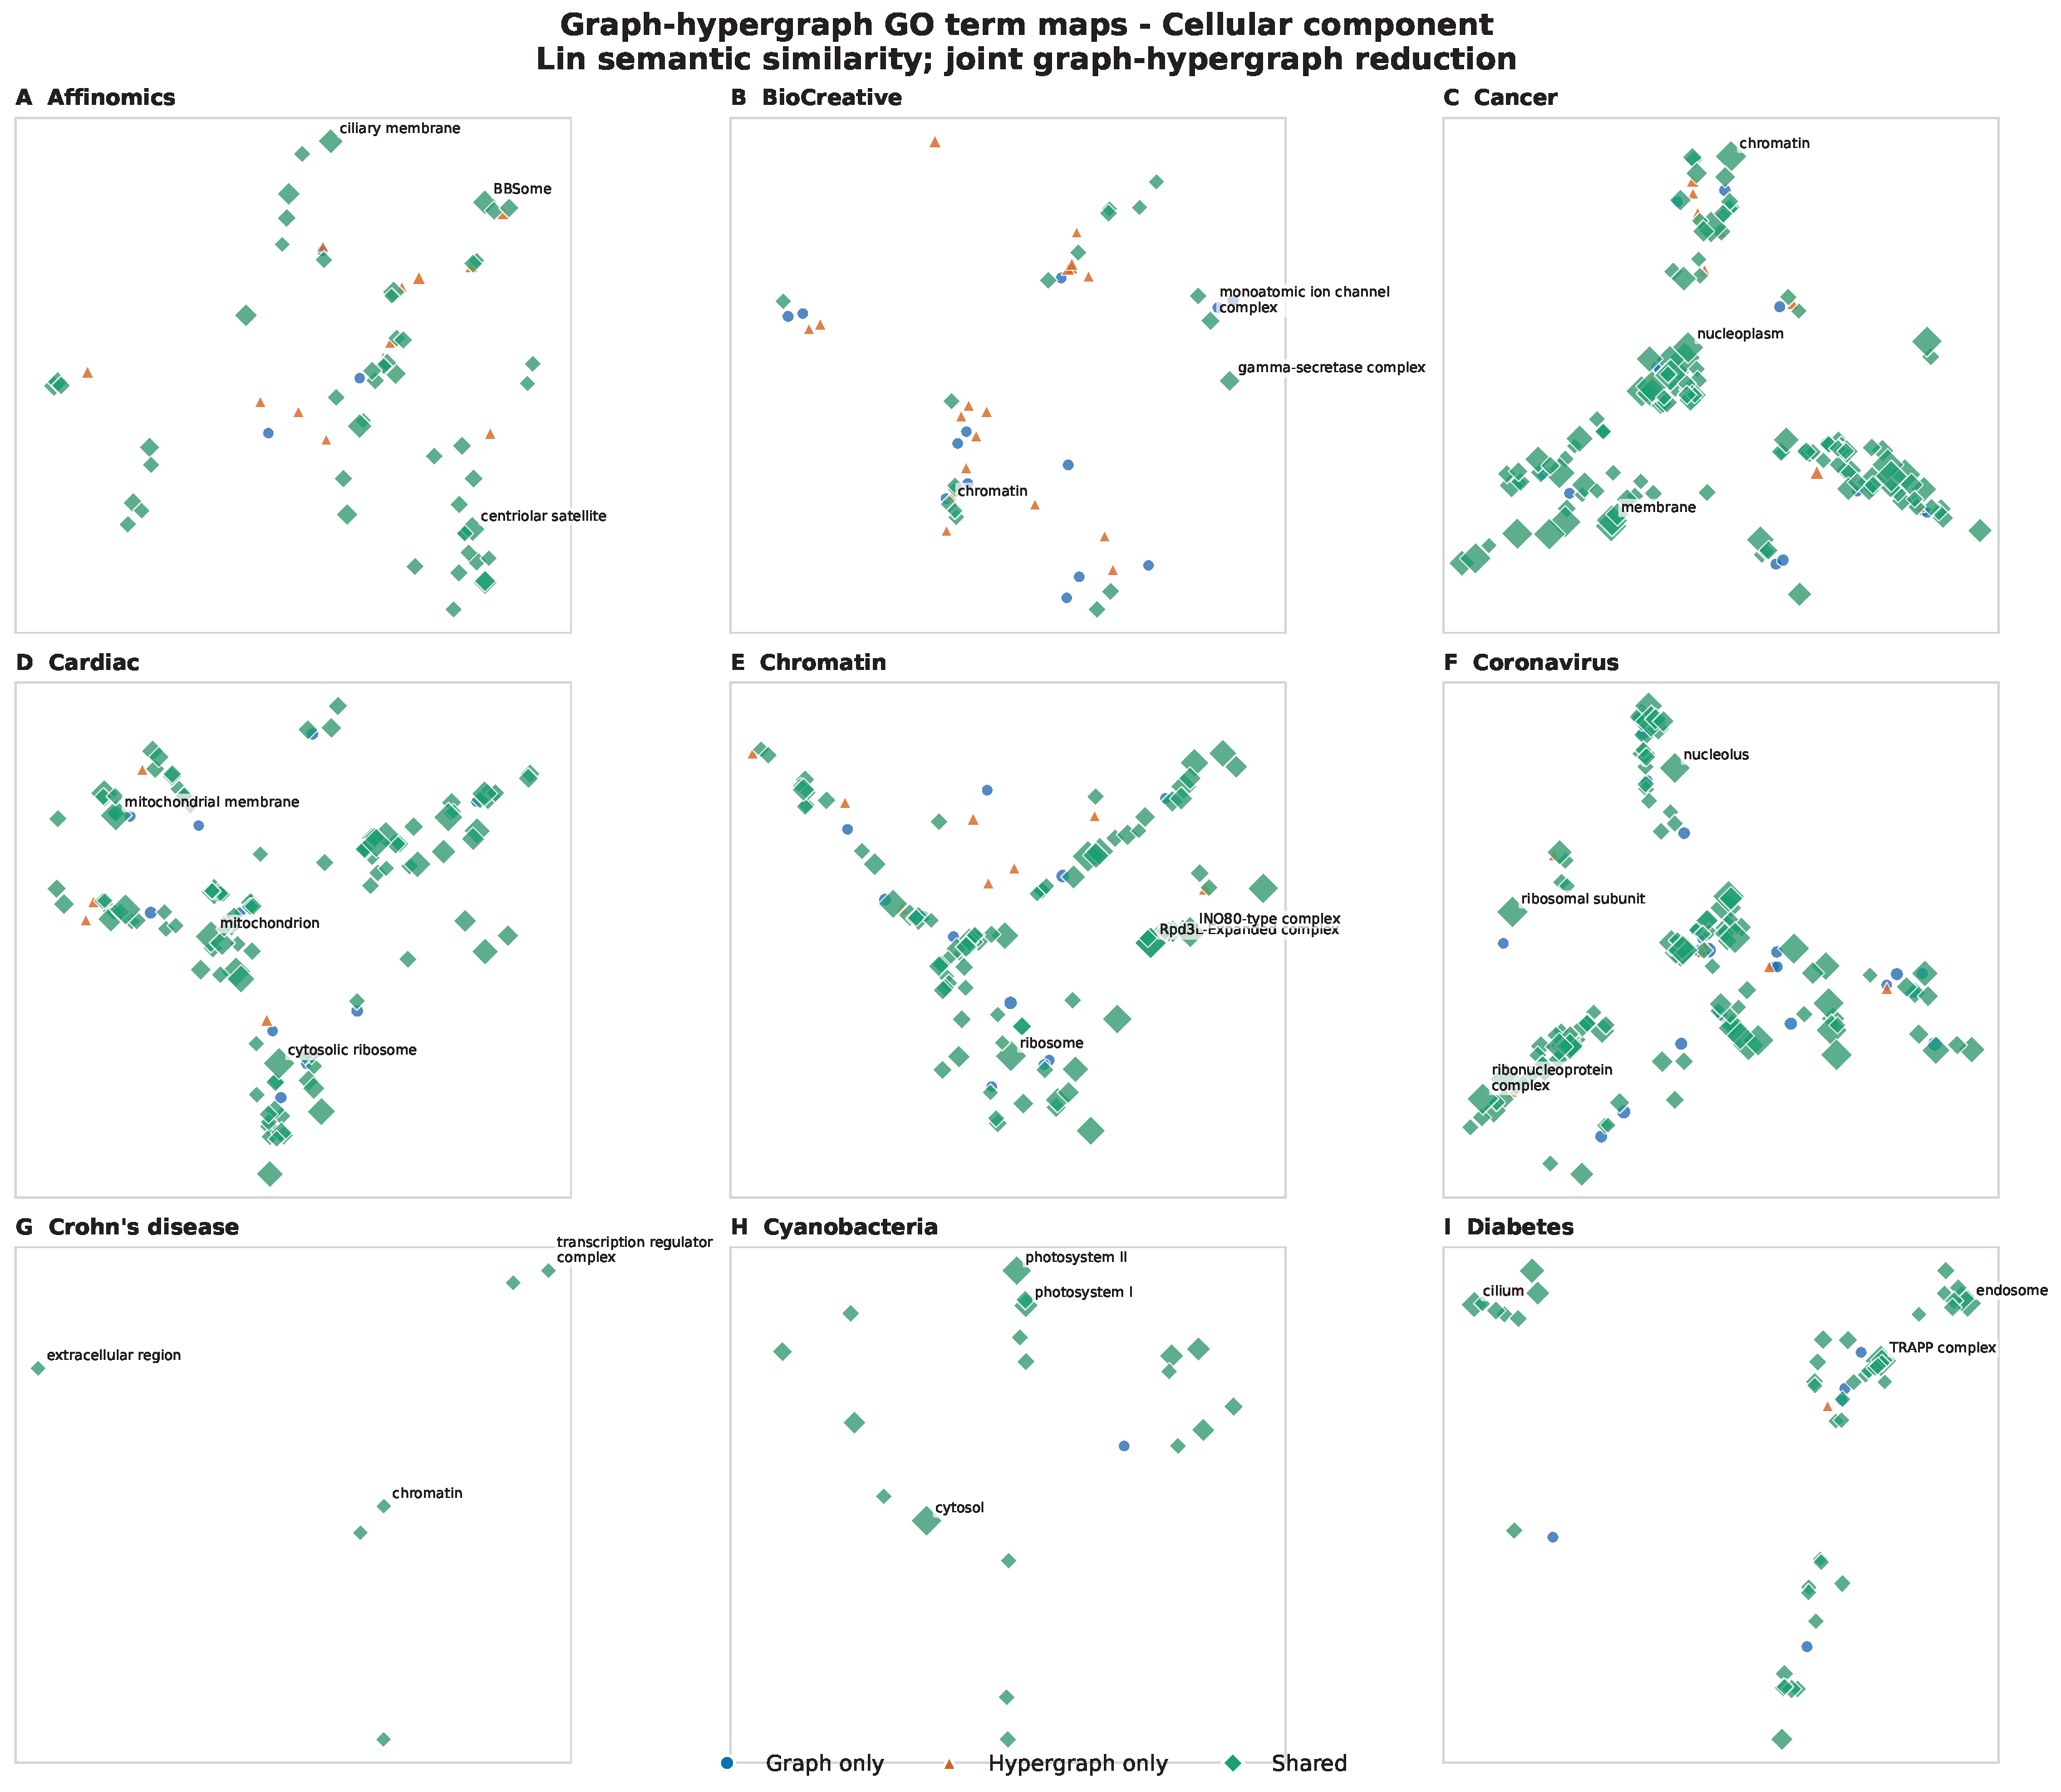
Figure 9.
Joint semantic maps of non-redundant MF terms.
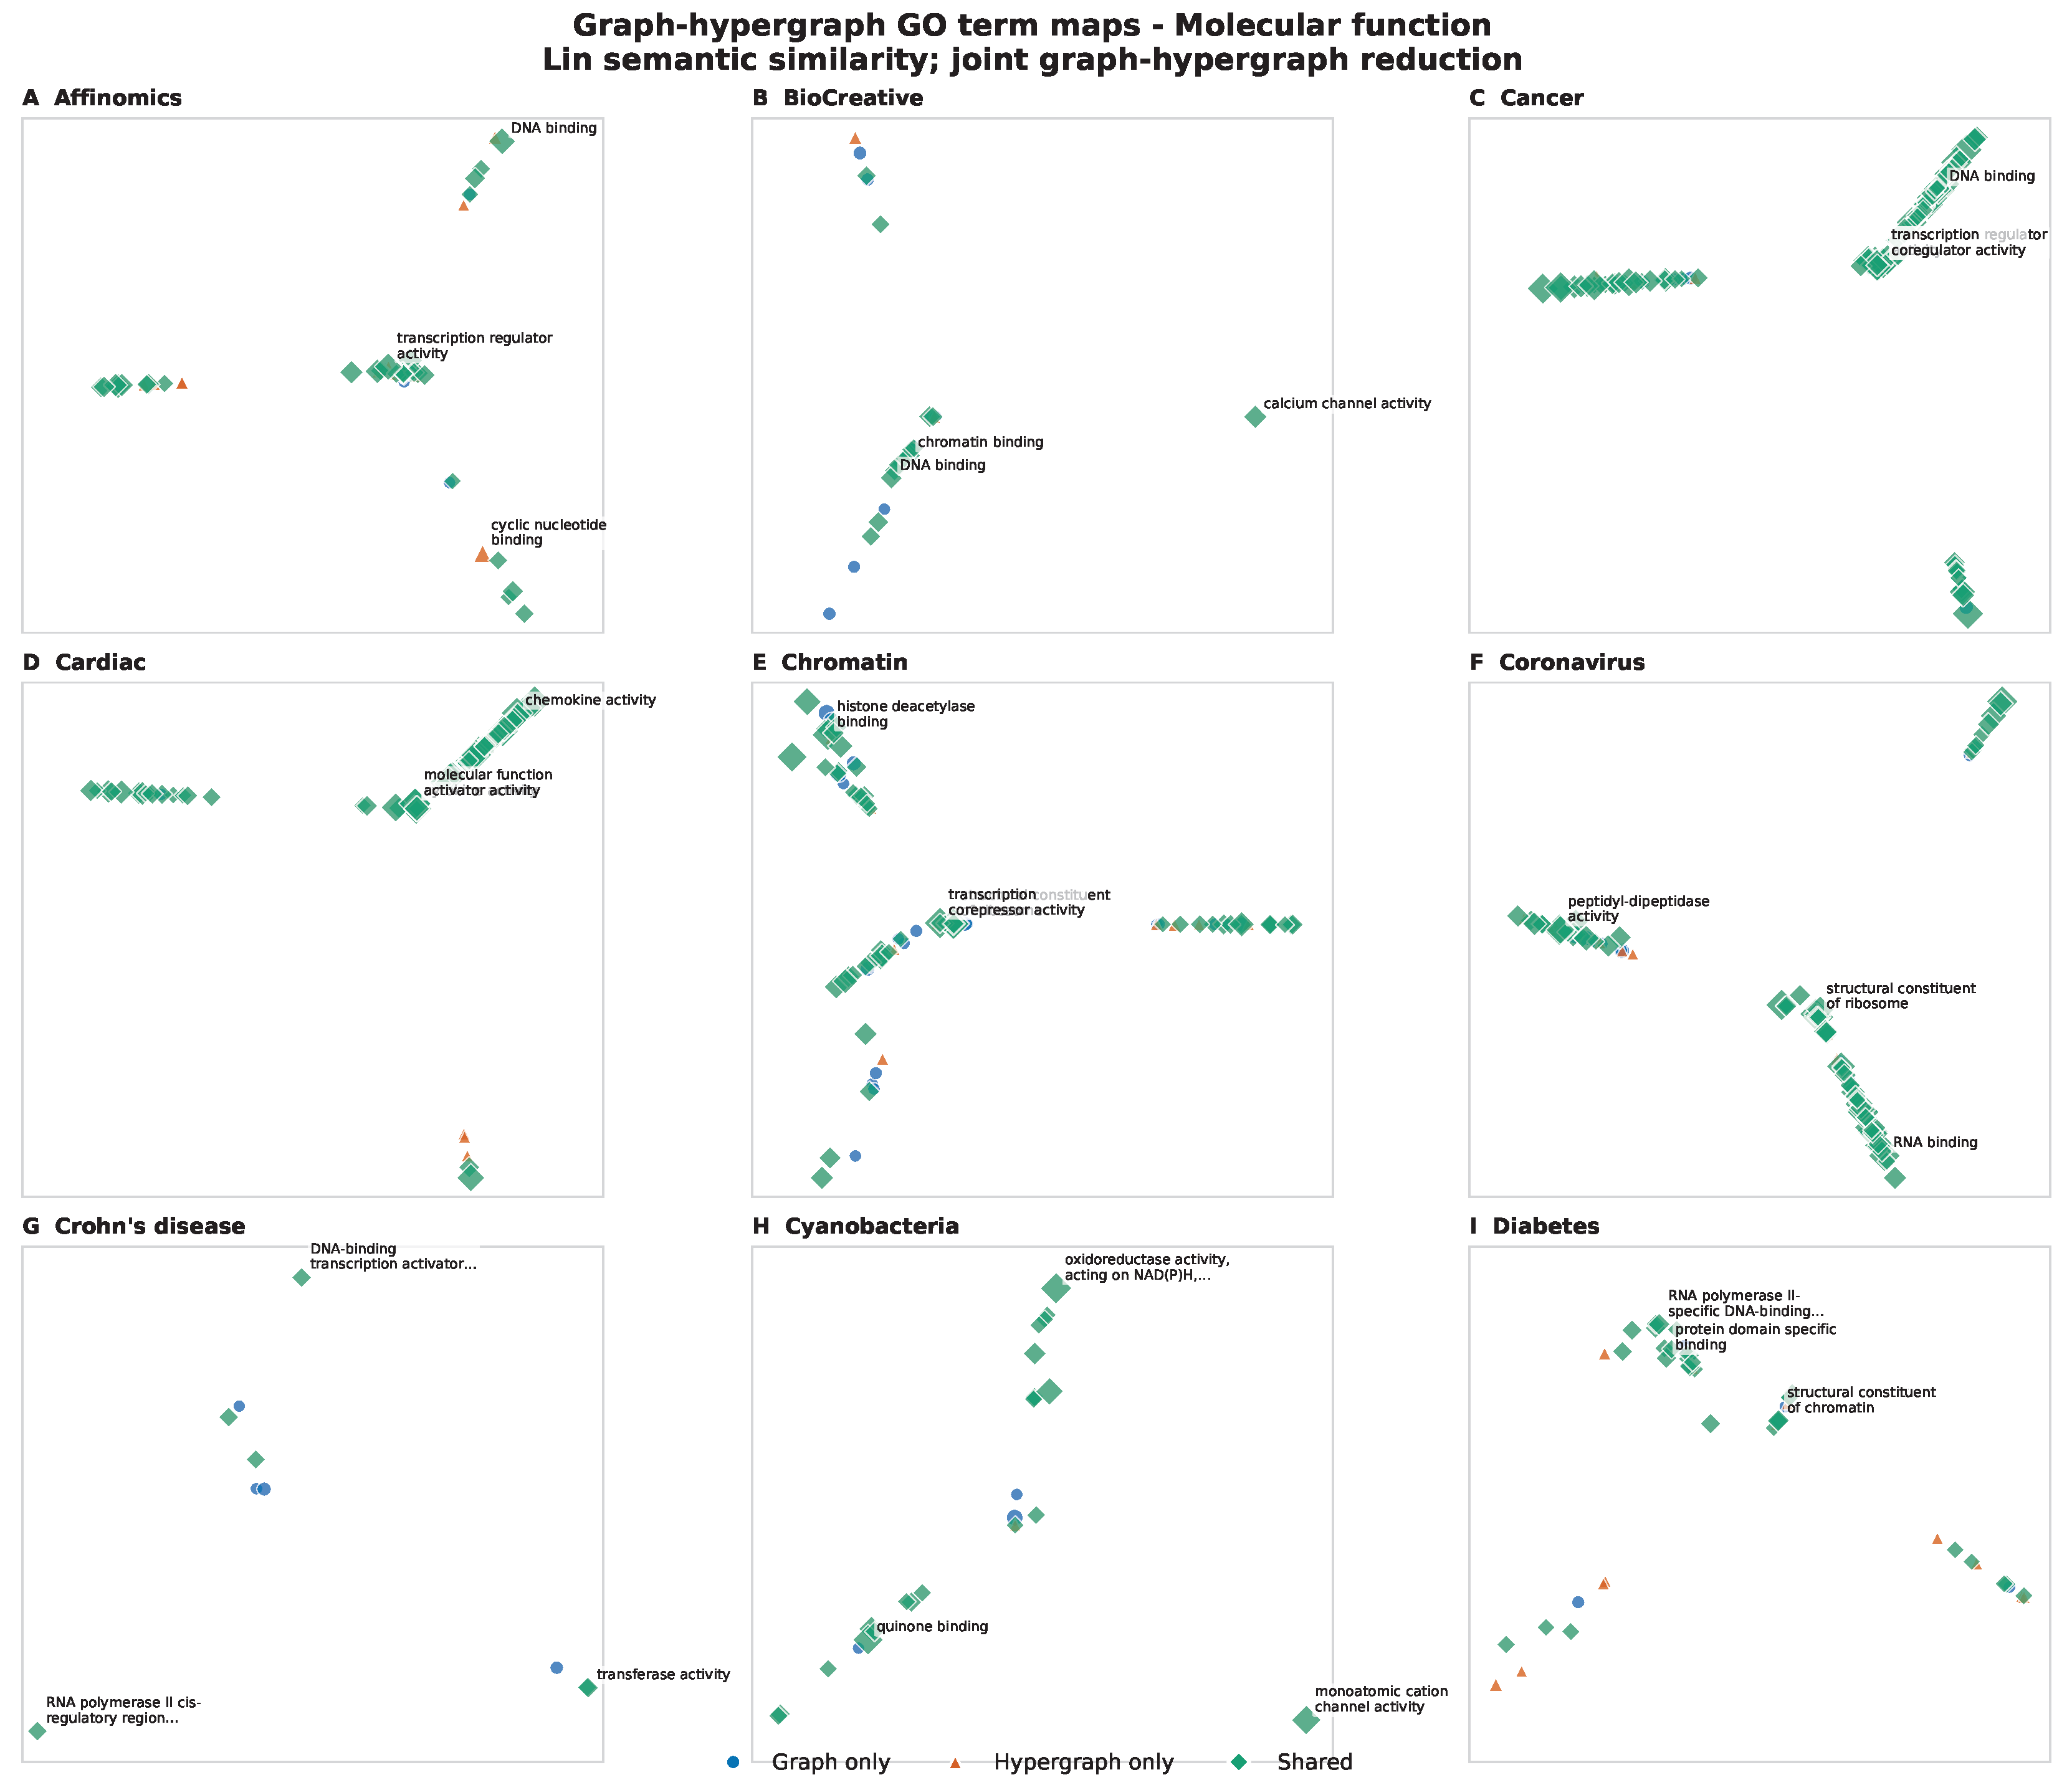
Figure 10.
Descriptive, non-area-proportional Venn diagrams of pooled significant GO terms. GO-term dependence precludes inferential interpretation of pooled counts.
Figure 10.
Descriptive, non-area-proportional Venn diagrams of pooled significant GO terms. GO-term dependence precludes inferential interpretation of pooled counts.
References
- Benjamini, Yoav and Yosef Hochberg. 1995. Controlling the false discovery rate: A practical and powerful approach to multiple testing. Journal of the Royal Statistical Society: Series B (Methodological) 57(1), 289–300. [CrossRef]
- Blondel, Vincent D., Jean-Loup Guillaume, Renaud Lambiotte, and Etienne Lefebvre. 2008. Fast unfolding of communities in large networks. Journal of Statistical Mechanics: Theory and Experiment 2008(10), P10008. [CrossRef]
- Brohée, Sylvain and Jacques van Helden. 2006, nov. Evaluation of clustering algorithms for protein–protein interaction networks. BMC Bioinformatics 7(1), 488. [CrossRef]
- Cai, Bingjing, Haiying Wang, Huiru Zheng, and Hui Wang. 2012, nov. Detection of protein complexes from affinity purification/mass spectrometry data. BMC Systems Biology 6(Suppl 3), S4. [CrossRef]
- Chodrow, Philip S., Nicole Eikmeier, and Jamie Haddock. 2023, jun. Nonbacktracking spectral clustering of nonuniform hypergraphs. SIAM Journal on Mathematics of Data Science 5(2), 251–279. [CrossRef]
- del Toro, Noemi, Marine Dumousseau, Sandra Orchard, Rafael C. Jimenez, Eugenia Galeota, Guillaume Launay, Johannes Goll, Karin Breuer, Keiichiro Ono, Lukasz Salwinski, and Henning Hermjakob. 2013, jul. A new reference implementation of the PSICQUIC web service. Nucleic Acids Research 41(W1), W601–W606. [CrossRef]
- del Toro, Noemi, Anjali Shrivastava, Eliot Ragueneau, Birgit Meldal, Colin Combe, Elisabet Barrera, Livia Perfetto, Karyn How, Prashansa Ratan, Gautam Shirodkar, Odilia Lu, Bálint Mészáros, Xavier Watkins, Sangya Pundir, Luana Licata, Marta Iannuccelli, Matteo Pellegrini, Maria Jesus Martin, Simona Panni, Margaret Duesbury, Sylvain D. Vallet, Juri Rappsilber, Sylvie Ricard-Blum, Gianni Cesareni, Lukasz Salwinski, Sandra Orchard, Pablo Porras, Kalpana Panneerselvam, and Henning Hermjakob. 2022, jan. The IntAct database: Efficient access to fine-grained molecular interaction data. Nucleic Acids Research 50(D1), D648–D653. [CrossRef]
- Demšar, Janez. 2006. Statistical comparisons of classifiers over multiple data sets. Journal of Machine Learning Research 7, 1–30.
- Ding, Chris, Xiaofeng He, Raul F. Meraz, and Stephen R. Holbrook. 2004, oct. A unified representation of multiprotein complex data for modeling interaction networks. Proteins: Structure, Function, and Bioinformatics 57(1), 99–108. [CrossRef]
- Enright, Anton J., Stijn Van Dongen, and Christos A. Ouzounis. 2002. An efficient algorithm for large-scale detection of protein families. Nucleic Acids Research 30(7), 1575–1584. [CrossRef]
- Eriksson, Anton, Daniel Edler, Alexis Rojas, Manlio De Domenico, and Martin Rosvall. 2021, jun. How choosing random-walk model and network representation matters for flow-based community detection in hypergraphs. Communications Physics 4(1), 133. [CrossRef]
- Gaudelet, Thomas, Noël Malod-Dognin, and Nataša Pržulj. 2018, sep. Higher-order molecular organization as a source of biological function. Bioinformatics 34(17), i944–i953. [CrossRef]
- Geva, Guy and Roded Sharan. 2011, jan. Identification of protein complexes from co-immunoprecipitation data. Bioinformatics 27(1), 111–117. [CrossRef]
- Hu, Lun, Jun Zhang, Xiangyu Pan, Hong Yan, and Zhuhong You. 2021, feb. HiSCF: Leveraging higher-order structures for clustering analysis in biological networks. Bioinformatics 37(4), 542–550. [CrossRef]
- Klimm, Florian, Charlotte M. Deane, and Gesine Reinert. 2021, apr. Hypergraphs for predicting essential genes using multiprotein complex data. Journal of Complex Networks 9(2), cnaa028. [CrossRef]
- Klopfenstein, D. V., Liangsheng Zhang, Brent S. Pedersen, Fidel Ramírez, Alex Warwick Vesztrocy, Aurélien Naldi, Christopher J. Mungall, Jeffrey M. Yunes, Olga Botvinnik, Mark Weigel, Will Dampier, Christophe Dessimoz, Patrick Flick, and Haibao Tang. 2018, jul. GOATOOLS: A python library for gene ontology analyses. Scientific Reports 8(1), 10872. [CrossRef]
- Lee, Sang Hoon, Pan-Jun Kim, and Hawoong Jeong. 2011, aug. Global organization of protein complexome in the yeast Saccharomyces cerevisiae. BMC Systems Biology 5(1), 126. [CrossRef]
- Lin, Dekang. 1998. An information-theoretic definition of similarity. In Proceedings of the Fifteenth International Conference on Machine Learning, pp. 296–304. Morgan Kaufmann.
- Moschopoulos, Charalampos N., Georgios A. Pavlopoulos, Ernesto Iacucci, Jan Aerts, Spyros Likothanassis, Reinhard Schneider, and Sophia Kossida. 2011, dec. Which clustering algorithm is better for predicting protein complexes? BMC Research Notes 4(1), 549. [CrossRef]
- Orchard, Sandra, Mais Ammari, Bruno Aranda, Lionel Breuza, Leonardo Briganti, Fiona Broackes-Carter, Nancy H. Campbell, Gayatri Chavali, Carol Chen, Noemi del Toro, et al. 2014, jan. The MIntAct project—IntAct as a common curation platform for 11 molecular interaction databases. Nucleic Acids Research 42(D1), D358–D363. [CrossRef]
- Orchard, Sandra, Samuel Kerrien, Sourav Abbani, Bruno Aranda, Jay Bhate, Sally Bidwell, Alan Bridge, Leonardo Briganti, Fiona S. L. Brinkman, Fiona Brinkman, Gianni Cesareni, Andrew Chatr-Aryamontri, Emmanuel Chautard, Chih-Yuan Chen, Marine Dumousseau, Johannes Goll, Robert E. W. Hancock, Linda I. Hannick, Igor Jurisica, Jyoti Khadake, David J. Lynn, Usha Mahadevan, Livia Perfetto, Anjana Raghunath, Sylvie Ricard-Blum, Bernd Roechert, Lukasz Salwinski, Volker Stumpflen, Mike Tyers, Peter Uetz, Ioannis Xenarios, and Henning Hermjakob. 2012, apr. Protein interaction data curation: The international molecular exchange (IMEx) consortium. Nature Methods 9(4), 345–350. [CrossRef]
- Orchard, Sandra, Lukasz Salwinski, Samuel Kerrien, Luisa Montecchi-Palazzi, Matthias Oesterheld, Volker Stumpflen, Arnaud Ceol, Andrew Chatr-aryamontri, James Armstrong, Peter Woollard, et al. 2007, aug. The minimum information required for reporting a molecular interaction experiment (MIMIx). Nature Biotechnology 25(8), 894–898. [CrossRef]
- Perfetto, Livia, Chiara Pastrello, Noemi del Toro, Margaret Duesbury, Marta Iannuccelli, Max Kotlyar, Luana Licata, Birgit Meldal, Kalpana Panneerselvam, Simona Panni, Negin Rahimzadeh, Sylvie Ricard-Blum, Lukasz Salwinski, Anjali Shrivastava, Gianni Cesareni, Matteo Pellegrini, Sandra Orchard, Igor Jurisica, Henning Hermjakob, and Pablo Porras. 2020, nov. The IMEx coronavirus interactome: An evolving map of Coronaviridae–host molecular interactions. Database 2020, baaa096. [CrossRef]
- Porras, Pablo, Elisabet Barrera, Alan Bridge, Noemi del Toro, Gianni Cesareni, Margaret Duesbury, Henning Hermjakob, Marta Iannuccelli, Igor Jurisica, Max Kotlyar, Luana Licata, Ruth C. Lovering, David J. Lynn, Birgit Meldal, Bindu Nanduri, Livia Perfetto, Pablo Porras Millan, Sylvie Ricard-Blum, Bernd Roechert, Lukasz Salwinski, Anjali Shrivastava, and Sandra Orchard. 2020, dec. Towards a unified open access dataset of molecular interactions. Nature Communications 11(1), 6144. [CrossRef]
- Ramadan, Emad Y. 2008. Biological Networks: Modeling and Structural Analysis. Ph. D. thesis, Old Dominion University. [CrossRef]
- Ramadan, Emad Y., Arijit Tarafdar, and Alex Pothen. 2004, apr. A hypergraph model for the yeast protein complex network. In Proceedings of the 18th International Parallel and Distributed Processing Symposium, pp. 189. [CrossRef]
- Supek, Fran, Matko Bošnjak, Nives Škunca, and Tomislav Šmuc. 2011, jul. REVIGO summarizes and visualizes long lists of gene ontology terms. PLOS ONE 6(7), e21800. [CrossRef]
- Teng, Ben, Can Zhao, Xiaoqing Liu, and Zengyou He. 2015, jul. Network inference from AP–MS data: Computational challenges and solutions. Briefings in Bioinformatics 16(4), 658–674. [CrossRef]
- The Gene Ontology Consortium. 2026, jan. The gene ontology knowledgebase in 2026. Nucleic Acids Research 54(D1), D1779–D1792. [CrossRef]
- Traag, Vincent A., Ludo Waltman, and Nees Jan van Eck. 2019. From louvain to leiden: Guaranteeing well-connected communities. Scientific Reports 9, 5233. [CrossRef]
- Wadi, Lina, Mona Meyer, Jeff Weiser, Lincoln D. Stein, and Jüri Reimand. 2016, sep. Impact of outdated gene annotations on pathway enrichment analysis. Nature Methods 13(9), 705–706. [CrossRef]
- Wilcoxon, Frank. 1945, dec. Individual comparisons by ranking methods. Biometrics Bulletin 1(6), 80–83. [CrossRef]
- Wu, Min, Xiaoli Li, Chee-Keong Kwoh, See-Kiong Ng, and Limsoon Wong. 2012, sep. Discovery of protein complexes with core-attachment structures from tandem affinity purification (TAP) data. Journal of Computational Biology 19(9), 1027–1042. [CrossRef]
- Wu, Zhourun, Qing Liao, and Bin Liu. 2020, sep. A comprehensive review and evaluation of computational methods for identifying protein complexes from protein–protein interaction networks. Briefings in Bioinformatics 21(5), 1531–1548. [CrossRef]
- Xia, Simin, Dianke Li, Xinru Deng, Zhongyang Liu, Huaqing Zhu, Yuan Liu, and Dong Li. 2024, jul. Integration of protein sequence and protein–protein interaction data by hypergraph learning to identify novel protein complexes. Briefings in Bioinformatics 25(4), bbae274. [CrossRef]
- Yang, Pengcheng, Youngwoo Lee, Daniel B. Szymanski, and Jun Xie. 2025, mar. Integrating CORUM and co-fractionation mass spectrometry to create enhanced benchmarks for protein complex predictions. Briefings in Bioinformatics 26(2), bbaf154. [CrossRef]
- Zhou, Dengyong, Jiayuan Huang, and Bernhard Schölkopf. 2007, aug. Learning with hypergraphs: Clustering, classification, and embedding. IEEE Transactions on Pattern Analysis and Machine Intelligence 29(8), 1293–1302. [CrossRef]
Figure 1.
Leakage-controlled representation comparison. Graph and hypergraph operators are built from identical training hyperedges. Validation data select regularization, while held-out test hyperedges are used only for final evaluation.
Figure 1.
Leakage-controlled representation comparison. Graph and hypergraph operators are built from identical training hyperedges. Validation data select regularization, while held-out test hyperedges are used only for final evaluation.
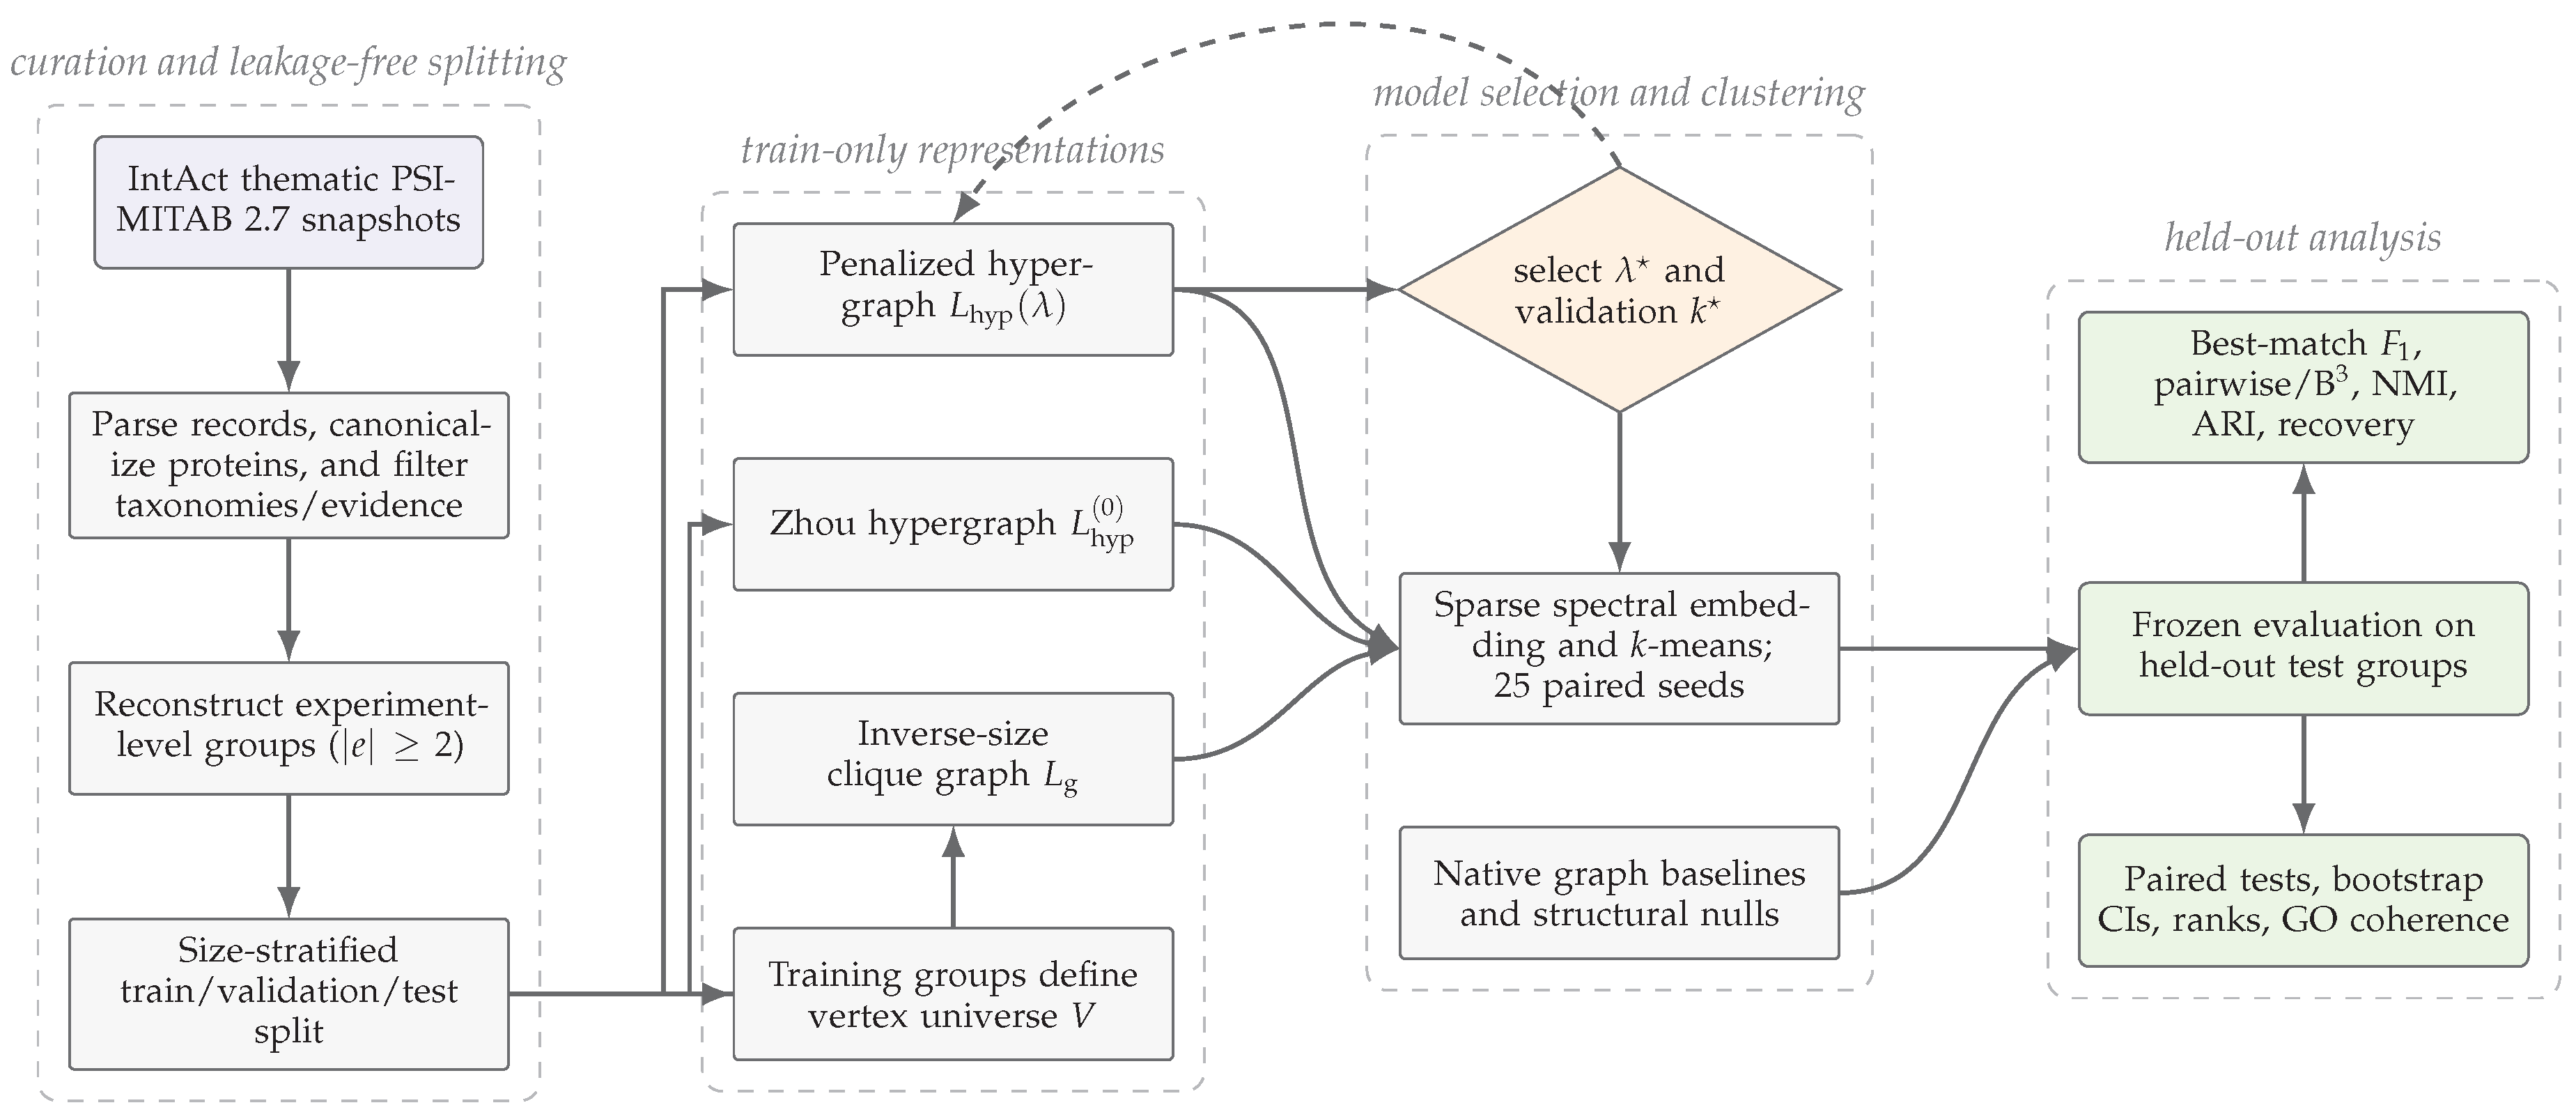
Figure 2.
Paired operator effect on held-out symmetric best-match . Points are mean penalized-hypergraph minus graph differences; horizontal intervals are paired-bootstrap 95% confidence intervals. Significance annotations derive from within-dataset paired Wilcoxon tests across 25 seeds.
Figure 2.
Paired operator effect on held-out symmetric best-match . Points are mean penalized-hypergraph minus graph differences; horizontal intervals are paired-bootstrap 95% confidence intervals. Significance annotations derive from within-dataset paired Wilcoxon tests across 25 seeds.
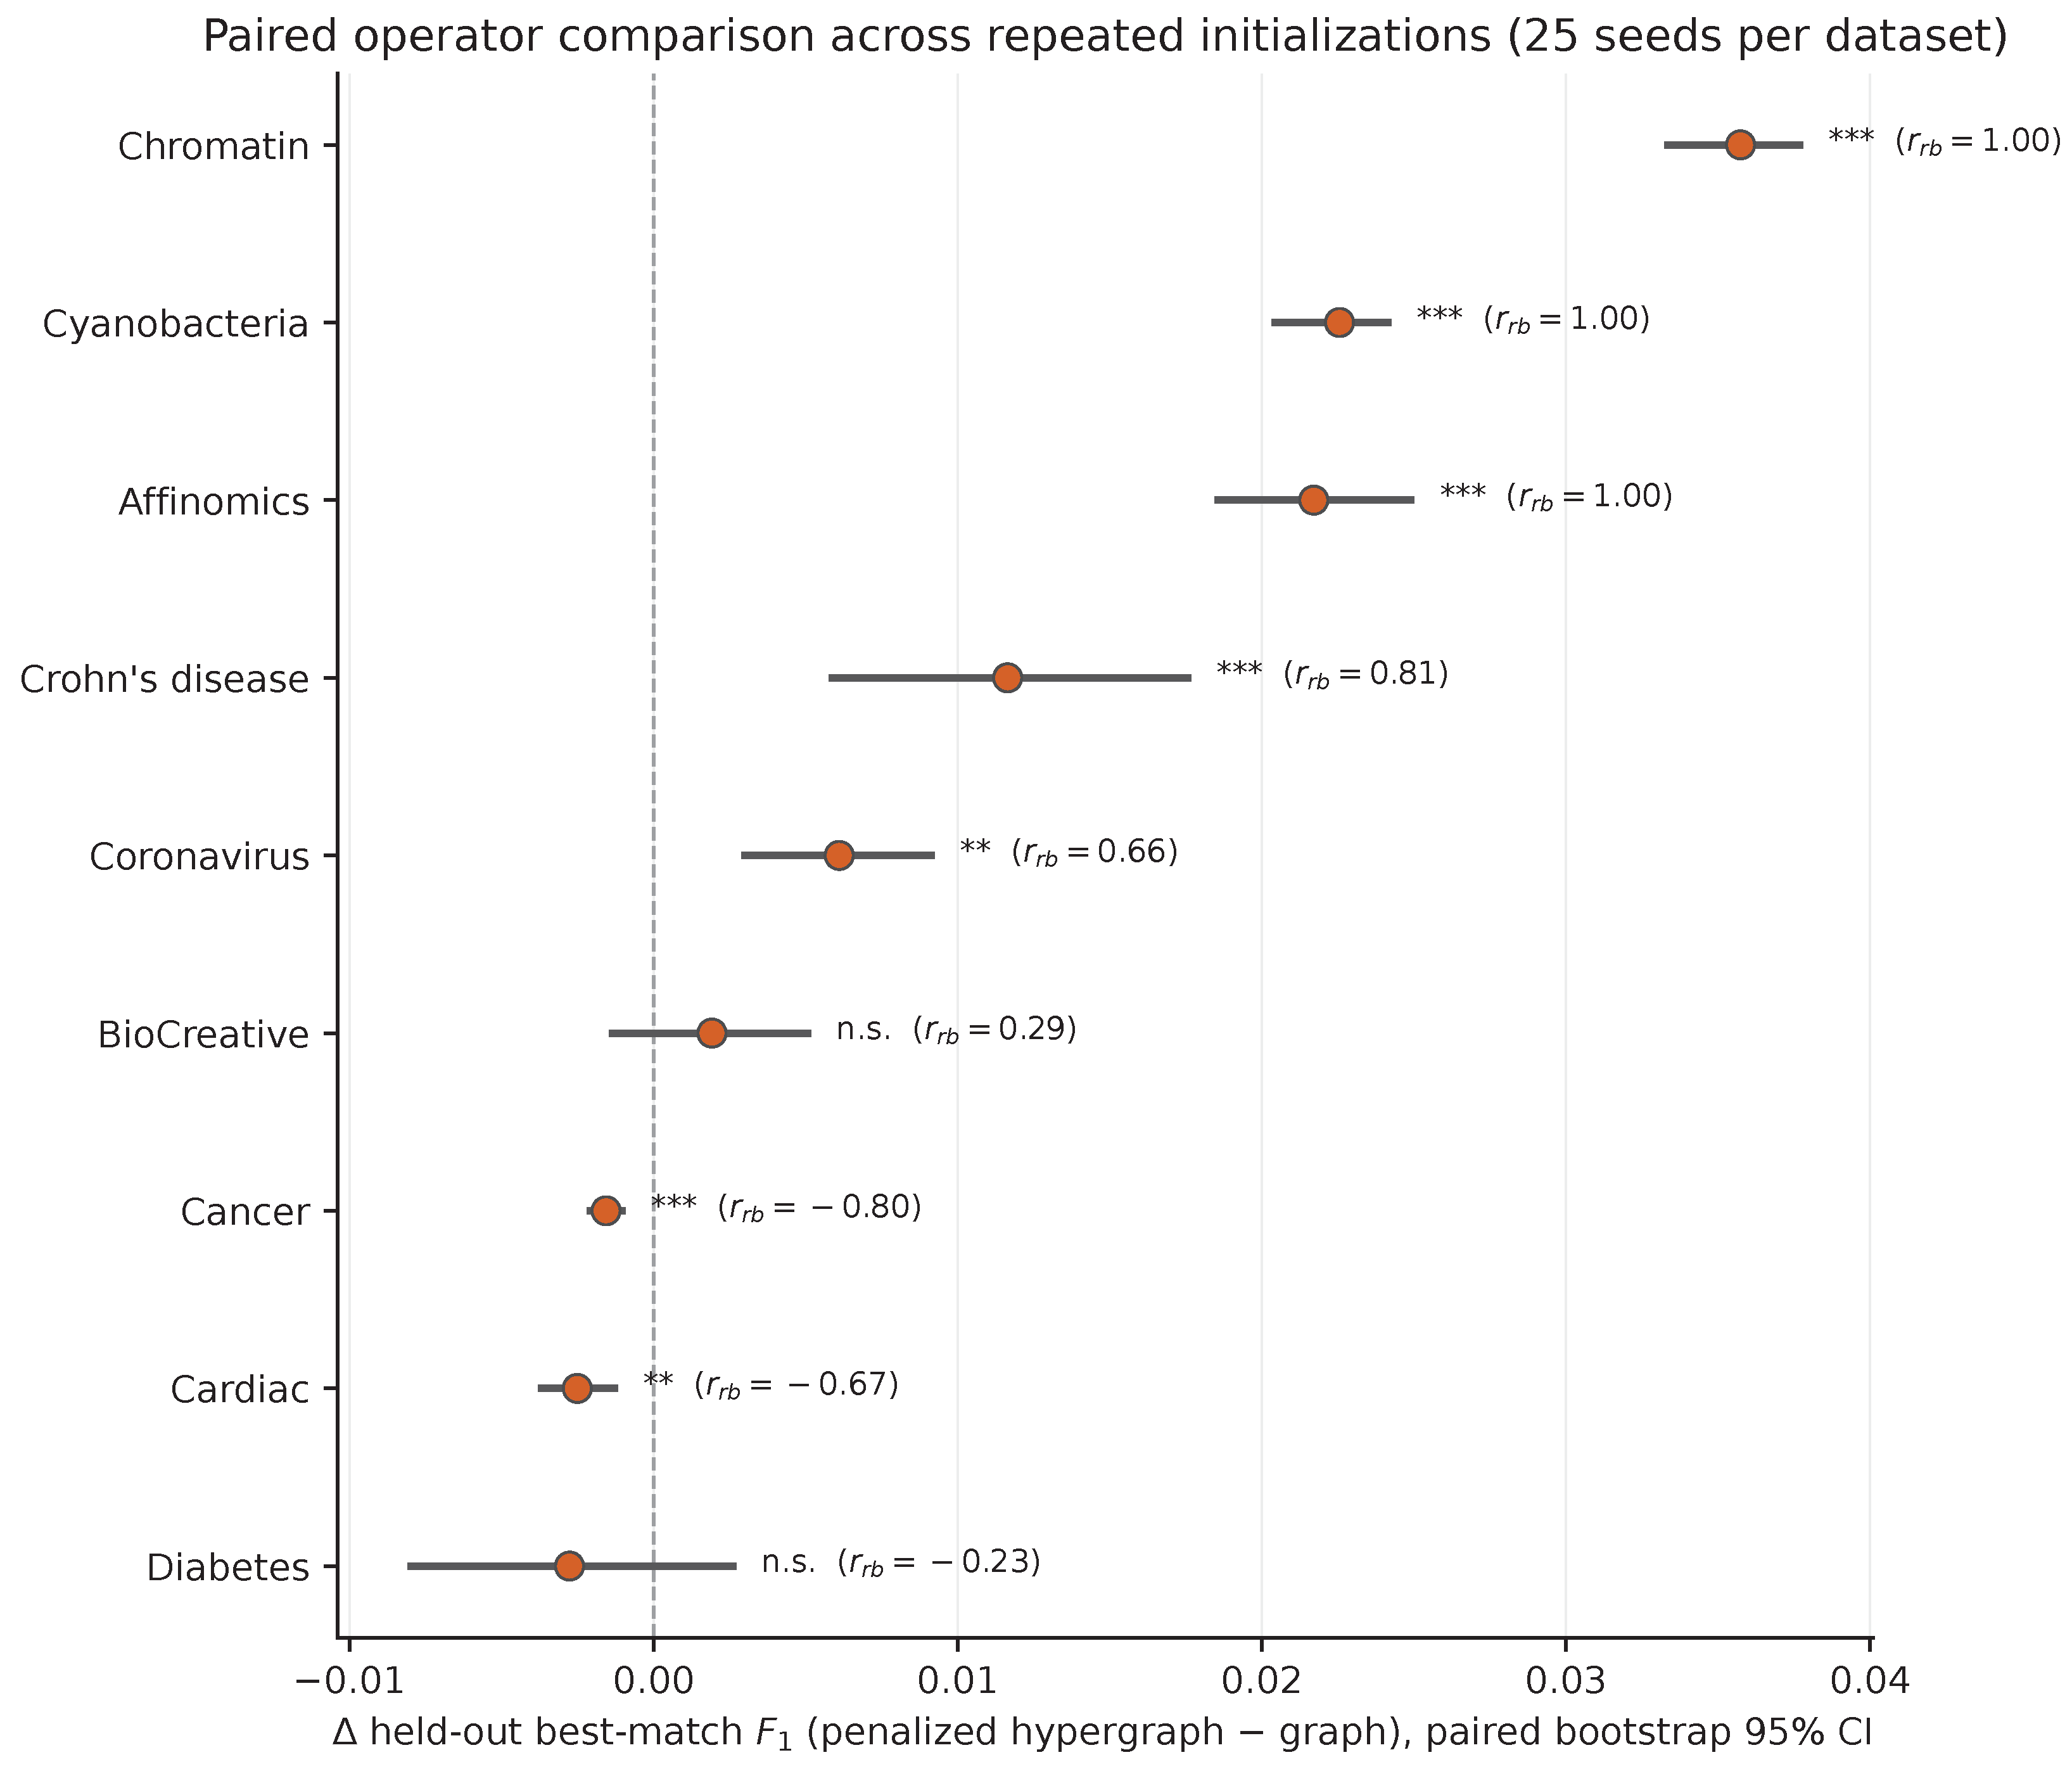
Figure 3.
Dataset-level comparison of the three spectral operators. Penalization produces the best mean rank, while the nine-dataset omnibus comparison remains below conventional significance.
Figure 3.
Dataset-level comparison of the three spectral operators. Penalization produces the best mean rank, while the nine-dataset omnibus comparison remains below conventional significance.
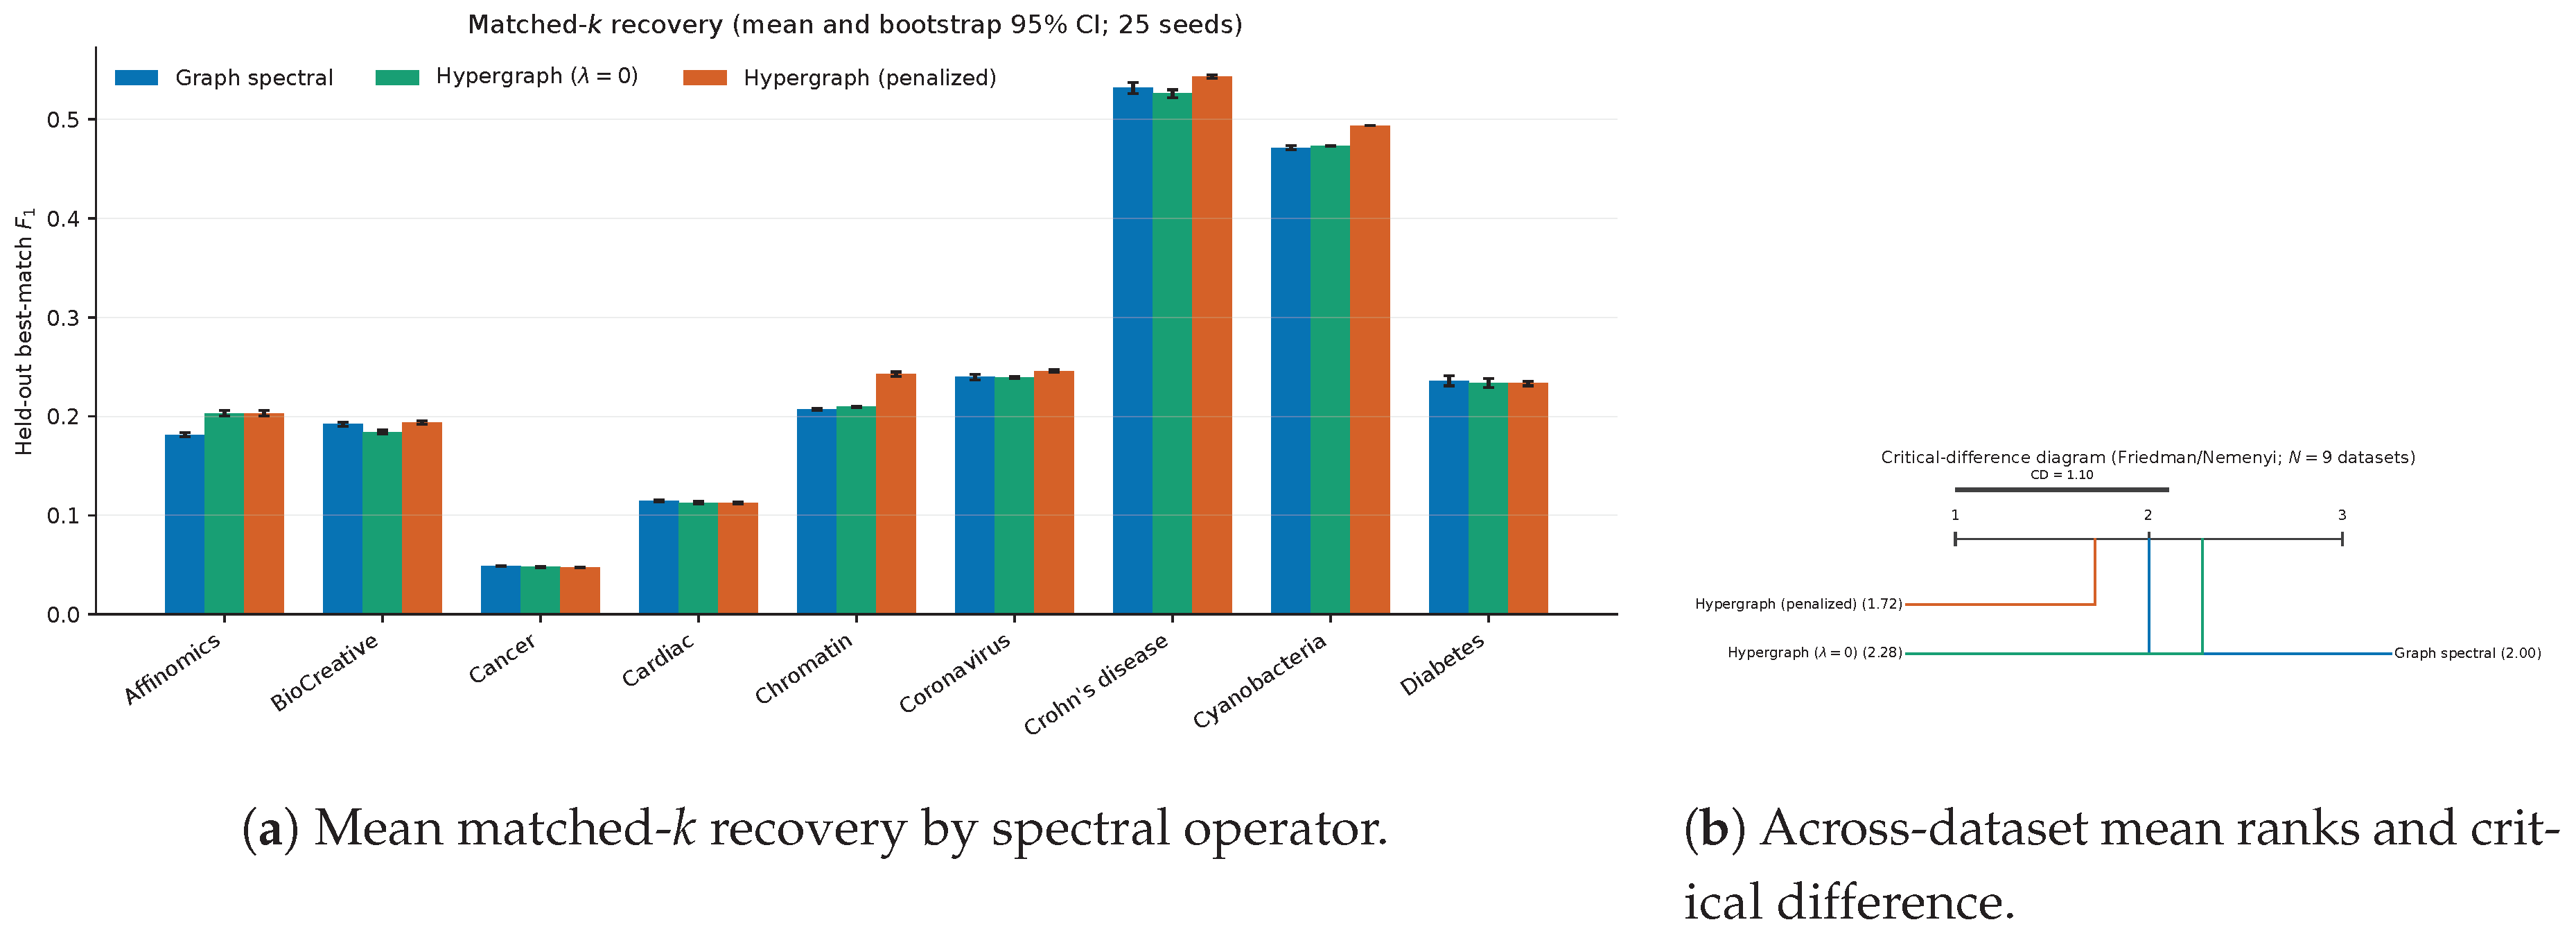
Figure 4.
Regularization and null-control analyses. Null bars are means over 10 randomized seeds; observed bars are means over 25 clustering seeds.
Figure 4.
Regularization and null-control analyses. Null bars are means over 10 randomized seeds; observed bars are means over 25 clustering seeds.
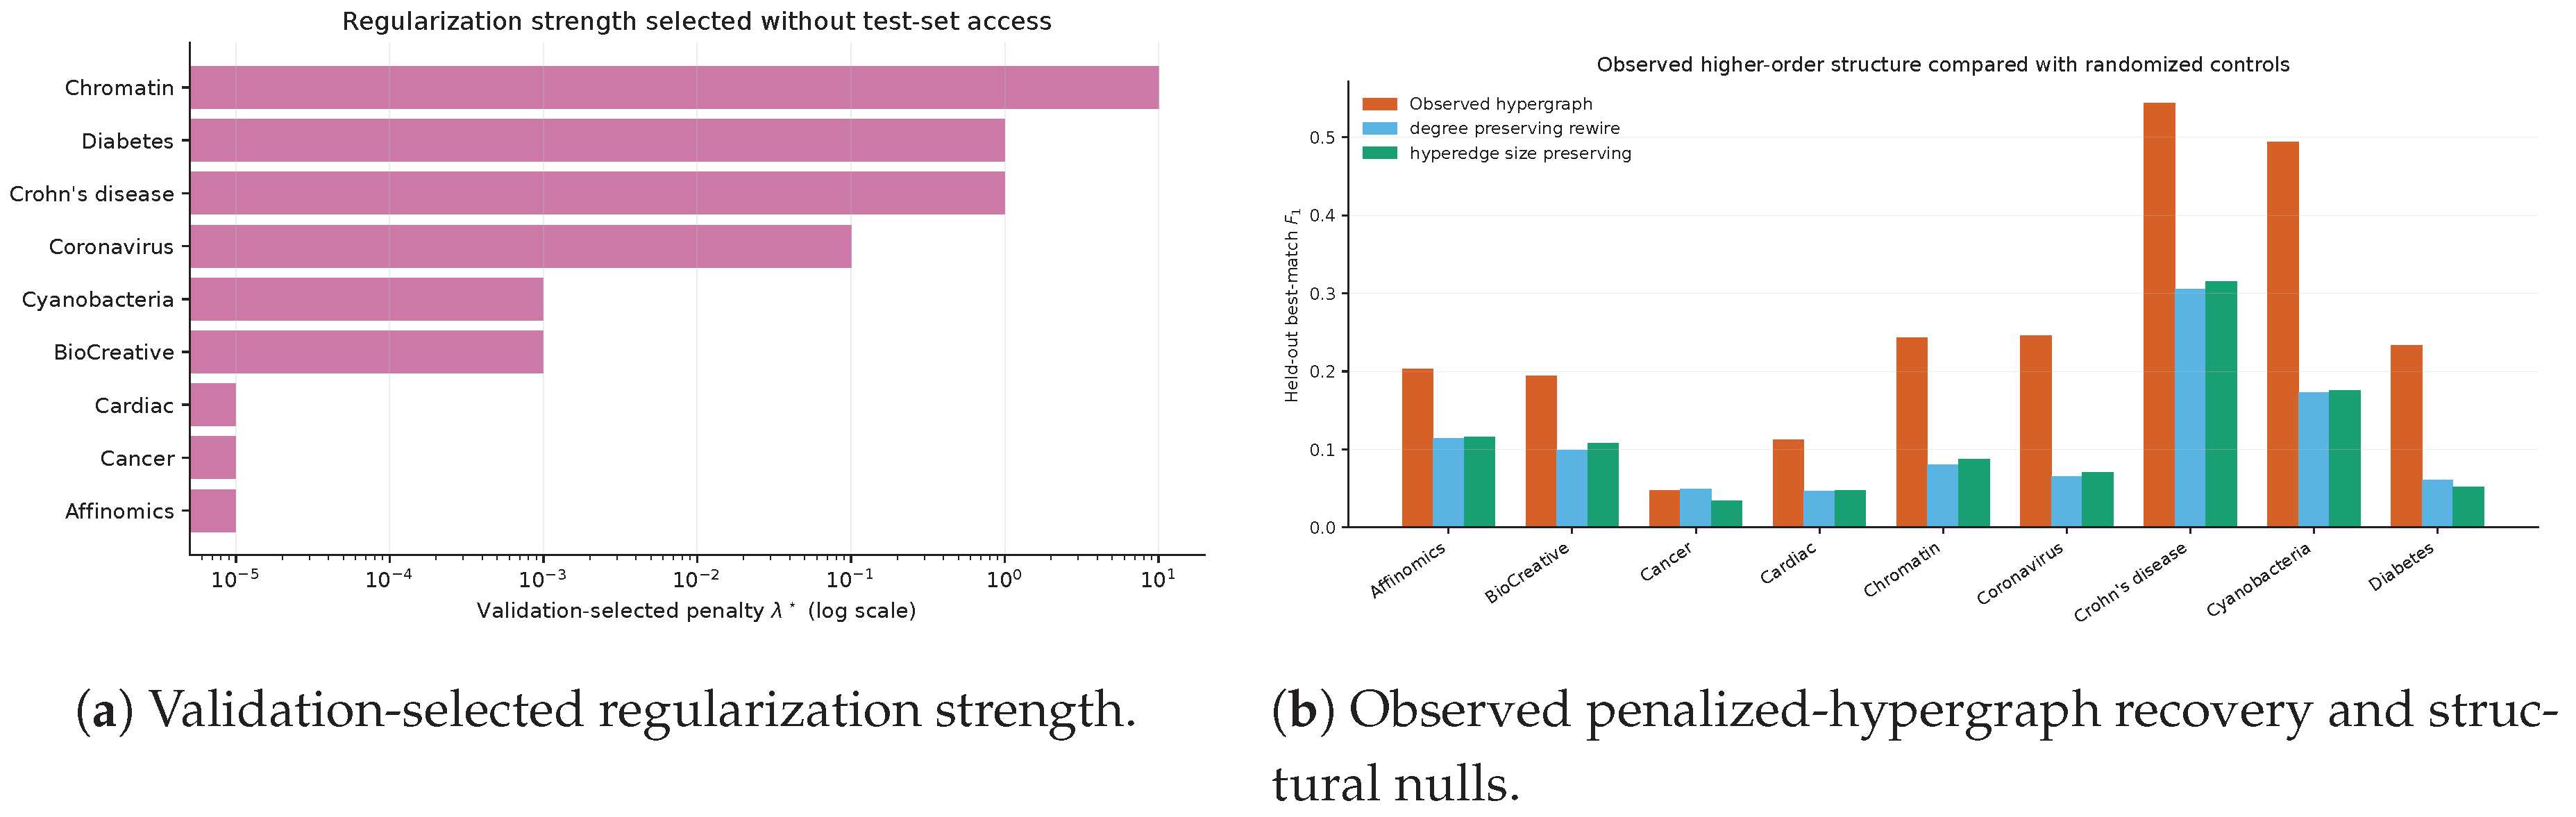
Figure 5.
GO comparison using the stability-medoid graph and penalized-hypergraph partitions. Dataset, not cluster or term, is the inferential unit. Term-overlap bars are descriptive because GO terms are dependent.
Figure 5.
GO comparison using the stability-medoid graph and penalized-hypergraph partitions. Dataset, not cluster or term, is the inferential unit. Term-overlap bars are descriptive because GO terms are dependent.
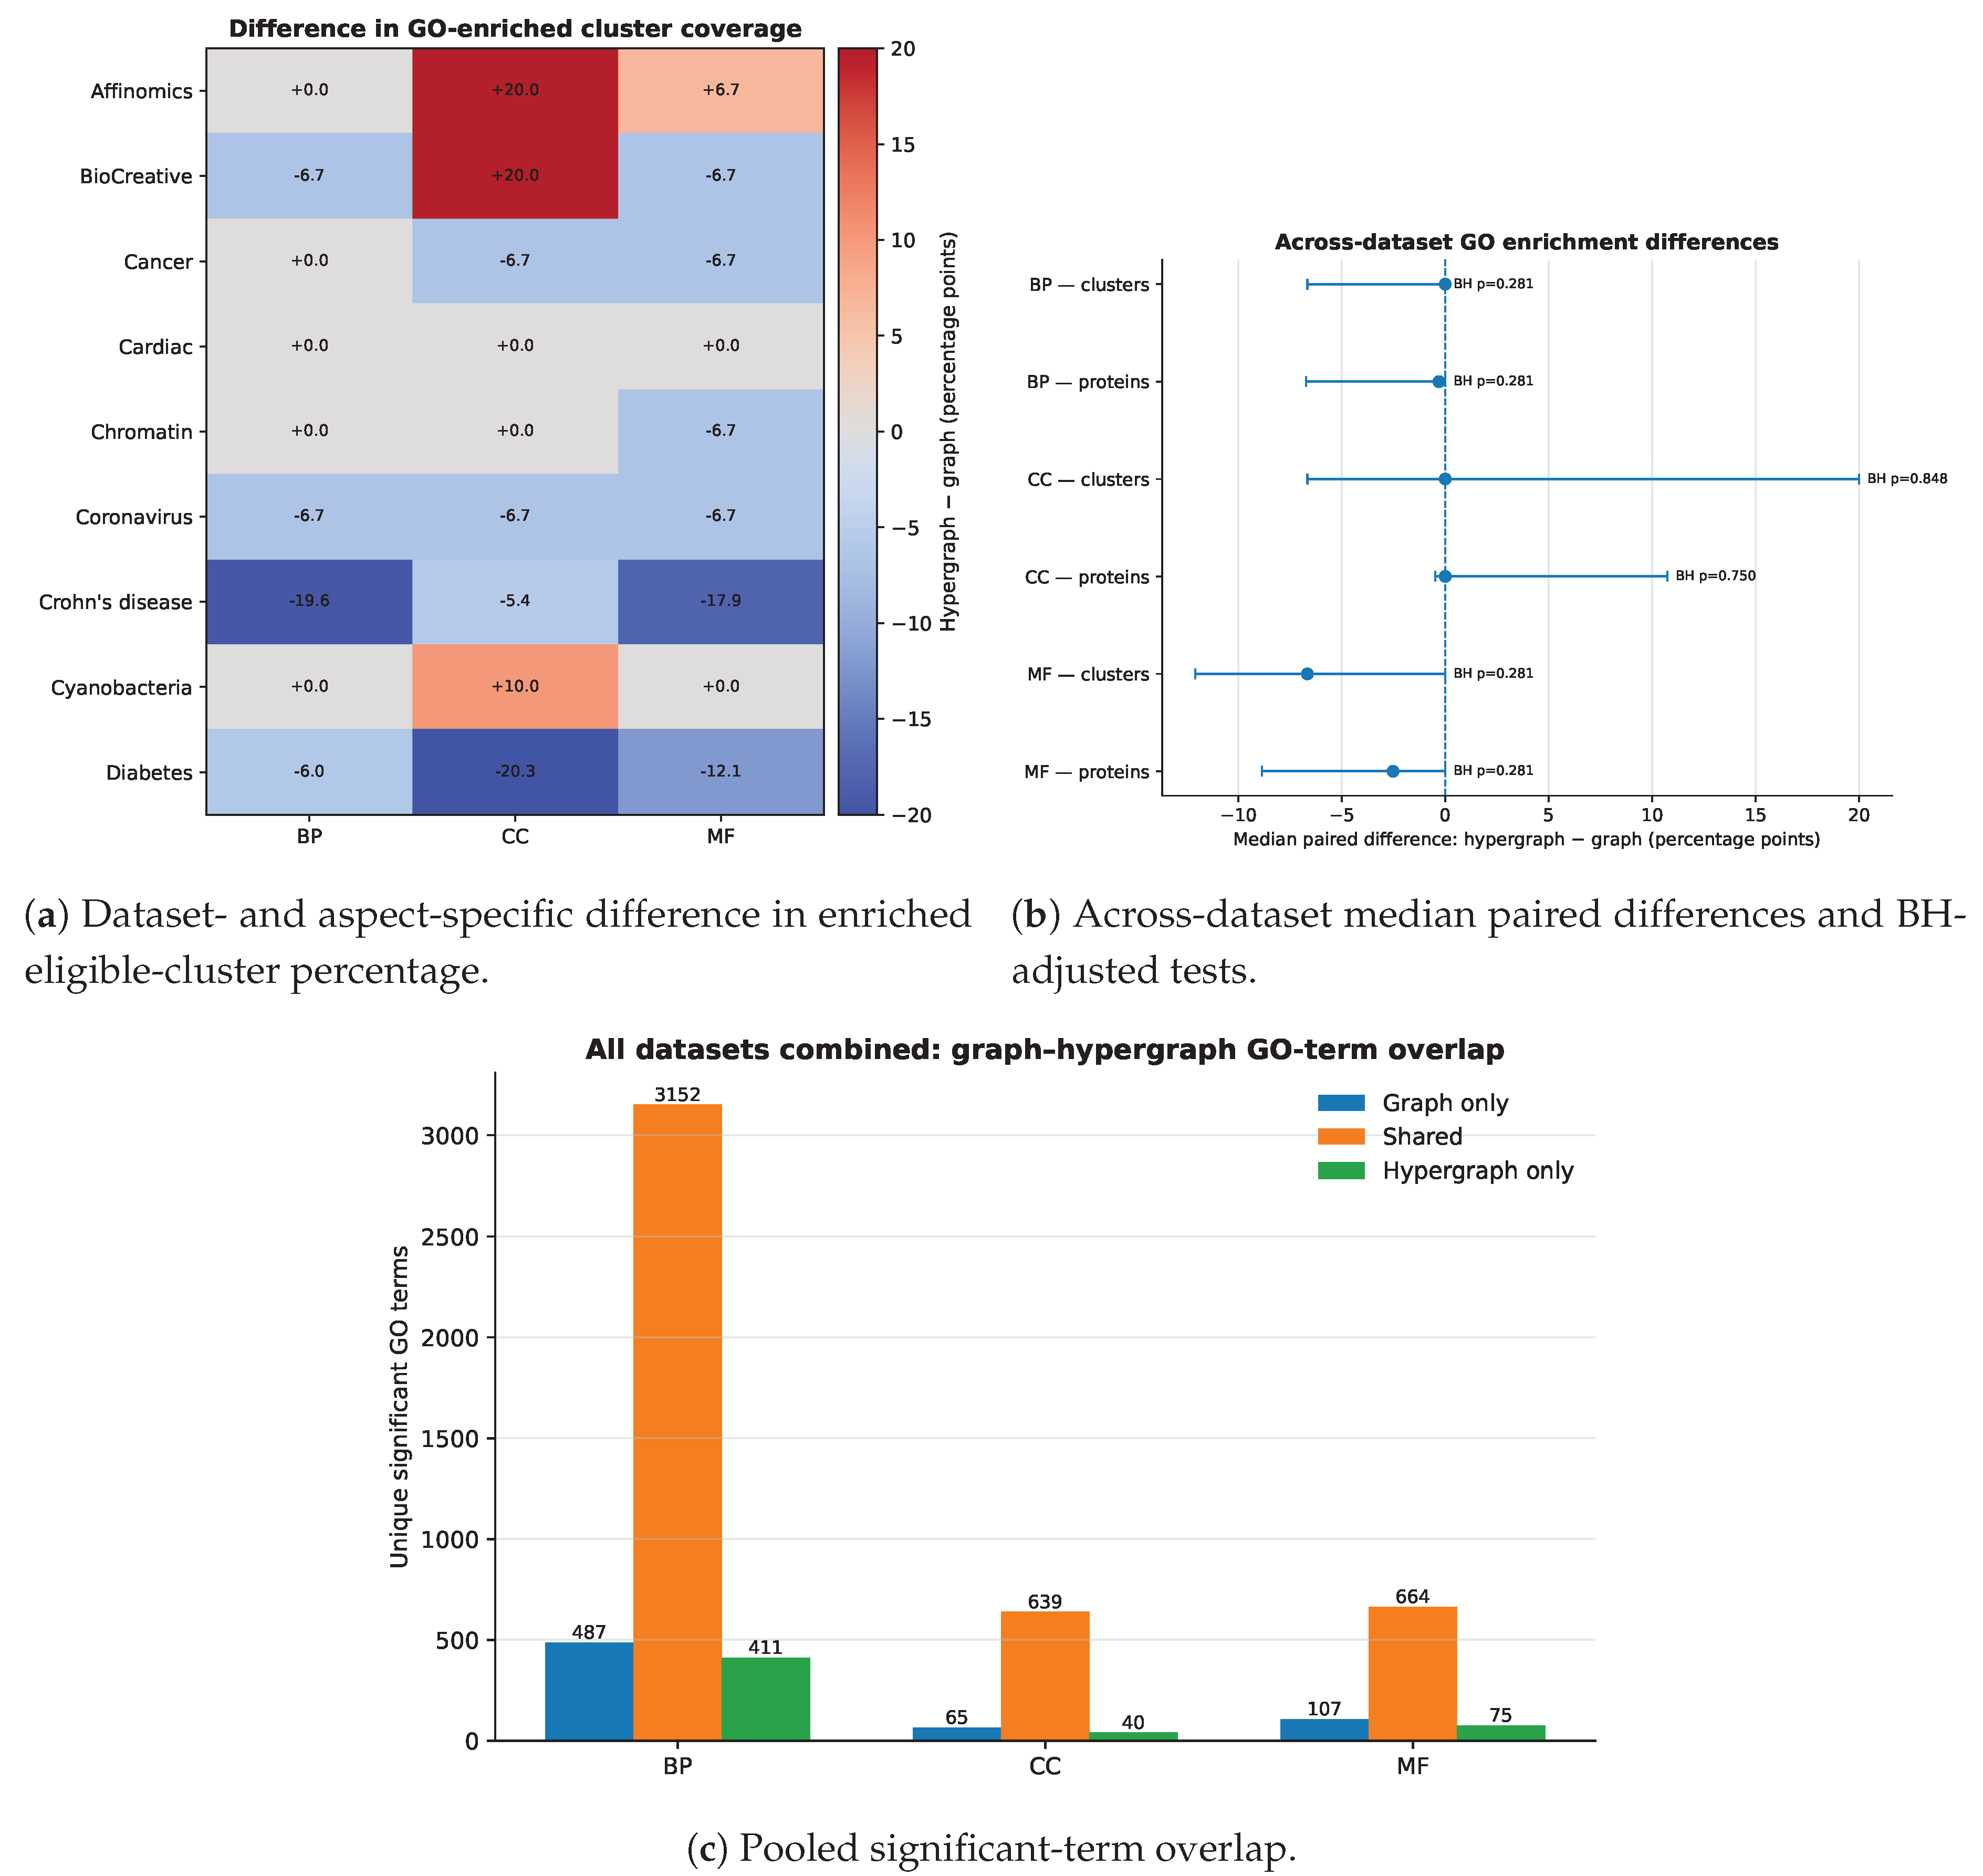
Figure 6.
Joint graph-hypergraph semantic maps of non-redundant BP representatives. Terms from both operators were embedded from the same dataset-specific GO-DAG Lin-similarity matrix. Point size reflects enrichment significance; coordinates are descriptive and axes have no direct biological meaning.
Figure 6.
Joint graph-hypergraph semantic maps of non-redundant BP representatives. Terms from both operators were embedded from the same dataset-specific GO-DAG Lin-similarity matrix. Point size reflects enrichment significance; coordinates are descriptive and axes have no direct biological meaning.
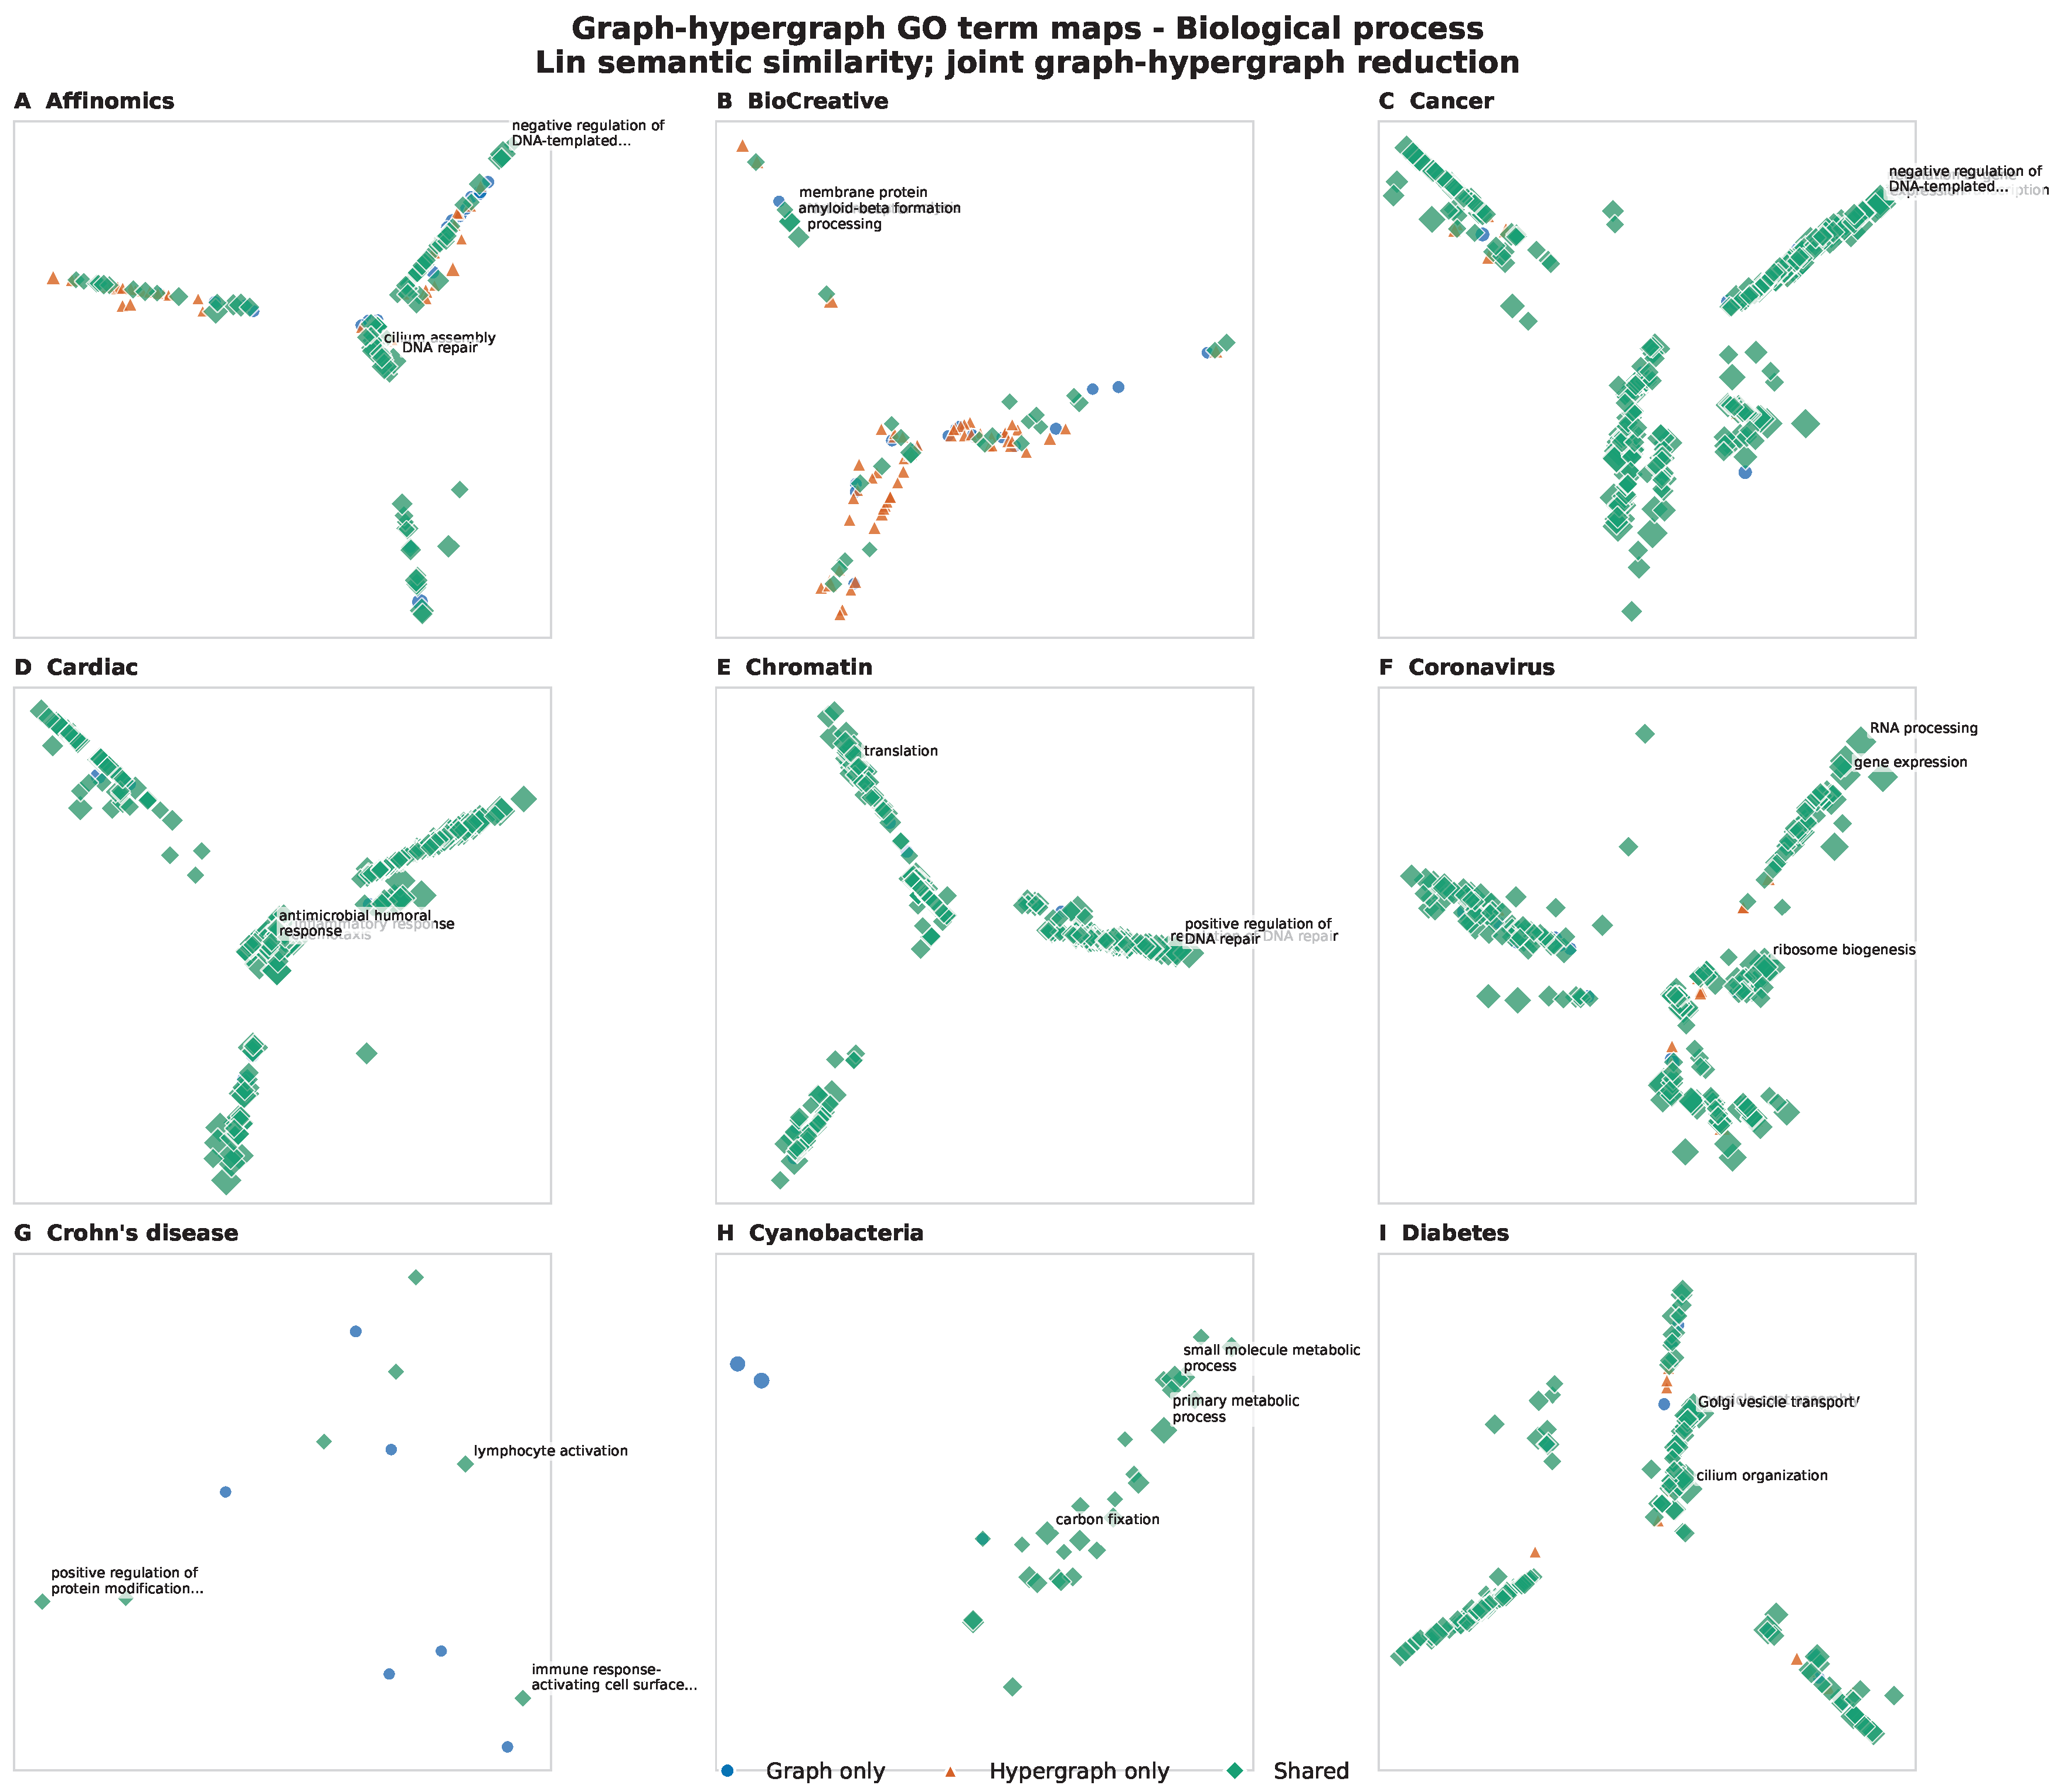
Table 1.
Final-run dataset manifest. PPI denotes filtered interaction rows. Split counts are the nominal train/validation/test hyperedges before restricting validation and test groups to the training protein universe.
Table 1.
Final-run dataset manifest. PPI denotes filtered interaction rows. Split counts are the nominal train/validation/test hyperedges before restricting validation and test groups to the training protein universe.
| Dataset | PPI | Train proteins | Split groups | Evaluable val/test | GO coverage | Stability ARI (G/H) | ||
|---|---|---|---|---|---|---|---|---|
| Affinomics | 2,148 | 326 | 254/85/85 | 68/63 | 0 | 15 | 0.856 | 0.830/0.821 |
| BioCreative | 870 | 327 | 309/103/103 | 76/73 | 15 | 0.948 | 0.498/0.755 | |
| Cancer | 33,657 | 5,481 | 4,171/1,391/1,390 | 1,242/1,238 | 0 | 15 | 0.909 | 0.821/0.823 |
| Cardiac | 4,172 | 1,152 | 889/296/296 | 232/231 | 0 | 15 | 0.965 | 0.942/0.954 |
| Chromatin | 8,546 | 1,467 | 847/282/283 | 264/251 | 10 | 15 | 0.956 | 0.960/0.964 |
| Coronavirus | 13,935 | 3,045 | 1,534/511/511 | 459/446 | 15 | 0.937 | 0.826/0.903 | |
| Crohn’s disease | 249 | 71 | 93/31/30 | 27/25 | 1 | 14 | 0.859 | 0.957/0.953 |
| Cyanobacteria | 575 | 198 | 87/28/29 | 21/24 | 15 | 0.970 | 0.999/1.000 | |
| Diabetes | 1,053 | 658 | 134/45/43 | 39/35 | 1 | 15 | 0.971 | 0.990/0.999 |
Note: G/H denotes graph spectral/penalized hypergraph stability-medoid mean pairwise ARI across 25 seeds.
Table 2.
Held-out symmetric best-match under matched k. Values are mean (standard deviation) over 25 external seeds. is penalized hypergraph minus graph spectral.
Table 2.
Held-out symmetric best-match under matched k. Values are mean (standard deviation) over 25 external seeds. is penalized hypergraph minus graph spectral.
| Dataset | Graph spectral | Hypergraph () | Penalized hypergraph | BH-adjusted p | |
|---|---|---|---|---|---|
| Affinomics | 0.182 (0.006) | 0.202 (0.007) | 0.202 (0.007) | +0.0208 | |
| BioCreative | 0.192 (0.005) | 0.184 (0.005) | 0.194 (0.005) | +0.0019 | 0.210 |
| Cancer | 0.049 (0.001) | 0.047 (0.002) | 0.047 (0.002) | -0.0015 | |
| Cardiac | 0.114 (0.003) | 0.113 (0.003) | 0.113 (0.003) | -0.0010 | 0.210 |
| Chromatin | 0.207 (0.002) | 0.209 (0.002) | 0.243 (0.006) | +0.0356 | |
| Coronavirus | 0.230 (0.005) | 0.234 (0.004) | 0.245 (0.004) | +0.0152 | |
| Crohn’s disease | 0.532 (0.015) | 0.526 (0.011) | 0.544 (0.005) | +0.0116 | |
| Cyanobacteria | 0.471 (0.005) | 0.473 (0.001) | 0.494 (0.000) | +0.0226 | |
| Diabetes | 0.226 (0.013) | 0.240 (0.015) | 0.236 (0.007) | +0.0098 | 0.0029 |
Note: Bold indicates the highest mean among the three matched-k spectral operators. BH adjustment was applied across the nine penalized-hypergraph versus graph comparisons.
Disclaimer/Publisher’s Note: The statements, opinions and data contained in all publications are solely those of the individual author(s) and contributor(s) and not of MDPI and/or the editor(s). MDPI and/or the editor(s) disclaim responsibility for any injury to people or property resulting from any ideas, methods, instructions or products referred to in the content. |
© 2026 by the authors. Licensee MDPI, Basel, Switzerland. This article is an open access article distributed under the terms and conditions of the Creative Commons Attribution (CC BY) license (http://creativecommons.org/licenses/by/4.0/).
Copyright: This open access article is published under a Creative Commons CC BY 4.0 license, which permit the free download, distribution, and reuse, provided that the author and preprint are cited in any reuse.