

Submitted:
04 August 2026
Posted:
06 August 2026
You are already at the latest version
Abstract
Background: This study aimed to develop a stratified diagnostic strategy for differentiating focal organizing pneumonia (FOP) from peripheral lung cancer (PLC) by integrating CT-based morphological features with ¹⁸F-FDG PET metabolic parameters. Methods: A retrospective analysis included 102 patients with FOP and 135 patients with PLC confirmed by pathology or follow-up. All patients underwent 18F-FDG PET/CT. Lesions were stratified by diameter and compared between the FOP and PLC groups based on CT morphological features and PET metabolic parameters. A quantitative CT score was developed from significant morphological features using multivariate logistic regression and its diagnostic performance was evaluated. The performance of CT score, PET metabolic parameters and combined models were evaluated using ROC and DeLong test analysis. Results: In lesions≤10 mm, CT density distribution was the key discriminator. For 10-30 mm lesions, gender, multiple CT morphological features and metabolic tumor volume (MTV) showed significant differences (all P< 0.05). The CT scoring system achieved excellent discriminatory performance (AUC=0.961), performing better than PET (AUC=0.662, P< 0.001) and comparably to the combined PET/CT model (AUC=0.963, P=0.48). In lesions>30 mm, the combined PET/CT model (AUC=0.901) outperformed the CT score alone (AUC=0.824, P=0.03). Subgroup analysis revealed that PET added additional diagnostic value for lesions with CT scores < 49.7, increasing the AUC from 0.646 to 0.892 (P=0.02); however, the benefit was minimal for lesions with CT scores≥49.7. Conclusions: We propose a lesion size-guided diagnostic strategy integrating CT scoring and 18F-FDG PET. For small lesions (≤10 mm), CT follow-up is sufficient. For medium-sized lesions (10-30 mm), CT scoring alone provides high diagnostic accuracy. For larger lesions (>30 mm), CT scoring serves as initial screening, with PET reserved for low-score cases. This integrated diagnostic strategy can reduce unnecessary PET scans while preserving diagnostic efficacy, offering significant clinical value.
Keywords:
focal organizing pneumonia
; peripheral lung cancer
; CT score
; 18F-FDG PET/CT
1. Introduction
Organizing pneumonia (OP) is a non-specific pathological response to lung injury, characterized by an aberrant reparative process. Its characteristic pathological feature is the patchy filling of alveoli and bronchioles by granulation tissue plugs, known as Masson bodies[1,2,3]. These consist of inflammatory cell infiltrates, proliferating fibroblasts/myofibroblasts, and loose connective tissue. The etiologies of OP are diverse, including infection, connective tissue disease, drug reaction, inhalation injury, organ transplantation, and associated malignancy[4,5,6,7]. If no identifiable cause is present, it is termed cryptogenic organizing pneumonia (COP) and classified as an idiopathic interstitial pneumonia[5].
Focal organizing pneumonia (FOP) is a subtype of opportunistic pneumonia that presents as an isolated focal lesion[8,9]. The lack of specific clinical symptoms and the variety of imaging presentations make it difficult to distinguish this disease from peripheral lung cancer (PLC). Clinically, FOP is often misdiagnosed as PLC, leading to unnecessary puncture biopsy or surgical treatment[10]. In addition, although puncture biopsy is the ‘gold standard’ for the differential diagnosis of FOP and PLC, there are limitations in terms of sampling difficulties, diagnostic bias and the risk of puncture[11]. Therefore, there is an urgent need enhance the imaging capability for accurate differentiation between FOP and PLC to reduce the risk and patient burden of invasive procedures.
Computed tomography (CT) is the preferred imaging modality for evaluating pulmonary lesions, as it clearly displays the morphological characteristics of lesions and their spatial relationships with surrounding structures[12]. However, numerous benign and malignant lesions often exhibit atypical features on CT images, limiting diagnostic accuracy[13].18F-fluorodeoxyglucose positron emission tomography /computed tomography (18F-FDG PET/CT) is an integrated imaging technique that combines the high sensitivity of PET with the morphological accuracy of CT. As it provides information on glucose metabolism within lesions, it offers significant additional data for differentiating between benign and malignant lesions.[14]. A meta-analysis of 1,474 pulmonary nodules by Gould et al. [15] reported that PET/CT achieved a sensitivity of 96.8% and specificity of 77.8% for detecting malignancy in current practice. However, the diagnostic performance of this technique is significantly influenced by nodule size. Veronesi et al.[16]. demonstrated higher diagnostic efficacy for pulmonary lesions exceeding 15 mm in diameter, while Leef et al.[17]. confirmed its limited diagnostic value for lesions smaller than 10 mm. Consequently, in clinical practice, the indication for PET/CT should refer to CT imaging characteristics, including but not limited to nodule size, morphology, and density, to ensure diagnostic accuracy while avoiding unnecessary examinations. Based on this background, establishing an objective scoring system based on CT morphological features to stratify patient risk and selectively apply PET examinations is considered a solution with significant potential. Nevertheless, there remains a notable lack of research focused on developing size-specific diagnostic pathways that integrate both morphological evaluation and metabolic imaging for pulmonary lesion.[18,19].
This study retrospectively analyzed 18F-FDG PET/CT imaging data from 102 patients with FOP and 135 patients with PLC. We stratified enrolled patients based on lesion size to evaluate the diagnostic value of CT morphological features and PET metabolic parameters in distinguishing FOP from PLC. On the basis of this, we aimed to develop a quantitative scoring system based on CT morphological features, evaluate its independent diagnostic performance, and compare it with PET parameters (such as SUVmax). We further explored whether a combined model integrating CT scores and PET metabolic parameters could provide incremental diagnostic value. Ultimately, we aimed to establish a novel, lesion-size-oriented stratified diagnostic strategy to provide evidence-based support for clinical decision-making. We present this article in accordance with the STROBE reporting checklist (available at https://tlcr.amegroups.com/article/view/10.21037/tlcr-2026-1-0180/rc).
2. Methods and Materials
2.1. Patients
This retrospective study was approved by the Institutional Review Board (IRB) of Renmin Hospital of Wuhan University (approval number: ACCR-2023-016, date: 2026.7.24), which issued a waiver to the requirement that patients undergo informed consent. The research was performed at Renmin Hospital of Wuhan University between March 2018 and April 2024, with patients who had isolated pulmonary nodules/masses found on chest CT being recruited. Retrospectively and consecutively, 276 patients who had undergone High-Resolution Computed Tomography (HRCT) and 18F-FDG PET/CT tests at the hospital were included in this research based on the following inclusion criteria: (a) All patients were freshly diagnosed and had never received any invasive procedure, such as surgery, biopsy, or related treatments; (b) Accurate clinical data were provided, and the diagnosis was pathological or confirmed through 3-6 mouths’ follow-up; (c) All patients received 18F-FDG PET/CT.
The exclusion criteria were defined as follows: (a) Patients with lung cancer combined with systemic metastasis; (b) Those with comorbid cardiopulmonary diseases or other systemic neoplastic disorders that may potentially affect the results of the examination; (c) Individuals with incomplete clinical or imaging data. A total of 237 patients were enrolled in the final analysis, including 102 patients with FOP and 135 patients with PLC. Participants were categorized into three groups according to lesion size: ≤10 mm, 10-30 mm, and >30 mm. A flow diagram of the study design is presented in Figure 1. Patient demographic data, including age, gender, smoking history, clinical symptoms, and lesion site, were extracted from clinical records.
2.2. 18F-FDG PET/CT and High-Resolution CT Acquisition and Reconstruction
All 18F-FDG PET/CT scans were performed on a PET/CT scanner (Discovery 710, GE Healthcare, USA). Patients were required to fast for at least 6 hours, with blood glucose levels controlled below 7.0 mmol/L prior to 18F-FDG administration. A diagnostic PET/CT scan was acquired one hour after intravenous injection of 0.10 mCi/kg of 18F-FDG. The field of view comprised the region from the base of the skull to the mid-thighs, with the patient in a supine position. First, a low-dose CT scan without contrast enhancement was performed (tube current 80 mA, tube voltage 150 kV, matrix 512×512, pitch 1.75, reconstruction thickness and interval both 3.75mm) for precise anatomical localization and attenuation correction. Subsequently, a three-dimensional PET scan was performed from the skull base to the proximal thighs, with an acquisition time of 1.5 minutes per bed position and a reconstruction slice thickness of 3.75 mm. The PET datasets were reconstructed iteratively using the ordered-subset expectation maximization (OSEM) algorithm with attenuation correction. The acquired images were processed on the GE Healthcare Xeleris 3.0 workstation to generate PET, CT, and PET/CT fusion images. After completion of the PET/CT scan, with the patient maintaining the same supine position, a deep inspiratory HRCT scan was performed. This utilized a 64-detector row configuration with 1.25-mm detector width, a pitch of 0.53, and 1.25-mm collimation, operating at 120 kV and 150 mAs.
2.3. 18F-FDG PET/CT and (HR)CT Imaging Evaluation
Two experienced nuclear medicine physicians and radiologists (each with >10 years of experience in thoracic imaging), blinded to patient information and pathologic diagnosis, retrospectively analyzed the images and independently measured semi-quantitative parameters using an Advantage Workstation (version AW 4.6, GE Healthcare). In cases of disagreement, a chief physician with 20 years of experience in diagnostic thoracic imaging reviewed the interpretations to achieve consensus. Lesion size parameters and morphological characteristics were quantitatively analyzed from HRCT images. Each diagnostician independently analyzed the following CT morphological features in all patients: Density pattern (solid, mixed ground-glass, or pure ground-glass), Lobulation sign (shallow or deep), piculation sign (short or long), Spiculate protuberance, Bow-shaped depression sign, Cavitation and cavity wall characteristics (thin-walled or thick-walled),Cavity location (eccentric or centripetal),Relationship between cavities and bronchi (truncation or parallelism), Reversed halo sign, Bronchial involvement (intralesional, or marginal), Pleural indentation, Relationship to vessels (adjacency or penetration). A graphical representation of some of the CT morphologic features is shown in Figure S1. The morphological characteristics of pulmonary nodules were defined according to well-established radiological criteria referenced in prior literature[20,21,22,23,24,25].
All fused PET/CT images were semi-quantitatively analyzed using a GE AW 4.6 workstation, measuring the maximum dimension at the level of the largest lesion on the HRCT lung window. For each patient, the region of interest (ROI) was delineated around the tumor outline at the site of the largest cross-sectional area of the primary lung lesion on both CT and PET images. ROIs were manually segmented by a single experienced nuclear medicine physician, and the final ROIs were verified by a second nuclear medicine physician with over 10 years of experience in PET/CT diagnosis. The maximum standardized uptake value (SUVmax) was automatically measured by the system. The mean standardized uptake value (SUVmean) and metabolic tumor volume (MTV) of the primary lesion were obtained using a relative threshold method set at 42% of SUVmax, combined with semi-automated computer delineation across axial, sagittal, and coronal planes and manual segmentation refinement. Total lesion glycolysis (TLG) was calculated using the formula TLG = SUVmean × MTV.
2.4. Statistical Analysis
Statistical analyses were performed using MedCalc 20.2 and SPSS 27.0 software. Quantitative data conforming to a normal distribution were expressed as mean ± standard deviation (?x ± s ), while non-normally distributed quantitative data were presented as M (Q1, Q3). Qualitative data were described using frequencies and percentages. Intergroup comparisons were performed using Student’s t-test, Mann-Whitney U test, or χ2 test. A CT score was established via binary logistic regression (dependent variable: 0 = PLC, 1 = FOP). The regression coefficients (β values) for each CT feature are used to calculate the Linear Predictor (LP) for each patient. This LP is then linearly transformed into a 0–100 scoring system (CT score) using the following formula: CT score = (LP – Min (LP)) / (Max (LP) – Min (LP)) ×100. Higher scores indicate a greater tendency toward FOP. Predictive models were established, including CT models, PET models, and combined PET/CT models. The performance of each model was evaluated by plotting receiver operating characteristic (ROC) curves, and the differences in area under the curve (AUC) between models were compared using the DeLong test. To further explore the incremental value of PET, subgroup analyses were conducted based on the optimal CT score threshold, and the diagnostic performance of different models was compared within each subgroup. A two-sided P value<0.05 was considered statistically significant.
3. Result
3.1. Clinical Characteristics
The clinical characteristics of the enrolled patients are presented in Table 1. The study included 102 patients with FOP and 135 patients with PLC. Based on lesion diameter, participants were categorized into three groups: ≤10 mm (FOP: n=10, PLC: n=7), 10–30 mm (FOP: n=48, PLC: n=83), and >30 mm (FOP: n=44, PLC: n=45). The mean age of the FOP group was 63.2 ± 10.1 years (range: 42-86 years), with 73 males (71.6%) and 29 females (28.4%). For the PLC group, the mean age was 61.9 ± 10.2 years (range, 29-81 years), comprising 70 males (51.9%) and 65 females (48.1%). Significant differences were found in gender (P=0.001) and smoking history (P=0.007) between the two groups. In contrast, there were no significant differences in age, clinical symptoms, site of onset, or maximum diameter (P=0.69, 0.55, 0.58, and 0.85, respectively). The subgroup analysis of clinical characteristics revealed that the only significant differences between FOP and PLC were in gender within the 10-30 mm cohort (P=0.006) and in smoking history within the >30 mm cohort (P = 0.008).
3.2. Comparison of CT Morphological Features and PET Semi-quantitative Analyses
The comparative results of CT morphological features between FOP and PLC in each subgroup are displayed in Table 2. In the cohort of lesions ≤10 mm in diameter, only the density distribution demonstrated a statistically significant difference (P=0.02). PLC exhibited a higher prevalence of mixed ground-glass opacity (57.1% vs. 0%), whereas FOP predominantly presented with solid density (42.9% vs. 90.0%). In the 10–30 mm and >30 mm groups demonstrated significant differences in multiple morphological features. PLC showed a significantly higher frequency of deep lobulation, short spiculation, and bronchial truncation at the lesion edge compared to FOP (P<0.05 for all comparisons, see Table 2). Conversely, FOP demonstrated significantly higher prevalence of the following CT features compared to PLC: Spiculate protuberance, Bow-shaped depression and Vascular adjacency (P<0.05 for all comparisons, see Table 2). The reversed halo sign differed only in the 10-30 mm group (P=0.008), while cavitation characteristics showed no statistical significance (P>0.05).
As shown in Figure 2, FOP patients exhibited significantly lower SUVmax, SUVmean, and TLG values than PLC patients in lesions ≥30 mm (all P < 0.001), while MTV showed no statistical significance (P=0.63). Conversely, in the 10-30 mm cohort, MTV values were higher in FOP patients [5.11 (3.31-10.15)] compared to PLC patients [3.69 (1.78-5.82)], with a statistically significant difference (P = 0.002). For lesions ≤10 mm, no PET parameters showed significant differences.
3.3. Multi-Variable Logistic Regression Analyses of FOP and PLC Based on CT Morphological Features
To establish a quantifiable diagnostic tool, we analyzed the included CT imaging features using binary logistic regression, stratified by lesion size. In the≤10 mm group, significant differences existed in CT density parameters (χ2=7.71, P=0.02), but logistic regression models were not constructed due to insufficient sample size. In the 10-30 mm group, multivariate analysis identified seven CT features with independent predictive value (all P<0.05) for constructing the final model (see Table 3). The regression coefficient (β) indicates each feature’s contribution to Logit(P), where a positive β value represents a feature favoring FOP (protective factor), and a negative value favors lung cancer (risk factor). Based on these coefficients, we calculated a LP value for each patient in the 10-30 mm group using the following formula:
LP = (2.129 × Reversed halo sign) + (2.006 × Internal bronchial truncation) + (–2.188 × External bronchial truncation) + (1.615 × Spiculate protuberance) + (1.783 × Bow-shaped depression sign) + (1.956 × Vascular adjacency) + (-1.681 × Vascular penetration) + (-1.672 × Short spines) + (0.165 × Long spines) + (1.332 × Shallow lobulation) + (-0.953 × Deep lobulation) – 1.188 (coded as 1 if the categorical variable is present, 0 otherwise). All patients’ LP values were linearly converted to a 0-100 CT score, where higher scores indicate greater likelihood of FOP. In the >30 mm group, multivariate analysis identified four independent CT predictors. Corresponding calculation formulas were derived based on regression coefficients: LP=(1.451 × Shallow lobulation) + (-0.747 × Deep lobulation) + (1.594 × Bow-shaped depression sign) +(1.283 × Internal bronchial truncation) + (–0.546 × External bronchial truncation) + (1.250 × Vascular adjacency) + (-1.400 × Vascular penetration) – 1.084, and linearly transformed to obtain the CT score. Representative images from typical cases are presented in Figure S2 and Figure S3.
3.4. Stratified Diagnostic Model and ROC Performance Evaluation
Based on the CT score obtained through multivariate analysis, we established CT-based models, PET-based models, and combined PET/CT models in both the 10-30 mm group and the>30 mm group. In the 10-30 mm group, ROC analysis identified an optimal CT score cutoff value of 40.4, with a sensitivity of 91.7% and a specificity of 88.0%. For the>30 mm group, the optimal cutoff was 49.7, yielding a sensitivity of 79.5% and a specificity of 73.3%.
As shown in Figure 3, in the 10–30 mm group, the CT score achieved an AUC of 0.961 (95% CI: 0.912–0.987) for distinguishing FOP from PLC, demonstrating significantly higher diagnostic performance than the PET model (AUC: 0.662, 95% CI: 0.574–0.742; P<0.001), but the difference was not statistically significant compared with the combined model (AUC: 0.963, 95% CI: 0.915–0.988; P=0.48).
In the >30 mm group, the combined model’s diagnostic performance (AUC: 0.901, 95% CI: 0.819-0.954) significantly outperformed the standalone CT score model (AUC: 0.824, 95% CI: 0.729-0.896; P=0.03). To further evaluate PET’s incremental value, we performed a subgroup analysis of the >30 mm group using the optimal CT score cutoff (49.7 points). As shown in Table S1, in the low-probability group with CT scores <49.7 points, the CT model had limited discriminatory ability (AUC=0.646). Within this subgroup, the PET parameter SUVmax demonstrated significant incremental value, achieving a standalone diagnostic AUC of 0.875 at an optimal threshold of 7.4. After further integrating CT scores with SUVmax to construct a combined PET-CT model, diagnostic performance significantly improved (AUC=0.892) and demonstrated superiority compared to using CT scores alone (P=0.02). In the subgroup with CT scores ≥49.7, no significant differences in diagnostic performance were observed among the models (CT score, SUVmax, and PET/CT model) (all P>0.05). Based on the above findings, a stratified decision-making algorithm integrating CT morphological scores and 18F-FDG PET metabolic parameters is proposed to optimize the clinical diagnostic pathway, as detailed in Figure 4.
4. Discussion
It can be difficult to differentiate FOP from PLC when it presents as an isolated lesion. Although invasive procedures such as needle biopsy can provide an accurate pathological diagnosis, its invasive nature often leads to a higher incidence of complications[2]. To enhance diagnostic and differential diagnostic strategies for FOP and PLC in clinical practice, this study conducted a stratified analysis based on lesion diameter. We first developed a CT scoring system to evaluate its diagnostic performance and compared it with PET parameter models and combined PET/CT models. Based on these results, we further constructed a stratified decision process integrating CT scores with 18F-FDG PET metabolic parameters to optimize the diagnostic pathway.
This study demonstrates that CT density parameters are the most important imaging biomarkers in distinguishing FOP from PLC, particularly for small pulmonary lesions (<10 mm group). FOP mainly presents as solid nodules (9 out of 10 cases), whereas PLC is predominantly characterized by mixed ground-glass opacities (4 out of 7 cases). This distinction is due to the greater abundance of fibrous tissue within FOP, resulting in a denser structure; while tumor cells in PLC grow along the surface of the alveolar walls without completely filling the alveoli, leading to a mixed ground-glass appearance on imaging[26]. Although routine PET/CT is not presently recommended for solitary pulmonary nodules(SPNs)<10 mm[27], Tang et al. [28] showed in a study of 26 sub-centimeter pulmonary nodules that PET/CT demonstrated a positive predictive value (PPV) of 100% and a negative predictive value (NPV) of 75.0%, indicating its potential clinical utility. Notably, this study demonstrates that when 18F-FDG uptake is mildly elevated, CT density characteristics, the ratio of solid component to solid and ground-glass opacity distribution pattern, provide valuable complementary diagnostic information. Future studies should conduct larger-scale, prospective, multicenter research to validate the synergistic efficacy of multimodal imaging integration and establish diagnostic protocols for small pulmonary lesions.
In this study, a male predominance in FOP and a female predominance in PLC were observed in the 10–30 mm group, consistent with previous epidemiological findings[29,30]. Notably, in the>30 mm subgroup, a greater proportion of FOP patients had a history of smoking (29 out of 44 cases). In the >30 mm group, a higher proportion of FOP patients had a history of smoking (29 out of 44 cases). However, due to potential cohort selection bias, the diagnostic value of demographic factors (gender and smoking history) in differential diagnosis is limited. Therefore, they should only serve as partial clinical reference criteria. CT features analysis revealed that in both the 10–30 mm and >30 mm groups, FOPs predominantly exhibited shallow lobulation, short burr, bronchial truncation or penetration, close association with adjacent vessels, spiculate protuberance, and bow-shaped depression sign. These features stem from fibroblast proliferation, scar contracture, and adaptive growth toward vascular structures[22,31]. Conversely, PLC typically manifested deep lobulation, short spiculation, and bronchial rigidity with edge truncation, along with frequent distal atelectasis or obstructive pneumonia. This correlates with its infiltrative growth heterogeneity, intratumoral fibrosis, and peritumoral interstitial reaction[8]. Cavity features showed no significant discriminative value between FOP and PLC (P>0.05), reflecting pathological overlap between tumor necrosis and inflammatory liquefaction. Although the diagnostic value of the reverse halo sign in distinguishing FOP from PLC is known[32], we found a significantly higher detection rate of this sign in the 10–30 mm group (14.6% vs. 2.4%; P=0.008), a novel finding not previously reported. This lesion characteristic correlates with pulmonary nodule size and may relate to its pathological evolution (from the exudative phase to the organization phase, ultimately progressing to the consolidation phase)[33].
As the most widely used radiotracer, 18F-FDG reflects biological activity in lesions by quantifying glucose metabolism[34,35]. Due to the Warburg effect (accelerated aerobic glycolysis), glucose metabolism is significantly elevated in tumor cells. This metabolic disparity was observed in lesions >30 mm: the SUVmax, SUVmean, and TLG in the PLC group were significantly higher than those in the FOP group (P<0.001), whereas there was no significant difference in MTV between the two groups (P=0.63)[36,37]. This indicates that lesion volume alone cannot discriminate benign from malignant lesions and should be integrated with metabolic activity parameters. However, in the 10-30 mm subgroup, FOP exhibited significantly higher MTV than PLC (5.11 vs. 3.69, P=0.002). Based on previous studies[38,39], potential pathological mechanisms may include: 1) inflammatory infiltration around FOPs expands the metabolic volume, while PLC metabolism is spatially concentrated within the tumor core due to heterogeneity; 2) actively proliferating fibroblasts within FOPs increase their metabolic volume.
CT is the preferred imaging assessment method for pulmonary focal lesions. It has specific advantages in clearly delineating the morphological features of lesions[12]. This study innovatively used multivariate logistic regression analysis to determine specific CT scoring systems for various sizes of pulmonary lesions. Multivariate analysis identified seven CT features with independent predictive value in the 10-30 mm group. Of these, the reversed halo sign (β=2.129), bronchial obliteration (β=2.006), and bow-shaped depression (β=1.783) had the highest predictive values for FOP. The CT score, which was built based on the features, demonstrated excellent diagnostic performance. This included an AUC of 0.961, which was significantly higher than that of the MTV (AUC=0.662, P<0.001). However, no significant difference was found when compared with the combined model (PET/CT) (AUC = 0.963, P = 0.48). These results suggest that a diagnosis based solely on the morphological features of CT is adequate for intermediate-sized lesions, which is consistent with the findings of Mazzone et al. [40]. Therefore, for lesions measuring 10-30 mm, CT scoring is recommended as the initial diagnostic method. A score of ≥40.4 strongly supports a diagnosis of FOP and further investigation is required, while a score of <40.4 suggests the possibility of PLC and additional workup is required. This approach should spare most patients with intermediate-sized lesions from unnecessary PET scans or invasive tests, saving medical resources and reducing expenditure. Furthermore, while this study indicates that PET/CT has limited utility in distinguishing FOP from PLC within this size range, it remains indispensable for clinical staging and prognostic assessment once diagnosis is confirmed, in accordance with clinical guidelines[12,41].
In the>30 mm group, the study identified four key CT features, with shallow lobulation (β=1.451) and the bow-shaped depression sign (β=1.594) were demonstrated to be valuable for identifying FOP. Unlike previous groups, the PET metabolic parameter SUVmax exhibited incremental diagnostic value in this cohort. Combining CT scores with SUVmax significantly improved diagnostic performance (AUC=0.901) compared to CT scores alone (AUC=0.824, P=0.03), consistent with the biological behavior of increased glucose metabolism in larger malignant tumors[42]. Further stratification using a CT score threshold of 49.7 revealed that in the low CT score subgroup (CT score<49.7), PET imaging contributed significant incremental value, elevating the diagnostic AUC from 0.646 (CT score alone) to 0.892 (combined model). Conversely, in the high CT score subgroup, CT alone demonstrated high diagnostic value. Therefore, for lesions>30 mm, a two-step diagnostic strategy is recommended: First, perform initial screening based on CT score. A diagnostic score of≥49.7 points indicates a high probability of FOP, warranting subsequent clinical follow-up observation. If the score is<49.7 points, further investigation with 18F-FDG PET is recommended. A PET-derived SUVmax value≤7.4 supports the diagnosis of FOP and suggests short-term imaging follow-up. Conversely, a higher SUVmax value raises suspicion for high-risk conditions such as PLC, and biopsy should be considered for definitive diagnosis.
This research has the following limitations: (1) The retrospective design may have caused case selection bias, particularly in the subgroup with lesions ≤10 mm (n = 17), where the statistical power was insufficient, which could potentially jeopardise the validity of the diagnostic performance evaluation at this threshold. Subsequent research needs to increase the size of the cohort to develop a more inclusive, stratified, multimodal diagnostic paradigm. (2) As all the data came from a single centre, external multicentre validation is required to verify the universality of the scoring system. (3) The CT-based scoring system is a subjective morphological evaluation; although detailed, standardised definitions and evaluation protocols are provided, interobserver variation is still possible.
5. Conclusions
In conclusion, this study utilized CT morphological features and PET metabolic parameters derived from 18F-FDG PET/CT to differentiate FOP from PLC. A CT scoring system tailored to lesion size was developed based on CT morphological features. This system was then applied to the 10-30 mm and >30 mm subgroups. Findings revealed that for lesions measuring 10-30 mm, the CT scoring system alone demonstrated high diagnostic performance. For lesions>30 mm, a stratified strategy based on CT scores (follow-up for scores≥49.7, PET examination for scores<49.7) optimizes the diagnostic workflow. Ultimately, we establish a novel, lesion-size-oriented stratified diagnostic strategy to provide evidence-based support for clinical decision-making.
Supplementary Materials
The following supporting information can be downloaded at the website of this paper posted on Preprints.org.
Data Availability Statement
The raw data supporting the conclusions of this article will be made available by the corresponding author upon reasonable request.
References
- Cho, Y.H.; Chae, E.J.; Song, J.W.; Do, K.H.; Jang, S.J. Chest CT imaging features for prediction of treatment response in cryptogenic and connective tissue disease-related organizing pneumonia. Eur. Radiol. 2020, 30(5), 2722–30. [Google Scholar] [CrossRef]
- Harris, K.; Puchalski, J.; Sterman, D. Recent Advances in Bronchoscopic Treatment of Peripheral Lung Cancers. Chest 2017, 151(3), 674–85. [Google Scholar] [CrossRef] [PubMed]
- Drakopanagiotakis, F.; Polychronopoulos, V.; Judson, M.A. Organizing pneumonia. Am. J. Med. Sci. 2008, 335(1), 34–9. [Google Scholar] [CrossRef] [PubMed]
- Myers, J.L.; Colby, T.V. Pathologic manifestations of bronchiolitis, constrictive bronchiolitis, cryptogenic organizing pneumonia, and diffuse panbronchiolitis. Clin. Chest Med. 1993, 14(4), 611–22. [Google Scholar] [CrossRef]
- American Thoracic Society/European Respiratory Society International Multidisciplinary Consensus Classification of the Idiopathic Interstitial Pneumonias. This joint statement of the American Thoracic Society (ATS), and the European Respiratory Society (ERS) was adopted by the ATS board of directors, June 2001 and by the ERS Executive Committee, June 2001. Am. J. Respir. Crit. Care Med. 2002, 165(2), 277–304. [CrossRef] [PubMed]
- Ryu, J.H.; Myers, J.L.; Swensen, S.J. Bronchiolar disorders. Am. J. Respir. Crit. Care Med. 2003, 168(11), 1277–92. [Google Scholar] [CrossRef] [PubMed]
- Cordier, J.F. Organising pneumonia. Thorax 2000, 55(4), 318–28. [Google Scholar] [CrossRef] [PubMed]
- Maldonado, F.; Daniels, C.E.; Hoffman, E.A.; Yi, E.S.; Ryu, J.H. Focal organizing pneumonia on surgical lung biopsy: causes, clinicoradiologic features, and outcomes. Chest 2007, 132(5), 1579–83. [Google Scholar] [CrossRef] [PubMed]
- Lazor, R.; Vandevenne, A.; Pelletier, A.; Leclerc, P.; Court-Fortune, I.; Cordier, J.F. Cryptogenic organizing pneumonia. Characteristics of relapses in a series of 48 patients. The Groupe d’Etudes et de Recherche sur les Maladles “Orphelines” Pulmonaires (GERM”O”P). Am. J. Respir. Crit. Care Med. 2000, 162 2 Pt 1, 571–7. [Google Scholar] [CrossRef] [PubMed]
- Zheng, Z.; Pan, Y.; Song, C.; Wei, H.; Wu, S.; Wei, X.; et al. Focal organizing pneumonia mimicking lung cancer: a surgeon’s view. Am. Surg. 2012, 78(1), 133–7. [Google Scholar] [CrossRef]
- Romero, S.; Barroso, E.; Rodriguez-Paniagua, M.; Aranda, F.I. Organizing pneumonia adjacent to lung cancer: frequency and clinico-pathologic features. Lung Cancer 2002, 35(2), 195–201. [Google Scholar] [CrossRef] [PubMed]
- MacMahon, H.; Naidich, D.P.; Goo, J.M.; Lee, K.S.; Leung, A.N.C.; Mayo, J.R.; et al. Guidelines for Management of Incidental Pulmonary Nodules Detected on CT Images: From the Fleischner Society 2017. Radiology 2017, 284(1), 228–43. [Google Scholar] [CrossRef] [PubMed]
- Prokop, M.; Schaefer-Prokop, C.; Jacobs, C.; Snoeckx, A.; Biederer, J.; Frauenfelder, T.; et al. Aggressiveness-guided nodule management for lung cancer screening in Europe-justification for follow-up intervals and definition of growth. Eur. Radiol. 2025. [Google Scholar] [CrossRef] [PubMed]
- Taralli, S.; Scolozzi, V.; Foti, M.; Ricciardi, S.; Forcione, A.R.; Cardillo, G.; et al. (18)F-FDG PET/CT diagnostic performance in solitary and multiple pulmonary nodules detected in patients with previous cancer history: reports of 182 nodules. Eur. J. Nucl. Med. Mol. Imaging 2019, 46(2), 429–36. [Google Scholar] [PubMed]
- Gould, M.K.; Maclean, C.C.; Kuschner, W.G.; Rydzak, C.E.; Owens, D.K. Accuracy of positron emission tomography for diagnosis of pulmonary nodules and mass lesions: a meta-analysis. Jama 2001, 285(7), 914–24. [Google Scholar] [CrossRef] [PubMed]
- Veronesi, G.; Travaini, L.L.; Maisonneuve, P.; Rampinelli, C.; Bertolotti, R.; Spaggiari, L.; et al. Positron emission tomography in the diagnostic work-up of screening-detected lung nodules. Eur. Respir. J. 2015, 45(2), 501–10. [Google Scholar] [CrossRef] [PubMed]
- Leef, J.L., 3rd; Klein, J.S. The solitary pulmonary nodule. Radiol. Clin. North Am. 2002, 40(1), 123–43, ix. [Google Scholar] [CrossRef] [PubMed]
- Vachani, A.; Zheng, C.; Amy Liu, I.L.; Huang, B.Z.; Osuji, T.A.; Gould, M.K. The Probability of Lung Cancer in Patients With Incidentally Detected Pulmonary Nodules: Clinical Characteristics and Accuracy of Prediction Models. Chest 2022, 161(2), 562–71. [Google Scholar] [CrossRef] [PubMed]
- Kim, H.; Goo, J.M.; Park, C.M. A simple prediction model using size measures for discrimination of invasive adenocarcinomas among incidental pulmonary subsolid nodules considered for resection. Eur. Radiol. 2019, 29(4), 1674–83. [Google Scholar] [PubMed]
- Deng, L.; Zhang, G.; Lin, X.; Han, T.; Zhang, B.; Jing, M.; et al. Comparison of Spectral and Perfusion Computed Tomography Imaging in the Differential Diagnosis of Peripheral Lung Cancer and Focal Organizing Pneumonia. Front Oncol. 2021, 11, 690254. [Google Scholar] [CrossRef] [PubMed]
- Zhang, G.; Cao, Y.; Zhang, J.; Zhao, Z.; Zhang, W.; Huang, L.; et al. Focal organizing pneumonia in patients: differentiation from solitary bronchioloalveolar carcinoma using dual-energy spectral computed tomography. Am. J. Transl. Res. 2020, 12(7), 3974–83. [Google Scholar] [PubMed]
- Kohno, N.; Ikezoe, J.; Johkoh, T.; Takeuchi, N.; Tomiyama, N.; Kido, S.; et al. Focal organizing pneumonia: CT appearance. Radiology 1993, 189(1), 119–23. [Google Scholar] [CrossRef] [PubMed]
- Watanabe, K.; Harada, T.; Yoshida, M.; Shirakusa, T.; Iwasaki, A.; Yoneda, S.; et al. Organizing pneumonia presenting as a solitary nodular shadow on a chest radiograph. Respiration 2003, 70(5), 507–14. [Google Scholar] [CrossRef] [PubMed]
- Zare Mehrjardi, M.; Kahkouee, S.; Pourabdollah, M. Radio-pathological correlation of organizing pneumonia (OP): a pictorial review. Br. J. Radiol. 2017, 90(1071), 20160723. [Google Scholar] [CrossRef] [PubMed]
- Lee, J.S.; Lynch, D.A.; Sharma, S.; Brown, K.K.; Müller, N.L. Organizing pneumonia: prognostic implication of high-resolution computed tomography features. J. Comput Assist Tomogr. 2003, 27(2), 260–5. [Google Scholar] [CrossRef] [PubMed]
- Travis, W.D.; Brambilla, E.; Noguchi, M.; Nicholson, A.G.; Geisinger, K.R.; Yatabe, Y.; et al. International association for the study of lung cancer/american thoracic society/european respiratory society international multidisciplinary classification of lung adenocarcinoma. J. Thorac. Oncol. 2011, 6(2), 244–85. [Google Scholar] [CrossRef] [PubMed]
- Ettinger, D.S.; Wood, D.E.; Aisner, D.L.; Akerley, W.; Bauman, J.R.; Bharat, A.; et al. NCCN Guidelines® Insights: Non-Small Cell Lung Cancer, Version 2.2023. J. Natl. Compr. Canc Netw. 2023, 21(4), 340–50. [Google Scholar] [CrossRef] [PubMed]
- Tang, K.; Wang, L.; Lin, J.; Zheng, X.; Wu, Y. The value of 18F-FDG PET/CT in the diagnosis of different size of solitary pulmonary nodules. Medicine 2019, 98(11), e14813. [Google Scholar] [CrossRef] [PubMed]
- Melloni, G.; Cremona, G.; Bandiera, A.; Arrigoni, G.; Rizzo, N.; Varagona, R.; et al. Localized organizing pneumonia: report of 21 cases. Ann. Thorac. Surg. 2007, 83(6), 1946–51. [Google Scholar] [CrossRef] [PubMed]
- Lee, H.Y.; Lee, S.W.; Lee, K.S.; Jeong, J.Y.; Choi, J.Y.; Kwon, O.J.; et al. Role of CT and PET Imaging in Predicting Tumor Recurrence and Survival in Patients with Lung Adenocarcinoma: A Comparison with the International Association for the Study of Lung Cancer/American Thoracic Society/European Respiratory Society Classification of Lung Adenocarcinoma. J. Thorac. Oncol. 2015, 10(12), 1785–94. [Google Scholar] [PubMed]
- Yang, P.S.; Lee, K.S.; Han, J.; Kim, E.A.; Kim, T.S.; Choo, I.W. Focal organizing pneumonia: CT and pathologic findings. J. Korean Med. Sci. 2001, 16(5), 573–8. [Google Scholar] [CrossRef] [PubMed]
- Kumar, H.; Fernandez, C.J.; Kolpattil, S.; Munavvar, M.; Pappachan, J.M. Discrepancies in the clinical and radiological profiles of COVID-19: A case-based discussion and review of literature. World J. Radiol. 2021, 13(4), 75–93. [Google Scholar] [CrossRef] [PubMed]
- Yang, N.; Ou, Z.; Sun, Q.; Pan, J.; Wu, J.; Xue, C. Chlamydia psittaci pneumonia - evolutionary aspects on chest CT. BMC Infect. Dis. 2025, 25(1), 11. [Google Scholar] [CrossRef] [PubMed]
- Duhaylongsod, F.G.; Lowe, V.J.; Patz, E.F., Jr.; Vaughn, A.L.; Coleman, R.E.; Wolfe, W.G. Lung tumor growth correlates with glucose metabolism measured by fluoride-18 fluorodeoxyglucose positron emission tomography. Ann. Thorac. Surg. 1995, 60(5), 1348–52. [Google Scholar] [CrossRef] [PubMed]
- Higashi, K.; Ueda, Y.; Yagishita, M.; Arisaka, Y.; Sakurai, A.; Oguchi, M.; et al. FDG PET measurement of the proliferative potential of non-small cell lung cancer. J. Nucl. Med. 2000, 41(1), 85–92. [Google Scholar] [PubMed]
- Goo, J.M.; Im, J.G.; Do, K.H.; Yeo, J.S.; Seo, J.B.; Kim, H.Y.; et al. Pulmonary tuberculoma evaluated by means of FDG PET: findings in 10 cases. Radiology 2000, 216(1), 117–21. [Google Scholar] [CrossRef] [PubMed]
- Niyonkuru, A.; Chen, X.; Bakari, K.H.; Wimalarathne, D.N.; Bouhari, A.; Arnous, M.M.R.; et al. Evaluation of the diagnostic efficacy of (18) F-Fluorine-2-Deoxy-D-Glucose PET/CT for lung cancer and pulmonary tuberculosis in a Tuberculosis-endemic Country. Cancer Med. 2020, 9(3), 931–42. [Google Scholar] [CrossRef] [PubMed]
- Yang, Y.; Yang, X.; Wang, Y.; Xu, J.; Shen, H.; Gou, H.; et al. Combined Consideration of Tumor-Associated Immune Cell Density and Immune Checkpoint Expression in the Peritumoral Microenvironment for Prognostic Stratification of Non-Small-Cell Lung Cancer Patients. Front Immunol. 2022, 13, 811007. [Google Scholar] [CrossRef] [PubMed]
- Zhang, L.; He, Q.; Li, W.; Zhang, R. The value of (99m)Tc-methylene diphosphonate single photon emission computed tomography/computed tomography in diagnosis of fibrous dysplasia. BMC Med. Imaging 2017, 17(1), 46. [Google Scholar] [CrossRef] [PubMed]
- Mazzone, P.J.; Lam, L. Evaluating the Patient With a Pulmonary Nodule: A Review. Jama 2022, 327(3), 264–73. [Google Scholar] [CrossRef] [PubMed]
- Bai, C.; Choi, C.M.; Chu, C.M.; Anantham, D.; Chung-Man Ho, J.; Khan, A.Z.; et al. Evaluation of Pulmonary Nodules: Clinical Practice Consensus Guidelines for Asia. Chest 2016, 150(4), 877–93. [Google Scholar] [PubMed]
- Garcia-Velloso, M.J.; Bastarrika, G.; de-Torres, J.P.; Lozano, M.D.; Sanchez-Salcedo, P.; Sancho, L.; et al. Assessment of indeterminate pulmonary nodules detected in lung cancer screening: Diagnostic accuracy of FDG PET/CT. Lung Cancer 2016, 97, 81–6. [Google Scholar] [CrossRef] [PubMed]
Figure 1.
Flowchart of the patient.
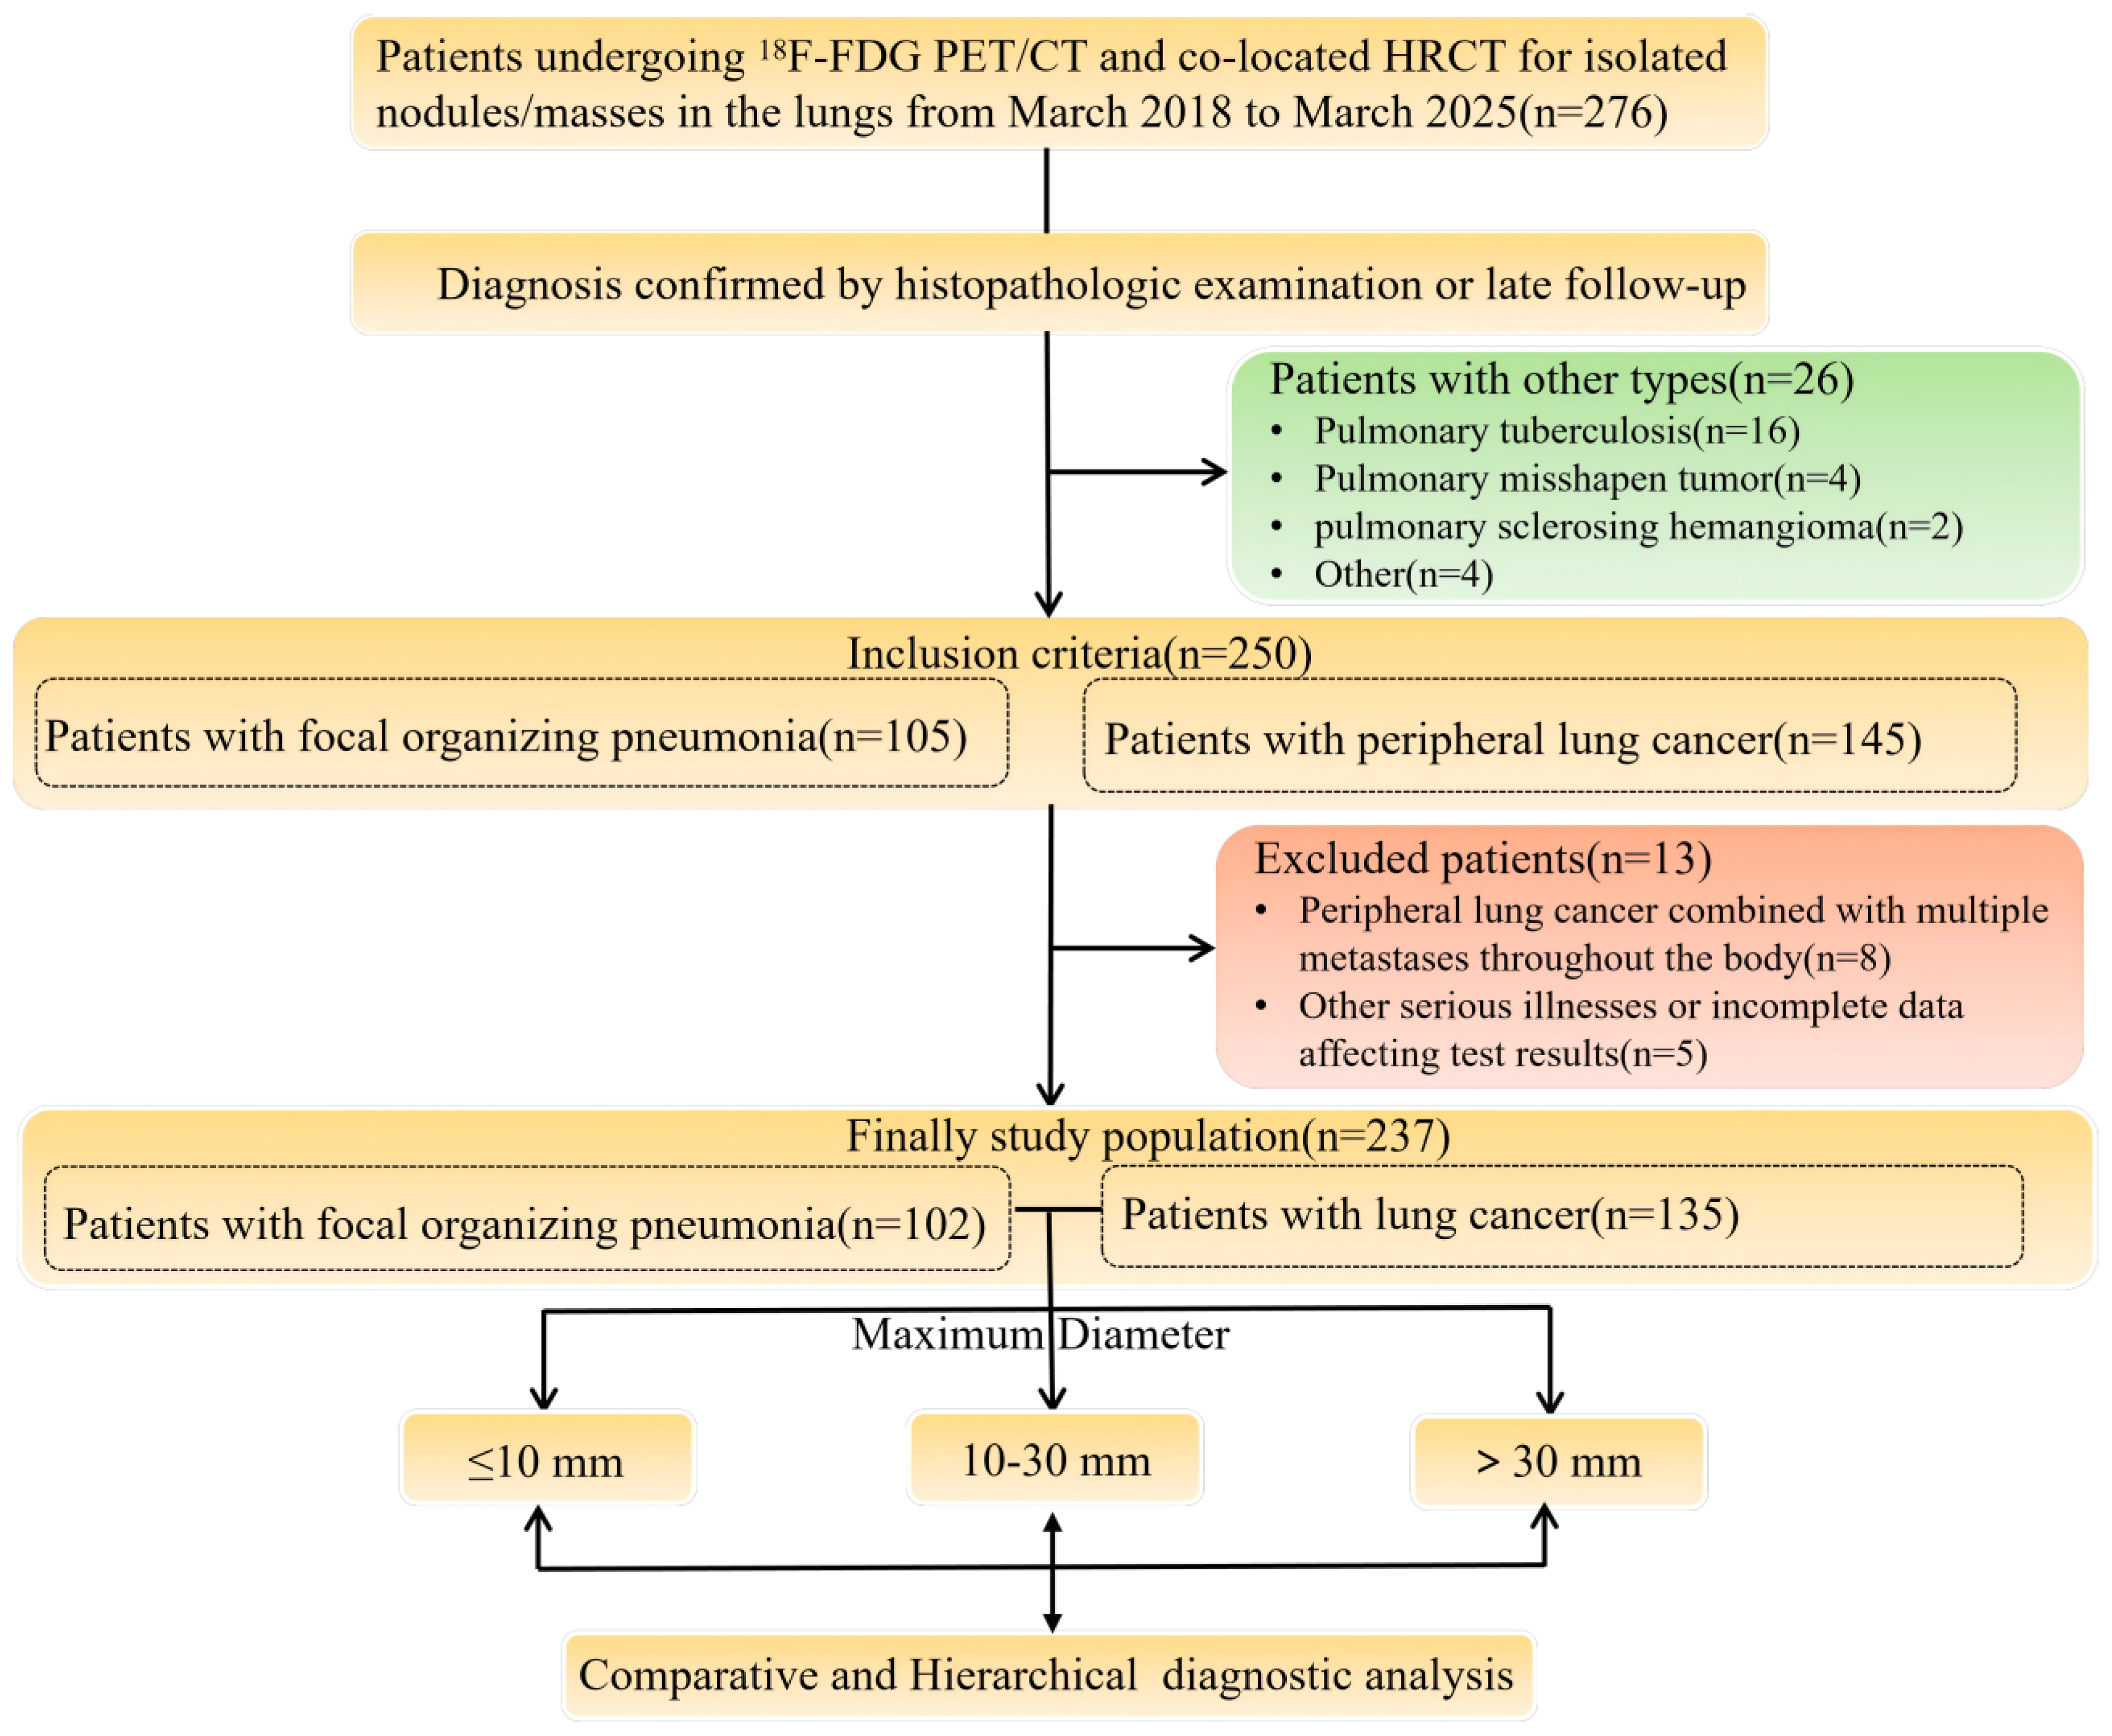
Figure 2.
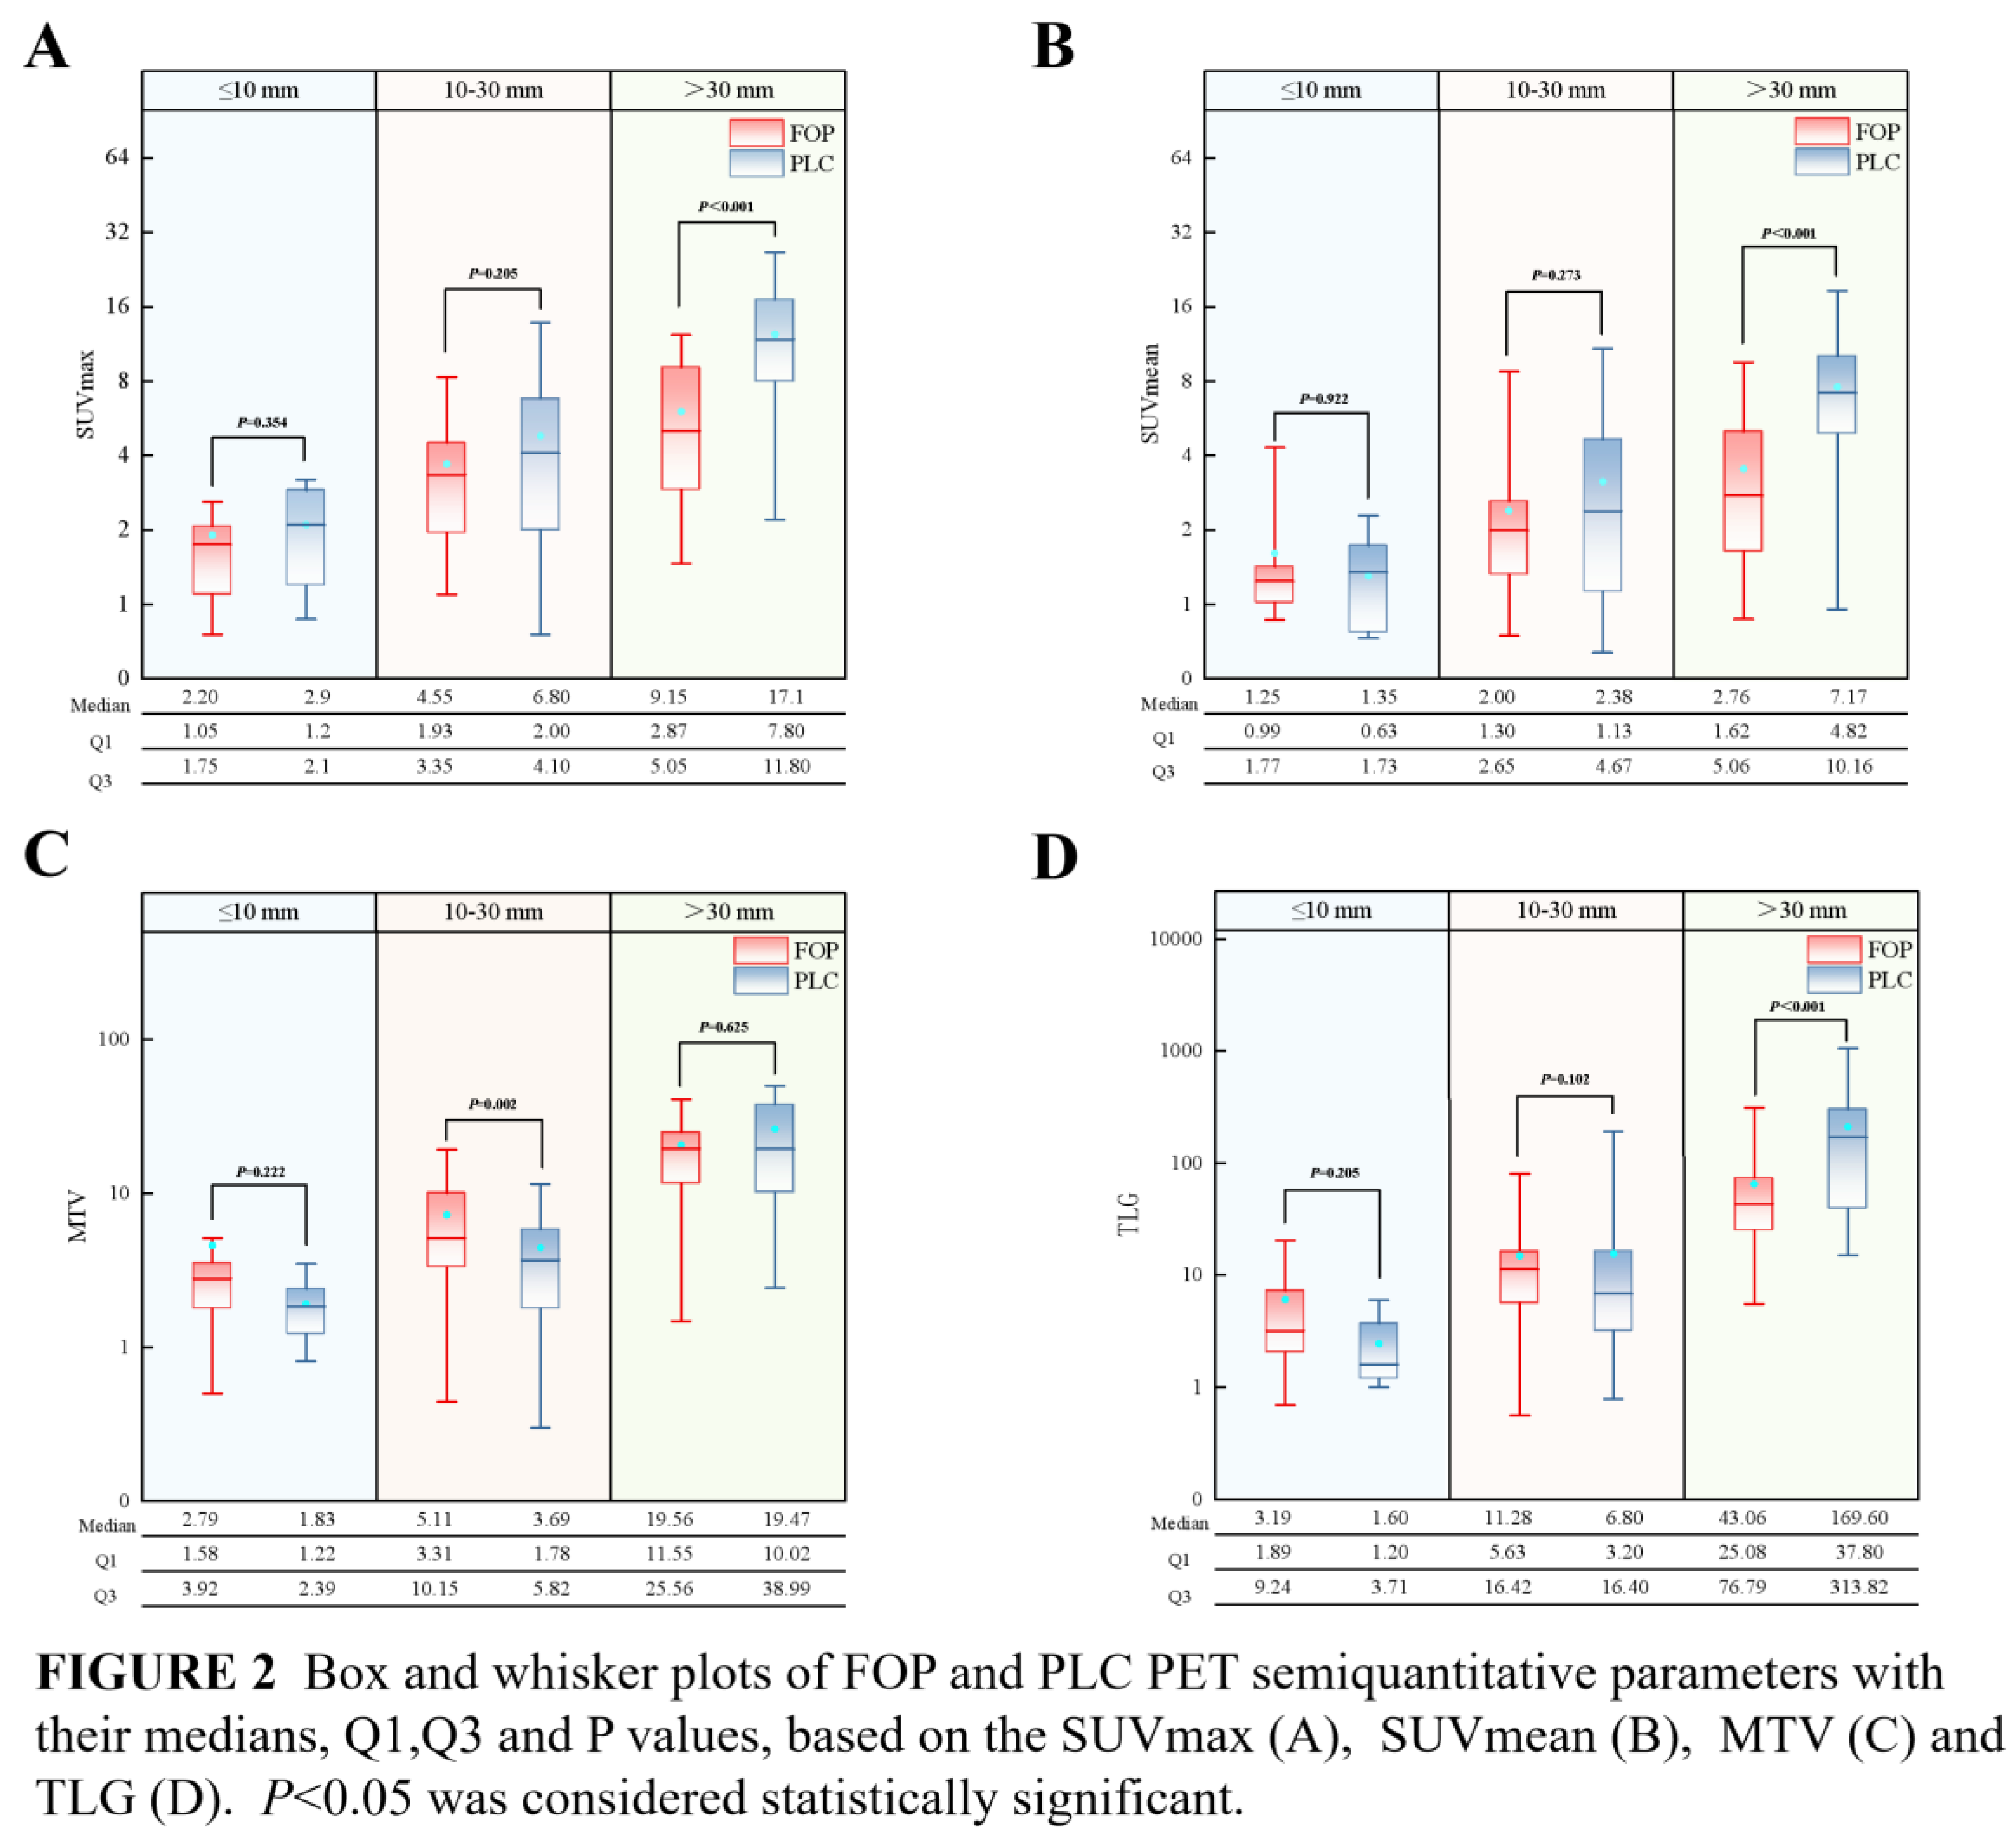
Figure 3.
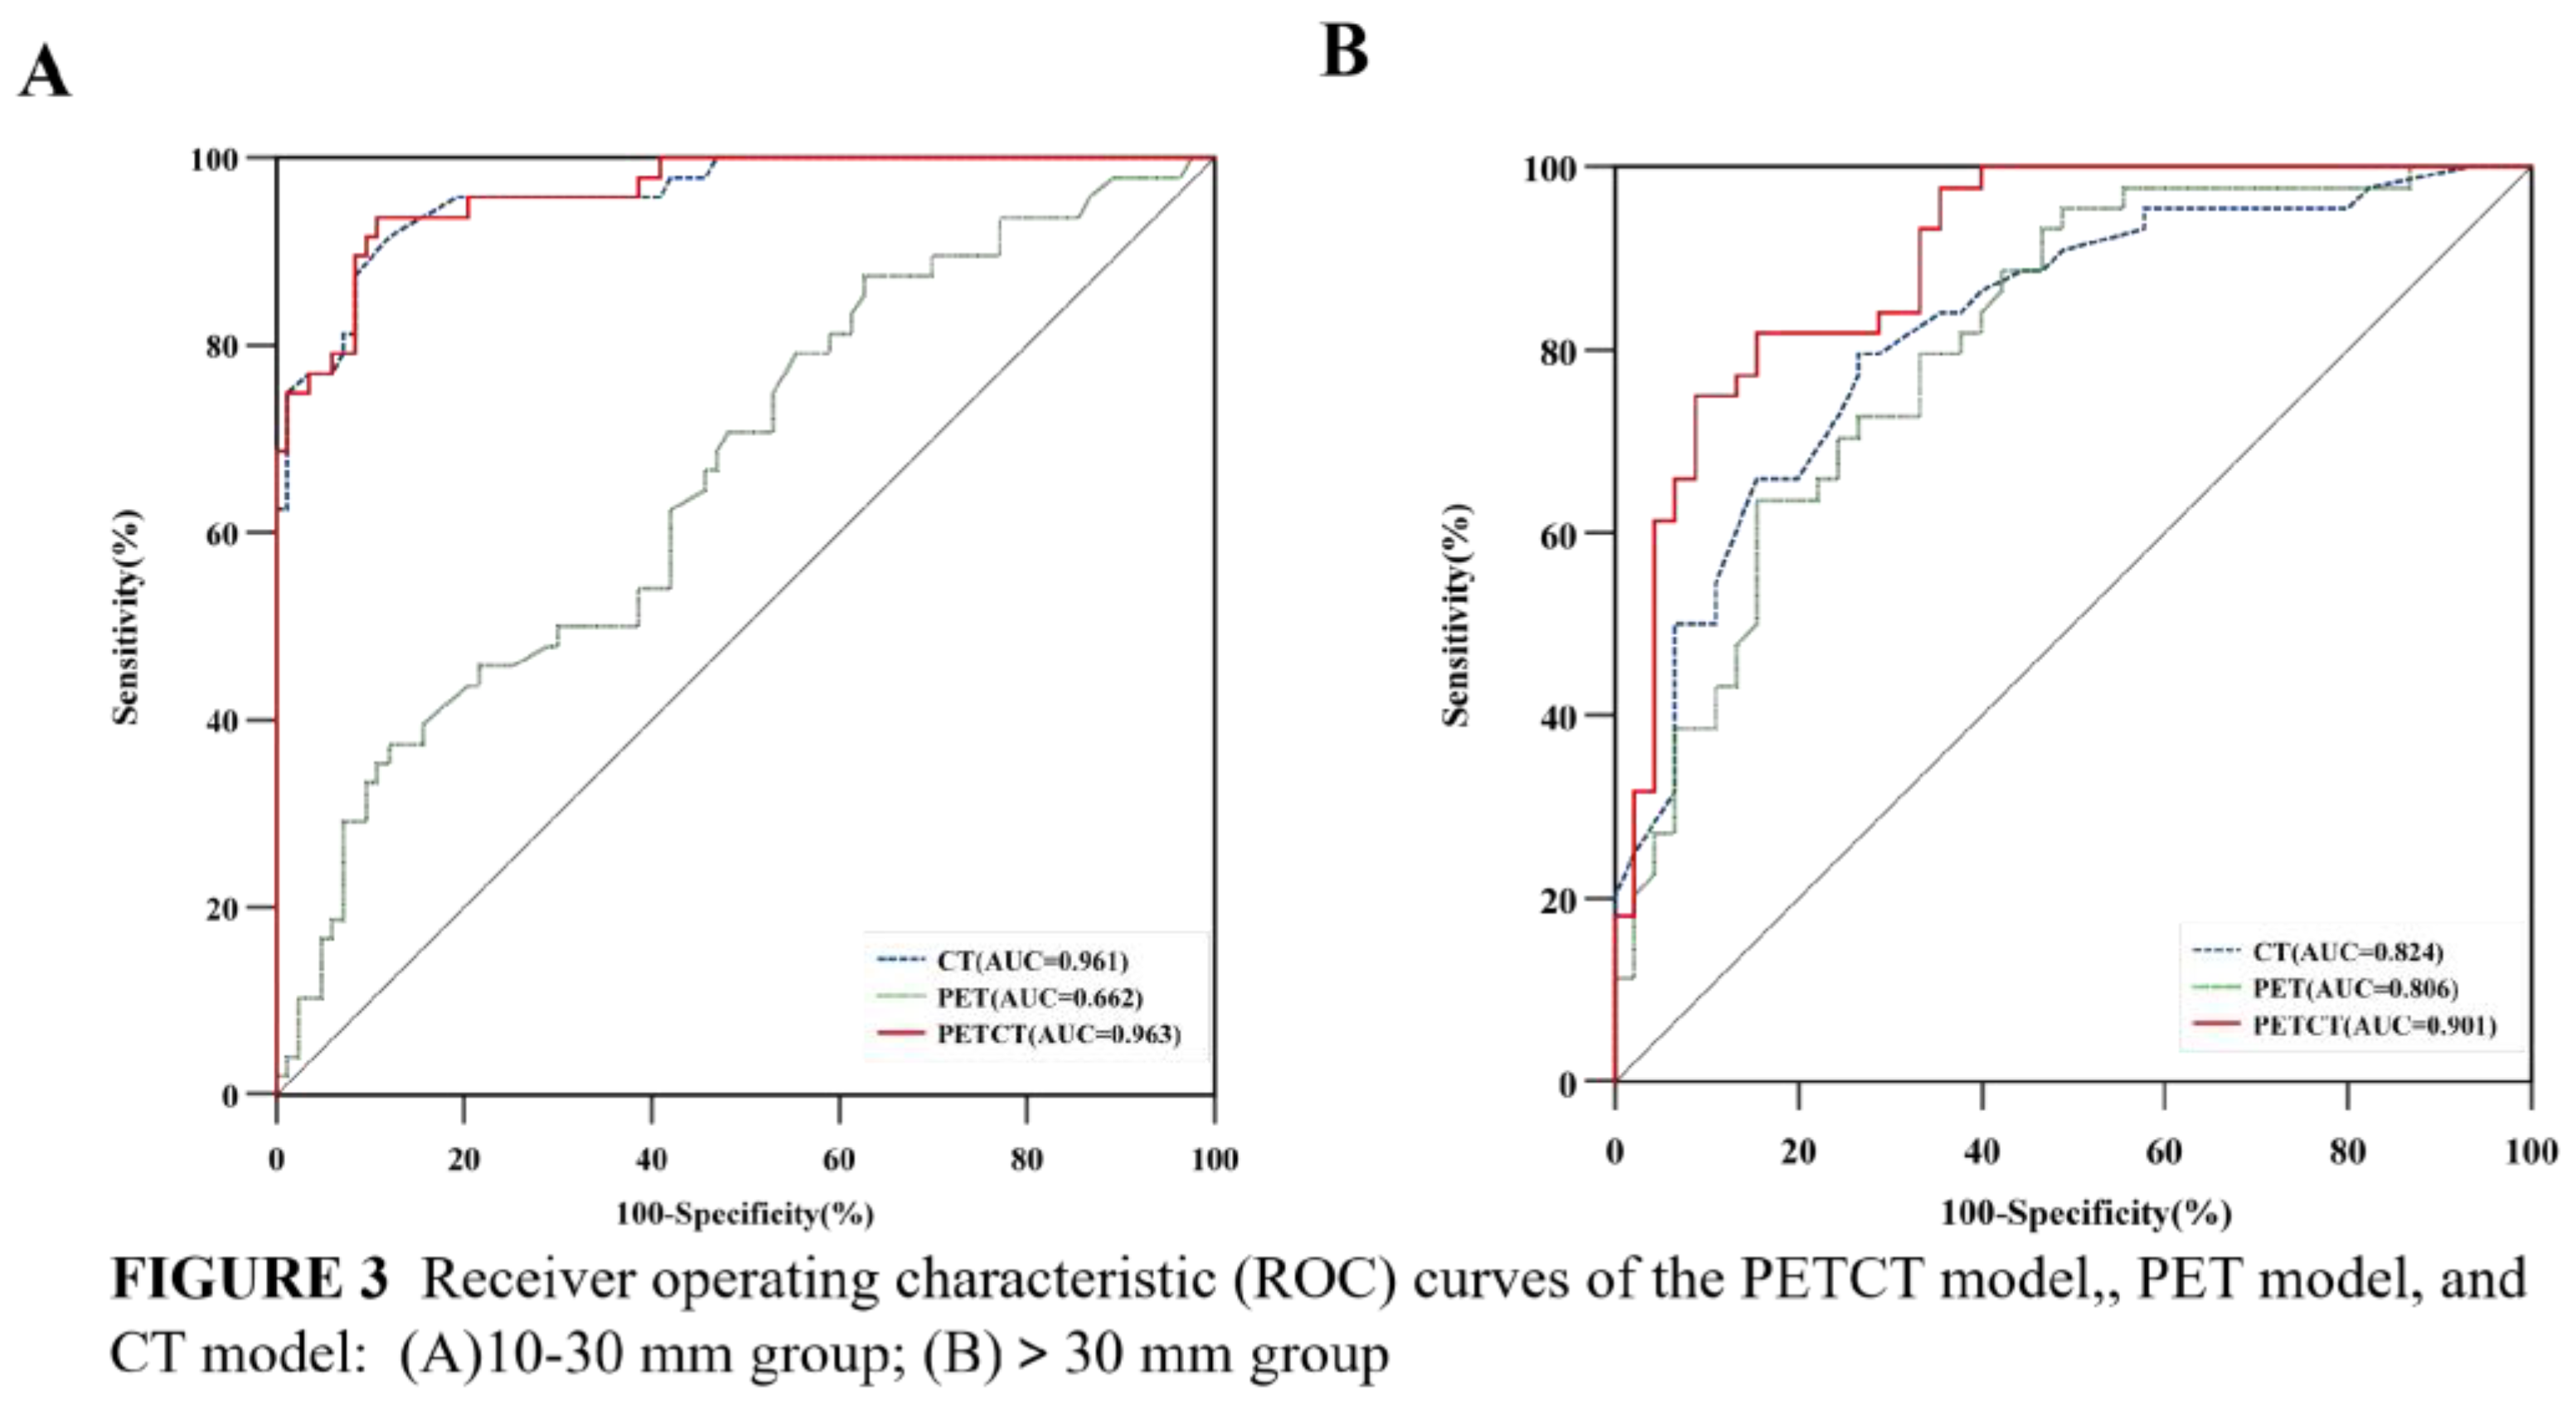
Figure 4.
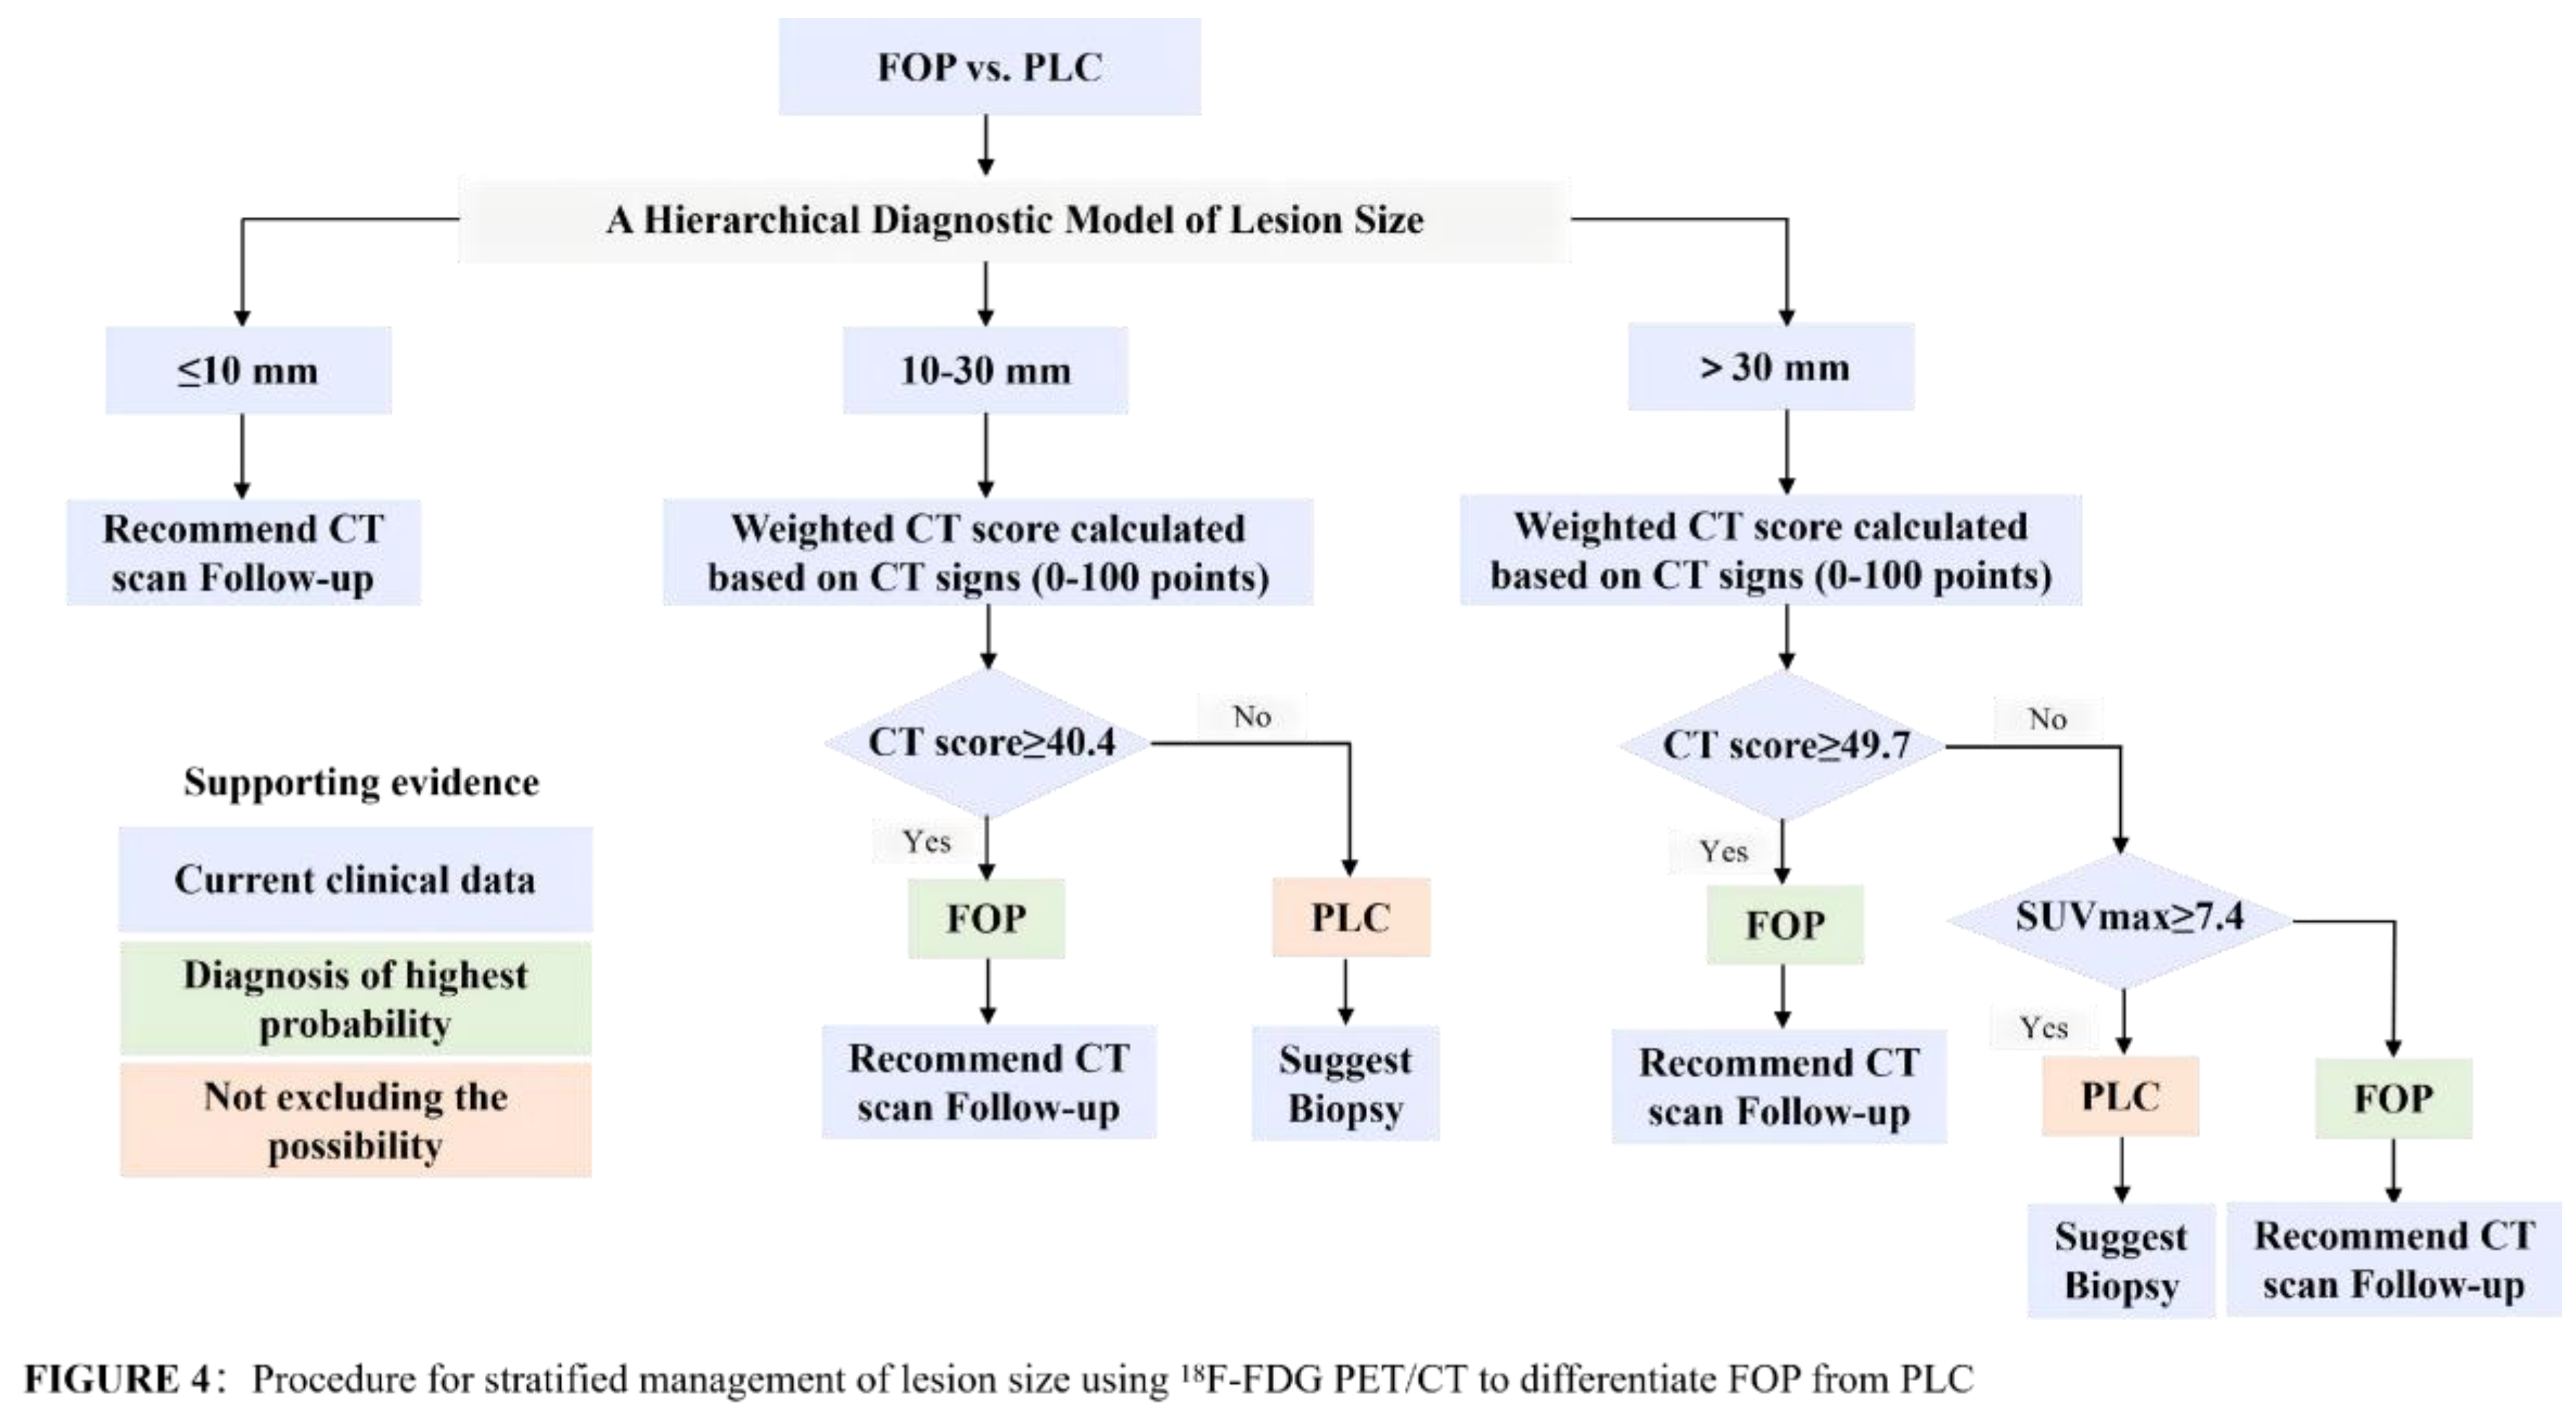

Table 1.
Patients Characteristic.
| Total(n=237) | ≤10 mm | 10-30 mm | >30 mm | |||||||||
|---|---|---|---|---|---|---|---|---|---|---|---|---|
| FOP (n=102) |
PLC (n=135) |
P-value | FOP (n=10) |
PLC (n=7) |
P-value | FOP (n=48) |
PLC (n=83) |
P-value | FOP (n=44) |
PLC (n=45) |
P-value | |
| Age (years) | 63.2±10.1 | 61.9±10.2 | 0.69 | 58.7±9.3 | 54.1±10.0 | 0.35 | 63.7±10.0 | 61.7±10.0 | 0.27 | 63.6±10.6 | 63.7±10.2 | 0.99 |
| Gender (%) | 0.002* | 0.16 | 0.006* | 0.95 | ||||||||
| Male | 73 (71.6) | 70 (51.9) | 8(80.0) | 3(42.9) | 31(64.6) | 32(38.6) | 34(77.3) | 35(77.8) | ||||
| Female | 29 (28.4) | 65 (48.1) | 2(20.0) | 4(57.1) | 17(35.4) | 51(61.4) | 10(22.7) | 10(22.2) | ||||
| Smoking history (%) | 0.007* | 1.00 | 0.55 | 0.008* | ||||||||
| Yes | 51 (50.0) | 44 (32.6) | 6(60.0) | 4(57.1) | 16(33.3) | 23(27.7) | 29(65.9) | 17(37.8) | ||||
| No | 51 (50.0) | 91 (67.4) | 4(40.0) | 3(42.9) | 32(66.7) | 60(72.3) | 15(34.1) | 28(62.2) | ||||
| Clinical symptoms (%) | 0.55 | 0.89 | 0.056 | 0.09 | ||||||||
| Asymptomatic | 60 (58.8) | 91 (67.4) | 6(60.0) | 7(100.0) | 32(66.7) | 56(67.5) | 22(50.0) | 28(62.2) | ||||
| Cough and sputum | 29 (28.4) | 41 (30.4) | 1(10.0) | 0(0.0) | 6(12.5) | 16(19.3) | 22(50.0) | 25(55.6) | ||||
| Sputum with blood | 3 (2.9) | 13 (9.6) | 0(0.0) | 0(0.0) | 2(4.2) | 4(4.8) | 1(2.3) | 9(20.0) | ||||
| Chest pain | 20 (19.6) | 19 (14.1) | 2(20.0) | 0(0.0) | 9(18.8) | 8(9.6) | 9(20.5) | 11(24.4) | ||||
| Breathing difficulties | 3 (2.9) | 1 (0.7) | 1(10.0) | 0(0.0) | 1(2.1) | 0(0.0) | 1(2.3) | 1(2.2) | ||||
| Fever | 4 (3.9) | 1 (0.7) | 0(0.0) | 0(0.0) | 2(4.2) | 1(1.2) | 2(4.6) | 0(0.0) | ||||
| Site of onset(%) | 0.59 | 0.37 | 0.15 | 0.66 | ||||||||
| Right upper lobe | 30 (29.4) | 44 (32.6) | 2(20.0) | 1(14.3) | 13(27.1) | 30(36.1) | 15(34.1) | 13(28.9) | ||||
| Right middle lobe | 13 (12.7) | 13 (9.6) | 2(20.0) | 0(0.0) | 8(16.7) | 9(10.8) | 3(6.8) | 4((8.9) | ||||
| Right lower lobe | 21 (20.6) | 25 (18.5) | 1(10.0) | 3(42.9) | 11(22.9) | 14(16.9) | 9(20.5) | 8(17.8) | ||||
| Left upper lobe | 15 (14.7) | 33 (24.5) | 1(10.0) | 3(42.9) | 10(20.8) | 20(24.1) | 4(9.1) | 10(22.2) | ||||
| Left lower lobe | 19 (18.6) | 17 (12.6) | 4(40.0) | 0(0.0) | 6(12.5) | 10(12.0) | 9(20.5) | 7(15.6) | ||||
| Cross lobe | 4 (4.0) | 3 (2.2) | 0(0.0) | 0(0.0) | 0(0.0) | 0(0.0) | 4(9.1) | 3(6.7) | ||||
*Indicated statistically significant.
Table 2.
Comparison of CT morphological features between the FOP and PLC groups (%).
| ≤10 mm | 10-30 mm | >30 mm | ||||||||||
|---|---|---|---|---|---|---|---|---|---|---|---|---|
| FOP (n=10) |
PLC (n=7) |
X2 value | P-value | FOP (n=48) |
PLC (n=83) |
X2 value | P-value | FOP (n=44) |
PLC (n=45) |
X2 value | P-value | |
| Density | 7.71 | 0.02* | 1.68 | 0.43 | 2.09 | 0.15 | ||||||
| Mixed ground glass | 0(0.0) | 4(57.1) | 6(12.5) | 17(20.5) | 2(4.5) | 0(0.0) | ||||||
| Pure ground glass | 1(10.0) | 0(0.0) | 1(2.1) | 3(3.6) | 0(0.0) | 0(0.0) | ||||||
| Solid | 9(90.0) | 3(42.9) | 41(85.4) | 63(75.9) | 42(95.5) | 45(100.0) | ||||||
| Lobulation sign | 1.93 | 0.38 | 13.10 | 0.001* | 6.65 | 0.04* | ||||||
| Shallow | 5(50.0) | 2(28.6) | 21(43.8) | 15(18.1) | 23(52.3) | 13(28.9) | ||||||
| Deep | 0(0.0) | 1(14.3) | 6(12.5) | 29(34.9) | 8(18.2) | 18(40.0) | ||||||
| No | 5(50.0) | 4(57.1) | 21(43.8) | 39(47.0) | 13(29.5) | 14(31.1) | ||||||
| Spiculation sign | 2.99 | 0.22 | 18.45 | <0.001* | 6.00 | 0.05 | ||||||
| Short | 1(10.0) | 2(28.6) | 6(12.5) | 34(41.0) | 6(13.6) | 15(33.3) | ||||||
| Long | 3(30.0) | 0(0.0) | 22(45.8) | 13(15.7) | 15(34.1) | 8(17.8) | ||||||
| No | 6(60.0) | 5(71.4) | 20(41.7) | 36(43.4) | 23(52.3) | 22(48.9) | ||||||
| Spiculate protuberance | 2.55 | 0.11 | 6.41 | 0.01* | 5.24 | 0.02* | ||||||
| Yes | 3(30.0) | 0(0.0) | 19(39.6) | 16(19.3) | 21(47.7) | 11(24.4) | ||||||
| No | 7(70.0) | 7(100.0) | 29(60.4) | 67(80.7) | 23(52.3) | 34(75.6) | ||||||
| Bow-shaped depression sign | 0.74 | 0.39 | 14.96 | <0.001* | 5.03 | 0.03* | ||||||
| Yes | 1(10.0) | 0(0.0) | 15(31.3) | 5(6.0) | 16(36.4) | 7(15.6) | ||||||
| No | 9(90.0) | 7(100.0) | 33(68.2) | 78(94.0) | 28(63.6) | 38(84.4) | ||||||
| Cavitation | - | - | 2.14 | 0.14 | 1.32 | 0.25 | ||||||
| Yes | 0(0.0) | 0(0.0) | 1(2.1) | 7(8.4) | 2(4.5) | 5(11.1) | ||||||
| No | 10(100.0) | 7(100.0) | 47(97.9) | 76(91.6) | 42(95.5) | 40(88.9) | ||||||
| Cavity wall | - | - | 2.68 | 0.26 | 1.32 | 0.25 | ||||||
| Thin | 0(0.0) | 0(0.0) | 0(0.0) | 4(4.8) | 0(0.0) | 0(0.0) | ||||||
| Thick | 0(0.0) | 0(0.0) | 1(2.1) | 3(3.6) | 2(4.5) | 5(11.1) | ||||||
| No | 10(100.0) | 7(100.0) | 47(97.9) | 76(91.6) | 42(95.5) | 40(88.9) | ||||||
| Location of cavity | - | - | 2.68 | 0.26 | 2.24 | 0.33 | ||||||
| Eccentricity | 0(0.0) | 0(0.0) | 0(0.0) | 4(4.8) | 2(4.5) | 3(6.7) | ||||||
| Centripetal | 0(0.0) | 0(0.0) | 1(2.1) | 3(3.6) | 0(0.0) | 2((4.4) | ||||||
| No | 10(100.0) | 7(100.0) | 47(97.9) | 76(91.6) | 42(95.5) | 40(88.9) | ||||||
| Location of cavities and bronchi | - | - | 2.52 | 0.28 | 5.19 | 0.08 | ||||||
| Truncation | 0(0.0) | 0(0.0) | 0(0.0) | 4(4.8) | 0(0.0) | 5(11.1) | ||||||
| Parallelism | 0(0.0) | 0(0.0) | 1(2.1) | 1(1.2) | 2(4.5) | 2(4.4) | ||||||
| No | 10(100.0) | 7(100.0) | 47(97.9) | 78(94.0) | 42(95.5) | 38(84.4) | ||||||
| Reversed halo sign | - | - | 7.04 | 0.008* | 2.08 | 0.15 | ||||||
| Yes | 0(0.0) | 0(0.0) | 7(14.6) | 2(2.4) | 7(15.9) | 2(4.4) | ||||||
| No | 10(100.0) | 7(100.0) | 41(85.4) | 81(97.6) | 37(84.1) | 43(95.6) | ||||||
| Bronchial truncation position | 3.66 | 0.16 | 11.53 | 0.003* | 7.76 | 0.02* | ||||||
| Interior of the lesion | 0(0.0) | 0(0.0) | 12(25.0) | 6(7.2) | 19(43.2) | 9(20.0) | ||||||
| Edge of the lesion | 1(10.0) | 0(0.0) | 3(6.3) | 18(21.7) | 7(15.9) | 17(37.8) | ||||||
| No | 6(60.0) | 7(100.0) | 33(68.7) | 59(71.1) | 18(40.9) | 19(42.2) | ||||||
| Pleural indentation | 0.57 | 0.45 | 0.20 | 0.66 | 2.28 | 0.13 | ||||||
| Yes | 3(30.0) | 1(14.3) | 21(43.8) | 33(39.8) | 11(25.0) | 18(40.0) | ||||||
| No | 7(70.0) | 6(85.7) | 27(56.3) | 50(60.2) | 33(75.0) | 27(60.0) | ||||||
| Relationship to neighboring vessels | 3.73 | 0.16 | 10.76 | 0.005* | 6.57 | 0.04* | ||||||
| Penetration | 0(0.0) | 2(28.6) | 6(12.5) | 18(21.7) | 4(2.3) | 12(26.7) | ||||||
| Adjacency | 1(10.0) | 0(0.0) | 10(20.8) | 3(3.6) | 13(29.5) | 6(13.3) | ||||||
| No | 9(90.0) | 5(71.4) | 32(66.7) | 62(74.7) | 27(61.4) | 27(60.0) | ||||||
*:Indicated statistically significant; -: Indicates undetected or undetectable data.
Table 3.
Multivariable logistic regression analyses based on CT morphological features.
| 10-30 mm | >30 mm | |||||
|---|---|---|---|---|---|---|
| β | OR (95%CI) | P-value | β | OR (95%CI) | P-value | |
| Lobulation sign | - | - | 0.006* | - | 0.006* | |
| Shallow | 1.332 | 3.789(1.136-12.636) | 0.03* | 1.451 | 4.266(1.191-15.283) | 0.03* |
| Deep | -0.953 | 0.386(0.094-1.588) | 0.19 | -0.747 | 0.474(0.124-1.813) | 0.28 |
| Spiculation sign | - | 0.002* | - | - | ||
| Short | -1.672 | 0.188(0.044-0.802) | 0.03* | - | - | |
| Long | 0.165 | 1.180(0.308-4.522) | 0.81 | - | - | |
| Spiculate protuberance | 1.615 | 5.0253(1.194-21.153) | 0.03* | 1.101 | 2.745(0.976-7.717) | 0.06 |
| Bow-shaped depression sign | 1.783 | 5.950(1.098-32.227) | 0.04* | 1.594 | 4.922(1.44-16.794) | 0.01* |
| Reversed halo sign | 2.129 | 8.407(1.328-53.235) | 0.03* | - | - | |
| Bronchial truncation position | - | 0.003* | - | 0.03* | ||
| Interior of the lesion | 2.006 | 7.434(1.602-34.510) | 0.003* | 1.283 | 3.606(1.049-12.400) | 0.04* |
| Edge of the lesion | -2.188 | 0.112(0.016-0.785) | 0.03* | -0.546 | 0.579(0.155-2.170) | 0.05 |
| Relationship to neighboring vessels | - | 0.009* | - | 0.02* | ||
| Adjacency | -1.681 | 0.186(0.039-0.802) | 0.04* | -1.400 | 0.247(0.058-1.041) | 0.06 |
| Penetration | 1.956 | 7.068(1.113-44.875) | 0.04* | 1.250 | 3.490(0.872-13.964) | 0.08 |
| Constant | -1.188 | 0.305 | 0.03* | -1.084 | 0.338 | 0.09 |
OR odds ratio, CI confidence interval; *: Indicated statistically significant data; -: Indicates undetected or undetectable data.
Disclaimer/Publisher’s Note: The statements, opinions and data contained in all publications are solely those of the individual author(s) and contributor(s) and not of MDPI and/or the editor(s). MDPI and/or the editor(s) disclaim responsibility for any injury to people or property resulting from any ideas, methods, instructions or products referred to in the content. |
© 2026 by the authors. Licensee MDPI, Basel, Switzerland. This article is an open access article distributed under the terms and conditions of the Creative Commons Attribution (CC BY) license (http://creativecommons.org/licenses/by/4.0/).
Copyright: This open access article is published under a Creative Commons CC BY 4.0 license, which permit the free download, distribution, and reuse, provided that the author and preprint are cited in any reuse.


