

Submitted:
04 August 2026
Posted:
06 August 2026
You are already at the latest version
Preprints on COVID-19 and SARS-CoV-2
Abstract
Entry of SARS-CoV-2 via mucosal surfaces of the upper respiratory tract including the oral cavity may be influenced by innate and adaptive immunity. We aim to determine whether antibodies in secretions might influence the SARS-CoV-2 burden and thus the severity of infection. Blood and stimulated oral fluid (SOF) samples were collected at recruitment (d0) from 173 patients, and sequentially at d14, d30 and d90 from 52 SARS-CoV-2 RT-PCR-confirmed patients. Anti-SARS-CoV-2 spike antibodies of IgG, IgA and SIgA isotypes were detected by ELISA. SARS-CoV-2 RNA copies were quantified by RT-PCR. SARS-CoV-2 RNA copies become negative by d14 in most subjects. At d14, 5/18 SOF samples continued to be RT-PCR positive. Serum/SOF IgG antibodies were detected in all patients; IgG/IgA/SIgA antibodies increased by d14 and decreased by d90. At d0 and d14, SOF RNA copies were negatively correlated with SOF/serum IgG and with SOF IgA/SIgA antibodies. Higher SOF antibodies were significantly associated with a more rapid decline in SARS-CoV-2 burden. SARS-CoV-2 RNA copies and spike-specific antibodies show differential trends during the major and minor COVID-19 waves in India. Avidity indices for SOF IgG/IgA antibodies declined by d90. Taken together our data suggests a potential functional role for SOF anti-SARS-CoV-2 spike antibodies in reducing the SARS-CoV-2 burden.
Keywords:
SARS-CoV2
; Oral fluid
; mucosal antibodies
; IgA
; IgG
; SIgA
; avidity
1. Introduction
SARS-CoV-2 is a corona virus, which primarily infects the aerodigestive mucosal epithelial cells. The mucosal secretions of the oral cavity and the upper respiratory tract contain many anti-viral factors (innate and adaptive) that contribute to the immediate defense against invading pathogens [1,2]. IgA and secretory IgA (SIgA) antibodies play a major role in a variety of mucosal viral infections [3,4]. The presence of these anti-viral antibodies helps in confining the virus to the upper respiratory tract and mediate the subsequent clearance of the virus [5,6]. Studies have shown the presence of antigen-specific cells in germinal centres [7], lymphoid follicles [8] and dendritic cells in the oral and/or nasal mucosa that were responsible for eliciting these IgA antibodies against SARS-CoV-2 [9,10,11].
Past exposures to SARS-CoV-2 natural infection or vaccination generally elicit a robust serum antibody response. Several studies by us and others have shown a robust humoral response to SARS-CoV-2 spike proteins in the peripheral circulation [12,13,14]. Other studies have shown that the T cells of individuals exposed to SARS-CoV-2 have recall memory as shown by in vitro antigen stimulation experiments [15,16,17]. Both serum and mucosal anti-SARS-CoV-2 antibodies are capable of neutralizing the virus [14,18,19,20,21,22]. We and others have shown that people who encounter breakthrough infections after COVID-19 vaccinations or subsequent re-infections, generally experience lesser disease severity [12,23,24]
Several studies have suggested that mucosal antibodies could play a role in earlier clearance of the virus [20,23,24,25,26]. However, although these studies have detected mucosal antibodies in relation to SARS-CoV2 infection, very few have determined the presence of secretory IgA (SIgA) antibodies in the SOF. We had previously shown in healthcare workers (HCWs) and people living with HIV (PLWH) that local IgA / SIgA antibodies were elicited in the oral mucosal cavity upon breakthrough infections [12.27]. In the current study we analysed a larger cohort with COVID-19 in order to understand the role of anti-SARS-CoV-2 spike antibodies, particularly IgA / SIgA antibodies in the oral mucosa with regard to disease severity, temporal trends and SARS-CoV-2 variants. We also aimed to study the avidity of any IgA antibodies in the SOF in order to provide clearer insights of the potential role of the locally produced SIgA antibodies.
2. Materials and Methods
2.1. Patients and Samples
The samples were collected prospectively in VHS-Institutional Ethics Committee approved studies (Proposal# VHS-IEC/60-2020, VHS-IEC/72-2021 and VHS-IEC/75-2021) after obtaining written informed consent. A total of 173 participants were recruited at The Voluntary Health Services and Tamil Nadu Government Multi Super Speciality Hospital, Chennai, India between July 2020 and May 2023 – 14 non-infected vaccinated controls (NIVC), 127 patients with either asymptomatic or mild COVID-19 and 32 patients with moderate or severe COVID-19. COVID-19 diagnosis was made by a positive SARS-CoV-2 RT-PCR in nasopharyngeal swabs (NPS). Disease severity in COVID-19 patients was determined using the NIH COVID-19 severity scores [28]. Peripheral blood samples and stimulated oral fluid (SOF) samples were collected as described previously [29]. From NIVC participants, samples were collected at two time points four weeks apart (d0 and d30). From COVID-19 patients, samples were collected at recruitment (d0), which was within 2-4 days of disease onset. Longitudinal samples were collected from a subset of mild COVID-19 patients after 14 days (d14), 30 days (d30) and 90 days (d90) of disease onset.
2.2. Anti-SARS-CoV-2 Spike Antibody Assays
Serum from the peripheral blood samples and the supernatants from the SOF samples were processed and stored at -80°C as described previously [12] for antibody assays. Anti-SARS-CoV-2 spike IgG antibodies (referred henceforth as IgG antibodies) were measured using a commercial ELISA kit as per the manufacturer’s instructions (Invitrogen, USA). Anti-SARS-CoV-2 spike IgA antibodies (referred henceforth as IgA antibodies) and anti-SARS-CoV-2 spike secretory IgA antibodies (referred henceforth as SIgA antibodies) were measured using in-house ELISAs and pooled sera standards for IgA antibodies and pooled SOF standards for SIgA antibodies [12].
2.3. Quantitative SARS-CoV-2 RNA Estimation
2.4. Statistical Analysis
The secretion rates (SR) were calculated by dividing the volume of the SOF samples by the corresponding collection time for each participant. The antibody levels in the SOF samples were analysed as absolute values (U/ml) and normalized over their corresponding SR (U/ml/min). The mean and median values were calculated using Microsoft Excel. Mann-Whitney rank sum tests for comparing medians, Spearman Rank correlation coefficients and their corresponding statistical significance between the measurements at various time points; and t-test for mean value comparisons were calculated using GraphPad Prism version 8.0 and the free online calculator from Social Science Statistics.
3. Results
3.1. SARS-CoV-2 Burden in Stimulated Oral Fluid (SOF) from COVID-19 Patients
The median RNA copies in COVID-19 patients with asymptomatic or mild disease (median: 11.4 cp/ml in log) was significantly higher than the patients with moderate or severe disease (median: 8.3 cp/ml in log; p=0.005; Mann-Whitney rank sum test; Figure 1A). Longitudinal SOF samples were available from a subset of the COVID-19 patients during the Omicron and Minor variant waves. RNA copies in SOF declined from a median log of 13 cp/ml at onset (d0) to almost negative by d14 in majority of the patients. Only 5/18 (28%) and 1/18 (6%) remained positive for RNA at d14 and d30 after disease onset (Figure 1B).
Based on the time period of sample collection all samples were stratified into the different COVID-19 waves as designated by the variant SARS-CoV-2 strains that were predominant at the time of sample collection. Of the 123 COVID-19 patients with mild disease, SARS-CoV-2 RNA copy numbers in SOF samples were significantly lower when infected with the Alpha strain during the first wave (median: 1.8 cp/ml in log; Figure 1C). The highest median RNA copies were seen with the Omicron strain (Median: 13.2 cp/ml in log) during the third wave. The SARS-CoV-2 RNA copy numbers were compared between the NPS and SOF collected concomitantly from 62 patients. There was a strong positive correlation between the two sample types (p<0.0001; Spearman rank correlation co-efficient test; Figure 1D). These findings suggest that the SARS-CoV-2 RNA burden in the SOF was low in patients with moderate / severe disease, while the burden was higher in those infected with the Delta or Omicron variants that were more infective in nature.
3.2. Differential Expression of Salivary Anti-SARS-CoV-2 Spike Antibodies
In the SOF samples, the IgG antibodies were markedly lower in NIVC (median: 205 U/ml) than in COVID-19 patients (p=0.05; Figure 2A). The IgG antibodies were lower in patients with asymptomatic or mild COVID-19 (Median: 529 U/ml) compared to the patients with moderate or severe COVID-19 (Median: 673 U/ml). The trends of IgA antibodies and SIgA antibodies in the SOF samples were similar to that of the IgG antibodies (Figure 2B and 2C, respectively). These antibody levels were also analysed after normalizing them over the salivary secretion rates (SR) correspondingly (Figure 2D-F). These normalized antibody levels also showed the same trends among the NIVC and COVID-19 cohorts as the antibody levels without normalization (comparing Figure panels 2A, 2B and 2C with 2D, 2E and 2F respectively). This suggests that a robust anti-SARS-CoV-2 spike antibody response was elicited in the oral mucosa upon acquiring COVID-19.
The IgG (Figure 2G) and IgA (Figure 2H) antibodies in the concomitant serum samples of a subset showed a slightly different trend from the SOF samples. Patients with moderate / severe disease elicited lower IgG antibodies (Median: 168200 U/ml) and higher IgA antibodies (Median: 4464233 U/ml) compared with the patients with asymptomatic or mild disease (IgG antibodies Median: 1560800 U/ml; IgA antibodies median: 202700 U/ml). Thus, there is a differential expression of IgG and IgA antibodies in the SOF and serum samples among COVID-19 patients with different disease severity.
3.3. Inverse Correlation Between SARS-CoV-2 RNA Copies and Anti-SARS-CoV-2 Spike Antibodies
SARS-CoV-2 RNA copies in the SOF samples showed an inverse correlation against the IgG antibodies (r = -0.213; Figure 3A), IgA antibodies (r = -0.201; Figure 3C) and SIgA antibodies (r = -0.237; Figure 3E) in the SOF samples as well as the serum samples (IgG: r = -0.364, Figure 3B; IgA: r = -0.205, Figure 3D). All these Spearman rank correlations reached statistical significance except serum IgA antibodies. This inverse correlation suggests that these spike-specific antibodies might play a role in the clearance of the virus.
3.4. Avidity Indices of IgG and IgA Antibodies
We analysed the technical reproducibility of the avidity assays by performing the experiments at two independent times. The mean CV% of IgG antibody avidity index was 3.3% in serum (n=80) and 3.1% in SOF (n=12). The mean CV% of IgA antibody avidity index was 4.3% in serum (n=15). This suggests that the optimized avidity assays for the IgG and IgA antibodies in both serum and SOF samples were reproducible and reliable.
The avidity indices of IgG antibodies in the SOF (Figure 4A) and serum (Figure 4C) samples followed a similar trend between the NIVC and COVID-19 cohorts although the avidity indices were higher in the serum compared with the SOF. The median IgG antibody avidity was lower in the SOF of those who developed moderate / severe disease compared to those with a milder disease. The SOF IgA antibody avidity indices in those who developed COVID-19 were lower than the NIVC (Figure 4B), while they showed the opposite trend in the serum (Figure 4D). In moderate / severe COVID-19, although the antibody levels were high, their avidity was low suggesting poorer neutralization capacity and in turn poorer viral clearance.
3.5. Longitudinal Trends of Anti-SARS-CoV-2 Spike Antibodies and Avidity Indices
In mild COVID-19 patients there was a significant increase in IgG (Figure 5A) and SIgA (Figure 5C) antibody levels in SOF at d14 after the disease onset. Although IgA antibodies (Figure 5B) in the SOF also showed a similar trend it was not statistically significant. Similar rises in serum IgG (Figure 5D) and IgA (Figure 5E) antibodies showed statistical significance. By d30 and d90 after the disease onset the IgG, IgA and SIgA antibodies declined in both SOF and serum samples. However, at d90, the levels of SOF IgG antibodies, serum IgG antibodies and serum IgA antibodies were still significantly higher than at disease onset. While SOF IgA/SR antibodies declined to the same level as d0, and SOF SIgA/SR declined below the levels of d0. This suggests a robust mucosal antibody response within d14 of the disease onset and that the SOF IgA and SIgA antibodies are relatively short-lived.
The median avidity indices of IgG (Figure 5F) antibodies in the SOF showed an increase from disease onset but no obvious change with SOF IgA (Figure 5G) The median IgG antibody avidity index at d30 (105%) in SOF was statistically higher than d0 (69%; p = 0.007). By d90 the SOF IgG antibody avidity index began to decline, while in the serum the IgG antibody avidity indices (Figure 5H) remained high. Serum IgA antibody avidity indices declined by d30, and were statistically lower from all the subsequent time points (Fig 5I). Thus, the serum IgA antibodies were less avid and declined more rapidly than serum IgG antibodies.
3.6. IgG, IgA and SIgA Antibody Responses Elicited by the Different SARS-CoV-2 Strains
We next analysed the IgG, IgA and SIgA antibody levels and their avidity indices in the SOF samples by stratifying them according to the prevalent SARS-CoV-2 variants (Figure 6). The SOF IgA and SIgA antibodies elicited by the Alpha strain were significantly lower than those elicited by the Delta strain (IgA antibodies: p=0.007; SIgA antibodies: p=0.003), but higher than the Omicron strain (IgA antibodies: p<0.0001; SIgA antibodies: p<0.0001). On the other hand, the Alpha strain elicited the highest levels of SOF IgG antibodies (Figure 6A).
The IgG antibody avidity indices showed an increasing trend with every subsequent COVID-19 wave (Figure 6D) as expected. However, the SOF IgA avidity index (Figure 6E) was significantly lower against the SARS-CoV-2 Delta strain compared to the Omicron strain (p=0.01) and the minor waves (p<0.0001). Thus, the IgG antibodies were more avid even though they were lower in concentrations, while the trends of the IgA antibodies and their avidity indices were variable.
3.7. Prior SARS-CoV-2 Exposure Facilitates Earlier Clearance of the Virus
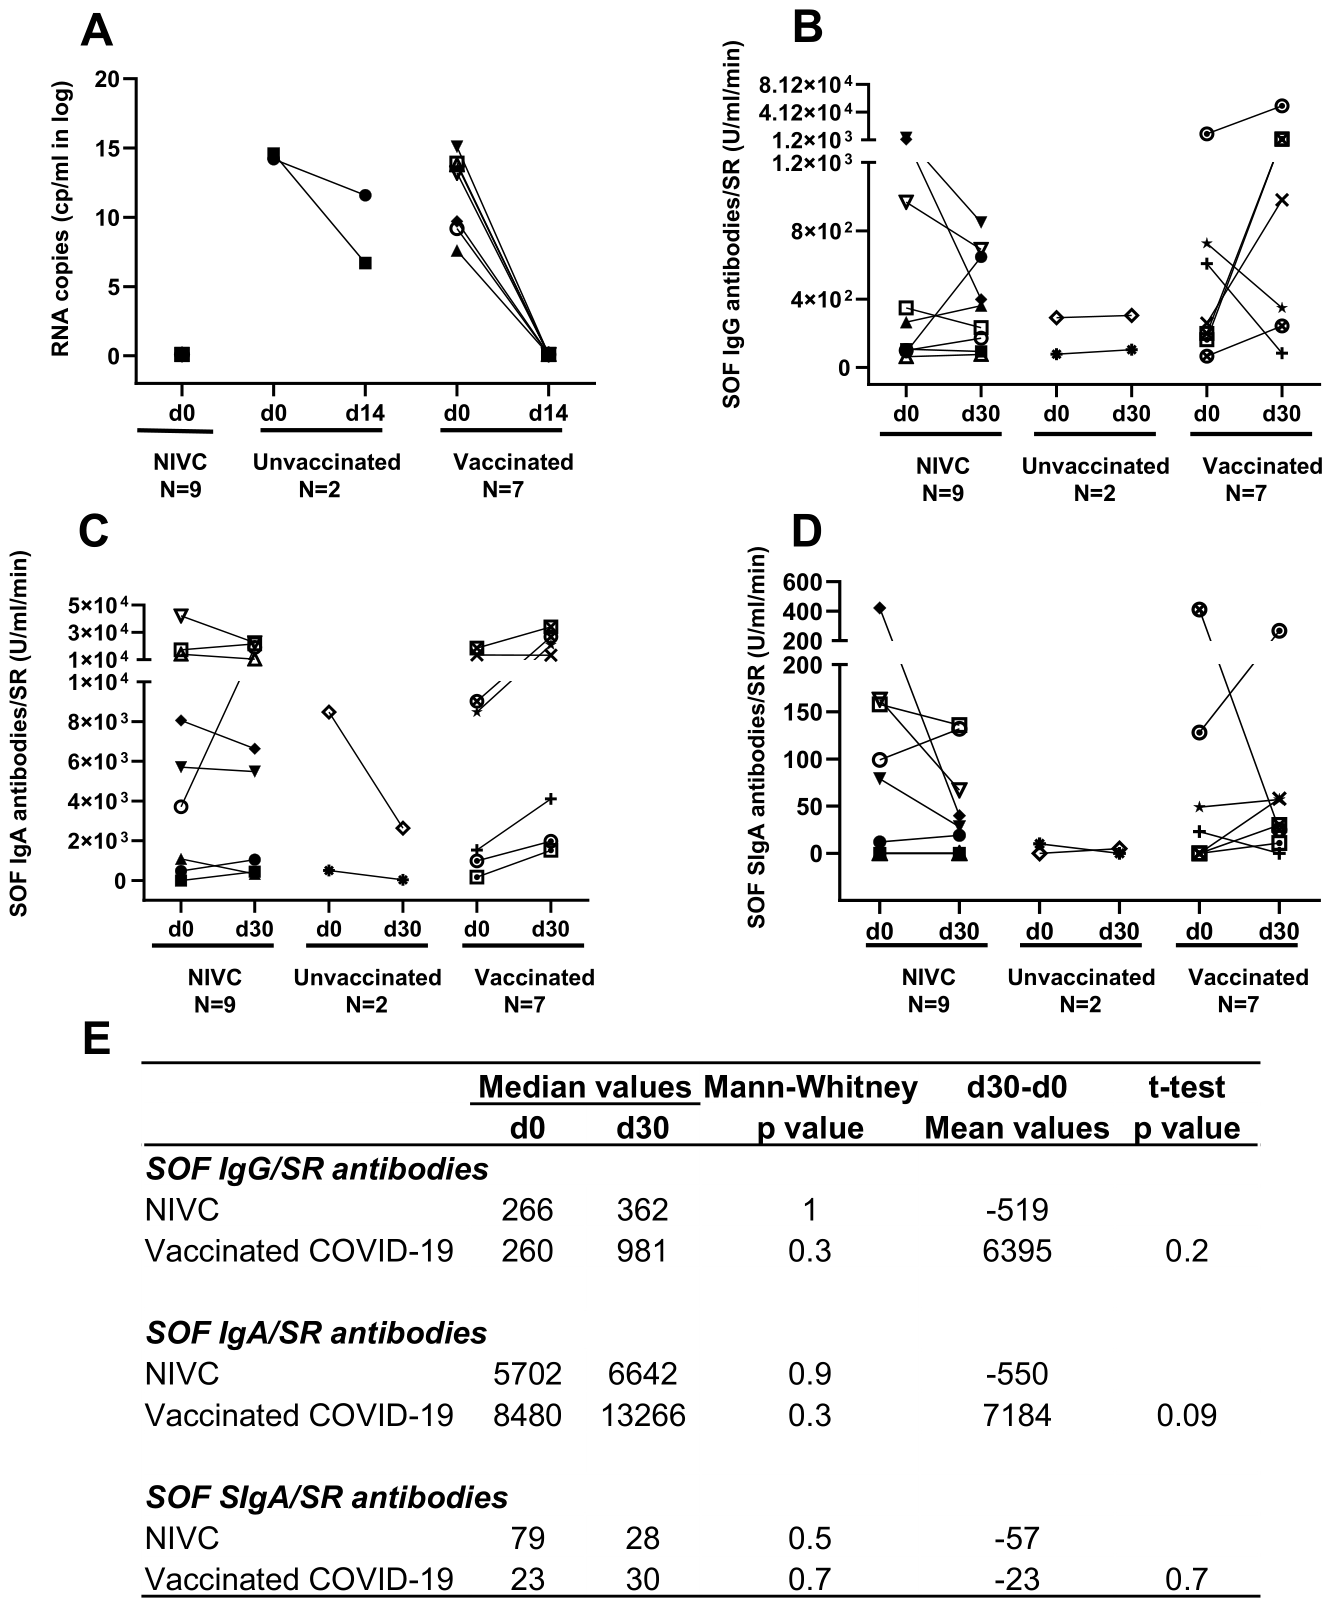
Of the 52 mild COVID-19 patients from whom longitudinal SOF samples were available, two were unvaccinated and recruited during the Omicron wave. Seven mild COVID-19 patients who developed breakthrough infections and were part of a previous COVID-19 vaccine trial were recruited in this study during the same Omicron wave. Nine NIVC participants recruited during the Omicron wave were also included for this analysis. The SARS-CoV-2 RNA burden became negative by d14 in the vaccinated group, but was still positive in the unvaccinated group (Figure 7A). The SOF IgG/SR (Figure 7B), IgA/SR (Figure 7C) and SIgA/SR (Figure 7D) antibodies showed a declining trend in the NIVC group, a declining or no antibody elicitation trend in the unvaccinated group, but an increasing trend in the vaccinated group. The table inset in figure panel 7E indicates the median values and the mean difference values between d30 and d0 in the NIVC and the vaccinated groups for the IgG/SR, IgA/SR and SIgA/SR antibodies in the SOF. Although the trends show marked differences between the three groups, there was no statistical significances, probably due to the low sample members.
Taken together, the findings of this study suggest that the immediate elicitation of IgG, IgA and SIgA antibodies in the SOF due to prior exposure from vaccination or previous infection facilitated the earlier clearance of the SARS-CoV-2.
4. Discussion
Virus induced inflammatory response can sometimes cause higher morbidity than the virus infection itself due to the cytolytic nature of the elicited host immune response. In this study, we showed that anti-SARS-CoV-2 spike IgG, IgA and SIgA antibodies were detectable soon after the onset of COVID-19 in the oral cavity, which is a portal of entry for SARS-CoV-2. We also showed inverse trends and correlations between the SARS-CoV-2-specific mucosal IgA / SIgA antibodies and the SARS-CoV-2 RNA burden thereby suggesting a role in earlier clearance of SARS-CoV-2 from the mucosae. This in turn might help in reducing the local inflammatory response, which would reduce tissue injury mediated morbidity / disease severity.
SOF is a non-invasive and easy to collect specimen that represents the mucosae of the aerodigestive tract, and hence SOF is an ideal specimen to study the infectious agents and host factors that are involved in respiratory and gastrointestinal infectious and non-infectious inflammatory conditions [3,4]. However, there are a number of challenges and limitations faced in analyzing the mucosal antibodies in the SOF with accuracy due to variations in the collection and the type of SOF sample; detection of the secretory component of the IgA antibody; and normalization for physiological differences like protein content, salivary SR and total isotype-specific antibody production [32]. In our study, SOF was collected by stimulation of chewing with an inert paraffin wax. This method of collection includes the oral secretions from all the salivary glands (major and minor), and also the gingival crevicular fluid. The SIgA antibody measurements were performed using ELISA and anti-human secretory IgA monoclonal antibody. Additionally, we have compared our SOF antibody data with both actual values as well as antibody values normalized over their corresponding salivary SR. Taking altogether, we can conclude that our data is more accurate and highly representative of the mucosal antibodies that were locally produced and hence provides direct clinical relevance.
SARS-CoV-2 RNA burden was higher in asymptomatic or mild COVID-19 compared with moderate or severe disease. This differential viral burden has been shown by us previously [31]. Saliva is an easy-to-collect and non-invasive sample that has been validated to be a diagnostic sample for the detection of respiratory viruses [33,34,35]. The higher SARS-CoV-2 burden at disease onset in the asymptomatic or mild COVID-19 suggests the higher infectivity and transmissibility of the virus [31,36]. Additionally, the lower SARS-CoV-2 burden in the SOF of moderate or severe COVID-19 could suggest that the disease burden has moved to the lungs leading to a more morbid host immune response along with tissue injury sequel [6,37].
In moderate or severe COVID-19, the IgG, IgA and SIgA antibodies in the SOF were higher than mild disease. This suggests a higher elicitation of the humoral immune response. In the peripheral circulation, the IgG antibodies were lower in moderate or severe disease. This suggests an increase in the passive movement of IgG antibodies into the mucosal compartment from the peripheral circulation. The higher total IgA antibodies and the dimeric secretory IgA antibodies in the SOF suggests a robust local elicitation of the humoral immune response. The IgG antibodies in the SOF are orders of magnitude lower than the levels in the serum. On the other hand, the IgA antibodies in the SOF are only one order of magnitude lower than the serum antibodies. This is suggestive of local production in addition to passive movement. Sterlin et al have shown that IgA plasmablasts increase in the circulation during COVID-19 and stay longer compared to IgG plasmablasts [38].
Anti-SARS-CoV-2 spike-specific antibodies and the SARS-CoV-2 RNA burden show opposite trends and a statistically significant inverse correlation. Longitudinal analyses showed that the SARS-CoV-2 RNA burden became negative by d14 in most of the mild COVID-19 patients. During these 14 days from disease onset the IgG, IgA as well as the SIgA antibodies were produced in significantly high levels in both SOF and serum samples. These opposite trends of the SARS-CoV-2 burden and the anti-SARS-CoV-2 spike antibodies along with the inverse correlations between them strongly suggest that the early elicitation of the mucosal antibody response against SARS-CoV-2 facilitates the clearance of the virus. We have not demonstrated neutralizing activity of antibodies in SOF in this study. Neutralising activity of antibodies in saliva has been shown [23,39,40] but isotype specificity was not demonstrated. In the latter study [40], vaccine-elicited saliva antibodies were able to block the binding of hACE-2 to the spike RBD of the reference strain. In a murine model, induced SIgA antibodies were shown to have neutralizing activity [41]. A direct link between mucosal IgA and protection against influenza virus infection in humans has been demonstrated [42]. These findings would support a view that both IgG and SIgA antibodies in mucosal secretions contribute to clearance of viruses. This is reiterated by many other studies that have shown the neutralization capacity of these antibodies [19,20,21,22,38,43], and inverse correlations with SARS-CoV-2 RNA load and disease severity [6,9,10,37,44].
Avidity of the antibodies indicates the strength of the binding of the antibodies to the corresponding antigens, which in turn reflects on their neutralization capacity. In our study, the avidity of both the IgG and IgA antibodies were lower in the SOF compared to the serum and were lower in patients with moderate or severe COVID-19 compared to those with mild COVID-19. This could also attribute to delayed clearance of the virus, which in turn could lead to higher morbidity and hence higher disease severity. Avidity increases during convalescence and also upon repeated exposures to the same antigen [45]. Among the mild COVID-19 patients, longitudinal analysis of the IgG antibody avidity indices showed an increase with time both in the SOF and serum samples. The IgG antibodies seen in the oral cavity are derived primarily from the peripheral circulation. On the other hand, the avidity indices of the IgA antibodies declined by d30 and d90. This is probably due to the shorter half-life of IgA antibodies [38]. This decline was more rapid in the serum in contrast to a slower decline in the SOF. The evident slower decline in the IgA antibody avidity indices could be attributed to the persisting higher SOF IgA levels at d90. IgG antibody avidity continues to remain high even though the IgG antibody levels declined. This suggests a potential selection of plasma cells that secrete more avid antibodies upon convalescence in order to retain immunological memory for future exposures.
In India there were three major waves and a few minor waves of COVID-19 from March 2020 through late 2023. We collected SOF samples during various periods of these COVID-19 waves as part of three different studies. So, the SARS-CoV-2 burden and the anti-SARS-CoV-2 antibodies analysed in these SOF samples were stratified based on the SARS-CoV-2 strain type that was predominant during the corresponding sample collection periods. SARS-CoV-2 RNA burden was highest during the Omicron wave and lowest during the first Alpha wave. This indicates the infective and transmissibility capacity of these strain types. During the early pandemic, SARS-CoV-2 involvement was more in the lungs and required testing of nasopharyngeal swabs. By the time Omicron variant became prevalent, the disease was more confined to the upper respiratory tract. In vitro studies have shown that the antibodies had a lower neutralization capacity against Omicron variant [5,6,37,46,47,48,49]. The earlier studies were able to detect SARS-CoV-2 in the saliva only in about 80% of the nasopharyngeal swab confirmed cases [30,31]. During the subsequent waves, SARS-CoV-2 was detected in 100% of the saliva samples making self-testing with saliva or nasal swabs at home more convenient and reliable.
The Delta strain elicited the highest levels and the Omicron strain elicited the lowest levels of IgA / SIgA antibodies. Studies have shown that the antibodies elicited against the Omicron strain were minimally detectable by assays using the ancestral strain spike RBD due to antigenic drift in the spike protein of the Omicron variant however, the antibodies were cross-protective [52,53,54]. The mild nature of the disease among the previously vaccinated patients recruited during the Omicron wave, their quick clearance of the virus within 14 days, and their increasing antibody avidity evident in our study are all suggestive of a strong mucosal immune response that could be potentially contributing to immunological imprinting [12,25,53].
COVID-19 vaccination programmes were quite effective in reducing the disease severity. We had previously shown the robust elicitation of IgG, IgA and SIgA antibodies in serum and in SOF samples from HCWs and PLWH post COVID-19 vaccination [12,27]. In the current study we further showed that the number of moderate or severe disease (3/72; 4.2%) post COVID-19 vaccination was significantly lower than during the first wave (29/45; 64%). During the third wave there was a small group of three mild COVID-19 patients who did not take the COVID-19 vaccine. Longitudinal analyses in a small comparative subset showed that the vaccinated patients with BTI cleared the virus within 14 days, while the unvaccinated patients continued to harbor a higher SARS-CoV-2 burden in the SOF at d14. The IgG, IgA and SIgA antibodies showed a rising trend at d30 in the vaccinated group, but a declining trend in the NIVC group. In the unvaccinated group, the IgG and SIgA antibody levels in the SOF were negligible, while the IgA antibodies showed a declining trend in one of the two patients. Since vaccination was mandated during the COVID-19 pandemic the small number of unvaccinated patients was a limitation for statistics, however, the varying trends do clearly indicate the benefit of vaccination.
5. Conclusions
In this study we have shown the differential trends of SARS-CoV-2 burden and the anti-SARS-CoV-2 spike antibodies for the first time during the major and minor COVID-19 waves in India. Stronger IgA antibody avidity in the SOF shown in this study for the first time reiterates a local SIgA antibody production in the SOF in COVID-19. This research demonstrates an inverse relationship between salivary antibodies and the SARS-CoV2 burden suggesting the potential relevance of mucosal antibodies in the protection against viral infections of all mucosal surfaces.
Author Contributions
Muruganantham Lillimary Eniya: Resources; investigation, review & editing. Shervin Dokht Sadeghi Nasab: Resources, review & editing; Albert Judith: Resources, investigation, review & editing. Frederick Clasen: Data curation, Formal analysis; Beulah Faith: Resources; Selvamuthu Poongulali: Resources, Jayaraman Bhagavad Gita: Resources; review & editing. Chakrapani Ashok: Resources, Investigation. Velmurugan Raghavi: Resources. Subramanian Vedavalli: Resources.Chandra Lavanya: Resources. Kannan Ranganathan: Conceptualization, Funding acquisition. Gunaseelan Rajan: Conceptualization, Funding acquisition. Nagalingeswaran Kumarasamy: Conceptualization, Funding acquisition. David Moyes: Conceptualization, Formal analysis, Funding acquisition, Methodology; Project administration; review & editing. Mark Ide: Conceptualization; review & editing. Saeed Shoaie: Data curation, Formal analysis. Yuko Kurushima: Resources. Daljit Jagdev: Resources. Newell Johnson: Conceptualization; Funding acquisition, project administration. Stephen Challacombe: Conceptualization, Funding acquisition, Formal analysis, Methodology; Project administration; original draft, review & editing. Priya Kannian: Conceptualization, Funding acquisition, Investigation, data curation, Formal analysis, Methodology, Project administration, original draft, review & editing.
Funding
This study was funded by the UKRI (MRC Reference: MR/V040170/1) and the DBT, India (Ref: BT/IN/Indo UK/02/PK/2021-22).
Institutional Review Board Statement
The samples were collected prospectively in VHS-Institutional Ethics Committee approved studies (Proposal# VHS-IEC/60-2020, VHS-IEC/72-2021 and VHS-IEC/75-2021).
Informed Consent Statement
The samples were collected prospectively after obtaining written informed consent.
Conflicts of Interest
none.
References
- Shugars, D.C.; Sweet, S.P.; Malamud, D.; Kazmi, S.H.; Page-Shafer, K.; Challacombe, S.J. Saliva and inhibition of HIV-1 infection: molecular mechanisms. Oral Dis. 2002, 8 Suppl 2, 169–175. [Google Scholar] [CrossRef] [PubMed]
- Kazmi, S.H.; Naglik, J.R.; Sweet, S.P.; Evans, R.W.; O'Shea, S.; Banatvala, J.E.; Challacombe, S.J. Comparison of HIV-1 specific inhibitory activity in saliva and other human mucosal fluids. Clin. Vaccine Immunol. 2006, 10, 1111–1118. [Google Scholar] [CrossRef] [PubMed]
- Russell, M.W.; Mestecky, J. Mucosal immunity: The missing link in comprehending SARS-CoV-2 infection and transmission. Front Immunol. 2022, 13, 957107. [Google Scholar] [CrossRef] [PubMed]
- Brandtzaeg, P. Secretory immunity with special reference to the oral cavity. J. Oral Microbiol. 2013, 5. [Google Scholar] [CrossRef] [PubMed]
- Fröberg, J.; Gillard, J.; Philipsen, R.; Lanke, K.; Rust, J.; van Tuijl, D.; Teelen, K.; Bousema, T.; Simonetti, E.; van der Gaast-de Jongh, C.E.; Bos, M.; van Kuppeveld, F.J.; Bosch, B.J.; Nabuurs-Franssen, M.; van der Geest-Blankert, N.; van Daal, C.; Huynen, M.A.; de Jonge, M.I.; Diavatopoulos, D.A. SARS-CoV-2 mucosal antibody development and persistence and their relation to viral load and COVID-19 symptoms. Nat. Commun. 2021, 12(1), 5621. [Google Scholar] [CrossRef] [PubMed]
- Chan, R.W.Y.; Chan, K.C.C.; Lui, G.C.Y.; Tsun, J.G.S.; Chan, K.Y.Y.; Yip, J.S.K.; Liu, S.; Yu, M.W.L.; Ng, R.W.Y.; Chong, K.K.L.; Wang, M.H.; Chan, P.K.S.; Li, A.M.; Lam, H.S. Mucosal Antibody Response to SARS-CoV-2 in Paediatric and Adult Patients: A Longitudinal Study. Pathogens 2022, 11(4), 397. [Google Scholar] [CrossRef] [PubMed]
- Tan, H.X.; Davenport, M.P.; Kent, S.J.; Wheatley, A.K. Nice and slow make the germinal centres go: measured and escalating antigen delivery enhance durability and quality of humoral immune responses against HIV-1. Immunol. Cell Biol. 2022, 100(10), 750–752. [Google Scholar] [CrossRef] [PubMed]
- Brandtzaeg, P. Immunobiology of tonsils and adenoids. In Mucosal Immunology, 4th ed.; Mestecky, J., Strober, W., Russell, M.W., Kelsall, B.L., Cheroutre, H., Lambrecht, B.N., Eds.; Academic Press / Elsevier: Amsterdam, Netherlands, 2015; Vol. p, pp. 1985–2016. [Google Scholar]
- Quiding-Järbrink, M.; Lakew, M.; Nordström, I.; Banchereau, J.; Butcher, E.; Holmgren, J.; Czerkinsky, C. Human circulating specific antibody-forming cells after systemic and mucosal immunizations: differential homing commitments and cell surface differentiation markers. Eur. J. Immunol. 1995, 25(2), 322–327. [Google Scholar] [CrossRef] [PubMed]
- Quiding-Järbrink, M.; Nordström, I.; Granström, G.; Kilander, A.; Jertborn, M.; Butcher, E.C.; Lazarovits, A.I.; Holmgren, J.; Czerkinsky, C. Differential expression of tissue-specific adhesion molecules on human circulating antibody-forming cells after systemic, enteric, and nasal immunizations. A molecular basis for the compartmentalization of effector B cell responses. J. Clin. Invest 1997, 99(6), 1281–1286. [Google Scholar] [CrossRef] [PubMed]
- Russell, M.W.; Mesteckey, J. Mucosal Vaccines: Overview. In Mucosal Immunology, 4th ed.; Mestecky, J., Strober, W., Russell, M.W., Kelsall, B.L., Cheroutre, H., Lambrecht, B.N., Eds.; Academic Press / Elsevier: Amsterdam, Netherlands, 2015; Vol. p, pp. 1039–1046. [Google Scholar]
- Kannian, P.; Eniya, M.L.; Mahanathi, P.; Gracemary, A.; Kumarasamy, N.; Challacombe, S.J. Impact of COVID-19 on mucosal immunity and antibody responses in COVID-19 vaccinees. Vaccines 2025, 13(9), 967. [Google Scholar] [CrossRef] [PubMed]
- Seyedi, S.; Sottile, S.; Abedini, M.; Boffetta, P.; Violante, F.S.; Lodi, V.; De Palma, G.; Sala, E.; Mauro, M.; Rui, F.; et al. Antibody Kinetics of Immunological Memory in SARS-CoV-2-Vaccinated Healthcare Workers—The ORCHESTRA Project. Vaccines 2025, 13, 611. [Google Scholar] [CrossRef] [PubMed]
- Sano, K.; Miyakawa, K.; Kato, H.; Kimura, Y.; Goto, A.; Ryo, A.; Watanabe, S.; Hasegawa, H. Neutralizing antibody evasion of SARS-CoV-2 JN.1 derivatives KP.3, KP.3.1.1, LB.1 and XEC. Vaccine 2025, 62, 127472. [Google Scholar] [CrossRef] [PubMed]
- Lozano-Ojalvo, D.; Camara, C.; Lopez-Granados, E.; Nozal, P.; del Pino-Molina, L.; Bravo-Gallyo, L.Y.; Paz-Artal, E.; Pion, M.; Correa-Rocha, R.; Ortiz, A.; Lopez-Hoyos, M.; Iribarren, M.E.; Portoles, J.; Rojo-Portoles, M.P.; Ojeda, G.; Cervera, J.; Gonzalez-Perez, M.; Bodega-Mayor, I.; Montes-Casado, M.; Portoles, P.; Ochando, J. Differential effects of the second SARS-CoV-2 mRNA vaccination on T cell immunity in naïve and COVID-19 recovered individuals. Cell Rep. 2021, 36, 109570. [Google Scholar] [CrossRef] [PubMed]
- Stephenson, K.E.; Le Gars, M.; Sadoff, J.; de Groot, A.M.; Heerwegh, D.; Truyers, C.; Atyeo, C.; Loos, C.; Chandrashekar, A.; McMahan, K.; Tostanoski, L.H.; Yu, J.; Gebre, M.S.; Jacob-Dolan, C.; Li, Z.; Patel, S.; Peter, L.; Liu, J.; Borducchi, E.N.; Nkolola, J.P.; Souza, M.; Tan, C.S.; Zash, R.; Julg, B.; Nathavitharana, R.R.; Shapiro, R.L.; Azim, A.A.; Alonso, C.D.; Jaegle, K.; Ansel, J.L.; Kanjilal, D.G.; Guiney, C.J.; Bradshaw, C.; Tyler, A.; Makoni, T.; Yanosick, K.E.; Seaman, M.S.; Lauffenburger, D.A.; Alter, G.; Struyf, F.; Douoguih, M.; Van Hoof, J.; Schuitemaker, H.; Barouch, D.H. Immunogenicity of the Ad26.COV2.S vaccine for COVID-19. JAMA 2021, 325(15), 1535–1544. [Google Scholar] [CrossRef] [PubMed]
- Haralambieva, I.H.; Monroe, J.M.; Ovsyannikova, I.G.; Grill, D.E.; Poland, G.A.; Kennedy, R.B. Distinct homologous and variant-specific memory B-cell and antibody response over time after severe acute respiratory syndrome coronavirus 2 messenger RNA vaccination. J. Infect. Dis. 2022, 26(1), 23–31. [Google Scholar] [CrossRef] [PubMed]
- Pradenas, E.; Urrea, V.; Marfil, S.; Pidkova, T.; Aguilar-Gurrieri, C.; Abancó, F.; Mateu, L.; Chamorro, A.; Grau, E.; Trigueros, M.; Carrillo, J.; Massanella, M.; Trinité, B.; Clotet, B.; Blanco, J. Recurrent waning of anti-SARS-CoV-2 neutralizing antibodies despite multiple antigen exposures. J. Transl. Med. 2025, 23(1), 783. [Google Scholar] [CrossRef] [PubMed]
- Garziano, M.; Cano Fiestas, M.; Vanetti, C.; Strizzi, S.; Murno, M.L.; Clerici, M.; Biasin, M. SARS-CoV-2 natural infection but not vaccine-induced immunity elicits cross-reactivity to OC43. Heliyon 2024, 10, e37928. [Google Scholar] [CrossRef] [PubMed]
- Schmidt, V.A.; Stevens, V.R.; Rivieccio, M.; Sikar-Gang, A.; Simonetti, K.; Gunasekera, D.; Esfandiari, J.; Lyashchenko, K.P. Rapid detection of systemic and mucosal antibody responses to COVID-19 infection or vaccination. Int. Immunopharmacol. 2025, 153, 114512. [Google Scholar] [CrossRef] [PubMed]
- Brazer, N.; Morris, M.K.; Servellita, V.; Oseguera, M.; Sumimoto, N.; Saldhi, P.; Foresythe, A.; Nguyen, J.; Wadford, D.A.; Hanson, C.; Chiu, C.Y. Differential immunity induced by Omicron sublineages in naïve and vaccine breakthrough infections. Sci. Rep. 2025, 15(1), 23718. [Google Scholar] [CrossRef] [PubMed]
- Thomas, S.; Smatti, M.K.; Alkhatib, H.A.M.; Tayyar, Y.; Nizar, M.; Zedan, H.T.; Ouhtit, A.; Althani, A.A.; Nasrallah, G.K.; Yassine, H.M. Antibody-dependent enhancement of SARS-COV-2, the impact of variants and vaccination. Hum. Vaccin Immunother. 2025, 21(1), 2505356. [Google Scholar] [CrossRef] [PubMed]
- Paul, M.J.; Hudda, M.T.; Pallett, S.; Groppelli, E.; Boariu, E.; Finardi, N.F.; Wake, R.; Sofat, N.; Biddle, K.; Koushesh, S.; Dwyer-Hemmings, L.; Cook, R.; Ma, J.K. Mucosal immune responses to SARS-CoV-2 infection and COVID-19 vaccination. Vaccine 2025, 56, 127175. [Google Scholar] [CrossRef] [PubMed]
- Akeel, S.; Almazrooa, S.; Jazzar, A.; Mohammed Sindi, A.; Farsi, N.J.; Binmadi, N.; Badkok, R.; Aljohani, M.; AlFarabi, S. Detection of specific immunoglobulins in the saliva of patients with mild COVID-19. Cureus 2024, 16(1), e52113. [Google Scholar] [CrossRef] [PubMed]
- Ota, K.; Sakai, H.; Sasaki, D.; Mitsumoto-Kaseida, F.; Sakamoto, K.; Kosai, K.; Hasegawa, H.; Takazono, T.; Izumikawa, K.; Mukae, H.; Tun, M.M.N.; Morita, K.; Yanagihara, K. Rapid increase in salivary IgA and broad recognition of spike protein following SARS-CoV-2 vaccination. Virus Res. 2024, 339, 199294. [Google Scholar]
- Bladh, O.; Aguilera, K.; Marking, U.; Kihlgren, M.; Greilert Norin, N.; Smed-Sörensen, A.; Sällberg Chen, M.; Klingström, J.; Blom, K.; Russell, M.W.; Havervall, S.; Thålin, C.; Åberg, M. Comparison of SARS-CoV-2 spike-specific IgA and IgG in nasal secretions, saliva and serum. Front Immunol. 2024, 15, 1346749. [Google Scholar]
- Judith, A.; Eniya, M.L.; Faith, B.; Selvamuthu, P.; Yazhini, R.S.; Kumarasamy, N.; Challacombe, S.J.; Kannian, P. Mucosal Immune Responses in People Living with HIV May Confer Protection from SARS-CoV-2 Infections After COVID-19 Vaccination. Vaccines 2026, 14(6), 493. [Google Scholar] [CrossRef] [PubMed]
- Coronavirus Disease 2019 (COVID-19) Treatment Guidelines [Internet]; National Institutes of Health (US): Bethesda (MD), 2021 Apr 21–2024 Mar 1.
- Nasab, S.D.S.; Eniya, M.L.; Judith, A.; Clasen, F.; Faith, B.; Poongulali, S.; Gita, J.B.; Ashok, C.; Raghavi, V.; Vedavalli, S.; Lavanya, C.; Ranganathan, K.; Rajan, G.; Kumarasamy, N.; Moyes, D.; Ide, M.; Shoaie, S.; Kurushima, Y.; Jagdev, D.; Pun, M.; Johnson, N.; Kannian, P.; Challacombe, S. Detection and consistency of mucosal fluid T lymphocyte phenotypes and their relationship with blood, age and gender. J. Immunol. Methods 2024, 532, 113731. [Google Scholar] [CrossRef] [PubMed]
- Kannian, P.; Lavanya, C.; Ravichandran, K.; Bagavad Gita, J.; Mahanathi, P.; Ashwini, V.; Kumarasamy, N.; Rajan, G.; Ranganathan, K.; Challacombe, S.J.; Webster-Cyriaque, J.; Johnson, N.W. SARS-CoV2 antigen in whole mouth fluid may be a reliable rapid detection tool. Oral Dis. 2021, 28 (Suppl 2), 2575–2576. [Google Scholar] [CrossRef] [PubMed]
- Kannian, P.; Jayaraman, B.G.; Alamelu, S.; Lavanya, C.; Kumarasamy, N.; Rajan, G.; Ranganathan, K.; Mahanathi, P.; Ashwini, V.; Challacombe, S.J.; Webster-Cyriaque, J.; Johnson, N.W. Implications in the quantification of SARS-CoV2 copies in concurrent nasopharyngeal swabs, whole mouth fluid and respiratory droplets. Virus Res. 2021, 303, 198442. [Google Scholar] [CrossRef] [PubMed]
- Heaney, C.D.; Hempbel, H.; DeRosa, K.L.; Pinto, L.A.; Mantis, N.J. Clinical assessment of SARS-CoV-2 antibodies in oral fluids following infection and vaccination. Clin. Chem. 2024, 70(4), 589–596. [Google Scholar] [CrossRef] [PubMed]
- To, K.K.; Lu, L.; Yip, C.C.; Poon, R.W.; Fung, A.M.; Cheng, A.; Lui, D.H.; Ho, D.T.; Hung, I.F.; Chan, K.H.; Yuen, K.Y. Additional molecular testing of WMF specimens improves the detection of respiratory viruses. Emerg. Microbes Infect. 2017, 6(6), e49. [Google Scholar] [CrossRef] [PubMed]
- To, K.K.W.; Yip, C.C.Y.; Lai, C.Y.W.; Wong, C.K.H.; Ho, D.T.Y.; Pang, P.K.P.; Ng, A.C.K.; Leung, K.H.; Poon, R.W.S.; Chan, K.H.; Cheng, V.C.C.; Hung, I.F.N.; Yuen, K.Y. Saliva as a diagnostic specimen for testing respiratory virus by a point-of-care molecular assay: a diagnostic validity study. Clin. Microbiol. Infect. 2019, 25(3), 372–378. [Google Scholar] [CrossRef] [PubMed]
- To, K.K.; Tsang, O.T.; Leung, W.S.; Tam, A.R.; Wu, T.C.; Lung, D.C.; Yip, C.C.; Cai, J.P.; Chan, J.M.; Chik, T.S.; Lau, D.P.; Choi, C.Y.; Chen, L.L.; Chan, W.M.; Chan, K.H.; Ip, J.D.; Ng, A.C.; Poon, R.W.; Luo, C.T.; Cheng, V.C.; Chan, J.F.; Hung, I.F.; Chen, Z.; Chen, H.; Yuen, K.Y. Temporal profiles of viral load in posterior oropharyngeal WMF samples and serum antibody responses during infection by SARS-CoV-2: an observational cohort study. Lancet Infect. Dis. 2020, 20(5), 565–574. [Google Scholar] [CrossRef] [PubMed]
- To, K.K.; Tsang, O.T.; Yip, C.C.; Chan, K.H.; Wu, T.C.; Chan, J.M.; Leung, W.S.; Chik, T.S.; Choi, C.Y.; Kandamby, D.H.; Lung, D.C.; Tam, A.R.; Poon, R.W.; Fung, A.Y.; Hung, I.F.; Cheng, V.C.; Chan, J.F.; Yuen, K.Y. Consistent detection of 2019 novel coronavirus in WMF. Clin. Infect. Dis. 2020, 71(15), 841–843. [Google Scholar] [CrossRef] [PubMed]
- Thomas, A.C.; Oliver, E.; Baum, H.E.; Gupta, K.; Shelley, K.L.; Long, A.E.; Jones, H.E.; Smith, J.; Hitchings, B.; di Bartolo, N.; Vasileiou, K.; Rabi, F.; Alamir, H.; Eghleilib, M.; Francis, O.; Oliver, J.; Morales-Aza, B.; Obst, U.; Shattock, D.; Barr, R.; Collingwood, L.; Duale, K.; Grace, N.; Livera, G.G.; Bishop, L.; Downing, H.; Rodrigues, F.; Timpson, N.; Relton, C.L.; Toye, A.; Woolfson, D.N.; Berger, I.; Goenka, A.; Davidson, A.D.; Gillespie, K.M.; Williams, A.J.K.; Bailey, M.; Brooks-Pollock, E.; Finn, A.; Halliday, A.; CoMMinS Study Team. Evaluation and deployment of isotype specific salivary antibody assays for detecting previous SARSCoV-2 infection in children and adults. Commun. Med. 2023, 3(1), 37. [Google Scholar] [CrossRef] [PubMed]
- Sterlin, D.; Mathian, A.; Miyara, M.; Mohr, A.; Anna, F.; Claër, L.; Quentric, P.; Fadlallah, J.; Devilliers, H.; Ghillani, P.; Gunn, C.; Hockett, R.; Mudumba, S.; Guihot, A.; Luyt, C.E.; Mayaux, J.; Beurton, A.; Fourati, S.; Bruel, T.; Schwartz, O.; Lacorte, J.M.; Yssel, H.; Parizot, C.; Dorgham, K.; Charneau, P.; Amoura, Z.; Gorochov, G. IgA dominates the early neutralizing antibody response to SARS-CoV-2. Sci. Transl. Med. 2021, 13, eabd2223. [Google Scholar] [CrossRef] [PubMed]
- Nantel, S.; Sassine, S.; Bourdin, B.; Barbosa Da Torre, M.; Sutton, G.; Rabezanahary, H.; Qi, F.; Ward, L.A.; Delgado-Brand, M.; Adams, K.; Sheikh-Mohamed, S.; Wang, L.; Nicholson, S.; Laghdir, Z.; Colwill, K.; Chao, G.; Seifried, L.; Liu, Y.; Rini, J.M.; Gommerman, J.; Gingras, A.C.; Baz, M.; Zinzser, K.; Quach, C.; Decaluwe, H. Preserved SARS-CoV-2 T-cell responses despite impaired humoral immunity in children with profound B-cell lymphopenia. npj Vaccines 2026. [Google Scholar] [CrossRef] [PubMed]
- Forsman, D.; Smith, A.; Pratt, A.; Comerford, P.; Sparano, F.; Peng, C.; Dean, D. Surrogate virus neutralization test to determine salivary neutralizing antibody inhibition of ACE2 and SARS-CoV-2 spike RBD complex. Front Immunol. 2026, 17, 1803393. [Google Scholar] [CrossRef] [PubMed]
- Marcotte, H.; Cao, Y.; Zuo, F.; Simonelli, L.; Sammartino, J.C.; Pedotti, M.; Sun, R.; Cassaniti, I.; Hagbom, M.; Piralla, A.; Yang, J.; Du, L.; Percivalle, E.; Bertoglio, F.; Schubert, M.; Abolhassani, H.; Sherina, N.; Guerra, C.; Borte, S.; Rezaei, N.; Kumagai-Braesch, M.; Xue, Y.; Su, C.; Yan, Q.; He, P.; Grönwall, C.; Klareskog, L.; Calzolai, L.; Cavalli, A.; Wang, Q.; Robbiani, D.F.; Hust, M.; Shi, Z.; Feng, L.; Svensson, L.; Chen, L.; Bao, L.; Baldanti, F.; Xiao, J.; Qin, C.; Hammarström, L.; Yang, X.; Varani, L.; Xie, X.S.; Pan-Hammarström, Q. Conversion of monoclonal IgG to dimeric and secretory IgA restores neutralizing ability and prevents infection of Omicron lineages. Proc. Natl. Acad. Sci. USA 2024, 121(3), e2315354120. [Google Scholar] [CrossRef] [PubMed]
- Bladh, O.; Pongrácz, T.; Aguilera, K.; Berkell, M.; Marking, U.; Greilert Norin, N.; Rihani, A.; Alm, J.J.; Krammer, F.; Åberg, M.; Thålin, C. The role of mucosal IgA in protection against influenza A H1N1 virus infection in a real-world setting. EBioMedicine 2026, 129, 106359. [Google Scholar] [CrossRef] [PubMed]
- Chen, S.; Zhang, Z.; Lin, Z.; Yin, L.; Ning, L.; Liu, W.; Wang, Q.; Yang, C.; Feng, B.; Feng, Y.; Wang, Y.; Li, H.; He, P.; Liang, H.; Liu, Y.; Li, Z.; Liu, B.; Li, Y.; Boraschi, D.; Qu, L.; Niu, X.; Zhong, N.; Li, P.; Chen, L. Intranasal booster drives class switching and homing of memory B cells for mucosal IgA response. J. Clin. Invest Insight 2025, 198045. [Google Scholar] [CrossRef] [PubMed]
- Pisanic, N.; Antar, A.A.R.; Hetrich, M.K.; Demko, Z.O.; Zhang, X.; Spicer, K.; Kruczynski, K.L.; Detrick, B.; Clarke, W.; Knoll, M.D.; Thomas, D.L.; Dawood, F.S.; Veguilla, V.; Karron, R.A.; Manabe, Y.C.; Heaney, C.D. Early, Robust Mucosal Secretory Immunoglobulin A but not Immunoglobulin G Response to Severe Acute Respiratory Syndrome Coronavirus 2 Spike in Oral Fluid Is Associated With Faster Viral Clearance and Coronavirus Disease 2019 Symptom Resolution. J. Infect. Dis. 2025, 231(1), 121–130. [Google Scholar] [CrossRef] [PubMed]
- Struck, F.; Schreiner, P.; Staschik, E.; Wochinz-Richter, K.; Schulz, S.; Soutschek, E.; Motz, M.; Bauer, G. Vaccination versus infection with SARS-CoV-2: establishment of a high avidity IgG response versus incomplete avidity maturation. J. Med. Virol. 2021, 27270. [Google Scholar] [CrossRef] [PubMed]
- Mahanty, S.; Eriksson, E.M.; Edler, P.; Mordant, F.; Kiernan-Walker, N.; Price, D.J.; Braat, S.; Conway, E.; Bryant, V.; Ding, H.; Lee, L.Y.Y.; Randall, L.; Mazhari, R.; Mueller, I.; Subbarao, K. Antibody responses following COVID-19 vaccination and breakthrough infections in naïve and convalescent individuals suggest imprinting to the ancestral strain of SARS-CoV-2. mBio 2025, e03221-25. [Google Scholar] [CrossRef] [PubMed]
- Kliker, L.; Mandelboim, M.; Jurkowicz, M.; Zuckerman, N.S.; Tomer, E.; Lustig, Y.; Keinan-Boker, L.; Indenbaum, V.; Bassal, R. Immune Responses to SARS-CoV-2 Variants WT and XBB.1.9: Assessing Vulnerabilities and Preparedness. Vaccines 2025, 13, 1167. [Google Scholar] [CrossRef] [PubMed]
- Abbad, A.; Lerman, B.; Ehrenkaus, J.; Monahan, B.; Singh, G.; Wilson, A.; Slamanig, S.; Aracena, A.; Lyttle, N.; Nardulli, J.R.; Farrugia, K.; Khalil, Z.; Gonzalez-Reiche, A.S.; Sordillo, M.E.; Sun, W.; van Bakel, H.; Simon, V.; Krammer, F. Antibody responses to SARS-CoV-2 variants LP.8.1, LF.7.1, NB.1.8.1, XFG, and BA.3.2 following KP.2 monovalent mRNA vaccination. mBio 2026, 17(1), e02901-25. [Google Scholar] [CrossRef] [PubMed]
- Walmsley, S.L.; Nabipoor, M.; Chao, G.; Lovblom, L.E.; Ward, L.; Ravindran, R.; Colwill, K.; Gingras, A.C.; Gommerman, J.C. Rapid decline of SARS-CoV-2-specific salivary IgA antibody levels in people with hybrid immunity – data from the STOPCoV study. ImmunoHorizons 2025, 9(12), vlaf068. [Google Scholar] [CrossRef] [PubMed]
- Asokan, M.S.; Joan, R.F.; Babji, S.; Dayma, G.; Nadukkandy, P.; Subrahmanyam, V.; Pandey, A.; Malagi, G.; Arya, P.; Mahajan, V.; Bhavikatti, J.; Pawar, K.; Thorat, A.; Shah, P.; Goud, R.B.; Roy, B.; Rajukutty, S.; Immanuel, S.; Agarwal, D.; Saha, S.; Shivaraj, A.; Panikulam, P.; Shome, R.; Gulzar, S.E.; Sharma, A.U.; Naik, A.; Talashi, S.; Belekar, M.; Yadav, R.; Khude, P.; Mamatha, V.; Shivalingaiah, S.; Deshmukh, U.; Bhise, C.; Joshi, M.; Inbaraj, L.R.; Chandrasingh, S.; Ghose, A.; Jamora, C.; Karumbati, A.S.; Sundaramurthy, V.; Johnson, A.; Ramesh, N.; Chetan, N.; Parthiban, C.; Ahmed, A.; Rakshit, S.; Adiga, V.; D'souza, G.; Rale, V.; George, C.E.; John, J.; Kawade, A.; Chaturvedi, A.; Raghunathan, A.; Dias, M.; Bhosale, A.; Raghu, P.; Shashidhara, L.S.; Vyakarnam, A.; Bal, V.; Kang, G.; Mayor, S. Immunogenicity of SARS-CoV-2 vaccines BBV152 (Covaxin) and ChAdOx1 nCoV-19 (Covishield) in seronegative and seropositive individuals in India: a multicentre, nonrandomized observational study. Lancet Reg. Health Southeast Asia 2024, 22, 100361. [Google Scholar] [CrossRef] [PubMed]
- Farias, J.P.; Souza, M.S.; Fogaca, M.M.C.; da Silva Brito, R.D.; da Rocha Santos, A.; de Melo, C.M.L.; de Sousa, G.F.; Braconi, C.T.; Lopes Barboza, M.G.; de Souza Lino, V.; Donizetti Candido, É.; Oliveira Vidal, P.; Rebello Pinho, J.R.; Leal Oliveira, D.B.; Durigon, E.L.; de Souza Ferreira, L.C.; Amorim, J.H. Antigenic drift in SARS-CoV-2: diminished vaccine protection in pediatric populations against omicron and its JN.1 subvariant. Expert Rev. Vaccines 2025, 24(1), 1128–1136. [Google Scholar] [CrossRef] [PubMed]
- Malladi, S.K.; Jaiswal, D.; Ying, B.; Alsoussi, W.B.; Darling, T.L.; Dadonaite, B.; Civljak, A.; Horvath, S.C.; Zhou, J.Q.; Kim, W.; Turner, J.S.; Schmitz, A.J.; Han, F.; Scheaffer, S.M.; Farnsworth, C.W.; Nachbagauer, R.; Nestorova, B.; Chalkias, S.; Klebert, M.K.; Edwards, D.K.; Paris, R.; Strnad, B.S.; Middleton, W.D.; O'Halloran, J.A.; Presti, R.M.; Bloom, J.D.; Boon, A.C.M.; Diamond, M.S.; Bajic, G.; Ellebedy, A.H. Germinal center–mediated broadening of B cell responses to SARS-CoV-2 booster immunization. Sci. Immunol. 2025, 10, eadu4107. [Google Scholar] [CrossRef] [PubMed]
- Koutsakos, M.; Ellebedy, A.H. Immunological imprinting: understanding COVID-19. Immunity 2023, 56, 909. [Google Scholar] [CrossRef] [PubMed]
- Song, R.; Li, J.; Wang, Y.; Huang, Q.; Geng, Y.; Ding, X.; Duan, X.; Wen, C.; Tang, Y.; Kang, L.; Huang, F.; Dong, M.; Dong, J.; Chen, X. Application of oral fluid for quantitative nucleic acid and antibody detection of the severe acute respiratory syndrome coronavirus 2. Front Public Health 2025, 13, 1659411. [Google Scholar] [CrossRef] [PubMed]
Figure 1.
SARS-CoV-2 RNA burden in COVID-19. The X-axis denotes the categories. The Y-axis denotes the SARS-CoV-2 RNA copies per milliliter in logarithmic values. The circles denote individual samples and the short bar denotes the median value of each group. A. SARS-CoV-2 RNA copies in the SOF among mild or moderate COVID-19. B. Longitudinal analysis of the SARS-CoV-2 burden in SOF samples. C. Differential SARS-CoV-2 burden during the different COVID-19 pandemic waves. D. Correlation analysis between NPS RNA copies and SOF RNA copies. r – correlation co-efficient; p – p value (Spearman rank correlation co-efficient test).
Figure 1.
SARS-CoV-2 RNA burden in COVID-19. The X-axis denotes the categories. The Y-axis denotes the SARS-CoV-2 RNA copies per milliliter in logarithmic values. The circles denote individual samples and the short bar denotes the median value of each group. A. SARS-CoV-2 RNA copies in the SOF among mild or moderate COVID-19. B. Longitudinal analysis of the SARS-CoV-2 burden in SOF samples. C. Differential SARS-CoV-2 burden during the different COVID-19 pandemic waves. D. Correlation analysis between NPS RNA copies and SOF RNA copies. r – correlation co-efficient; p – p value (Spearman rank correlation co-efficient test).
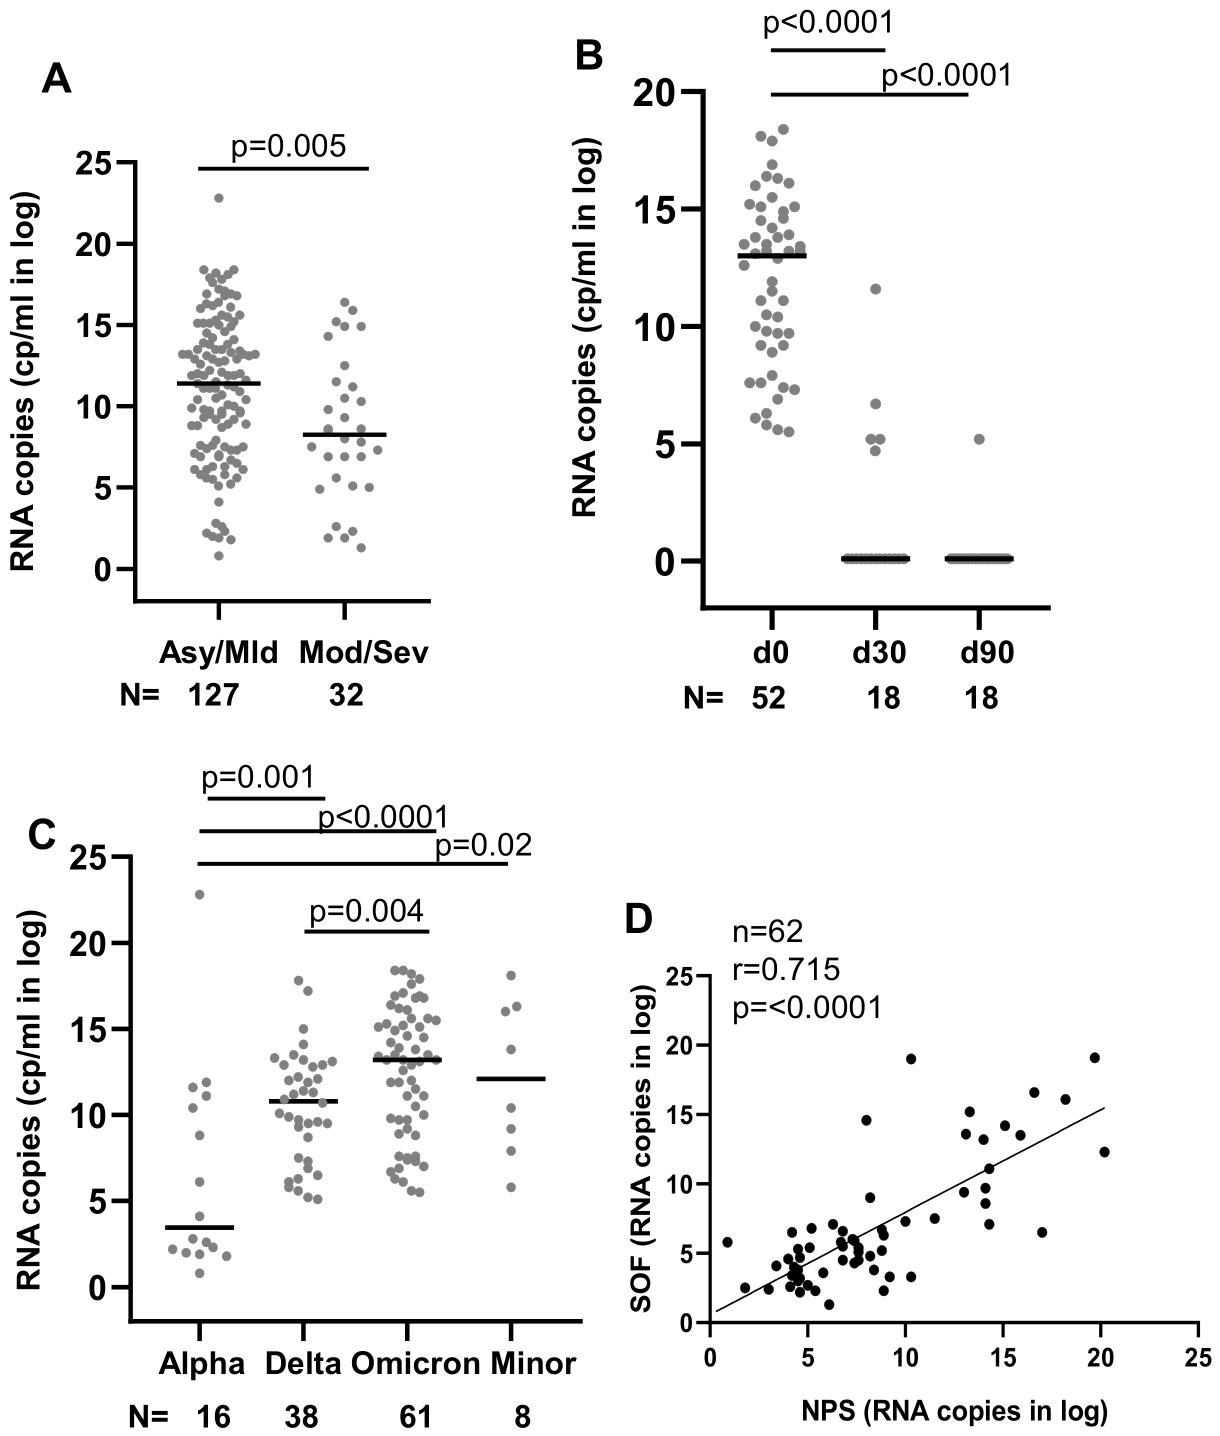
Figure 2.
Anti-SARS-CoV-2 spike antibodies in COVID-19 patients with asymptomatic/mild or moderate/severe disease. The X-axis denotes the COVID-19 disease severity categories. The Y-axis denotes the anti-SARS-CoV-2 spike antibodies. The circles denote individual samples and the short bar denotes the median value of each group. The graphs of the first column denote IgG antibodies (panel A absolute values in the SOF; panel D as values normalized over the SR in the SOF; panel G as values in serum). The graphs in the second column denotes IgA antibodies (panel B as absolute values in the SOF; panel E as values normalized over the SR in the SOF; panel H as values in serum). The graphs in the third column denote SIgA antibodies (panel C as absolute values in the SOF; panel F as values normalized over the SR in the SOF).
Figure 2.
Anti-SARS-CoV-2 spike antibodies in COVID-19 patients with asymptomatic/mild or moderate/severe disease. The X-axis denotes the COVID-19 disease severity categories. The Y-axis denotes the anti-SARS-CoV-2 spike antibodies. The circles denote individual samples and the short bar denotes the median value of each group. The graphs of the first column denote IgG antibodies (panel A absolute values in the SOF; panel D as values normalized over the SR in the SOF; panel G as values in serum). The graphs in the second column denotes IgA antibodies (panel B as absolute values in the SOF; panel E as values normalized over the SR in the SOF; panel H as values in serum). The graphs in the third column denote SIgA antibodies (panel C as absolute values in the SOF; panel F as values normalized over the SR in the SOF).
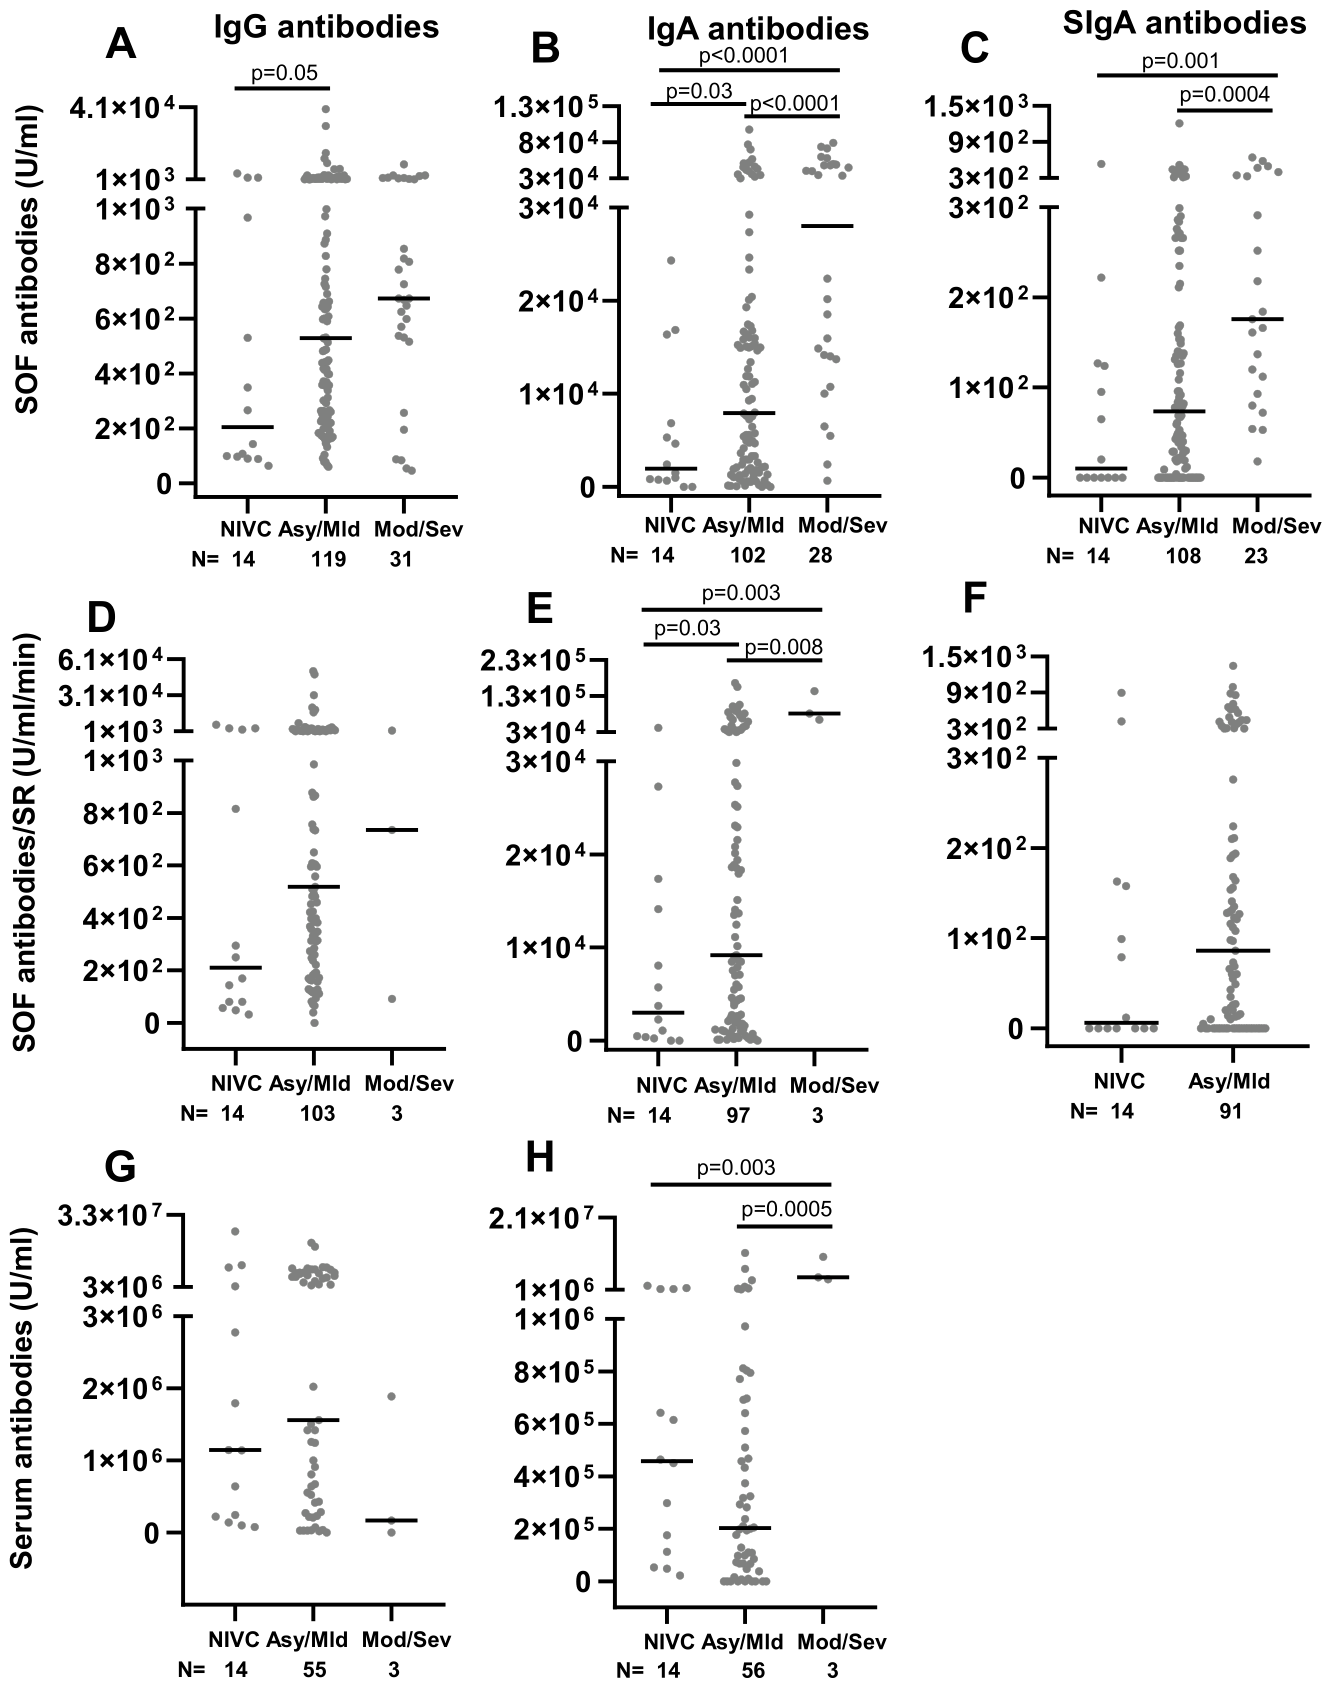
Figure 3.
Correlations between SARS-CoV-2 RNA copies and anti-SARS-CoV-2 antibodies. The X-axis denotes the SARS-CoV-2 RNA copies/ml in logarithmic values. The Y-axis denotes the antibody levels in SOF or serum. The circles denote each sample. A: SOF IgG antibodies in U/ml. B: Serum IgG antibodies in U/ml. C: SOF IgA antibodies in U/ml. D: Serum IgA antibodies in U/ml. E: SOF SIgA antibodies in U/ml. r-correlation coefficient; p-p value. The r and p values were calculated by using Spearman rank correlation test.
Figure 3.
Correlations between SARS-CoV-2 RNA copies and anti-SARS-CoV-2 antibodies. The X-axis denotes the SARS-CoV-2 RNA copies/ml in logarithmic values. The Y-axis denotes the antibody levels in SOF or serum. The circles denote each sample. A: SOF IgG antibodies in U/ml. B: Serum IgG antibodies in U/ml. C: SOF IgA antibodies in U/ml. D: Serum IgA antibodies in U/ml. E: SOF SIgA antibodies in U/ml. r-correlation coefficient; p-p value. The r and p values were calculated by using Spearman rank correlation test.
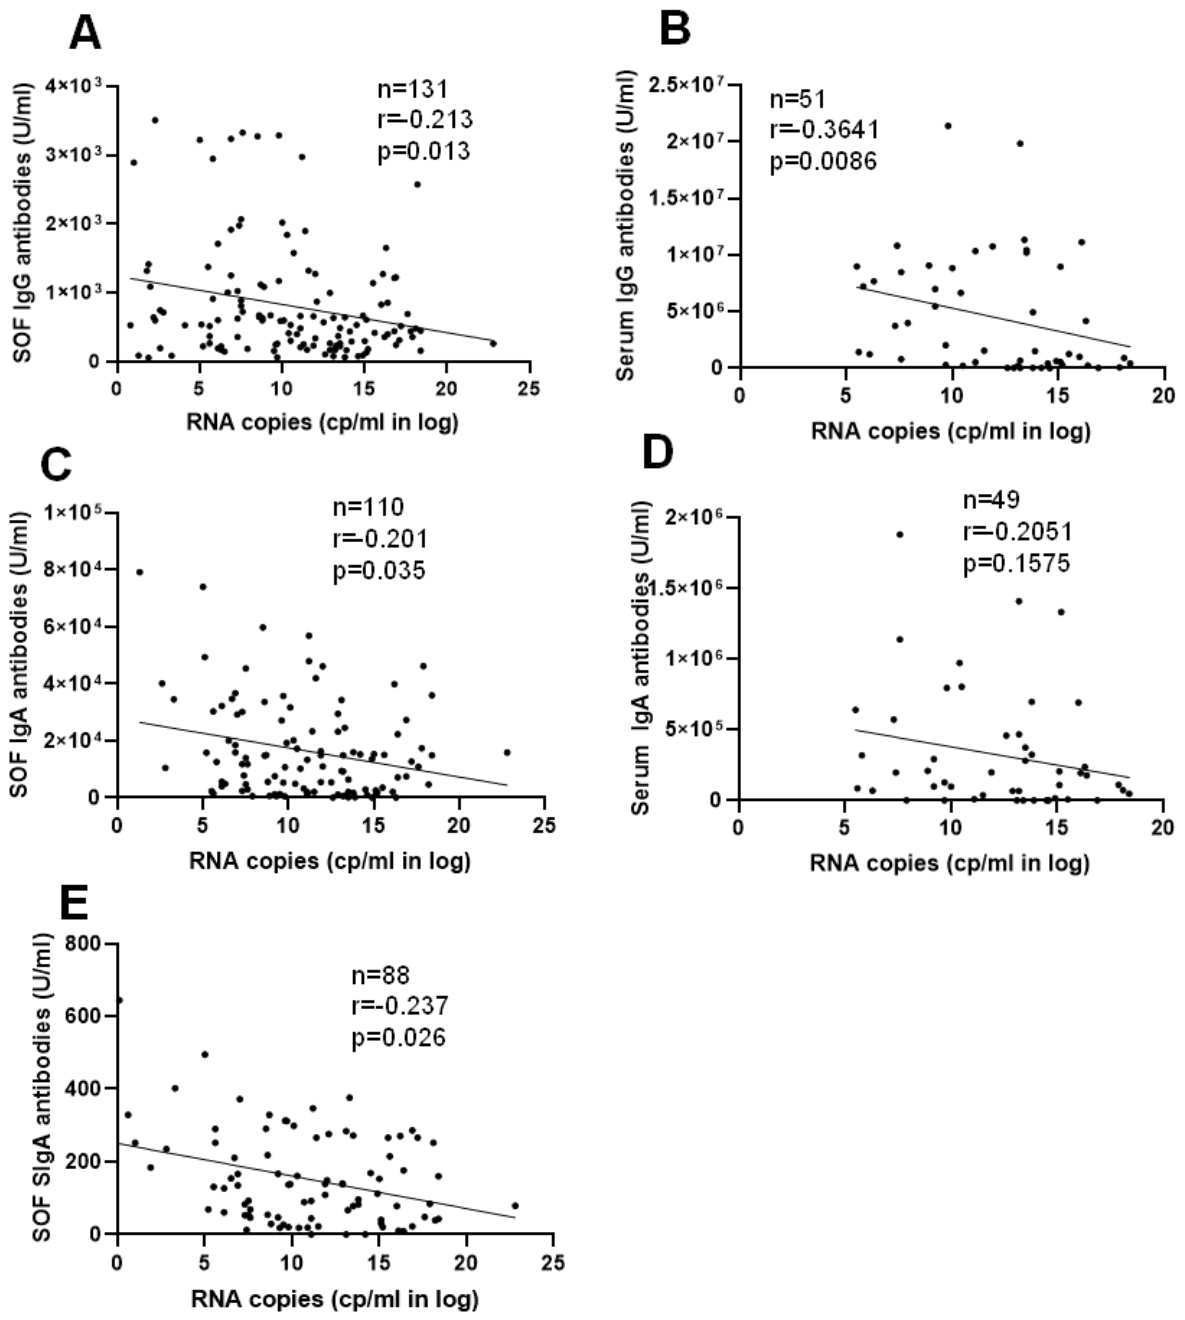
Figure 4.
Avidity indices (AvI) of IgG and IgA antibodies in SOF and serum. X-axis denotes the COVID-19 severity categories. Y-axis denote the avidity indices as percentages. The circles denote the samples and the short bar denote the median values. A: IgG antibody avidity in SOF; B: IgA antibody avidity in SOF; C: IgG antibody avidity in serum; D: IgA antibody avidity in serum.
Figure 4.
Avidity indices (AvI) of IgG and IgA antibodies in SOF and serum. X-axis denotes the COVID-19 severity categories. Y-axis denote the avidity indices as percentages. The circles denote the samples and the short bar denote the median values. A: IgG antibody avidity in SOF; B: IgA antibody avidity in SOF; C: IgG antibody avidity in serum; D: IgA antibody avidity in serum.
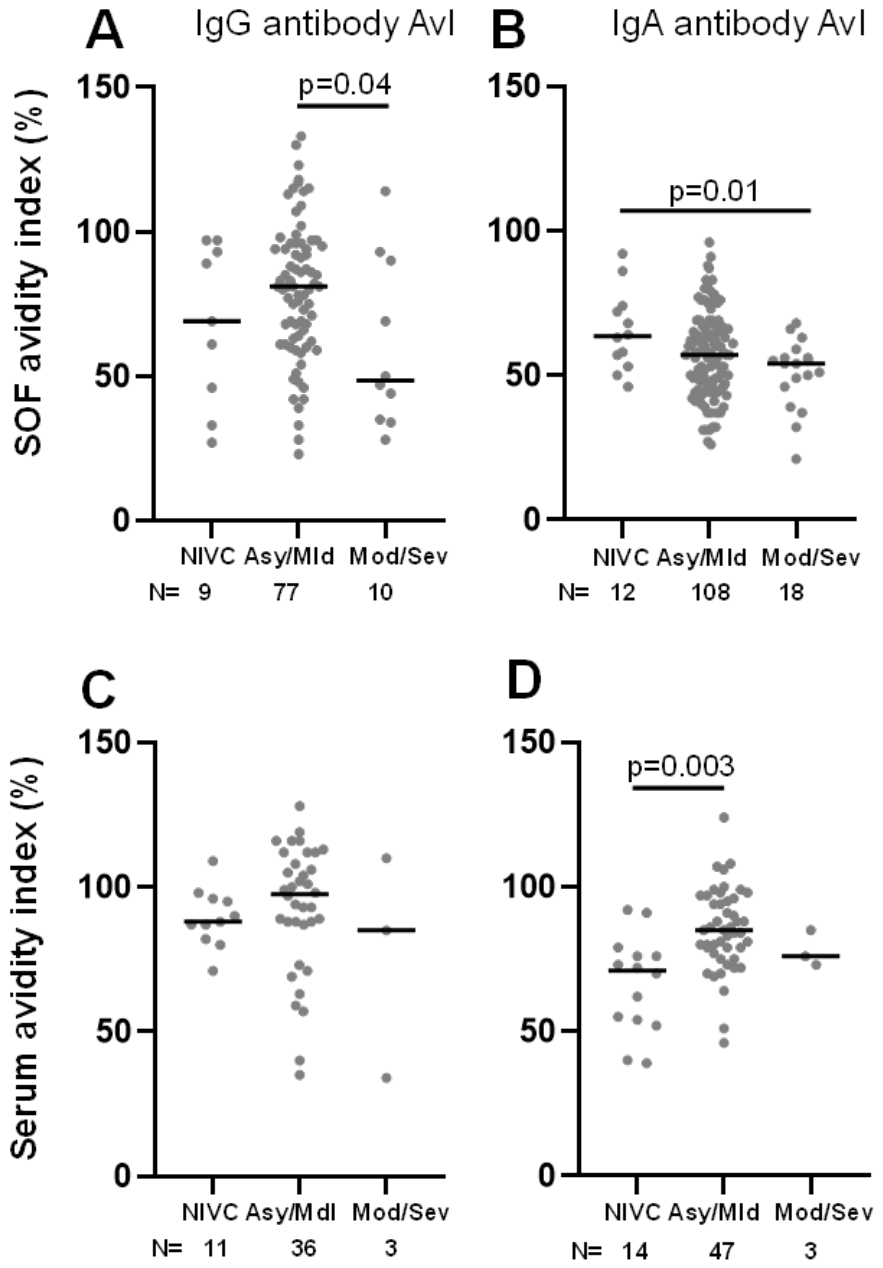
Figure 5.
Longitudinal trends of IgG, IgA and SIgA antibodies and their avidity indices in SOF and serum samples. The X-axis denotes the sample collection time points in days. The Y-axis denotes the antibody levels or the avidity indices. The bars denote the median values. A: SOF IgG antibodies (normalized over the SR (U/ml/min). B: SOF IgA antibodies normalized over the SR (U/ml/min). C: SOF SIgA antibodies normalized over the SR (U/ml/min). D: Serum IgG antibodies (u/ml). E: Serum IgA antibodies (U/ml). F: SOF IgG antibody avidity index (%). G: SOF IgA antibodies avidity index (%). H: Serum IgA antibody avidity index (%). P values were calculated by Mann-Whitney rank sum test.
Figure 5.
Longitudinal trends of IgG, IgA and SIgA antibodies and their avidity indices in SOF and serum samples. The X-axis denotes the sample collection time points in days. The Y-axis denotes the antibody levels or the avidity indices. The bars denote the median values. A: SOF IgG antibodies (normalized over the SR (U/ml/min). B: SOF IgA antibodies normalized over the SR (U/ml/min). C: SOF SIgA antibodies normalized over the SR (U/ml/min). D: Serum IgG antibodies (u/ml). E: Serum IgA antibodies (U/ml). F: SOF IgG antibody avidity index (%). G: SOF IgA antibodies avidity index (%). H: Serum IgA antibody avidity index (%). P values were calculated by Mann-Whitney rank sum test.
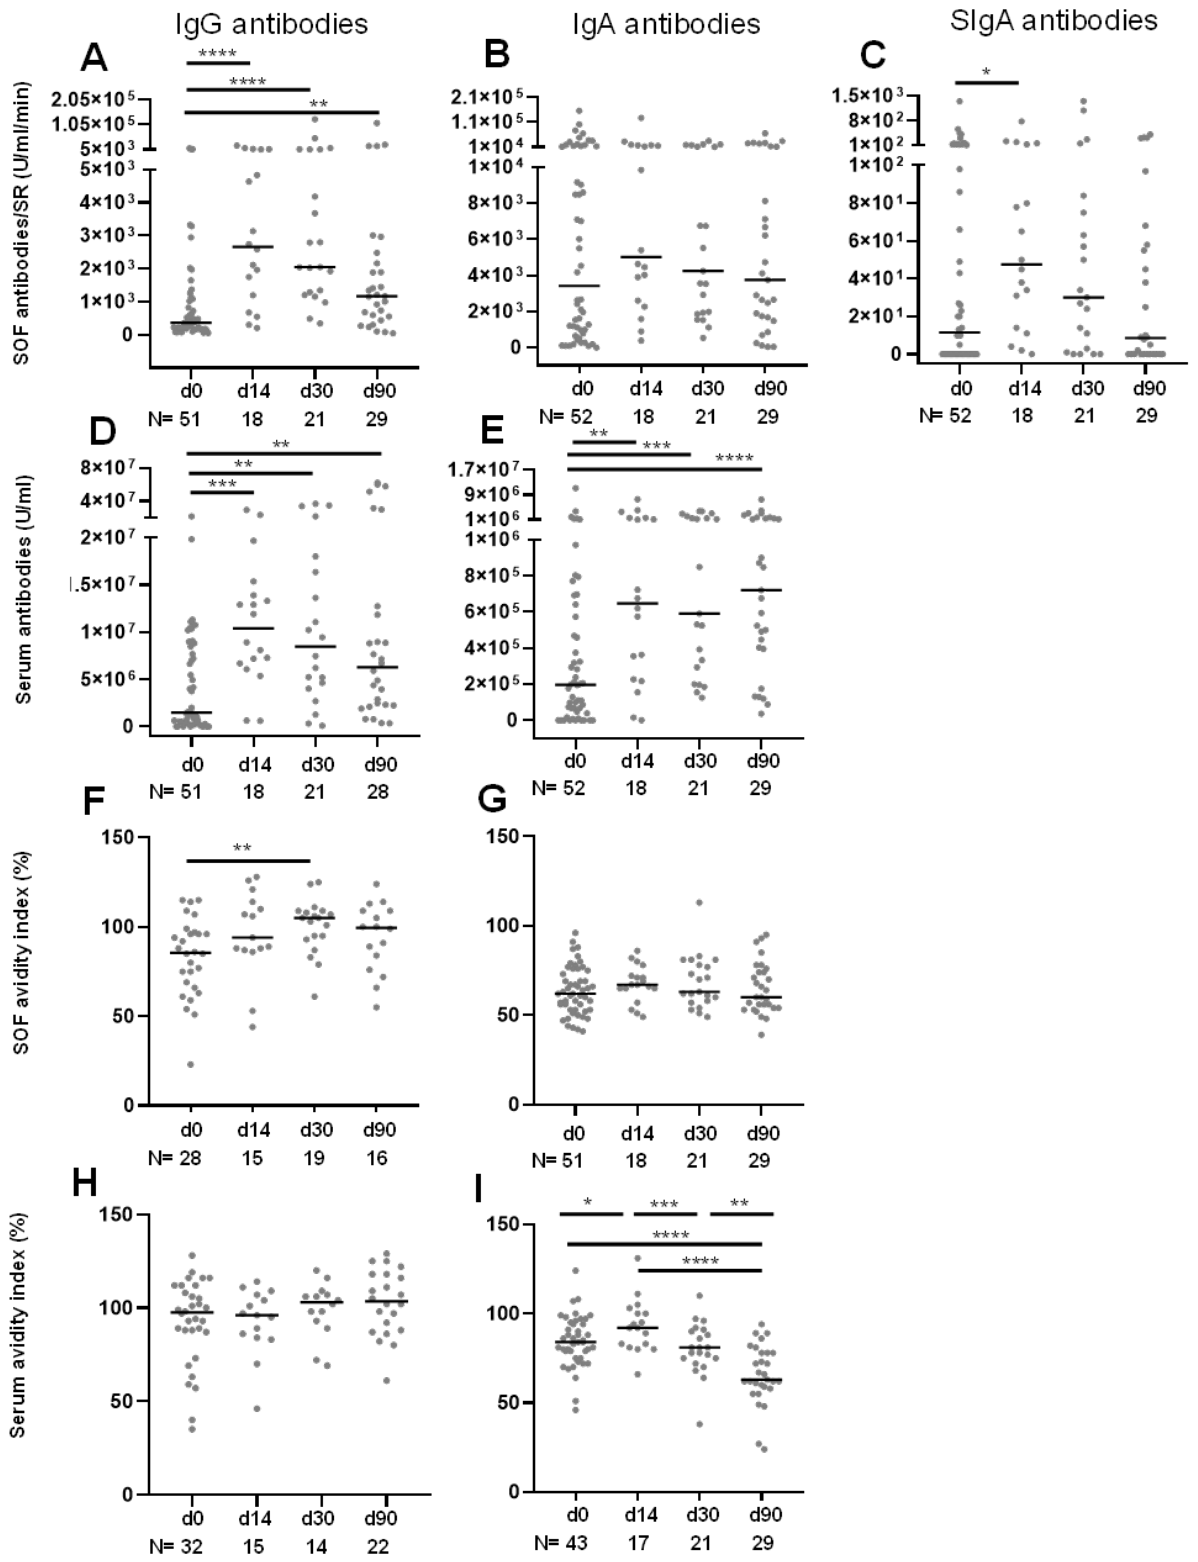
Figure 6.
Anti-SARS-CoV-2 spike IgG, IgA and SIgA antibodies and their avidity indices in SOF samples of COVID-19 during the different COVID-19 waves. Y-axis denotes the antibodies or avidity index. The short bars denote the median values. A: SOF IgG antibodies normalized over SR (U/ml/min). B: SOF IgA antibodies normalized over SR (U/ml/min). C: SOF SIgA antibodies normalized over SR (U/ml/min). D: SOF IgG antibody avidity indices (%). E: SOF IgA antibody avidity index (%). P values were calculated by Mann Whitney rank sum test.
Figure 6.
Anti-SARS-CoV-2 spike IgG, IgA and SIgA antibodies and their avidity indices in SOF samples of COVID-19 during the different COVID-19 waves. Y-axis denotes the antibodies or avidity index. The short bars denote the median values. A: SOF IgG antibodies normalized over SR (U/ml/min). B: SOF IgA antibodies normalized over SR (U/ml/min). C: SOF SIgA antibodies normalized over SR (U/ml/min). D: SOF IgG antibody avidity indices (%). E: SOF IgA antibody avidity index (%). P values were calculated by Mann Whitney rank sum test.
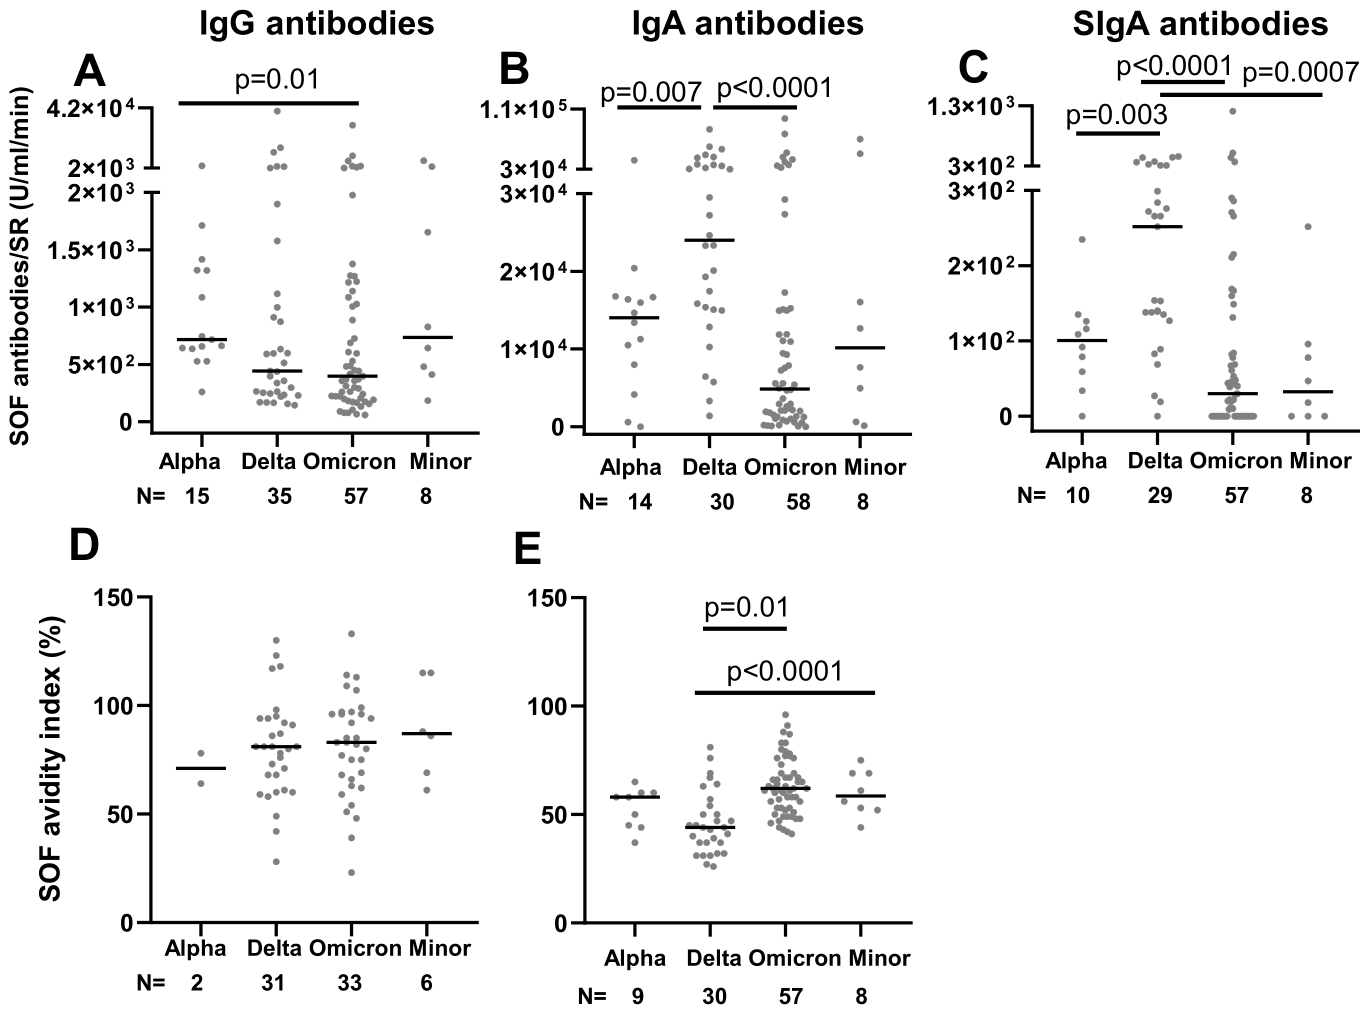
Figure 7.
Differential trends in SARS-CoV-2 burden and anti-SARS-CoV-2 spike antibodies in SOF among unvaccinated or vaccinated mild COVID-19 patients. X-axis denotes the sample time points among the non-infected vaccinated controls (NIVC), unvaccinated COVID-19 patients and vaccinated COVID-19 patients. Each patient is denoted by a different symbol. A: SARS-CoV-2 RNA in logarithmic copies per ml in SOF. B: SOF IgG antibodies normalized over SR (U/ml/min). C: SOF IgA antibodies normalized over SR (U/ml/min). D: SOF SIgA antibodies normalized over SR (U/ml/min). E: Table inset showing the median values and mean differences of the d0 and d30 time point values.
Figure 7.
Differential trends in SARS-CoV-2 burden and anti-SARS-CoV-2 spike antibodies in SOF among unvaccinated or vaccinated mild COVID-19 patients. X-axis denotes the sample time points among the non-infected vaccinated controls (NIVC), unvaccinated COVID-19 patients and vaccinated COVID-19 patients. Each patient is denoted by a different symbol. A: SARS-CoV-2 RNA in logarithmic copies per ml in SOF. B: SOF IgG antibodies normalized over SR (U/ml/min). C: SOF IgA antibodies normalized over SR (U/ml/min). D: SOF SIgA antibodies normalized over SR (U/ml/min). E: Table inset showing the median values and mean differences of the d0 and d30 time point values.
Disclaimer/Publisher’s Note: The statements, opinions and data contained in all publications are solely those of the individual author(s) and contributor(s) and not of MDPI and/or the editor(s). MDPI and/or the editor(s) disclaim responsibility for any injury to people or property resulting from any ideas, methods, instructions or products referred to in the content. |
© 2026 by the authors. Licensee MDPI, Basel, Switzerland. This article is an open access article distributed under the terms and conditions of the Creative Commons Attribution (CC BY) license (http://creativecommons.org/licenses/by/4.0/).
Copyright: This open access article is published under a Creative Commons CC BY 4.0 license, which permit the free download, distribution, and reuse, provided that the author and preprint are cited in any reuse.