
Submitted:
04 August 2026
Posted:
06 August 2026
You are already at the latest version
Abstract
Clerodendrum squamatum Vahl, locally known as sesewanua, remains insufficiently characterized by gas chromatography–mass spectrometry (GC–MS). This study retrospectively evaluated an archived GC–MS dataset of powdered leaves to establish a preliminary and artifact-aware chemical fingerprint. Thirty integrated peaks were detected between 7.57 and 39.21 min, with a total chromatographic area of 23,281,445.578 counts·min. Peaks 1–9 accounted for 58.60% of the normalized area and generated library candidates associated with monoterpenes, long-chain aldehydes, phytol-related diterpenoids, and fatty-acid methyl esters. The predominant signal at 16.25 min represented 29.93% and was conservatively annotated as an octadecenal isomer with an unresolved double-bond position. Other plausible signals included a neophytadiene/phytol-related diterpenoid and an unresolved octadecenoic acid methyl ester. Peaks 10–15 were structurally ambiguous, while the late-eluting region represented 33.30% of the chromatographic area and was dominated by siloxane-related or mixed-background spectra. All annotations remain tentative because authentic standards, experimental retention indices, blank chromatograms, and replicate analyses were unavailable. The findings provide an initial GC–MS baseline for sesewanua leaves while emphasizing the importance of distinguishing plausible botanical signals from analytical background.
Keywords:
Clerodendrum squamatum
; sesewanua
; GC–MS fingerprinting
; leaf powder
; tentative annotation
; neophytadiene
; fatty-acid methyl ester
; siloxane background
1. Introduction
The genus Clerodendrum, currently placed in the family Lamiaceae, comprises a chemically diverse group of tropical and subtropical plants that has attracted sustained interest in natural-product research. Members of the genus are recognized sources of abietane-, pimarane-, clerodane-, and other diterpenoid skeletons with varied biological properties [1]. Clerodane-type diterpenoids are particularly relevant because this structural group has been associated with anti-inflammatory and cytotoxic activities across several botanical families [2]. A recent comprehensive review of Clerodendrum trichotomum documented 164 secondary metabolites, including terpenoids, flavonoids, steroids, phenylpropanoid glycosides, phenylethanoid glycosides, alkaloids, and related compounds [3]. These findings illustrate the phytochemical diversity of Clerodendrum, while also indicating that the profile of one species cannot be assumed to represent another.
Leaves are among the most frequently investigated Clerodendrum organs because they are renewable and can contain volatile, semivolatile, and nonvolatile constituents. Analysis of a volatile fraction from Clerodendrum infortunatum leaves demonstrated the occurrence of several terpenoid-related components [4]. UHPLC–ESI–QTOF–MS/MS profiling of Clerodendrum glandulosum leaves identified phenylethanoid glycosides and other polar phytochemicals in bioactive fractions [5]. A comparative investigation of Clerodendrum paniculatum showed that solvent polarity and extraction method substantially influenced the compounds detected by GC–HRMS and LC–HRMS [6]. Methanolic Clerodendrum thomsoniae leaf extract was also reported to contain several GC–MS-detectable constituents, alongside measurable antioxidant, anticholinesterase, and antibacterial responses [7]. More recently, combined GC–MS and LC–MS analysis of Clerodendrum speciosum leaves distinguished a volatile fraction rich in fatty-acid- and terpene-related compounds from a phenolic-rich semipolar fraction [8]. Collectively, these studies demonstrate that the resulting chemical fingerprint is strongly dependent on the selected plant tissue, extraction system, fraction polarity, and analytical platform.
Recent investigations have also examined the biological activities of Clerodendrum leaf preparations and isolated constituents. GC–MS-profiled extracts of C. infortunatum were evaluated in experimental models of inflammation, linking chemical characterization with purpose-designed biological assays [9]. A phenolic-enriched fraction from C. glandulosum leaves was associated with improved glycemic and oxidative-stress parameters in an experimental diabetic model [10]. New cyclohexylethanoid and rearranged abietane derivatives isolated from C. bungei and C. inerme showed inhibitory effects on inflammatory mediator production in cultured cells [11]. Constituents isolated from C. trichotomum have also demonstrated α-glucosidase-inhibitory and PPAR-γ-agonist activities [12]. These findings are specific to the tested extracts, purified constituents, concentrations, and experimental systems. Consequently, a compound name generated by automated GC–MS library searching cannot independently establish antimicrobial, anti-inflammatory, or other pharmacological activity.
Compared with the species described above, recent chemical information specifically addressing leaves recorded as Clerodendrum squamatum Vahl remains limited. This creates a need for preliminary chemical documentation that preserves the distinction between plausible plant-associated signals and uncertain instrumental output. Regional GC–MS studies conducted by Paat and colleagues have previously characterized botanical materials from North Sulawesi, including local Myristica fragrans pericarp [13]. A subsequent study applied GC–MS screening to Barringtonia asiatica seeds in the context of potential biopesticide constituents [14]. Another regional investigation examined a solid-endosperm preparation of Cocos nucifera from Bolaang Mongondow [15]. Although these studies involved different botanical matrices, they demonstrate continuing interest in documenting the GC–MS profiles of locally sourced plant materials.
A more rigorous regional framework was recently presented by Paat and Sintaro for the analysis of a selected lipophilic fraction of Syzygium polyanthum leaves [16]. That investigation supported tentative annotation through spectral-library matching, experimental retention indices, diagnostic-ion evaluation, solvent-blank assessment, and replicate injections. It also emphasized that normalized peak areas indicate relative GC–MS signal contributions rather than absolute compound concentrations. This distinction is essential when an archived dataset lacks calibration standards, replicate preparations, retention-index measurements, or complete blank information.
GC–MS is a useful technique for profiling volatile and semivolatile botanical constituents, but the reliability of compound annotation depends on the available supporting evidence. Automated library searching ranks candidate spectra according to similarity, and the first-ranked hit should therefore be treated as a hypothesis rather than as definitive structural identification. Degnan et al. demonstrated that assumptions used in retention-index scoring can influence candidate ranking and metabolite-identification confidence [17]. Flores et al. further showed that false-discovery estimation is important when interpreting large numbers of GC–MS spectral matches [18]. Computational resources such as GCMS-ID can integrate spectral and retention information, but their output still depends on data quality and the availability of appropriate reference records [19]. These analytical considerations support the use of conservative compound names when several positional or geometric isomers produce similar library scores.
Background contamination represents an additional challenge in GC–MS profiling. Methylsiloxane signals may arise from injection-port components, septa, column-related processes, laboratory materials, or the surrounding analytical environment rather than from the botanical sample itself. Huang et al. demonstrated that GC–MS accessories and instrumental conditions can generate substantial methylsiloxane background and interfere with trace-level interpretation [20]. Repeated late-eluting signals associated with hexasiloxane, heptasiloxane, or octasiloxane candidates should therefore be evaluated against blank chromatograms and characteristic fragmentation patterns before being attributed to a plant matrix. When blank data are unavailable, such signals are more appropriately classified as probable analytical background than as confirmed botanical constituents.
The available laboratory records identify the material examined in the present study as powdered leaves of C. squamatum Vahl, locally referred to as sesewanua. The archived dataset comprises a single GC–MS injection and uses library-supported annotations without authentic standards or experimental retention indices; later chromatographic signals are dominated by siloxane-related candidates. Accordingly, this study aimed to establish a preliminary and artifact-aware GC–MS fingerprint of the leaf preparation, tentatively annotate the principal chemically plausible sample-associated signals, and distinguish them from structurally ambiguous or probable siloxane-dominated background signals. The study was not intended to provide definitive structural identification, absolute quantification, a complete metabolomic profile, or evidence of antimicrobial or other biological activity.
2. Results
2.1. Overall GC–MS Chromatographic Profile
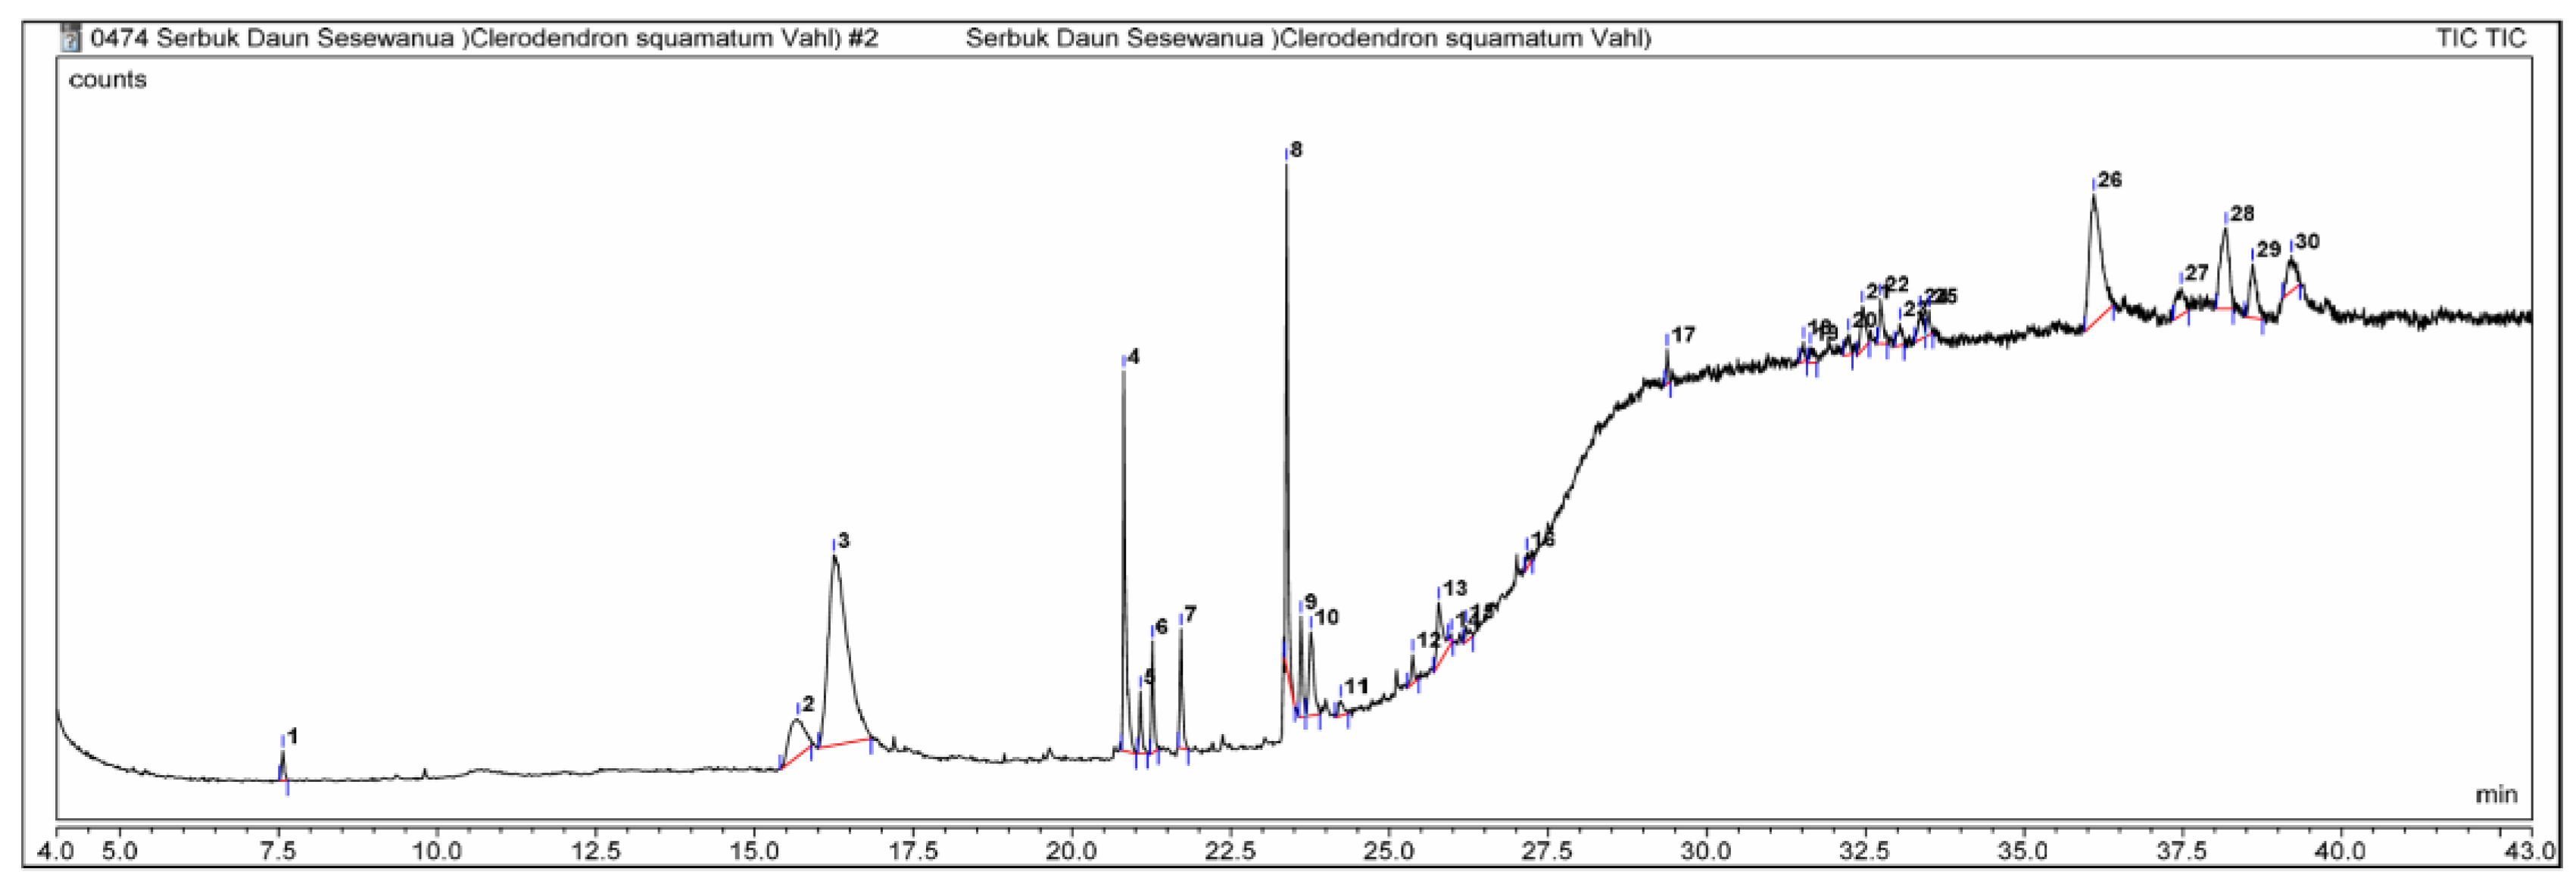
GC–MS analysis of the powdered sesewanua leaf preparation generated 30 integrated chromatographic peaks over a retention-time range of 7.57–39.21 min. The total integrated chromatographic area was 23,281,445.578 counts·min. The first 15 peaks, detected between 7.57 and 26.21 min, collectively represented 66.70% of the total normalized chromatographic area. The remaining 15 peaks, detected between 27.17 and 39.21 min, contributed 33.30%.
The total ion chromatogram showed a dominant peak at approximately 16.25 min, followed by distinct signals at 20.82 and 23.38 min. After approximately 27 min, the chromatogram exhibited a pronounced increase in baseline intensity accompanied by numerous late-eluting peaks. Most of these late peaks produced siloxane-related candidates during automated library searching.
Figure 1.
Total ion chromatogram of the powdered leaf preparation recorded as Clerodendrum squamatum Vahl. Peak numbers correspond to the automated integration results generated using Chromeleon.
Figure 1.
Total ion chromatogram of the powdered leaf preparation recorded as Clerodendrum squamatum Vahl. Peak numbers correspond to the automated integration results generated using Chromeleon.
2.2. Principal Putative Sample-Associated Signals
Peaks 1–9, detected between 7.57 and 23.61 min, collectively accounted for 58.60% of the total normalized chromatographic area. These peaks generated library candidates associated with monoterpenes, long-chain aldehydes, phytol-related diterpenoids, oxygenated long-chain compounds, and fatty-acid methyl esters.
Peak 3, detected at 16.25 min, was the largest signal and represented 29.93% of the total chromatographic area. Its three highest-ranking library candidates were 12-octadecenal, 13-octadecenal, and 10-octadecenal, with similarity indices of 730, 727, and 725, respectively. Because the similarity scores differed only slightly and all three candidates represented positional isomers, the peak was conservatively annotated as an octadecenal isomer with the double-bond position unresolved.
Peak 8, at 23.38 min, contributed 8.17%. The leading candidates were trans-13-octadecenoic acid methyl ester, methyl 9-octadecenoate, and cis-13-octadecenoic acid methyl ester, with similarity indices of 903, 903, and 900, respectively. Because the two highest-ranked candidates had identical similarity indices, this peak was reported as an octadecenoic acid methyl ester with the positional and geometric isomer unresolved.
Peak 4, detected at 20.82 min, represented 7.62% and generated chemically related diterpenoid candidates. Neophytadiene was the highest-ranked candidate, with an SI of 862 and an RSI of 946, followed by 3,7,11,15-tetramethyl-2-hexadecen-1-ol and phytol acetate. The signal was therefore tentatively classified as a neophytadiene/phytol-related diterpenoid signal.
Peak 2, at 15.69 min, accounted for 4.84%. Its three reported candidates—3-hydroxydodecanoic acid, 2-azainosine, and 2-bromooctadecanal—were structurally dissimilar and produced only moderate similarity indices. The peak was consequently retained as an unresolved oxygenated component rather than being assigned to a specific compound.
Peak 7, detected at 21.71 min, represented 2.46% and produced methyl hexadecanoate as its leading candidate, with an SI of 787 and an RSI of 839. The signal was tentatively annotated as hexadecanoic acid methyl ester.
The principal signals detected before the siloxane-dominated chromatographic region are presented in Table 1.
2.3. Structurally Ambiguous Signals at 23.76–26.21 Min
Six peaks detected between 23.76 and 26.21 min repeatedly produced ethyl iso-allocholate as the highest-ranking library candidate. Together, these peaks contributed 8.10% of the normalized chromatographic area. However, their similarity indices ranged only from 682 to 744 and decreased across the chromatographic region.
The alternative candidates included long-chain ether and ester compounds, secocholestane-related structures, ergostane derivatives, modified androstane candidates, a trimethylsilyl carbohydrate derivative, and a spirostane-related structure. The lack of structural coherence among the three leading candidates indicated that the spectra did not support specific assignment to ethyl iso-allocholate or another steroidal structure. These six peaks were therefore classified collectively as structurally ambiguous late-eluting signals.
2.4. Siloxane-Dominated Late-Eluting Region
The chromatographic region from 27.17 to 39.21 min contained 15 integrated peaks and contributed 33.30% of the total normalized area. Thirteen of these peaks, collectively accounting for 15.52%, produced hexasiloxane, heptasiloxane, or octasiloxane as their highest-ranking candidates.
The spectra of these peaks repeatedly contained the same prominent ion pattern, including ions at approximately m/z 73, 207, and 281. The candidate identities and recurring fragmentation patterns indicated that these signals were more consistent with siloxane-related analytical background than with distinct plant-derived constituents. Peaks 16–25, 27, 29, and 30 were therefore classified as probable siloxane-dominated background signals.
Peak 26, detected at 36.10 min, represented 12.09% of the total area. Its highest-ranking candidate was methyl glycocholate 3TMS derivative, with an SI of 652, followed by a spirostane-related structure and octasiloxane. The experimental spectrum displayed prominent ions similar to those observed in the surrounding siloxane-dominated peaks. Consequently, Peak 26 was classified as a probable analytical-background or mixed-spectrum signal, rather than as methyl glycocholate or a confirmed spirostane compound.
Peak 28, at 38.19 min, contributed 5.69%. Methyl glycocholate 3TMS derivative was again returned as the first candidate, but its SI was only 643, while the second- and third-ranked candidates were octasiloxane and heptasiloxane. This peak was also classified as a probable siloxane-related mixed-background signal.

Table 2.
Distribution of chromatographic signals according to interpretive category.
| Interpretive category | Peak numbers | RT range (min) | Number of peaks | Combined relative area (%) |
|---|---|---|---|---|
| Putative sample-associated signals | 1–9 | 7.57–23.61 | 9 | 58.6 |
| Structurally ambiguous signals | 10–15 | 23.76–26.21 | 6 | 8.1 |
| Siloxane-dominated background | 16–25, 27, 29–30 | 27.17–39.21 | 13 | 15.52 |
| Probable mixed-background signals | 26 and 28 | 36.10 and 38.19 | 2 | 17.78 |
| Total | 1–30 | 7.57–39.21 | 30 | 100 |
2.5. Annotation Confidence
Among the 30 integrated peaks, Peak 8 provided the strongest spectral-library agreement, with an SI of 903 and an RSI of 914. However, the leading candidates represented closely related C18:1 methyl-ester isomers and did not permit assignment of a specific double-bond position or geometry.
Peak 4 also showed comparatively strong and chemically coherent matching, with neophytadiene and phytol-related structures occupying the three highest-ranked positions. Peaks 1, 3, 5–7, and 9 generated chemically plausible sample-associated candidates but remained tentative because no authentic standards or experimental retention indices were used.
In contrast, Peaks 2 and 10–15 lacked sufficient structural agreement among their leading candidates. Peaks 16–30 were dominated by siloxane-related or mixed-background spectra and were excluded from specific botanical-compound interpretation. Overall, the dataset supported tentative interpretation of a limited number of leaf-associated chemical classes rather than identification of 30 independent plant constituents.
3. Discussion
3.1. Overall Interpretation of the GC–MS Profile
The GC–MS dataset obtained from the powdered leaf preparation recorded as Clerodendrum squamatum Vahl contained 30 integrated peaks. However, the distribution of these signals indicated that the chromatogram should not be interpreted as evidence for 30 independently identified plant constituents. Peaks 1–9, eluting between 7.57 and 23.61 min, represented 58.60% of the total normalized area and generated candidates that were broadly compatible with volatile terpenes, long-chain oxygenated compounds, and fatty-acid methyl esters. Peaks 10–15 accounted for 8.10% but produced structurally inconsistent candidate lists. The remaining peaks represented 33.30% of the chromatographic area and were dominated by siloxane-related or mixed-background spectra.
This distribution demonstrates the importance of separating chromatographic detection from compound identification. Automated library searching produced a candidate name for every integrated signal, but the reliability of those names varied considerably. The most interpretable peaks were those for which the three leading candidates belonged to the same chemical family. In contrast, annotations were less reliable when the leading matches represented unrelated structures or when the experimental spectrum closely resembled the spectra of neighboring siloxane peaks.
Recent studies have shown that Clerodendrum leaves can contain diverse volatile, semivolatile, and nonvolatile constituents, including terpenoid- and fatty-acid-related compounds [1]. Nevertheless, the detected profile depends strongly on the extraction procedure and analytical platform. Comparative work on Clerodendrum paniculatum demonstrated that GC–MS and LC–MS analyses of differently prepared fractions produced substantially different chemical profiles [6]. Accordingly, the present chromatogram should be regarded as a method-specific fingerprint of the submitted leaf preparation rather than as a complete phytochemical profile of C. squamatum.
3.2. Interpretation of the Predominant Octadecenal-Related Signal
The most abundant chromatographic peak occurred at 16.25 min and contributed 29.93% of the total normalized area. Automated searching returned 12-octadecenal, 13-octadecenal, and 10-octadecenal as the three highest-ranking candidates, with similarity indices of 730, 727, and 725, respectively.
The small differences among these scores do not support localization of the carbon–carbon double bond. The candidates share the same molecular formula and differ only in the proposed position of unsaturation, making their electron-ionization spectra potentially similar. The signal was therefore more appropriately reported as an octadecenal isomer with the double-bond position unresolved.
Although the peak represented almost one-third of the integrated chromatographic area, its abundance does not increase the certainty of structural identification. A large peak can still generate a misleading library match when the reference library lacks the actual compound, when co-elution produces a composite spectrum, or when positional isomers have similar fragmentation patterns. The moderate similarity index of 730 further supports the use of a tentative group-level annotation.
Confirmation would require examination of the original extracted-ion chromatograms, experimental retention-index determination, spectral deconvolution, and analysis of authentic long-chain unsaturated aldehyde standards. Without these supporting data, the 29.93% value should be interpreted as the relative contribution of a chromatographic signal rather than as the concentration of 12-octadecenal in the leaf material.
3.3. Neophytadiene- and Phytol-Related Diterpenoid Signal
Peak 4, detected at 20.82 min, accounted for 7.62% of the normalized chromatographic area and produced the most chemically coherent candidate set among the major non-FAME signals. The highest-ranking match was neophytadiene, with an SI of 862 and an RSI of 946. The second and third candidates were 3,7,11,15-tetramethyl-2-hexadecen-1-ol and phytol acetate.
All three candidates are related to long-chain isoprenoid or phytol-derived chemistry. This structural coherence provides stronger support for a diterpenoid-related interpretation than would be obtained from the highest-ranking candidate alone. Nevertheless, distinguishing neophytadiene from closely related phytol-derived compounds requires retention evidence and comparison with reference materials. The peak was therefore designated as a neophytadiene/phytol-related diterpenoid signal, with neophytadiene retained as the leading tentative candidate.
The occurrence of a diterpenoid-related signal is botanically plausible. Members of Clerodendrum are recognized sources of structurally diverse diterpenoids, although much of the genus-level literature concerns cyclic abietane-, pimarane-, and clerodane-type structures rather than phytol-derived compounds [1].
A useful regional comparison is provided by Paat and Sintaro, who tentatively annotated phytol and neophytadiene in a selected lipophilic fraction of Syzygium polyanthum leaves [16]. Their assignments were supported not only by library matching but also by experimental retention indices, diagnostic ions, blank analysis, and triplicate injections. The present result is therefore chemically plausible, but its identification confidence is lower because comparable confirmatory evidence was unavailable.
3.4. Fatty-Acid Methyl Ester-Related Signals
Peaks 7 and 8 generated candidates associated with fatty-acid methyl esters. Peak 7, representing 2.46% of the total area, was tentatively associated with methyl hexadecanoate. Its leading SI of 787 was moderate, and the alternative candidates were branched-chain C17 methyl esters. The peak can therefore be regarded as a long-chain saturated fatty-acid methyl ester signal, with methyl hexadecanoate as the principal tentative candidate.
Peak 8 contributed 8.17% and showed the strongest spectral agreement in the sample-associated region. However, trans-13-octadecenoic acid methyl ester and methyl 9-cis-octadecenoate produced identical SI values of 903, while cis-13-octadecenoic acid methyl ester produced an SI of 900.
These results support assignment to the molecular class of monounsaturated C18 fatty-acid methyl esters but do not resolve the double-bond position or geometry. The conservative name octadecenoic acid methyl ester, positional and geometric isomer unresolved is therefore preferable to methyl oleate or methyl vaccenate.
Fatty-acid methyl esters have also been reported in GC–MS profiles of other Clerodendrum leaf extracts. A recent study of C. infortunatum, for example, reported methyl hexadecanoate and methyl 9-octadecenoate among the compounds detected in sequential solvent extracts [9]. This comparison supports the general plausibility of long-chain FAME-related signals in Clerodendrum preparations, but it does not confirm that the same compounds occurred in the present sample because the species and extraction workflows differed.
The available records indicate that deliberate derivatization or silylation was not performed, while the complete sample-preparation procedure and solvent identity were unavailable. Consequently, the origin of the methyl-ester-related signals cannot be established. They may represent naturally occurring minor esters, products introduced or formed during handling, or library-supported alternatives for related co-eluting lipids. They should not be interpreted as the result of a standardized FAME analysis or used to calculate fatty-acid composition.
3.5. Minor Monoterpene- and Long-Chain Oxygenated Signals
Peak 1 was a minor signal, contributing 0.58% of the normalized area. Its three leading candidates—α-pinene, 4-carene, and another bicyclic C10H16 monoterpene—were structurally related. This consistency supports its classification as a bicyclic monoterpene-related signal, although the relatively low SI of 711 does not support definitive assignment as α-pinene.
Volatile terpenoid-related compounds have been reported in leaf fractions of other Clerodendrum species, including C. infortunatum [4]. The present signal is therefore plausible at the chemical-class level, but the low relative abundance and moderate library agreement require cautious reporting.
Peaks 5 and 6 were both associated with 2-(9-octadecenyloxy) ethanol as their leading candidate, but their secondary candidates included unsaturated glycerol esters and phytol-related compounds. The repeated candidate name at two close retention times may indicate related long-chain oxygenated substances, partial co-elution, or automatic integration of adjacent portions of a broader chromatographic feature. These peaks should therefore remain classified as unsaturated long-chain oxygenated signals rather than being assigned to a specific ether.
Peak 9 was tentatively associated with a branched long-chain fatty-acid methyl ester, but its candidate list included two methyl-branched heptadecanoates and a structurally complex cyclopropyl ester. The peak was consequently retained as an unresolved branched or long-chain ester-related component.
3.6. Structurally Ambiguous Signals Assigned to Ethyl Iso-Allocholate
Six peaks between 23.76 and 26.21 min repeatedly generated ethyl iso-allocholate as their first-ranked candidate. Together, these signals represented 8.10% of the total normalized area. Despite the repeated candidate name, several features argued against reporting ethyl iso-allocholate as a confirmed or even strongly supported leaf constituent.
First, the similarity indices were only 682–744. Second, the alternative candidates were structurally heterogeneous and included long-chain ethers, sterol-related compounds, modified androstane derivatives, a trimethylsilylated carbohydrate derivative, and a spirostane candidate.
Third, the same candidate appearing across six distinct retention times does not necessarily indicate the presence of the same compound in six peaks. It may reflect related mixed spectra, limited spectral-library coverage, automatic integration of an unresolved chromatographic region, or systematic matching to the closest available reference spectrum.
Accordingly, these peaks should not be used to claim that the analyzed leaves contain ethyl iso-allocholate, bile-acid-like compounds, or specific steroidal constituents. The most defensible interpretation is that Peaks 10–15 represent structurally ambiguous late-eluting signals. Further identification would require raw spectra, improved chromatographic separation, blank comparison, experimental retention indices, and authentic reference compounds.
3.7. Reassessment of the Siloxane-Dominated Region
The late-eluting region from 27.17 to 39.21 min represented a major component of the chromatogram, accounting for 33.30% of the total normalized area. Most peaks in this region produced hexasiloxane, heptasiloxane, or octasiloxane as their leading candidates. Their spectra also repeatedly contained ions at or near m/z 73, 207, and 281.
The combination of late elution, a rising chromatographic background, recurrent methylsiloxane candidate names, and similar fragment-ion patterns strongly supports classification of these signals as probable analytical background. Siloxane-related interference can originate from GC–MS accessories, injection-port septa, silicone-containing laboratory materials, column-related processes, and the broader instrumental environment [20].
Peak 26 was particularly important because it represented 12.09% of the normalized area and was initially assigned to methyl glycocholate 3TMS derivative. The similarity index was only 652, while the second and third candidates were a spirostane-related compound and octasiloxane. Its spectrum was dominated by ions resembling those of the surrounding siloxane signals.
Peak 28 showed the same interpretive problem. Methyl glycocholate 3TMS derivative was the first candidate, but octasiloxane and heptasiloxane were ranked immediately afterward, and the spectrum was dominated by the recurring late-region ion pattern.
Because the available records state that no silylation was intentionally performed, specific assignments to 3TMS derivatives are particularly weak. Peaks 26 and 28 were therefore more appropriately categorized as probable siloxane-dominated mixed-background signals.
A blank chromatogram was unavailable, so the exact source of the late signals could not be assigned to a particular septum, vial, column, or instrument component. The term probable analytical background is therefore preferable to a definitive designation such as column bleed.
3.8. Confidence of Library-Supported Annotation
The present dataset illustrates why library-match scores must be interpreted together with candidate coherence and chromatographic context. Peak 8 had the highest SI among the putative sample-associated signals, but its specific isomer remained unresolved. Peak 4 had a slightly lower SI, although the structural relationship among its three leading candidates strengthened the broader diterpenoid-related annotation. In contrast, Peak 2 produced unrelated candidates despite representing 4.84% of the chromatogram and was therefore left unresolved.
Current GC–MS identification research emphasizes that spectral similarity alone frequently requires manual verification. Incorporating retention-index evidence can improve candidate evaluation, but the assumptions and acceptable error limits used in retention scoring also require careful consideration [17].
Paat and Sintaro reported a more comprehensive confidence-based workflow that combined library matching with diagnostic ions, experimental retention indices, solvent-blank assessment, and repeat injections [16]. Their results demonstrate how supporting chromatographic and quality-control evidence can substantially strengthen a preliminary plant fingerprint while still retaining tentative identification language.
Because experimental retention indices and authentic standards were unavailable in the present investigation, none of the candidate names should be described as definitively identified. The most appropriate reporting categories are:
- tentatively annotated at the candidate or chemical-class level;
- positional or geometric isomer unresolved;
- structurally ambiguous; and
- probable analytical background.
3.9. Relationship to Previous Clerodendrum Studies
The general occurrence of terpene- and fatty-acid-related signals is consistent with the broad chemical diversity reported for Clerodendrum leaves. Studies of C. infortunatum, C. paniculatum, C. thomsoniae, and C. speciosum have demonstrated that different leaf preparations produce different GC–MS-detectable profiles [4,6,7,8,9].
Direct compound-by-compound comparison is not appropriate because those studies used documented solvent-extraction, hydrodistillation, fractionation, or combined GC–MS and LC–MS procedures. The extraction solvent and preparation procedure used for the present archived sample were not available. Differences between studies may therefore reflect extraction selectivity, concentration, derivatization status, instrument conditions, integration methods, plant species, plant age, geographic origin, or post-harvest treatment rather than true taxonomic differences.
The present study nevertheless contributes a useful analytical observation: only a restricted subset of the 30 integrated peaks had sufficient candidate coherence to support tentative botanical interpretation. Explicitly separating these peaks from probable siloxane background provides a more credible chemical fingerprint than accepting every first-ranked library result as a leaf constituent.
3.10. Analytical Scope and Study Limitations
The available dataset originated from one GC–MS injection. Information concerning the extraction solvent, sample-to-solvent ratio, extraction time, chromatographic column, temperature program, carrier-gas conditions, ionization energy, biological replication, preparation replication, and blank analyses was not available.
These limitations prevent assessment of analytical repeatability, biological variability, extraction efficiency, and method reproducibility. The normalized peak-area values cannot be interpreted as absolute concentrations, mass percentages, or quantitative chemical composition. They indicate only the relative contributions of integrated signals in the archived chromatogram.
The absence of documented botanical authentication and a voucher specimen also limits taxonomic certainty. The plant identity should therefore be presented as the name recorded in the available sample documentation rather than as independently verified identification.
Future work should begin with authenticated material collected from multiple individual plants. Independent biological samples should be dried, extracted, and analyzed separately. The analytical sequence should include solvent and preparation blanks, repeat injections, an n-alkane retention-index series, and authentic standards for the major candidate classes.
Targeted evaluation should prioritize the unresolved octadecenal-related peak, the neophytadiene/phytol-related signal, and the C16 and C18 fatty-acid methyl ester-related peaks. A method optimized for volatile or lipophilic leaf constituents would improve chromatographic interpretation, while LC–MS would be more appropriate for nonvolatile phenolic glycosides and other polar constituents known to occur in the genus.
Overall, the present data support a preliminary and artifact-aware GC–MS fingerprint rather than a definitive inventory of leaf metabolites. Its main analytical contribution is the identification of a limited group of plausible sample-associated signals and the recognition that approximately one-third of the total chromatographic area was probably attributable to siloxane-dominated analytical background.
4. Materials and Methods
4.1. Study Design and Data Source
This study was designed as a retrospective, descriptive evaluation of an archived gas chromatography–mass spectrometry (GC–MS) dataset. The available analytical records consisted of a total ion chromatogram, an integrated peak table, and a library-search report containing the three highest-ranking spectral candidates for each integrated peak. No additional experimental analyses were performed for the present study.
The archived dataset originated from a single GC–MS injection conducted at the Laboratorium Penelitian dan Pengujian Terpadu, Universitas Gadjah Mada, Indonesia. Raw vendor files, replicate injections, preparation blanks, solvent blanks, calibration data, and authentic-standard chromatograms were unavailable. Consequently, the study was treated as preliminary chemical fingerprinting rather than confirmatory compound identification or quantitative compositional analysis.
4.2. Plant Material
The material was recorded in the laboratory documentation as powdered leaves of sesewanua, with the botanical name Clerodendrum squamatum Vahl. The analyzed plant part was therefore described as powdered leaf material.
Information concerning the collection location, geographical coordinates, collection date, number of source plants, maturity of the leaves, environmental conditions, collector identity, and collection permit was not available. Botanical authentication by a taxonomist, a voucher-specimen number, and the location of a deposited voucher specimen were also unavailable. Accordingly, the botanical name used in this manuscript represents the identity recorded in the laboratory documentation and was not independently verified during the present study.
4.3. Preparation and Storage of the Powdered Leaves
The submitted material was described as leaf powder. However, the available records did not document whether the leaves were washed before drying, the drying method, drying temperature, duration of drying, moisture content, or criteria used to determine completion of drying.
Information concerning the grinding equipment, particle size, storage container, storage temperature, and duration of storage before GC–MS analysis was also unavailable. These parameters were therefore not reconstructed or estimated.
4.4. Preparation of the GC–MS Sample
The complete sample-preparation procedure before injection was not included in the archived analytical report. The mass of powdered leaves, extraction solvent, solvent grade, sample-to-solvent ratio, extraction method, extraction time, extraction temperature, number of extraction cycles, centrifugation conditions, filtration procedure, evaporation step, and final concentration of the injected preparation were unavailable.
The chromatographic metadata contained a field designated “Sample Weight: 1.0000”. Because the unit and purpose of this value were not specified, it was not interpreted as the actual mass of powdered leaves used for extraction.
No intentional derivatization or silylation procedure was documented. Therefore, library candidates described as trimethylsilyl derivatives were not considered evidence that such derivatives had been deliberately produced during sample preparation.
4.5. GC–MS Analysis
GC–MS analysis was performed using a Thermo Fisher Scientific ISQ instrument identified in the archived report as ISQD1702517_1. Instrument control and data processing were performed using Chromeleon software, version 7.2.10.24543.
The injection was conducted on 24 March 2023 at 17:25, using a recorded injection volume of 1.00 µL. The instrument method was designated “Screening Daun Zat Bioaktif anti Mikroba”, and the processing method was designated “Screening”. The archived library-search summary reported a run time of 38.99 min.
The injection type was recorded as “Unknown”. Information concerning the GC column, stationary phase, column dimensions, carrier gas, carrier-gas flow rate, injection-port temperature, split or splitless conditions, oven-temperature program, transfer-line temperature, ion-source temperature, ionization mode, electron energy, scan mode, mass range, solvent delay, and acquisition rate was not available. These conditions were therefore not inferred from unrelated instrument methods or from other samples analyzed by the same laboratory.
Table 3.
Available GC–MS acquisition and processing metadata.
| Parameter | Recorded information |
|---|---|
| Analytical laboratory | Laboratorium Penelitian dan Pengujian Terpadu, Universitas Gadjah Mada |
| Instrument | Thermo Fisher Scientific ISQ |
| Instrument identification | ISQD1702517_1 |
| Software | Chromeleon 7.2.10.24543 |
| Injection date and time | 24 March 2023, 17:25 |
| Injection volume | 1.00 µL |
| Injection type | Unknown |
| Instrument method | Screening Daun Zat Bioaktif anti Mikroba |
| Processing method | Screening |
| Reported run time | 38.99 min |
| GC column and dimensions | Not available |
| Carrier gas and flow rate | Not available |
| Oven-temperature program | Not available |
| Ionization conditions | Not available |
| Scan range and acquisition rate | Not available |
4.6. Chromatographic Peak Integration
Chromatographic processing was performed using the archived Chromeleon processing method designated “Screening”. A total of 30 peaks were integrated over the retention-time interval from 7.57 to 39.21 min. The total integrated chromatographic area was 23,281,445.578 counts·min.
The archived report did not provide the integration threshold, minimum peak area, peak-width settings, baseline model, smoothing parameters, or criteria used to separate adjacent chromatographic signals. Because the raw chromatographic file was unavailable, the original integration could not be repeated or independently optimized.
4.7. Mass-Spectral Library Searching
For each integrated peak, the processing software reported the three highest-ranking library candidates together with a similarity index (SI) and reverse similarity index (RSI). The library was recorded as mainlib and was identified in the available project documentation as an NIST-associated library. However, its exact release year and version were unavailable.
The highest-ranking library hit was not automatically accepted as a confirmed compound identity. Candidate names were interpreted according to:
- the SI and RSI values;
- structural similarity among the three highest-ranking candidates;
- whether the candidates represented positional or geometric isomers;
- consistency with the retention region;
- recurrence of similar spectra in neighboring peaks; and
- the presence of siloxane-related candidate names and fragmentation patterns.
No minimum SI or RSI acceptance threshold had been defined in the archived processing method. Accordingly, spectral matches were evaluated comparatively and reported using conservative identification language.
4.8. Confidence Categories for Peak Annotation
The integrated signals were assigned to four interpretive categories.
Tentatively annotated sample-associated signals were peaks for which the leading library candidates were chemically related and broadly plausible for plant-derived volatile or semivolatile material.
Isomer-unresolved signals were peaks for which the leading candidates represented positional or geometric isomers with similar spectral scores. In these cases, the compound was reported at the broader molecular-class level without assigning a specific double-bond position or configuration.
Structurally ambiguous signals were peaks for which the leading candidates belonged to substantially different chemical classes or had only moderate-to-low spectral similarity.
Probable analytical-background signals were peaks dominated by siloxane-related library candidates, recurring late-eluting spectral patterns, or mixed spectra closely resembling neighboring siloxane peaks.
This classification was applied retrospectively to the exported peak table and library-search report. It does not represent formal confirmation according to an internationally standardized metabolite-identification level.
4.9. Evaluation of Siloxane-Related Background
Peaks eluting from approximately 27.17 to 39.21 min were specifically evaluated for analytical-background characteristics. Most of these peaks generated hexasiloxane, heptasiloxane, or octasiloxane as their principal library candidates. Their exported spectra repeatedly showed prominent ions around m/z 73, 207, and 281.
Peaks 16–25, 27, 29, and 30 were therefore categorized as probable siloxane-dominated background. Peaks 26 and 28 were initially assigned by the library to methyl glycocholate 3TMS derivatives, but their relatively low similarity indices, siloxane-related alternative candidates, and spectral resemblance to the surrounding late-eluting peaks supported their classification as probable mixed-background signals.
Because no solvent or preparation blank was available, the exact origin of the siloxane-related signals could not be determined. They were therefore described as probable analytical background rather than specifically attributed to column bleed, septum contamination, vial components, or another individual source.
4.10. Calculation of Relative Chromatographic Areas
The relative area of each integrated peak was taken directly from the archived chromatographic report. Relative chromatographic areas were calculated by the original processing software as the individual peak area divided by the total integrated area and expressed as a percentage.
For descriptive grouping, combined relative areas were calculated by summing the reported percentages of peaks assigned to the same interpretive category. The categories comprised putative sample-associated signals, structurally ambiguous signals, siloxane-dominated background signals, and probable mixed-background signals.
The relative-area percentages were used only to describe the contribution of each signal to the archived chromatogram. They were not interpreted as absolute concentrations, mass fractions, extraction yields, or quantitative concentrations in the original leaves because no calibration standards or internal standard were used.
4.11. Replication and Quality-Control Limitations
The available records documented only one GC–MS injection. Biological replication, independent extraction replication, and repeat instrumental injections were not available. No internal standard, tuning report, calibration curve, recovery assessment, or precision test was documented.
Solvent blanks, vial blanks, and full preparation blanks were also unavailable. Therefore, reproducibility, analytical precision, extraction variability, and the exact contribution of instrumental background could not be statistically assessed.
The reported results are consequently descriptive and exploratory. No inferential statistical analysis was performed.
4.12. Ethical Considerations
The study involved only archived analytical data obtained from plant-derived material. It did not involve human participants, human biological samples, experimental animals, or personally identifiable information. Institutional review board approval and informed consent were therefore not applicable.
5. Conclusions
This study established a preliminary and artifact-aware GC–MS fingerprint of powdered leaves recorded as Clerodendrum squamatum Vahl. Thirty integrated chromatographic peaks were detected between 7.57 and 39.21 min. However, only a limited proportion of these signals provided chemically coherent library matches that were suitable for tentative botanical interpretation. The chromatographic profile was dominated by a peak at 16.25 min, contributing 29.93% of the total normalized area, which was conservatively annotated as an octadecenal isomer with the double-bond position unresolved. Other plausible sample-associated signals included a neophytadiene/phytol-related diterpenoid signal, an unresolved octadecenoic acid methyl ester, a long-chain saturated fatty-acid methyl ester signal, and a minor bicyclic monoterpene-related component. Six peaks between 23.76 and 26.21 min produced structurally inconsistent candidate lists and were therefore retained as ambiguous rather than assigned to specific steroidal compounds. The late-eluting region from 27.17 to 39.21 min represented 33.30% of the total chromatographic area and was dominated by siloxane-related or mixed-background spectra. These signals were classified as probable analytical background and excluded from specific botanical interpretation. All compound assignments remain tentative because they were based on mass-spectral library matching without authentic standards or experimental retention indices. The normalized peak areas represent relative chromatographic signal contributions and should not be interpreted as absolute concentrations or quantitative leaf composition. Overall, the study provides an initial analytical baseline for the recorded sesewanua leaf material and demonstrates the importance of distinguishing plausible plant-associated constituents from structurally ambiguous and siloxane-dominated background signals in preliminary GC–MS profiling.
Supplementary Materials
The following supporting information can be downloaded at the website of this paper posted on Preprints.org.
Author Contributions
Conceptualization, F.J.P. and S.S.; methodology, F.J.P.; formal analysis, F.J.P. and S.S.; investigation, F.J.P.; resources, F.J.P.; data curation, F.J.P. and S.S.; writing—original draft preparation, F.J.P., S.S., FBP, and FJTP; writing—review and editing, F.J.P, FBP, FJTP and S.S.; visualization, F.J.P., FJTP, FBP and S.S.; supervision, S.S.; project administration, F.J.P. All authors have read and agreed to the published version of the manuscript.
Funding
This research received no external funding.
Institutional Review Board Statement
Not applicable. This study involved only archived analytical data obtained from plant-derived material and did not involve humans or experimental animals.
Informed Consent Statement
Not applicable.
Data Availability Statement
The processed data supporting the findings of this study are available within the article and its Supplementary Materials. These materials include the total ion chromatogram, integrated peak table, and mass-spectral library-search results. Raw vendor-format GC–MS data, individual raw mass spectra, blank chromatograms, and replicate-analysis files were not available for the present retrospective study. The available processed analytical documents may be obtained from the corresponding author upon reasonable request.
Acknowledgments
The authors acknowledge the Laboratorium Penelitian dan Pengujian Terpadu, Universitas Gadjah Mada, Indonesia, for performing the GC–MS analysis and providing the processed chromatographic and mass-spectral library-search reports.
Conflicts of Interest
The authors declare no conflicts of interest.
Abbreviations
The following abbreviations are used in this manuscript:
| C18:1 | Monounsaturated 18-carbon compound |
| EI | Electron ionization |
| FAME | Fatty-acid methyl ester |
| GC–MS | Gas chromatography–mass spectrometry |
| m/z | Mass-to-charge ratio |
| NIST | National Institute of Standards and Technology |
| RSI | Reverse similarity index |
| RT | Retention time |
| SI | Similarity index |
| TIC | Total ion chromatogram |
| TMS | Trimethylsilyl |
References
- Kuźma, Ł.; Gomulski, J. Biologically Active Diterpenoids in the Clerodendrum Genus—A Review. Int. J. Mol. Sci. 2022, 23. [Google Scholar] [CrossRef] [PubMed]
- Martínez-Casares, R.M.; Hernández-Vázquez, L.; Mandujano, A.; Sánchez-Pérez, L.; Pérez-Gutiérrez, S.; Pérez-Ramos, J. Anti-Inflammatory and Cytotoxic Activities of Clerodane-Type Diterpenes. Molecules 2023, 28. [Google Scholar] [CrossRef] [PubMed]
- Li, L.; Tang, Z.; Xiao, S.; Dai, X.; Wang, Y.; Wei, X. Clerodendrum Trichotomum Thunb.: A Review on Phytochemical Composition and Pharmacological Activities. Front. Pharmacol. 2024, 15. [Google Scholar] [CrossRef] [PubMed]
- Gera, N.B.; Darshani, P.; Thasmeer, P.P.; Pragadheesh, V.S. Chemical Composition of a Volatile Fraction from the Leaves of Clerodendrum Infortunatum L. Nat. Prod. Res. 2022, 36, 853–856. [Google Scholar] [CrossRef] [PubMed]
- Kumar Deb, P.; Shilkar, D.; Sarkar, B. UHPLC-ESI-QTOF-MS/MS Based Identification, Quantification, and Assessment of in Silico Molecular Interactions of Major Phytochemicals from Bioactive Fractions of Clerodendrum Glandulosum Lindl. Leaves. Chem. Biodivers. 2022, 19. [Google Scholar] [CrossRef] [PubMed]
- Hegde, N.P.; Hungund, B.S. Phytochemical Profiling of Clerodendrum Paniculatum Leaf Extracts: GC-MS, LC-MS Analysis and Comparative Evaluation of Antimicrobial, Antioxidant & Cytotoxic Effects. Nat. Prod. Res. 2023, 37, 2957–2964. [Google Scholar] [CrossRef] [PubMed]
- Bhattacharyya, S.; Samanta, S.; Hore, M.; Barai, S.; Dash, S.K.; Roy, S. Phytochemical Compositions, Antioxidant, Anticholinesterase, and Antibacterial Properties of Clerodendrum Thomsoniae Balf.f. Leaves: In Vitro and in Silico Analyses. Pharmacol. Res.-Nat. Prod. 2024, 5. [Google Scholar] [CrossRef]
- Elhady, S.S.; Abou El-Ezz, R.F.; Zengin, G.; Malatani, R.T.; Ashour, M.L.; Youssef, F.S. Phytochemical Profiling of Clerodendrum Speciosum Leaves and Evaluation of Their Antioxidant, Antihyperglycemic and Antiarthritic Activities in Vitro. Futur. J. Pharm. Sci. 2025, 11. [Google Scholar] [CrossRef]
- Khatun, M.S.; Mia, N.; Al Bashera, M.; Murad, M.A.; Zahan, R.; Parvin, S.; Akhtar, M.A. Evaluation of Anti-Inflammatory Potential and GC-MS Profiling of Leaf Extracts from Clerodendrum Infortunatum L. J. Ethnopharmacol. 2024, 320. [Google Scholar] [CrossRef] [PubMed]
- Khound, P.; Deb, P.K.; Bhattacharjee, S.; Medina, K.D.; Sarma, P.P.; Sarkar, B.; Devi, R. Phenolic Enriched Fraction of Clerodendrum Glandulosum Lindl. Leaf Extract Ameliorates Hyperglycemia and Oxidative Stress in Streptozotocin-Nicotinamide Induced Diabetic Rats. J. Ayurveda Integr. Med. 2024, 15. [Google Scholar] [CrossRef] [PubMed]
- Wu, Y.; Wu, D.; Li, H.; Huang, H.; Hu, Y.; Zhang, Q.; Li, J.; Xie, C.; Yang, C. Cyclohexylethanoid Derivative and Rearranged Abietane Diterpenoids with Anti-Inflammatory Activities from Clerodendrum Bungei and C. Inerme. Arab. J. Chem. 2024, 17. [Google Scholar] [CrossRef]
- Yang, Y.; Zhang, Q.; Wang, J.; Hu, H.; Wang, M.; Wang, Z.; Han, Z.; Xiao, Y.; Yang, L. Bioactive Constituents from Clerodendrum Trichotomum and Their α-Glucosidase Inhibitory and PPAR-γ Agonist Activities. Fitoterapia 2024, 179. [Google Scholar] [CrossRef] [PubMed]
- Paat, F.J.; Wantasen, S.; Toding, M.M.; Pakasi, S.E.; Tumbelaka, S.; Kaligis, J.B.; Turang, D.A.S.; Porong, J.V.; Linggi, R.J. GC-MS Method for Identification of Organic Chemical Compounds Nutmeg Flesh of North Minahasa Local Varieties. IOP Conf. Ser. Earth Environ. Sci. 2023, 1241. [Google Scholar] [CrossRef]
- Paat, F.J.; Wahyuni, H.; Sapii, N.O.; Tumbelaka, S.; Watung, J.F.; Wantasen, S. Analysis of Biopesticide Active Compounds in Barringtonia Asiatica L. Kurz Using the GC-MS Method. IOP Conf. Ser. Earth Environ. Sci. 2024, 1302, 12009. [Google Scholar] [CrossRef]
- Paat, F.J.; Kaunang, T.M.; Hatibie, M.J.; Faruk, M.; Oley, M.C. Spirost: An Anti-Inflammatory Compound Isolated from Cocos Nucifera L. Solid Endosperm. J. Agroekoteknologi Ter. 2025, 110–119. [Google Scholar] [CrossRef]
- Paat, F.J.; Sintaro, S. Solvent-Dependent GC–MS Fingerprinting of Lipophilic Constituents in Syzygium Polyanthum Leaves: A Baseline Study for Future Greener Extraction Optimization. Molecules 2026, 31. [Google Scholar] [CrossRef] [PubMed]
- Degnan, D.J.; Bramer, L.M.; Flores, J.E.; Paurus, V.L.; Corilo, Y.E.; Clendinen, C.S. Evaluating Retention Index Score Assumptions to Refine GC-MS Metabolite Identification. Anal. Chem. 2023, 95, 7536–7544. [Google Scholar] [CrossRef] [PubMed]
- Flores, J.E.; Bramer, L.M.; Degnan, D.J.; Paurus, V.L.; Corilo, Y.E.; Clendinen, C.S. Gaussian Mixture Modeling Extensions for Improved False Discovery Rate Estimation in GC-MS Metabolomics. J. Am. Soc. Mass Spectrom. 2023, 34, 1096–1104. [Google Scholar] [CrossRef] [PubMed]
- Wakoli, J.; Anjum, A.; Sajed, T.; Oler, E.; Wang, F.; Gautam, V.; Levatte, M.; Wishart, D.S. GCMS-ID: A Webserver for Identifying Compounds from Gas Chromatography Mass Spectrometry Experiments. Nucleic Acids Res. 2024, 52, W381–W389. [Google Scholar] [CrossRef] [PubMed]
- Huang, G.; Li, Y.; Liu, J.; Jiang, D.; Jiang, K. Interference of the Gas Chromatography- Mass Spectrometry Instrumental Background on the Determination of Trace Cyclic Volatile Methylsiloxanes and Exclusion of It by Delayed Injection. J. Chromatogr. A 2024, 1726. [Google Scholar] [CrossRef] [PubMed]
Table 1.
Principal GC–MS signals detected before the siloxane-dominated late-eluting region.
| Peak | RT (min) | Relative area (%) | Highest-ranking library candidate | SI | RSI | Conservative annotation |
|---|---|---|---|---|---|---|
| 1 | 7.57 | 0.58 | α-Pinene | 711 | 844 | Bicyclic monoterpene-related signal |
| 2 | 15.69 | 4.84 | 3-Hydroxydodecanoic acid | 706 | 737 | Unresolved oxygenated component |
| 3 | 16.25 | 29.93 | 12-Octadecenal | 730 | 735 | Octadecenal isomer; double-bond position unresolved |
| 4 | 20.82 | 7.62 | Neophytadiene | 862 | 946 | Neophytadiene/phytol-related diterpenoid signal |
| 5 | 21.07 | 1.14 | 2-(9-Octadecenyloxy)ethanol | 756 | 777 | Unsaturated long-chain oxygenated signal |
| 6 | 21.26 | 2.02 | 2-(9-Octadecenyloxy)ethanol | 782 | 803 | Unsaturated long-chain oxygenated signal |
| 7 | 21.71 | 2.46 | Hexadecanoic acid methyl ester | 787 | 839 | Methyl hexadecanoate, tentative |
| 8 | 23.38 | 8.17 | trans-13-Octadecenoic acid methyl ester | 903 | 914 | Octadecenoic acid methyl ester; isomer unresolved |
| 9 | 23.61 | 1.84 | Heptadecanoic acid, 16-methyl-, methyl ester | 738 | 821 | Branched long-chain fatty-acid methyl ester, unresolved |
| 10 | 23.76 | 3.32 | Ethyl iso-allocholate | 744 | 750 | Structurally ambiguous late-eluting signal |
| 11 | 24.23 | 0.64 | Ethyl iso-allocholate | 735 | 750 | Structurally ambiguous late-eluting signal |
| 12 | 25.36 | 0.66 | Ethyl iso-allocholate | 702 | 721 | Structurally ambiguous late-eluting signal |
| 13 | 25.78 | 2.91 | Ethyl iso-allocholate | 690 | 706 | Structurally ambiguous late-eluting signal |
| 14 | 25.98 | 0.06 | Ethyl iso-allocholate | 692 | 712 | Structurally ambiguous late-eluting signal |
| 15 | 26.21 | 0.51 | Ethyl iso-allocholate | 682 | 702 | Structurally ambiguous late-eluting signal |
RT, retention time; SI, similarity index; RSI, reverse similarity index. Compound names are tentative library-supported candidates rather than confirmed structural identifications. Relative areas represent chromatographic signal contributions and not absolute concentrations.
Disclaimer/Publisher’s Note: The statements, opinions and data contained in all publications are solely those of the individual author(s) and contributor(s) and not of MDPI and/or the editor(s). MDPI and/or the editor(s) disclaim responsibility for any injury to people or property resulting from any ideas, methods, instructions or products referred to in the content. |
© 2026 by the authors. Licensee MDPI, Basel, Switzerland. This article is an open access article distributed under the terms and conditions of the Creative Commons Attribution (CC BY) license (http://creativecommons.org/licenses/by/4.0/).
Copyright: This open access article is published under a Creative Commons CC BY 4.0 license, which permit the free download, distribution, and reuse, provided that the author and preprint are cited in any reuse.