

Submitted:
05 August 2026
Posted:
05 August 2026
You are already at the latest version
Abstract
Emotion analysis, primarily employed in social media text analysis, holds significant potential for unveiling patterns within large-scale scientific corpora. To explore this, I analyzed a corpus comprising 7.36 million sentences sourced from leading hydrological journals, including Water Resources Research and Journal of Hydrology, spanning years from 2010 to 2025. Utilizing emotion analysis coupled with unsupervised clustering, this analysis aimed to automatically track the prevailing progresses and limitations within the hydrological community across years. For instance, a progression in hydrological modeling from simple to hybrid models, a shift from single to integrated observation systems, and the increasing application of machine learning techniques were observed. The data extracted from the negative emotion, however, suggests a more worrying reality. Despite technological advancements, concerns regarding extreme hydrological event predictions, water resource monitoring, and simulation accuracy persist. Ultimately, while hydrological technology has advanced, the water crisis continues to worsen. Addressing this crisis necessitates breaking the negative feedback loop between human activities and water resources. Emotion analysis in hydrology allows us to examine the complex water-human relationship from a historical and broad perspective. It also serves to identify the tangible contribution the field has made toward restoring this relationship and informs prospective future efforts.
Keywords:
peer-reviewed journals
; natural language processing
; emotion analysis
; unsupervised clustering
; water-human relationship
Key points:
- A substantial sentence-level corpus extracted from outstanding hydrological publications was subjected to emotion analysis
- The language model-driven analysis provides a clear representation of advancements and challenges in the field of hydrology across years
- Alleviating the water crisis may depend on disrupting the negative feedback loop between human activities and water resources
Introduction
Water is an essential resource for human societies and plays a critical role in maintaining healthy ecosystems (Huggins et al., 2022) and supporting sustainable development (Sheffield et al., 2018). However, since 1960, the global per capita availability of freshwater has decreased by 60% (Institute for Economics & Peace, 2020). Concurrently, increasing global population and industrialization have driven a six-fold increase in global water consumption over the past century, with an annual growth rate of approximately 1% (WWAP/UN-Water, 2018). The water crisis arises from the spatiotemporal disparities between freshwater demand and availability (Mekonnen & Hoekstra, 2016).
Several factors, including population growth, surface and groundwater contamination, and increased evapotranspiration due to agricultural expansion, contribute to increasing water scarcity worldwide (Boretti & Rosa, 2019; Zou et al., 2017). Despite these challenges, there is limited evidence of progress towards mitigating water scarcity (Weyhenmeyer et al., 2024). Furthermore, water security is integral to achieving multiple Sustainable Development Goals (SDGs), particularly SDG 6, which emphasizes the need for global sustainable water resource management by 2030 and calls for action to address the existing water crisis. However, current trends indicate that the world is not on track to achieve SDG 6 (UN-Water, 2021).
Water systems are coupled human-natural systems influenced by both anthropogenic and natural drivers, exhibiting complex dynamics characterized by feedback loops, unpredictability, and inherent uncertainties (Liu et al., 2007). Changes within and among the primary water reservoirs, including atmosphere, oceans, cryosphere, and land, account for the majority of mass variability within the Earth system on time scales ranging from minutes to a few years (Dickey et al., 1994). Furthermore, hydrological process complexity tends to decrease with increasing temporal and spatial scales (Biswal, 2016). These complexities present substantial challenges for the accurate observation, simulation, and management of water resources, regardless of their location (atmospheric, surface, or subsurface).
Since the dawn of recorded civilization, humanity has interacted with water resources. Given this long-standing relationship, why has such a severe water crisis emerged in the modern era? With unprecedented technological capabilities, can the current crisis be solely attributed to factors such as population growth and increased life expectancy? Hydrology, the discipline most directly concerned with water, offers a wealth of knowledge on this issue. What experiences, lessons, and insights can be gleaned from this extensive field of study? Furthermore, addressing the water crisis requires a systematic understanding of the historical dynamics and reciprocal impacts within the water-human relationship.
2. Corpus and Language Models
2.1. Corpus
The subject of water permeates a wide array of Earth and environmental science research, and numerous academic journals address water-related topics. This analysis focuses on four leading journals in the field of hydrology: Water Resources Research, Hydrology and Earth System Sciences, Journal of Hydrology, and Advances in Water Resources. The total corpus of publications in these journals from January 2010 to February 2025 comprised approximately 30,658 publications. I limited the scope to these four journals based on the premise that they already provide a sufficiently comprehensive representation of the field. The research period was divided into three epochs based on publication year: 2010–2014, 2015–2019, and 2020–2025, with corresponding numbers of research articles totaling 8,072, 9,735, and 12,851, respectively. Subsequently, the main body of each article (excluding references, figures, tables and their captions, etc.) was converted into a single-column text format suitable for human reading, transforming two- and three-column layouts. The text was further segmented into sentences, each ranging from 10 to 256 words in length, resulting in a final corpus of 7.36 million sentences. Technical details refer to Zhang et al. (2025a).
2.2. Language Models
Subsequently, all extracted sentences underwent emotion analysis using the Twitter-RoBERTa-base-sentiment-latest language model, which classifies sentences as expressing negative, positive, or neutral emotion. Sentences identified as exhibiting non-neutral emotion were then subjected to further analysis using unsupervised clustering techniques. Prior to clustering, these sentences were transformed into vector representations using the mxbai-embed-large-v1 language model. This model, consisting of 335 million parameters, maps sentences into 1024-dimensional vectors and exhibits strong performance on the Massive Text Embedding Benchmark (MTEB). Agglomerative clustering was then employed to identify underlying patterns within the emotion-identified sentences. This method was chosen for its ability to define a merging threshold, which is particularly useful when the optimal number of clusters is unknown. This feature enables manual control over cluster granularity through adjustment of the threshold. The algorithm utilizes two key hyperparameters: a minimum cluster size and a minimum similarity score. Technical details refer to Zhang et al. (2025a).
3. Emotions in Hydrology
Across the entire corpus, the proportion of sentences expressing negative emotion was 4.85% from 2010 to 2014, 4.85% from 2015 to 2019, and 5.13% from 2020 to 2025, indicating a marginal increase over time. Figure 1 presents a summary of the prominent negative emotions identified through unsupervised clustering across the three time periods. It is important to note that Figure 1 only represents a subset of the information derived from the clustering analysis. For example, the 2020–2025 period yielded 275 clusters (Table S9 in the Support Information), containing a far more granular level of detail than is conveyed in Fig. 1c.
Analysis of the negative emotions expressed across the three time periods reveals both commonalities and differences. Notably, all periods emphasize the uncertainties in models arising from input data errors, structural simplifications, parameter inaccuracies, and calibration challenges, ultimately leading to unreliable predictions for water management and extreme events. A consistent concern is the exacerbation of droughts, floods, water scarcity, and disruptions to hydrological cycles by climate change, posing a significant threat to ecosystems, agriculture, and socio-economic stability. Persistent issues with sparse monitoring networks, measurement errors (e.g., in rain gauges, radar, and satellite data), and data scarcity in ungauged regions continue to hinder model accuracy and validation efforts. Over-pumping, contamination (e.g., by nitrates and salinity), and depletion of water resources are recurring themes, with negative impacts on water security, land subsidence, and ecosystem health. Furthermore, droughts and floods are consistently highlighted as critical threats, causing substantial economic losses, infrastructure damage, and ecological degradation.
However, the specific negative emotions expressed evolved across the three time periods. For example, the 2010–2014 period primarily focused on limitations associated with traditional hydrological models, structural oversimplification, and fundamental calibration challenges. The 2015–2019 period introduced discussions of regional case studies (e.g., the Loess Plateau, seawater intrusion) and computational limitations encountered when implementing complex models. The 2020–2025 period saw the rise of advanced techniques (e.g., long short-term memory (LSTM) networks, machine learning (ML) models) and highlighted their inherent limitations, such as overfitting and lack of interpretability, alongside emerging issues like compound events (e.g., droughts coupled with heatwaves) and constraints on data accessibility. Moreover, unlike previous periods, the 2020–2025 period detailed cascading effects of climate change, such as permafrost thaw, flash droughts, and compound flooding events (e.g., storm surges coupled with heavy rainfall). From 2015–2019 onward, there was an increasing emphasis on the role of urbanization in amplifying flood risks due to impervious surfaces and overloaded drainage systems, as well as pollution stemming from agricultural and industrial activities. Salinization, eutrophication, and ecological fragmentation resulting from dam construction were more prominently highlighted in the 2020–2025 period, receiving comparatively less attention in earlier analyses. Explicit acknowledgement of the prohibitive computational demands of high-resolution models, hybrid machine learning approaches, and the challenges of real-time applications also emerged in the 2020–2025 period. Finally, the 2020–2025 period incorporated more localized examples (e.g., Yangtze Basin droughts, Poyang Lake degradation, Central Valley aquifer depletion) and highlighted global hotspots facing acute water-related challenges, such as arid regions and coastal zones.
Across the entire corpus, the proportion of sentences expressing positive emotion was 3.62% from 2010 to 2014, 3.95% from 2015 to 2019, and 5.06% from 2020 to 2025, reflecting a modest increase over time. However, in each of the analyzed periods, the proportion of positive emotions remained lower than that of negative emotions. Figure 2 summarizes the key positive emotions identified via unsupervised clustering across the three time periods. With respect to positive emotions, all three periods emphasized strong agreement between model simulations and observational or experimental data, validated using metrics such as the Nash-Sutcliffe efficiency (NSE), root-mean-square error (RMSE), and coefficient of determination (R2). The importance of remote sensing (e.g., soil moisture monitoring, satellite rainfall estimation) and data assimilation techniques (e.g., the Ensemble Kalman Filter (EnKF)) for improving hydrological predictions was also consistently highlighted. Furthermore, the crucial role of groundwater in supporting agriculture, ecosystems, and sustainable water resource management was underscored in all periods, along with strategies for drought and flood mitigation. Finally, the application of machine learning techniques (e.g., artificial neural networks (ANNs), support vector machines (SVMs)) was prevalent across all periods, although the complexity of these methods increased over time.
The differences across the periods are reflected in the following aspects. The 2010–2014 period focused on remote sensing integration, fundamental calibration techniques, and the dominance of traditional methods (e.g., ANNs, adaptive network-based fuzzy inference systems (ANFISs)) along with foundational data assimilation approaches. The 2015–2019 period witnessed the rise of multi-model ensembles, hybrid frameworks (e.g., Wavelet-ANN), and the emergence of socio-hydrology as a prominent area of research. Satellite missions, such as the Gravity Recovery and Climate Experiment (GRACE) and the Surface Water and Ocean Topography (SWOT) mission, gained increasing prominence during this time. In contrast, the 2020–2025 period was characterized by a surge in the application of deep learning techniques (e.g., LSTMs, convolutional neural networks (CNNs), and Transformers), physics-informed deep learning (DL) approaches, and the development of sophisticated hybrid models. Advanced techniques like transfer learning and attention mechanisms became increasingly popular. Regarding remote sensing, the 2015–2019 period saw improvements in spatial-temporal accuracy resulting from the use of high-resolution satellite data (e.g., from the Global Precipitation Measurement (GPM) mission) and distributed models. In the 2020–2025 period, high-frequency satellite missions (e.g., SWOT and Ice, Cloud, and Land Elevation Satellite-2 (ICESat-2)) and artificial intelligence (AI)-driven tools, such as physics-informed neural networks (PINNs), enabled real-time, high-resolution global monitoring capabilities. Regarding model complexity, the 2010–2014 period primarily focused on rainfall-runoff modeling, soil moisture dynamics, and simple ML applications. The 2015–2019 period expanded to include drought early warning systems, snowpack modeling, and the study of human-water interactions within a socio-hydrological framework. Finally, the 2020–2025 period saw advanced applications incorporating pore-scale fluid dynamics, climate change resilience assessments, and continental-scale predictions using DL hybrid models. With respect to data assimilation techniques, the EnKF was widely used prior to 2020. However, the 2020–2025 period saw the widespread adoption of improved data assimilation techniques, such as multi-sensor fusion and machine learning-enhanced data assimilation. In terms of performance metrics, basic statistical measures (e.g., R²) were commonly used in the 2015–2019 period. In contrast, the 2020–2025 period saw the adoption of more advanced metrics, such as the Kling-Gupta Efficiency (KGE) and volumetric efficiency (VE), along with scalable frameworks for global hydrological simulations that emphasized computational efficiency.
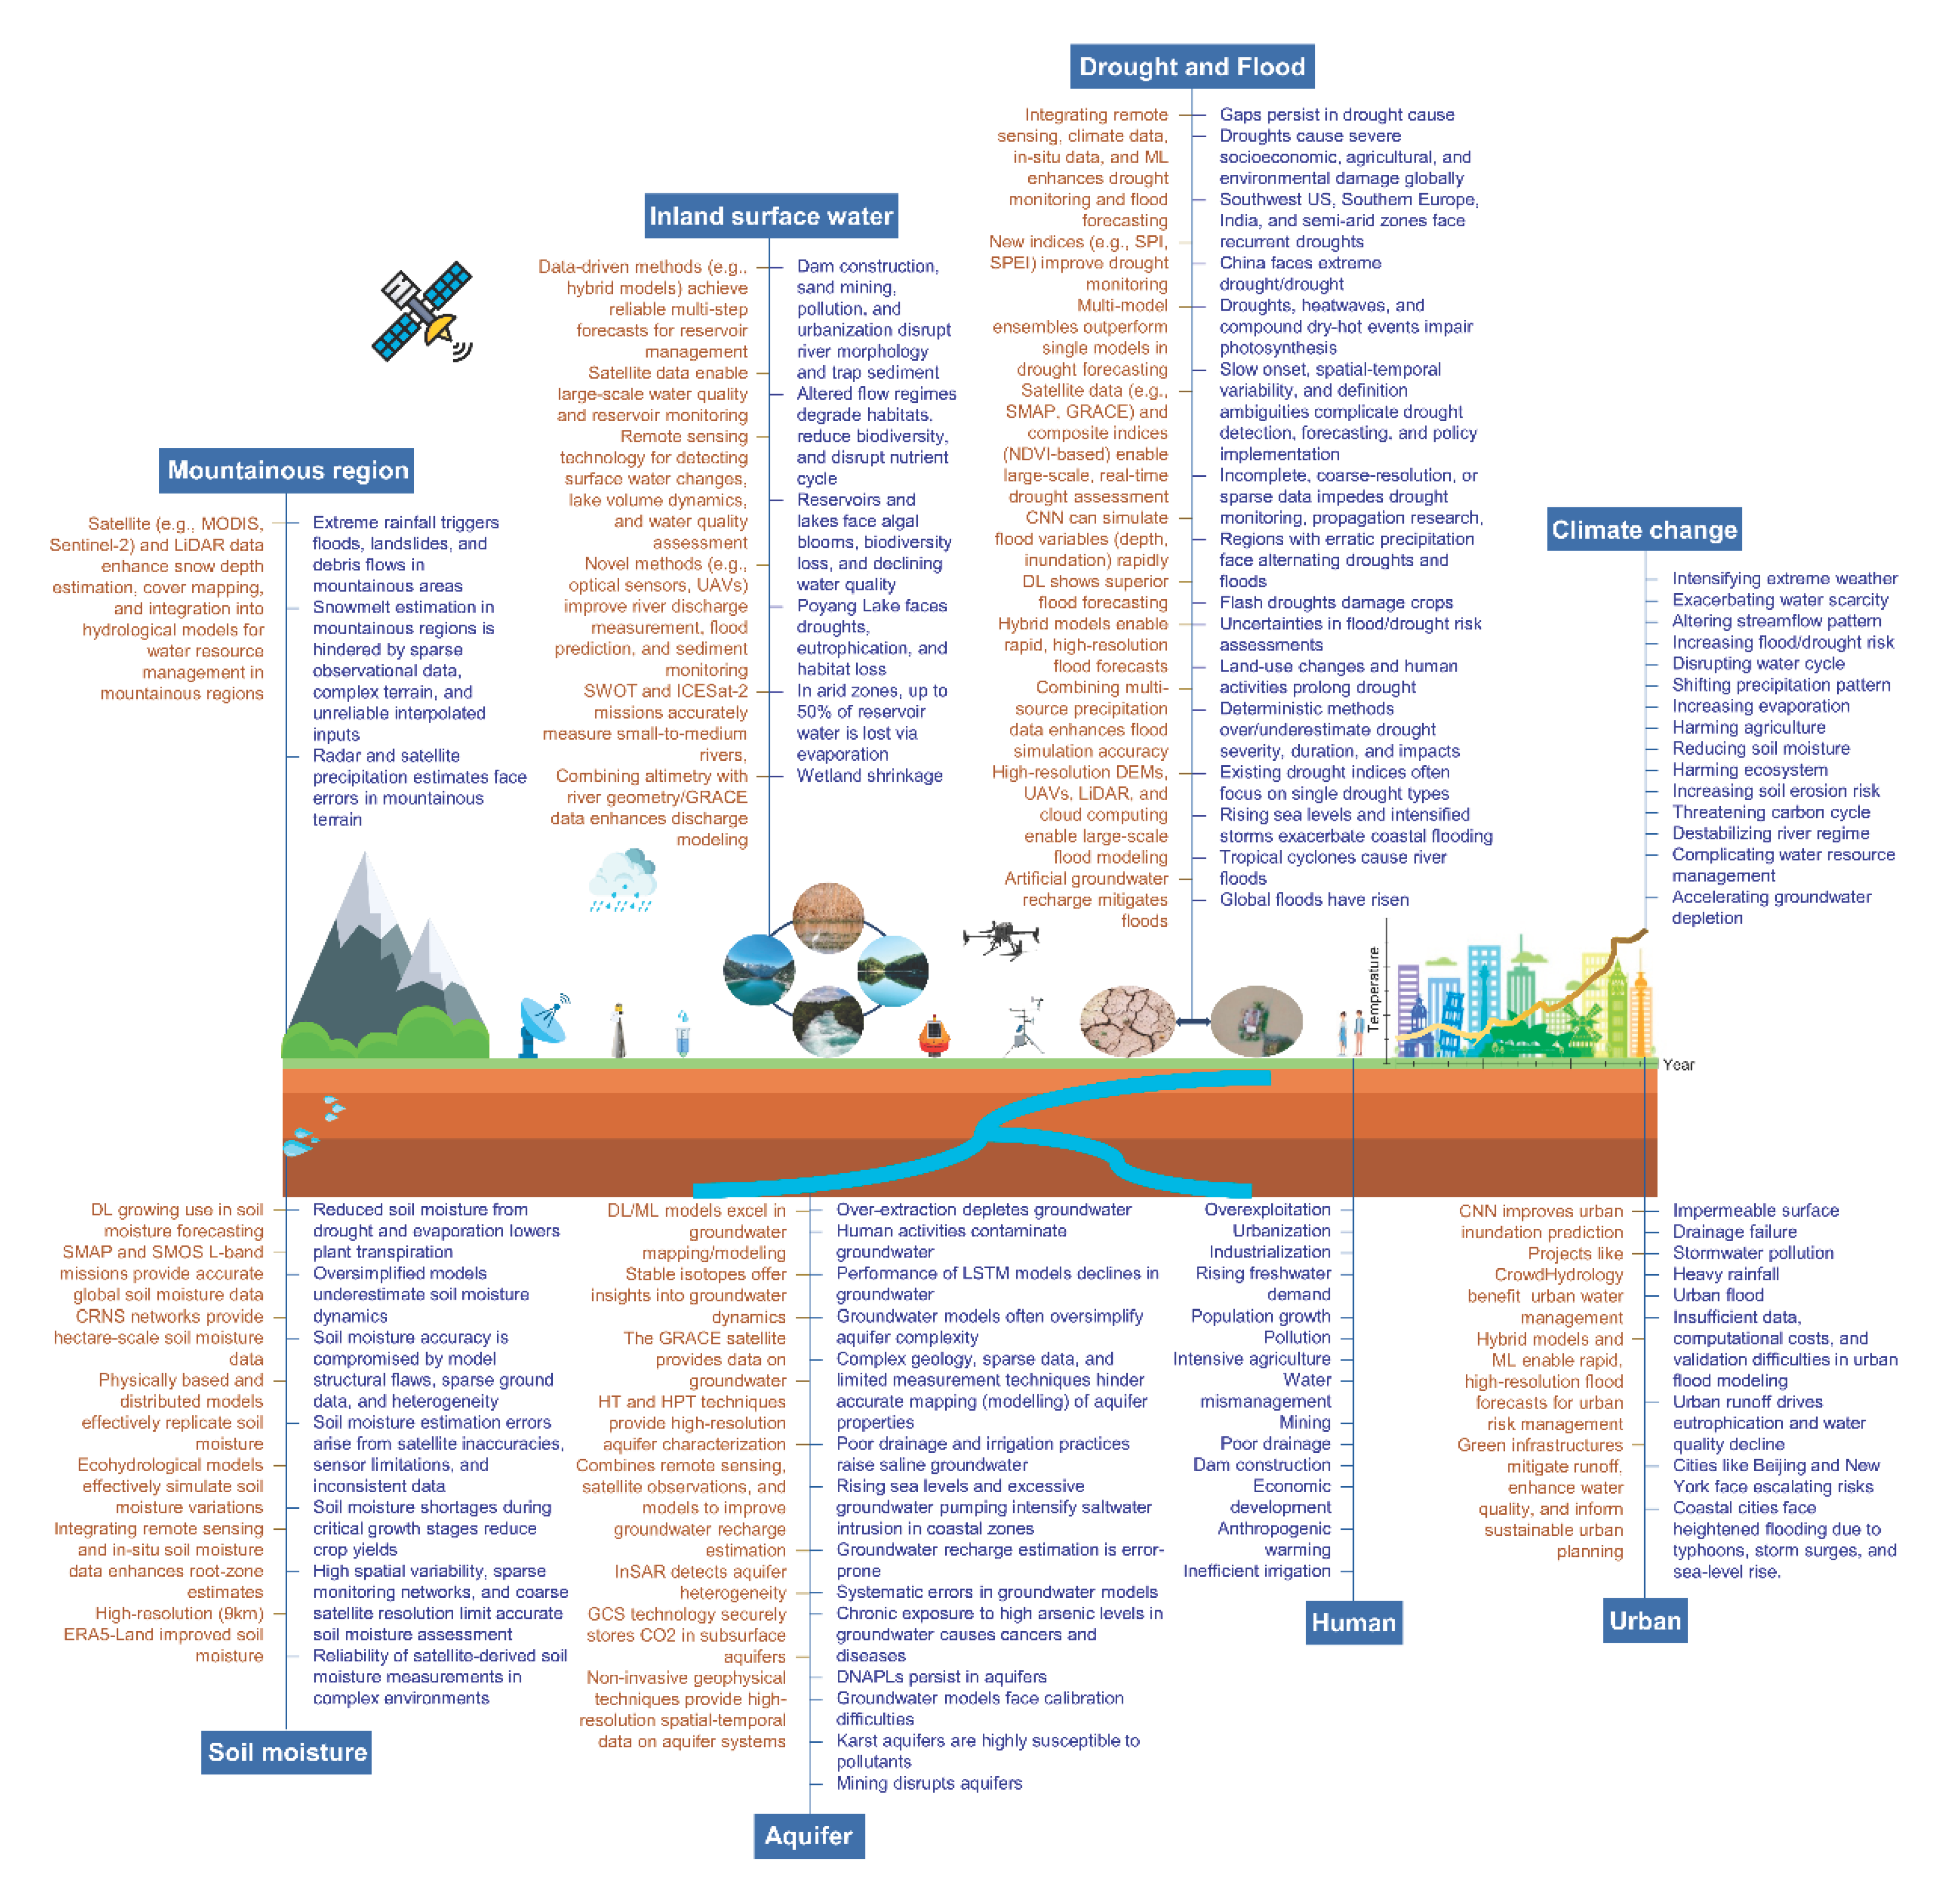
It is important to acknowledge that, given the inherent complexity of hydrology and the diversity of positive and negative emotions, the preceding analysis can only represent a small fraction of the total insights available, and unsupervised clustering is inherently limited to extracting information with common, recurring patterns. However, by contrasting positive and negative emotions directly, some conclusions can be drawn. Taking the 2020–2025 period as an example, a direct comparison of positive and negative emotions (Figure 3) reveals that positive emotions predominantly reflect advancements in hydrology-related technologies, while negative emotions highlight the intensification of water resource crises. For instance, extreme hydrological events (such as droughts, floods, and heavy rainfall) are intensifying in conjunction with global warming. Inland surface water resources face a range of challenges, including the impacts of large dams, water pollution, and severe reservoir losses in arid regions. Groundwater resources are grappling with issues such as over-exploitation, declining groundwater levels, and groundwater contamination. Soil water availability is decreasing, severely impacting agricultural productivity. Upon closer examination, many of these water crises can be traced back to human activities, including population growth, increased water consumption, urbanization, industrialization, mining, inadequate water resource management, anthropogenic climate change, pollution, intensive agricultural activities, poor drainage infrastructure, dam construction, and inefficient irrigation practices. Ultimately, the various water crises are highly likely to be linked to human activities. Conversely, the positive emotions reflect various efforts undertaken by humans to alleviate the water crisis, such as improvements in hydrological models, advancements in observation techniques, and the extensive application of machine learning algorithms. Thus, a concerning phenomenon emerges: while hydrological technology is continuously advancing, the water crisis is simultaneously intensifying. Evidently, the water-human system may be susceptible to the Matthew effect, where increased human intervention, demands, and activities exacerbate the water crisis. In an attempt to address the water crisis, humans may be driven to extract more groundwater and develop various technologies and projects to manage and transform water resources more urgently, which can inadvertently lead to a further deepening of the crisis. In hydrological simulation, despite the introduction of numerous new technologies and data sources, substantive difficulties remain, which may be attributed to the inherent complexity and variability of water in both time and space, as well as the intricate nature of the water-human relationship.
4. Conclusions and Discussion
Hydrology is intrinsically linked to human well-being, and the current relationship between humanity and water is characterized by both contradiction and complexity. As a valuable lens through which to understand contemporary water conditions, hydrology, via its distinguished publications, enables us to explore the universal challenges, advancements, and even potential solutions for alleviating the water crisis currently confronting our water resources.
Analysis of 7.36 million sentences extracted from leading hydrological publications such as Water Resources Research reveals that significant progress has been made in the field of hydrology over the past fifteen years, both in observational techniques and modeling approaches. In terms of observation, the field has advanced from reliance on separate data sources to complicated multi-source data fusion techniques. Similarly, modeling has evolved from simple, conceptual models to more complex and integrated hybrid frameworks.
However, the persistence of negative emotions identified in the analysis suggests that, despite ongoing advancements in hydrological models and other techniques, the water crisis has not been effectively mitigated. Over the past decade, we have observed continuous progress in hydrological technology, yet simultaneously witnessed a further intensification of the water crisis. Examining the interplay between positive and negative emotions reveals that the underlying causes of many water crisis-related problems can be traced back to human activities, demands, and interventions.
Concerning the simulation and observation of water, whether in the past, present, or future, we could anticipate an ongoing process replete with both positive and negative findings. While a fundamental question emerges: given that humans have interacted with water for millennia, why have such severe problems arisen in our technologically advanced era? Unlike previous eras, where humanity’s capacity to alter the natural world was relatively limited, and interactions with water were perhaps more aligned with its natural rhythms, the modern focus is on water resource management. The crucial question is: to what extent is this management truly beneficial? Ultimately, the key to alleviating the water crisis lies in identifying and breaking the negative feedback loop that currently exists between water and humanity.
Supplementary Materials
The following supporting information can be downloaded at the website of this paper posted on Preprints.org.
Author Contributions
JZ conceptualized and carried out the analysis.
Data Availability Statement
A simplified procedure for utilizing small language models and emotion analysis is available at Zhang (2025b).
Acknowledgments
The author would not like to acknowledge the National Natural Science Foundation of China.
Conflicts of Interest
The author declares no conflicts of interest relevant to this study.
References
- Biswal, B. Dynamic hydrologic modeling using the zero-parameter Budyko model with instantaneous dryness index. Geophys. Res. Lett. 2016, 43(18), 9696–9703. [Google Scholar] [CrossRef]
- Boretti, A.; Rosa, L. Reassessing the projections of the world water development report. npj Clean. Water 2019, 2(1), 15. [Google Scholar] [CrossRef]
- Dickey, J. O.; Marcus, S. L.; Hide, R.; Eubanks, T. M.; Boggs, D. H. Angular momentum exchange among the solid Earth, atmosphere, and oceans: A case study of the 1982–1983 El Niño event. J. Geophys. Res. Solid Earth 1994, 99(B12), 23921–23937. [Google Scholar] [CrossRef]
- Huggins, X.; Gleeson, T.; Kummu, M.; Zipper, S. C.; Wada, Y.; Troy, T. J.; Famiglietti, J. S. Hotspots for social and ecological impacts from freshwater stress and storage loss. Nat. Commun. 2022, 13(1), 439. [Google Scholar] [CrossRef] [PubMed]
- Institute for Economics; Peace. Ecological threat register 2020: Understanding ecological threats, resilience and peace. 2020. Available online: https://visionofhumanity.org/wpcontent/uploads/2020/10/ETR_2020_web-1.pdf.
- Liu, J.; Dietz, T.; Carpenter, S. R.; Alberti, M.; Folke, C.; Moran, E.; Taylor, W. W. Complexity of coupled human and natural systems. Science 2007, 317(5844), 1513–1516. [Google Scholar] [CrossRef] [PubMed]
- Mekonnen, M. M.; Hoekstra, A. Y. Four billion people facing severe water scarcity. Sci. Adv. 2016, 2(2), e1500323. [Google Scholar] [CrossRef] [PubMed]
- Sheffield, J.; Wood, E. F.; Pan, M.; Beck, H.; Coccia, G.; Serrat-Capdevila, A.; Verbist, K. J. W. R. R. Satellite remote sensing for water resources management: Potential for supporting sustainable development in data-poor regions. Water Resour. Res. 2018, 54(12), 9724–9758. [Google Scholar] [CrossRef]
- UN-Water. Summary Progress Update 2021: SDG 6 — Water and sanitation for all; Geneva, 2021. [Google Scholar]
- Weyhenmeyer, G. A.; Chukwuka, A. V.; Anneville, O.; Brookes, J.; Carvalho, C. R.; Cotner, J. B.; Zhou, Y. Global lake health in the anthropocene: societal implications and treatment strategies. Earth's Future 2024, 12(4), e2023EF004387. [Google Scholar] [CrossRef]
- WWAP(United Nations World Water Assessment Programme); UN-Water. The United Nations world water development report 2018: Nature-based solutions for water; United Nations Educational, Scientific and Cultural Organization (UNESCO): Paris, 2018; pp. 3–20. [Google Scholar]
- Zou, M.; Niu, J.; Kang, S.; Li, X.; Lu, H. The contribution of human agricultural activities to increasing evapotranspiration is significantly greater than climate change effect over Heihe agricultural region. Sci. Rep. 2017, 7(1), 8805. [Google Scholar] [CrossRef] [PubMed]
- Zhang, J. Small language models with sentence-level corpus offer significant potential for the geoscience community. Perspect. Earth Space Sci. 2025a, 6, e2025CN000283. [Google Scholar] [CrossRef]
- Zhang, J. Tips for MiniLM [Dataset]. Retrieved from. 2025b. [Google Scholar] [CrossRef]
Figure 1.
The extracted negative emotions were subjected to unsupervised clustering. (a) represents the analysis of publications from 2010 to 2014, based on the 8 clusters presented in Table S2. Tab. S2, in turn, is derived from the re-clustering of 64 clusters detailed in Table S1. (b) presents the analysis of publications from 2015 to 2019, based on the 11 clusters in Table S6. Tab. S6 is the result of re-clustering based on the 97 clusters found in Table S5. (c) presents only the top ten clusters from Table S10 (out of a total of 42 clusters). Tab. S10 is the result of re-clustering the 275 clusters detailed in Table S9. In each case, the scatter plot on the left illustrates the distribution of all samples compressed into a two-dimensional plane for the given time interval. The t-distributed Stochastic Neighbor Embedding (t-SNE) algorithm was used to reduce the dimensionality of the high-dimensional sentence vectors into this two-dimensional space. The dispersed points in the scatter plot correspond directly to the colors summarizing the information provided by the DeepSeek large language model on the right.
Figure 1.
The extracted negative emotions were subjected to unsupervised clustering. (a) represents the analysis of publications from 2010 to 2014, based on the 8 clusters presented in Table S2. Tab. S2, in turn, is derived from the re-clustering of 64 clusters detailed in Table S1. (b) presents the analysis of publications from 2015 to 2019, based on the 11 clusters in Table S6. Tab. S6 is the result of re-clustering based on the 97 clusters found in Table S5. (c) presents only the top ten clusters from Table S10 (out of a total of 42 clusters). Tab. S10 is the result of re-clustering the 275 clusters detailed in Table S9. In each case, the scatter plot on the left illustrates the distribution of all samples compressed into a two-dimensional plane for the given time interval. The t-distributed Stochastic Neighbor Embedding (t-SNE) algorithm was used to reduce the dimensionality of the high-dimensional sentence vectors into this two-dimensional space. The dispersed points in the scatter plot correspond directly to the colors summarizing the information provided by the DeepSeek large language model on the right.
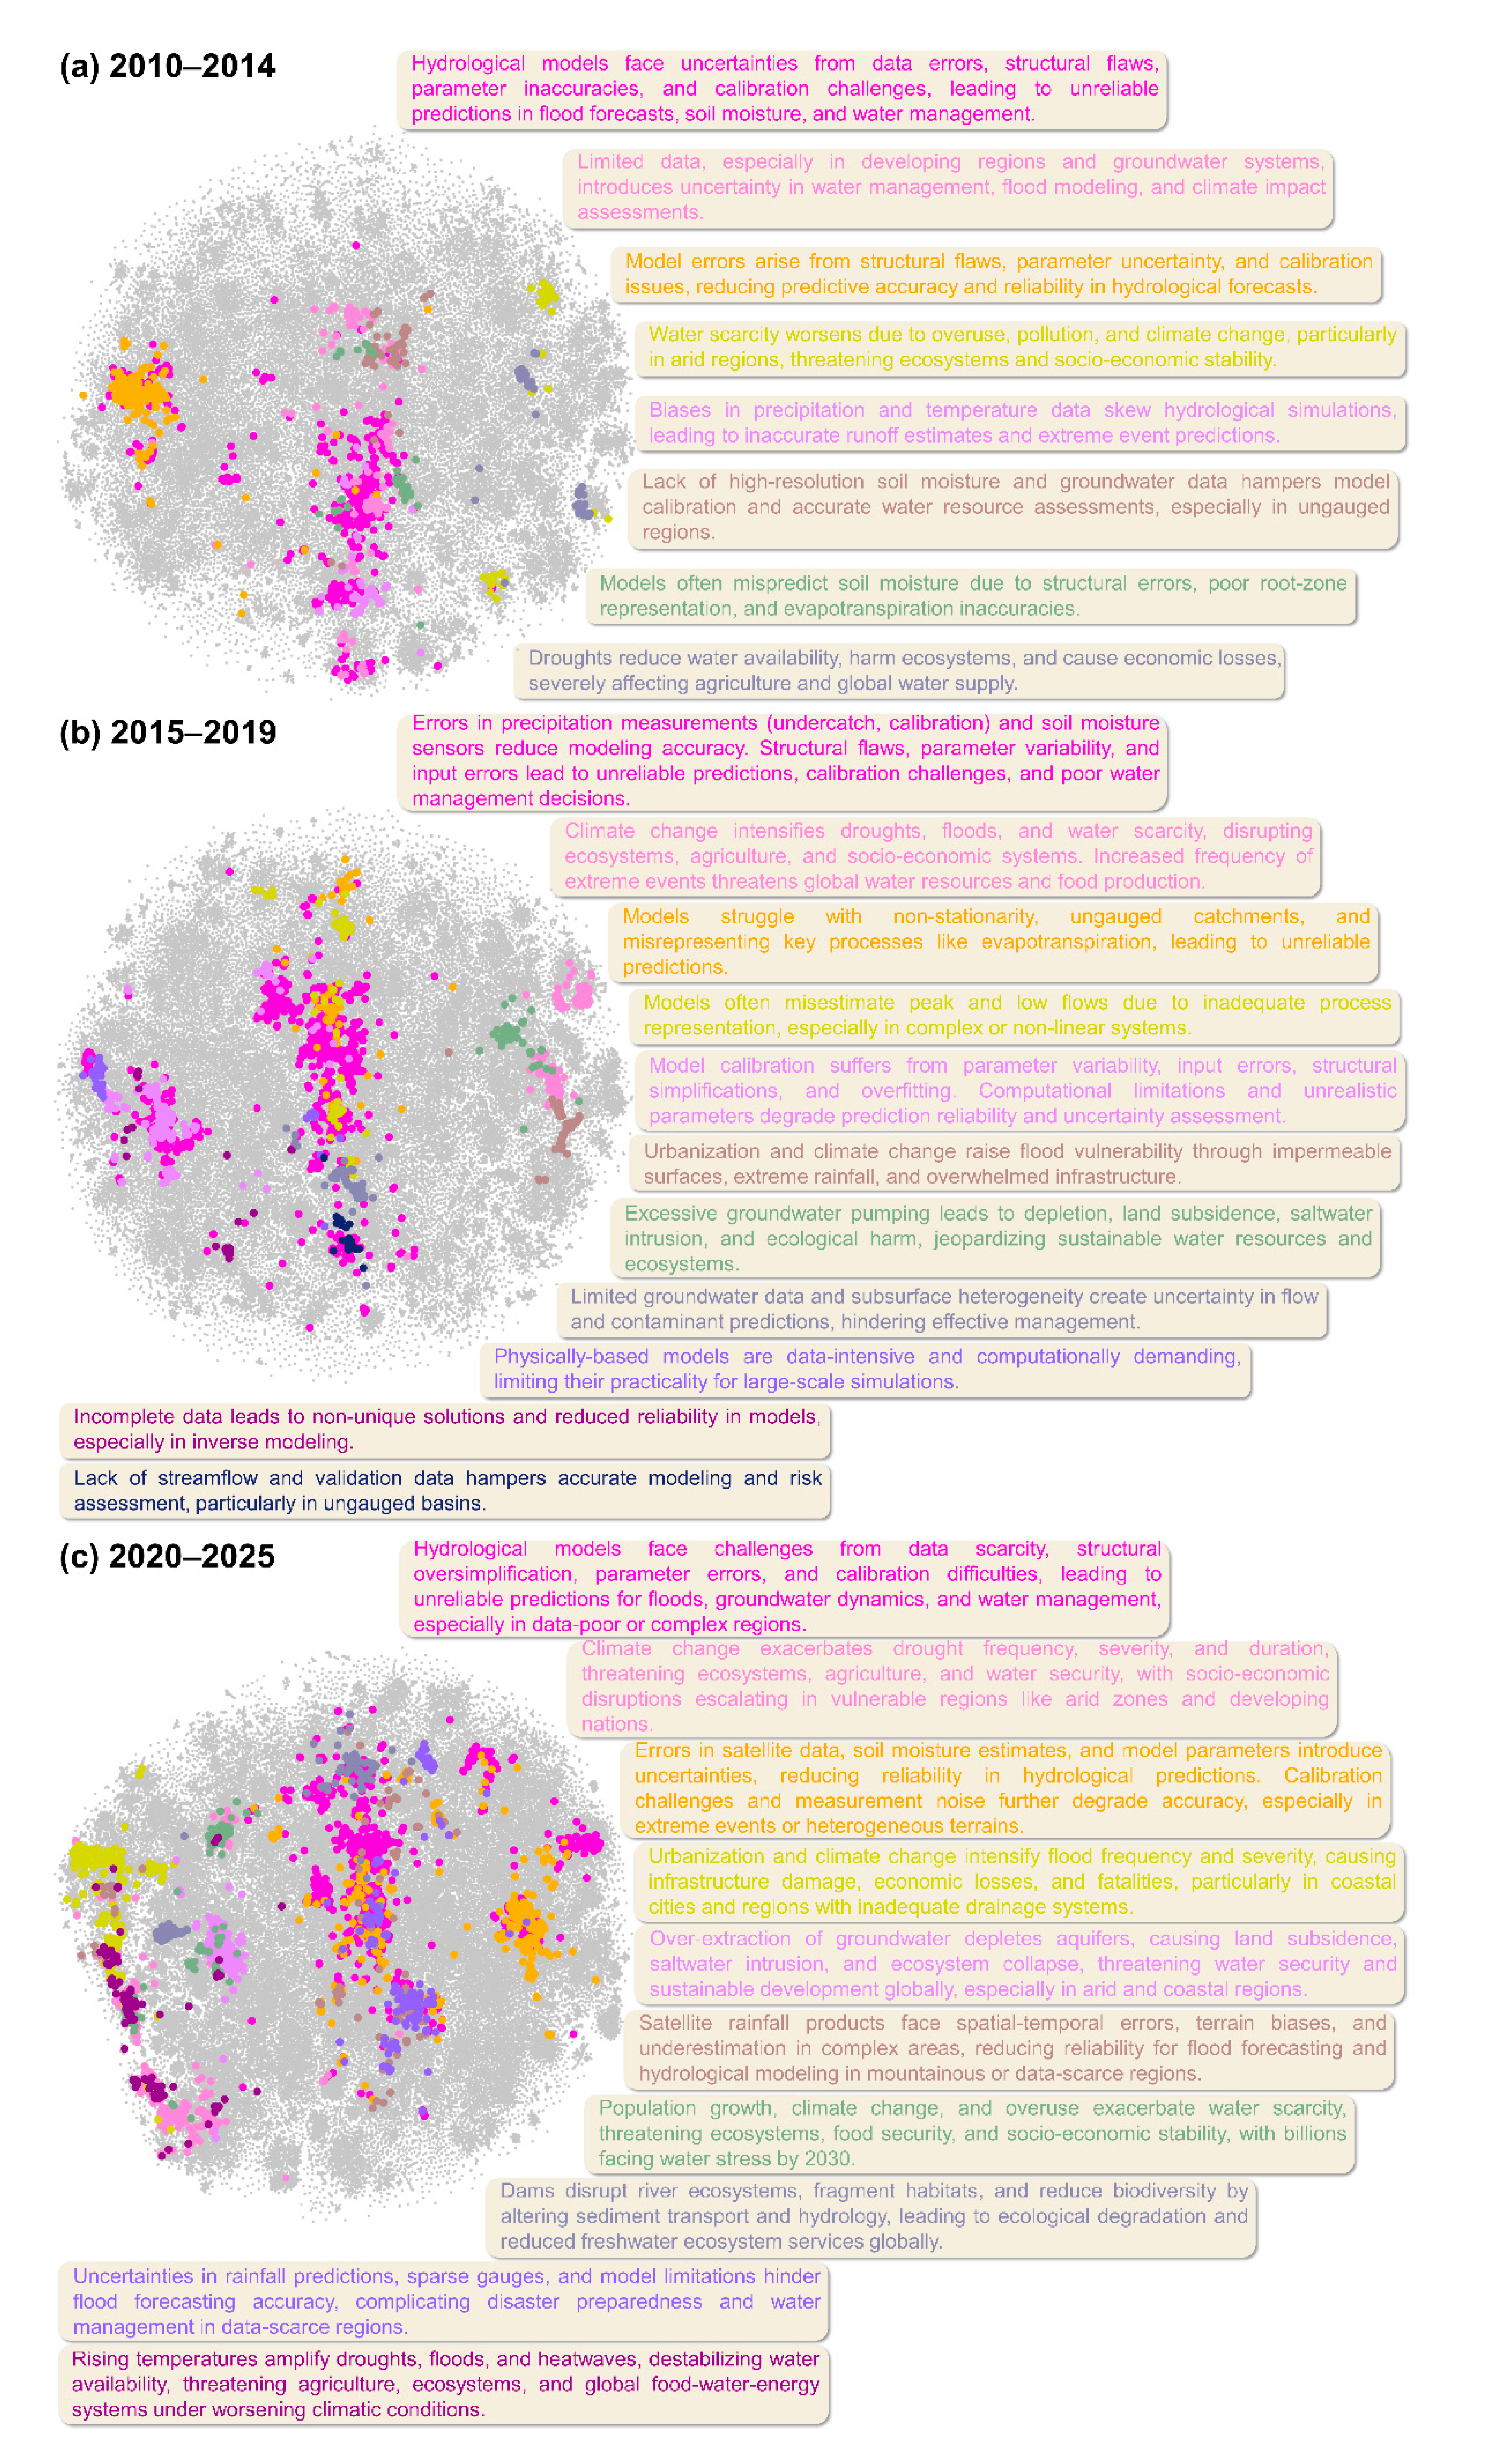
Figure 2.
Similar to Figure 1, but for positive emotions. (a) is based on the results presented in Table S4, which is derived from the re-clustering of 80 clusters detailed in Table S3. (b) is based on the results presented in Table S8, which is derived from the re-clustering of 140 clusters detailed in Table S7. (c) is based on the results presented in Table S12 (comprising a total of 55 categories), with only the top ten categories displayed. Tab. S12 is in turn based on the re-clustering of 385 clusters detailed in Table S11. GIS: geographic information system; ARMA: autoregressive moving average; GPR: ground-penetrating radar; ARIMA: autoregressive integrated moving average; ELM: extreme learning machine; GRU: gated recurrent unit.
Figure 2.
Similar to Figure 1, but for positive emotions. (a) is based on the results presented in Table S4, which is derived from the re-clustering of 80 clusters detailed in Table S3. (b) is based on the results presented in Table S8, which is derived from the re-clustering of 140 clusters detailed in Table S7. (c) is based on the results presented in Table S12 (comprising a total of 55 categories), with only the top ten categories displayed. Tab. S12 is in turn based on the re-clustering of 385 clusters detailed in Table S11. GIS: geographic information system; ARMA: autoregressive moving average; GPR: ground-penetrating radar; ARIMA: autoregressive integrated moving average; ELM: extreme learning machine; GRU: gated recurrent unit.
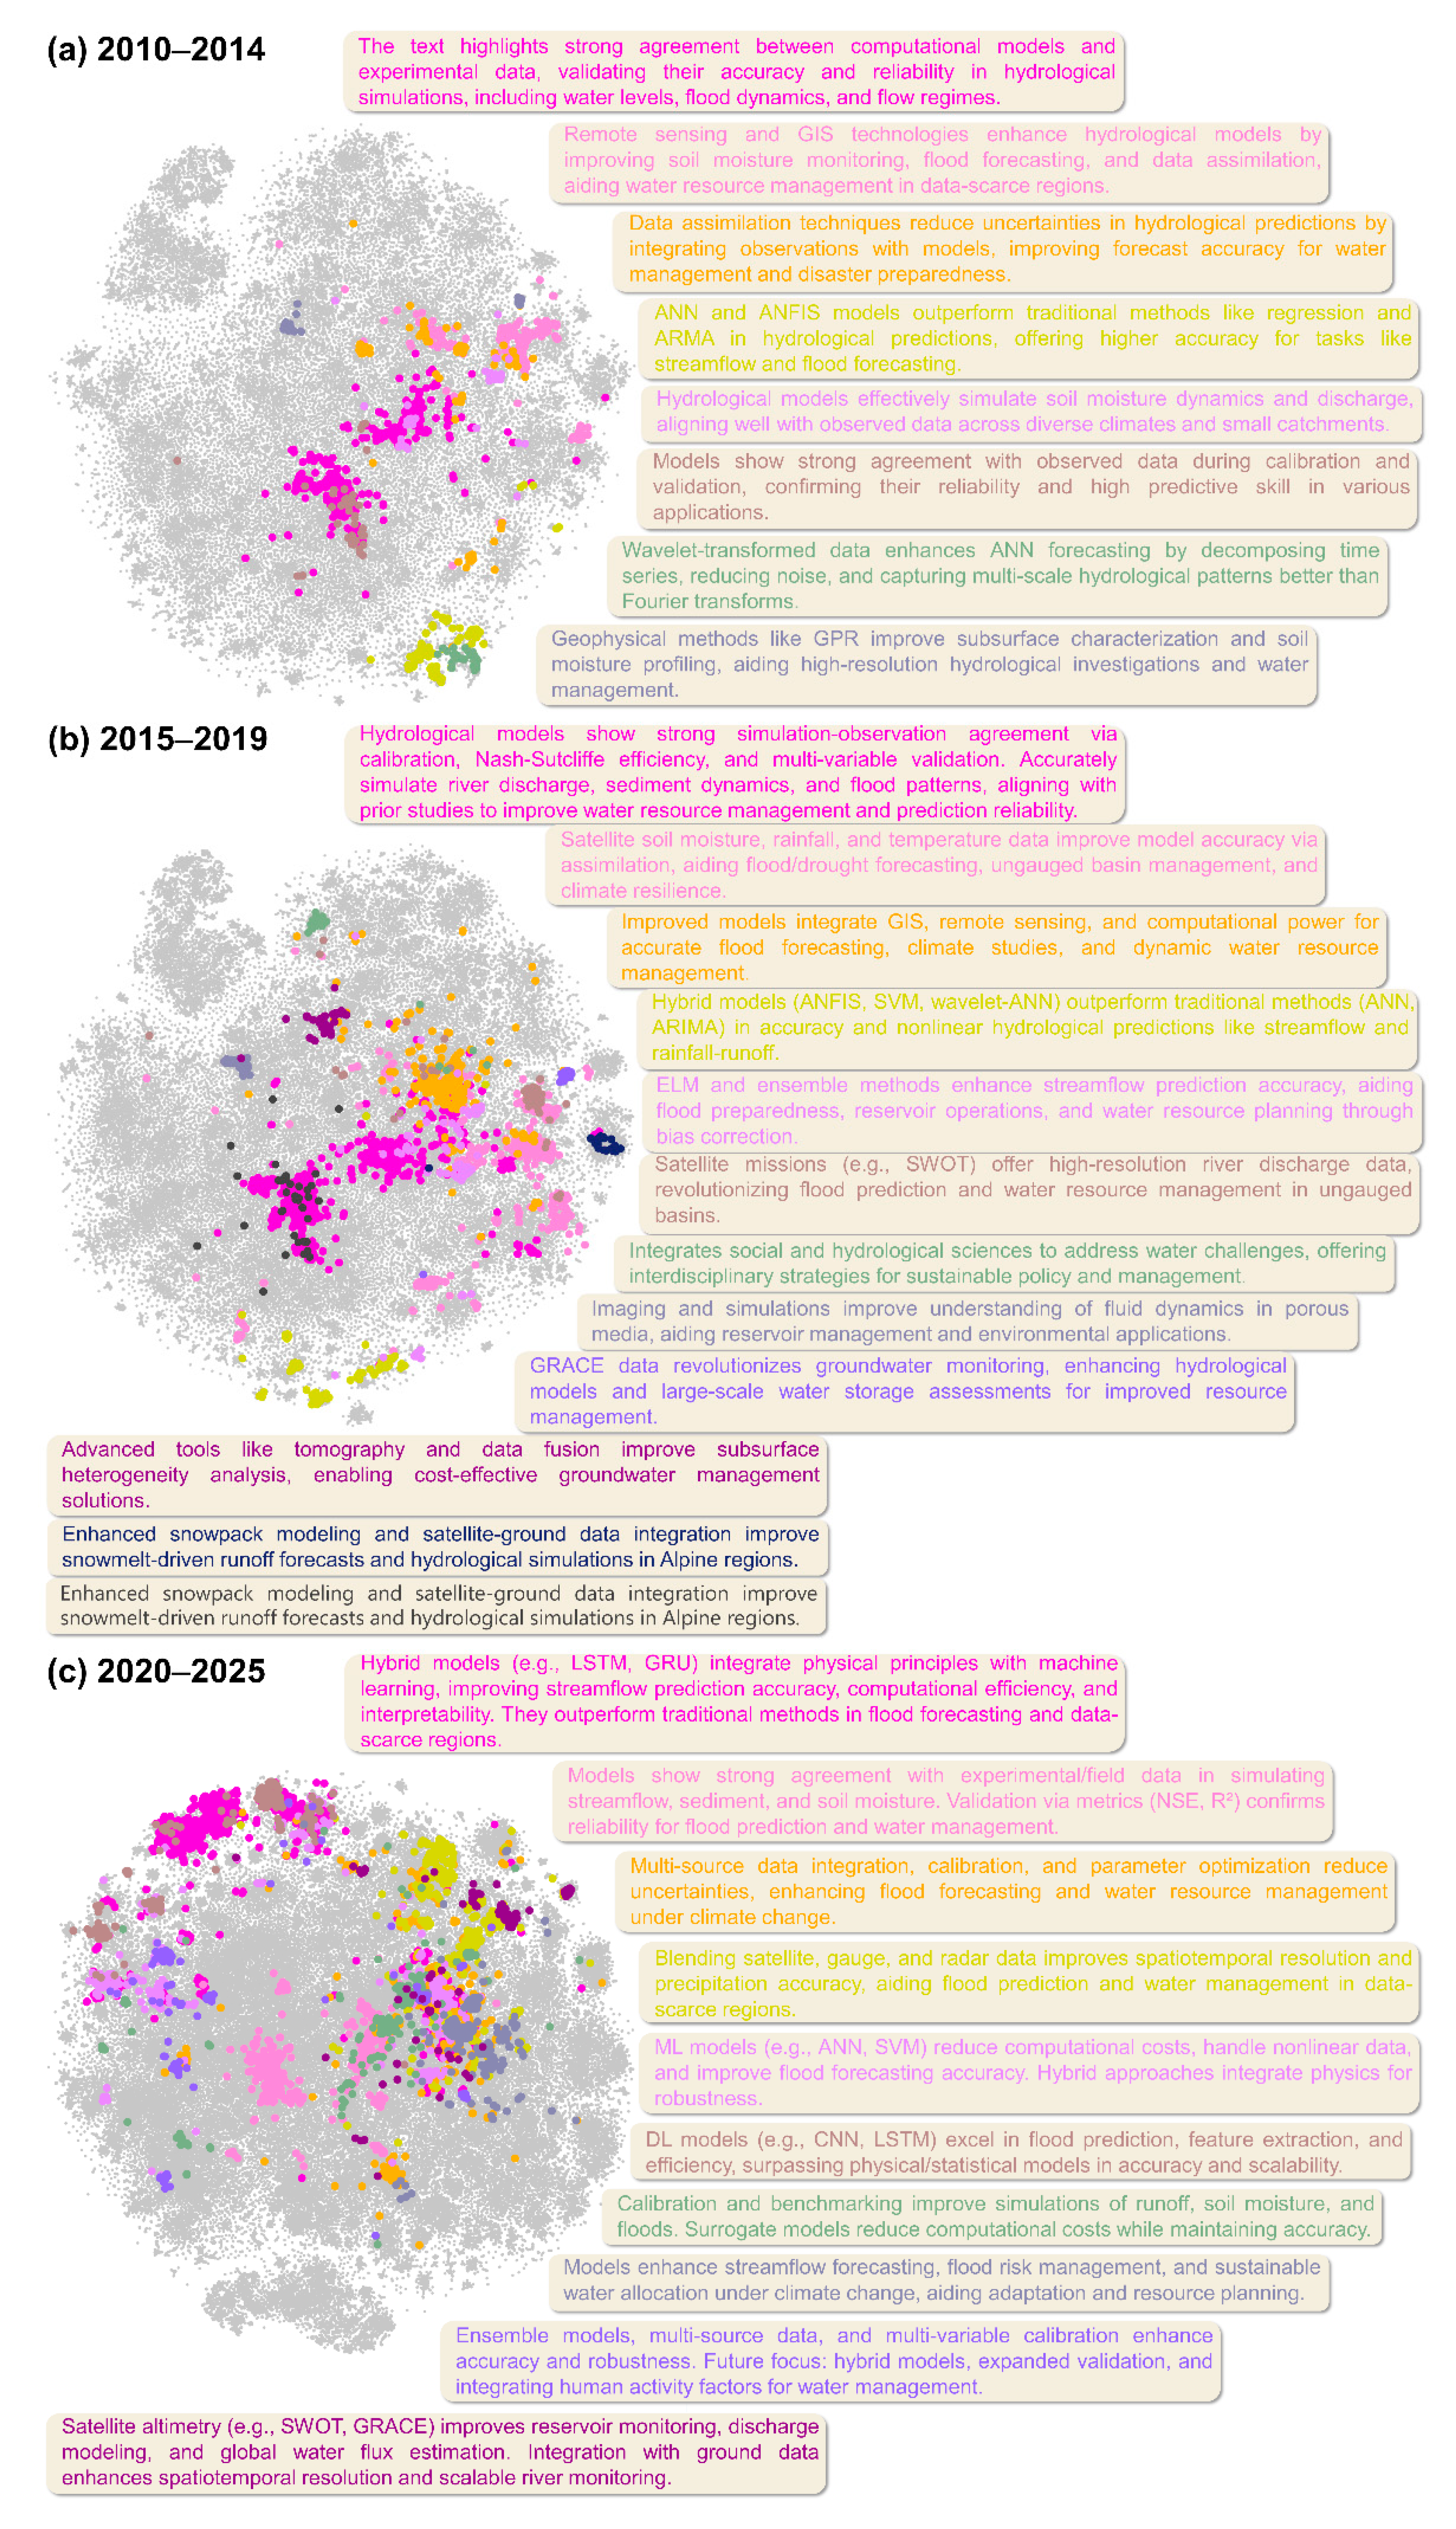
Figure 3.
A concept map illustrating the interactions within the water-human system, based on the negative emotions extracted from Tab. S9 (2020–2025) and the positive emotions extracted from Tab. S11 (2020–2025). The dark blue text summarizes the negative aspects, while the brown text summarizes the positive aspects. This diagram highlights some of the advances and challenges specifically related to soil moisture, aquifers, hydrological extremes, and inland surface water resources. MODIS: Moderate Resolution Imaging Spectroradiometer; LiDAR: Light Detection and Ranging; UAV: unpiloted aerial vehicle; SPI: Standardized Precipitation Index; SPEI: Standardized Precipitation Evapotranspiration Index; SMAP: Soil Moisture Active Passive; NDVI: Normalized Difference Vegetation Index; DEM: digital elevation model; HT: hydraulic tomography; HPT: hydraulic profiling tool; InSAR: interferometric synthetic aperture radar; GCS: geological carbon storage; SMOS: Soil Moisture and Ocean Salinity; CRNS: Cosmic Ray Neutron Sensors; ERA5: the European Centre for Medium-Range Weather Forecasts fifth Reanalysis.
Figure 3.
A concept map illustrating the interactions within the water-human system, based on the negative emotions extracted from Tab. S9 (2020–2025) and the positive emotions extracted from Tab. S11 (2020–2025). The dark blue text summarizes the negative aspects, while the brown text summarizes the positive aspects. This diagram highlights some of the advances and challenges specifically related to soil moisture, aquifers, hydrological extremes, and inland surface water resources. MODIS: Moderate Resolution Imaging Spectroradiometer; LiDAR: Light Detection and Ranging; UAV: unpiloted aerial vehicle; SPI: Standardized Precipitation Index; SPEI: Standardized Precipitation Evapotranspiration Index; SMAP: Soil Moisture Active Passive; NDVI: Normalized Difference Vegetation Index; DEM: digital elevation model; HT: hydraulic tomography; HPT: hydraulic profiling tool; InSAR: interferometric synthetic aperture radar; GCS: geological carbon storage; SMOS: Soil Moisture and Ocean Salinity; CRNS: Cosmic Ray Neutron Sensors; ERA5: the European Centre for Medium-Range Weather Forecasts fifth Reanalysis.
Disclaimer/Publisher’s Note: The statements, opinions and data contained in all publications are solely those of the individual author(s) and contributor(s) and not of MDPI and/or the editor(s). MDPI and/or the editor(s) disclaim responsibility for any injury to people or property resulting from any ideas, methods, instructions or products referred to in the content. |
© 2026 by the authors. Licensee MDPI, Basel, Switzerland. This article is an open access article distributed under the terms and conditions of the Creative Commons Attribution (CC BY) license (http://creativecommons.org/licenses/by/4.0/).
Copyright: This open access article is published under a Creative Commons CC BY 4.0 license, which permit the free download, distribution, and reuse, provided that the author and preprint are cited in any reuse.