
Submitted:
04 August 2026
Posted:
05 August 2026
You are already at the latest version
Abstract
This study presents a spatiotemporal analysis and predictive modeling approach for assessing distributed photovoltaic potential in La Maná, Ecuador, using hourly NASA POWER satellite data from 2014 to 2025. A total of 105,168 hourly records of global horizontal irradiance, air temperature, relative humidity, and wind speed were processed. The methodology included data cleaning, temporal feature generation, hourly, monthly, and interannual solar resource analysis, and the comparison of machine learning models for predicting global horizontal irradiance as an indicator of photovoltaic potential. The results showed a relatively stable solar resource throughout the study period, with hourly maximum values occurring around midday and low season-al variability. Among the evaluated models, Gradient Boosting achieved the best predictive performance, with an MAE of 35.14 W/m², an RMSE of 68.44 W/m², and a coefficient of determination of 0.8875. The feature importance analysis revealed that the hourly component dominated solar resource prediction; however, when this effect was excluded, air temperature emerged as the most influential meteorological variable. These findings demonstrate that integrating hourly satellite data with machine learning provides a robust alternative for evaluating photovoltaic potential in tropical regions with limited ground-based meteorological monitoring infrastructure.
Keywords:
photovoltaic potential
; NASA POWER
; machine learning
; solar irradiance
; distributed generation
; La Maná
1. Introduction
The sustained growth in global energy demand, coupled with the need to reduce greenhouse gas emissions, has driven a progressive transition toward more sustainable energy systems based on renewable sources. In this context, solar photovoltaic energy has experienced unprecedented expansion over the past decade due to declining pho-tovoltaic module costs, increased efficiency, and the implementation of policies aimed at decarbonizing power systems. According to the Trends in Photovoltaic Applications 2025 report, global installed photovoltaic capacity continues to grow at historic rates, establishing itself as one of the most relevant technologies for achieving international sustainability and energy security goals [1].
Distributed photovoltaic generation constitutes one of the main pillars of this en-ergy transition, as it enables electricity production close to consumption points, reduc-ing technical losses in transmission and distribution systems, increasing the resilience of power grids, and promoting the active participation of users in energy markets [2]. Several studies have demonstrated that the integration of distributed photovoltaic systems can significantly contribute to reducing polluting emissions and strengthening energy security, particularly in regions with high levels of solar irradiation and sus-tained growth in electricity demand [3].
In Latin America, and particularly in Ecuador, distributed generation based on photovoltaic systems has garnered growing interest in recent years due to the need to diversify the energy mix and reduce dependence on conventional sources. Recent re-search shows that the country possesses significant, yet underutilized, solar resources, especially in urban and peri-urban areas where the installation of rooftop photovoltaic systems could significantly contribute to local energy generation [4]. However, tech-nical, economic, and regulatory challenges persist that limit the widespread adoption of these technologies, making it essential to develop studies to accurately quantify the available solar potential and support the planning of future photovoltaic projects [5,6].
The technical and economic viability of photovoltaic systems depends directly on the availability and variability of the solar resource at the installation site. For this reason, the detailed characterization of solar irradiation is a fundamental step in the planning, design, and operation of solar power generation projects. An inadequate es-timation of the available resource can lead to significant errors in evaluating energy production, thereby affecting the profitability and reliability of photovoltaic systems. Several studies have demonstrated that the temporal variability of solar radiation can exhibit significant differences across regions with distinct geographical and climatic characteristics, making it essential to conduct specific analyses for each area of interest [5,7].
In addition to the magnitude of the solar resource, it is equally important to un-derstand its temporal behavior across different scales of analysis. The evaluation of hourly, daily, monthly, and annual patterns allows for the identification of peak gen-eration periods, seasonal variations, and potential climatic anomalies that influence the performance of photovoltaic systems. In tropical regions near the equator, such as Ecuador, seasonal variability is typically lower than in mid-latitudes; however, factors such as cloud cover, atmospheric humidity, and precipitation regimes can significantly alter the incident irradiance on the Earth's surface. Therefore, spatiotemporal analysis of the solar resource constitutes an essential tool for optimizing energy planning and reducing the uncertainty associated with future distributed generation projects [5,8].
The availability of reliable meteorological data constitutes one of the main chal-lenges for assessing solar potential in numerous regions of the world. Although ground-based stations provide direct measurements of climatic variables, their spatial coverage is typically limited, especially in developing countries where monitoring networks face technical, economic, and operational constraints. In this context, satel-lite and reanalysis products have gained increasing relevance due to their ability to provide continuous, homogeneous, and long-term information on atmospheric varia-bles related to solar power generation [8,9].
Among the most widely used platforms for energy applications, the Prediction of Worldwide Energy Resources (NASA POWER) stands out, developed by the Langley Research Center of the National Aeronautics and Space Administration (NASA). This platform integrates satellite observations, atmospheric models, and data assimilation techniques to provide meteorological and solar data at various temporal and spatial resolutions. Currently, NASA POWER offers free access to variables of interest for en-ergy applications—including global solar irradiance, air temperature, relative humid-ity, wind speed, and precipitation, among many others—enabling the development of climate characterization studies and the assessment of photovoltaic potential in re-gions lacking sufficient instrumental records [8,9].
Several studies have validated the utility of NASA POWER data for renewable energy research across diverse climatic conditions. Quansah et al. [8], upon evaluating NASA POWER products in the tropical regions of Ghana, concluded that these da-tasets constitute a reliable alternative for solar resource estimation and energy analysis in regions with limited meteorological infrastructure. Similarly, Demir [10] employed satellite data and artificial intelligence techniques for solar radiation prediction, ob-taining satisfactory results that demonstrate the potential of these data sources for advanced energy applications. These advantages have driven the increasing adoption of satellite data in research focused on photovoltaic system planning, climate studies, and the development of energy forecasting tools.
In recent years, machine learning (ML) has established itself as one of the most promising tools for the analysis and forecasting of complex energy variables due to its ability to identify nonlinear patterns and hidden relationships within large volumes of data. Unlike traditional statistical models, machine learning algorithms can capture the simultaneous interaction among multiple meteorological and energy variables, significantly improving prediction accuracy in renewable generation systems [7,11]. As a result, these techniques have been widely adopted in applications related to solar irradiance prediction, photovoltaic power forecasting, electricity demand, and energy management in smart grids.
Several studies have reported satisfactory results when employing supervised learning algorithms for energy resource forecasting. Benitez and Singh [7], in a recent review on machine learning applications for photovoltaic and wind systems, identified that models such as Random Forest, Gradient Boosting, and XGBoost exhibit high lev-els of accuracy and robustness against the inherent variability of renewable sources. Similarly, Gaboitaolelwe et al. [12] concluded that the incorporation of meteorological variables—such as solar irradiance, temperature, relative humidity, and wind speed—considerably improves the predictive capacity of photovoltaic generation models. These results demonstrate the importance of having extensive climate data-bases with high temporal resolution for the proper training of predictive algorithms.
The increasing availability of hourly data from satellite platforms has driven the development of advanced models for energy forecasting. Jeon et al. [13] demonstrated that incorporating spatiotemporal structures into machine learning models signifi-cantly improves the hourly prediction of solar irradiance, while Salman et al. [5] re-ported that hybrid approaches based on deep learning more efficiently capture the temporal dynamics of renewable resources. Furthermore, Tandon et al. [11] showed that supervised learning algorithms constitute effective tools for estimating solar irra-diance in regions with high meteorological variability, providing valuable information for the planning and operation of photovoltaic systems.
In the field of distributed generation, the ability to accurately predict the future availability of the solar resource acquires strategic importance, as it allows for opti-mizing the operation of photovoltaic systems, improving energy management, and reducing the uncertainty associated with the integration of renewable sources into power grids. For this reason, the development of predictive models based on machine learning has become a priority research line within the energy sector, especially in re-gions where there is still a limited availability of long-term studies integrating climate analysis, solar resource assessment, and photovoltaic generation forecasting [3,12,14].
Despite the notable growth in research related to solar resource assessment and photovoltaic generation forecasting using machine learning techniques, significant knowledge gaps still persist, especially in tropical regions of Latin America. Most re-cent studies have focused on the development of predictive models applied to regions with extensive meteorological monitoring networks or countries with a high penetra-tion of renewable technologies, whereas research oriented toward tropical zones with limited availability of observational data remains relatively scarce [7,12,15]. This sit-uation is particularly relevant in Ecuador, where the solar potential presents distinct characteristics due to the combined influence of topographic, climatic, and atmos-pheric factors associated with its geographical location near the equator.
Furthermore, although several studies have employed satellite datasets such as NASA POWER for solar resource characterization, much of this research has been conducted using time series with daily or monthly resolution, which limits the detailed understanding of the hourly variability necessary for advanced distributed photovol-taic generation applications [10,15]. Similarly, studies focusing on Ecuador have pri-marily concentrated on assessing urban photovoltaic potential, analyzing the regula-tory framework for distributed generation, or identifying barriers to the adoption of photovoltaic systems. Consequently, there is a limited amount of research that simul-taneously integrates long-term spatiotemporal analysis, hourly satellite data, and modern machine learning techniques for photovoltaic generation forecasting [4,6,16].
In particular, no specific studies were identified for the canton of La Maná that combine a climatic and solar characterization based on long-term hourly records with predictive models oriented toward distributed generation applications. Considering the growing need to diversify the Ecuadorian energy mix and promote the harnessing of renewable resources at the local scale, it is necessary to conduct research that allows for a more accurate quantification of the available solar potential and to evaluate the ability of machine learning techniques to anticipate the future behavior of photovolta-ic generation under real-world climatic conditions.
In this context, the present study aims to conduct a spatiotemporal analysis of the solar resource and develop predictive models for distributed photovoltaic generation using machine learning techniques applied to hourly satellite data obtained from the NASA POWER platform for the canton of La Maná, Ecuador. To this end, a dataset comprising 105,168 hourly records for the 2014–2025 period was utilized, including meteorological and solar variables relevant to the estimation of photovoltaic potential. Additionally, the temporal patterns of the solar resource were analyzed across differ-ent time scales, and the ability of machine learning models to forecast the future be-havior of photovoltaic generation was evaluated. The ultimate purpose is to generate technical information that contributes to local energy planning and the strengthening of distributed generation strategies based on renewable sources.
2. Materials and Methods
2.1. Study Area
The present study was conducted in the canton of La Maná, located in the province of Cotopaxi, Ecuador. This locality is situated in the western region of the country, constituting a transition zone between the Andean and coastal regions. Its geographical location near the equator favors a relatively uniform availability of solar radiation throughout the year, a characteristic that makes it an area of interest for the development of distributed photovoltaic generation projects [4,5].
For the analysis, the geographical coordinates 0.946269° S and 79.238603° W were considered as a reference point, being representative of the canton's urban area. La Maná features a humid subtropical climate characterized by moderate temperatures, high relative humidity levels, and a marked influence of cloud cover associated with tropical atmospheric systems. These climatic conditions have a direct impact on the availability of the solar resource and the energy performance of photovoltaic systems [8].
Based on the meteorological data analyzed for the 2014–2025 period, a mean temperature of 22.82 °C, an average relative humidity of 77.25 %, and a mean wind speed of 2.01 m/s were determined. These characteristics demonstrate a relative climatic stability throughout the study period, albeit with temporal variations associated with the precipitation and cloud cover cycles inherent to the region. Consequently, a detailed characterization of the solar resource is necessary to accurately assess the available photovoltaic potential and its potential utilization through distributed generation systems [4,8].
2.2. Acquisition of Hourly Satellite Data
The meteorological and solar data employed in this research were obtained through the Prediction of Worldwide Energy Resources (NASA POWER) platform, developed by the National Aeronautics and Space Administration (NASA). This platform integrates information derived from satellite observations, atmospheric models, and data assimilation techniques to provide time series of climate and energy variables intended for applications in renewable energy, agriculture, and environmental studies [16,17].
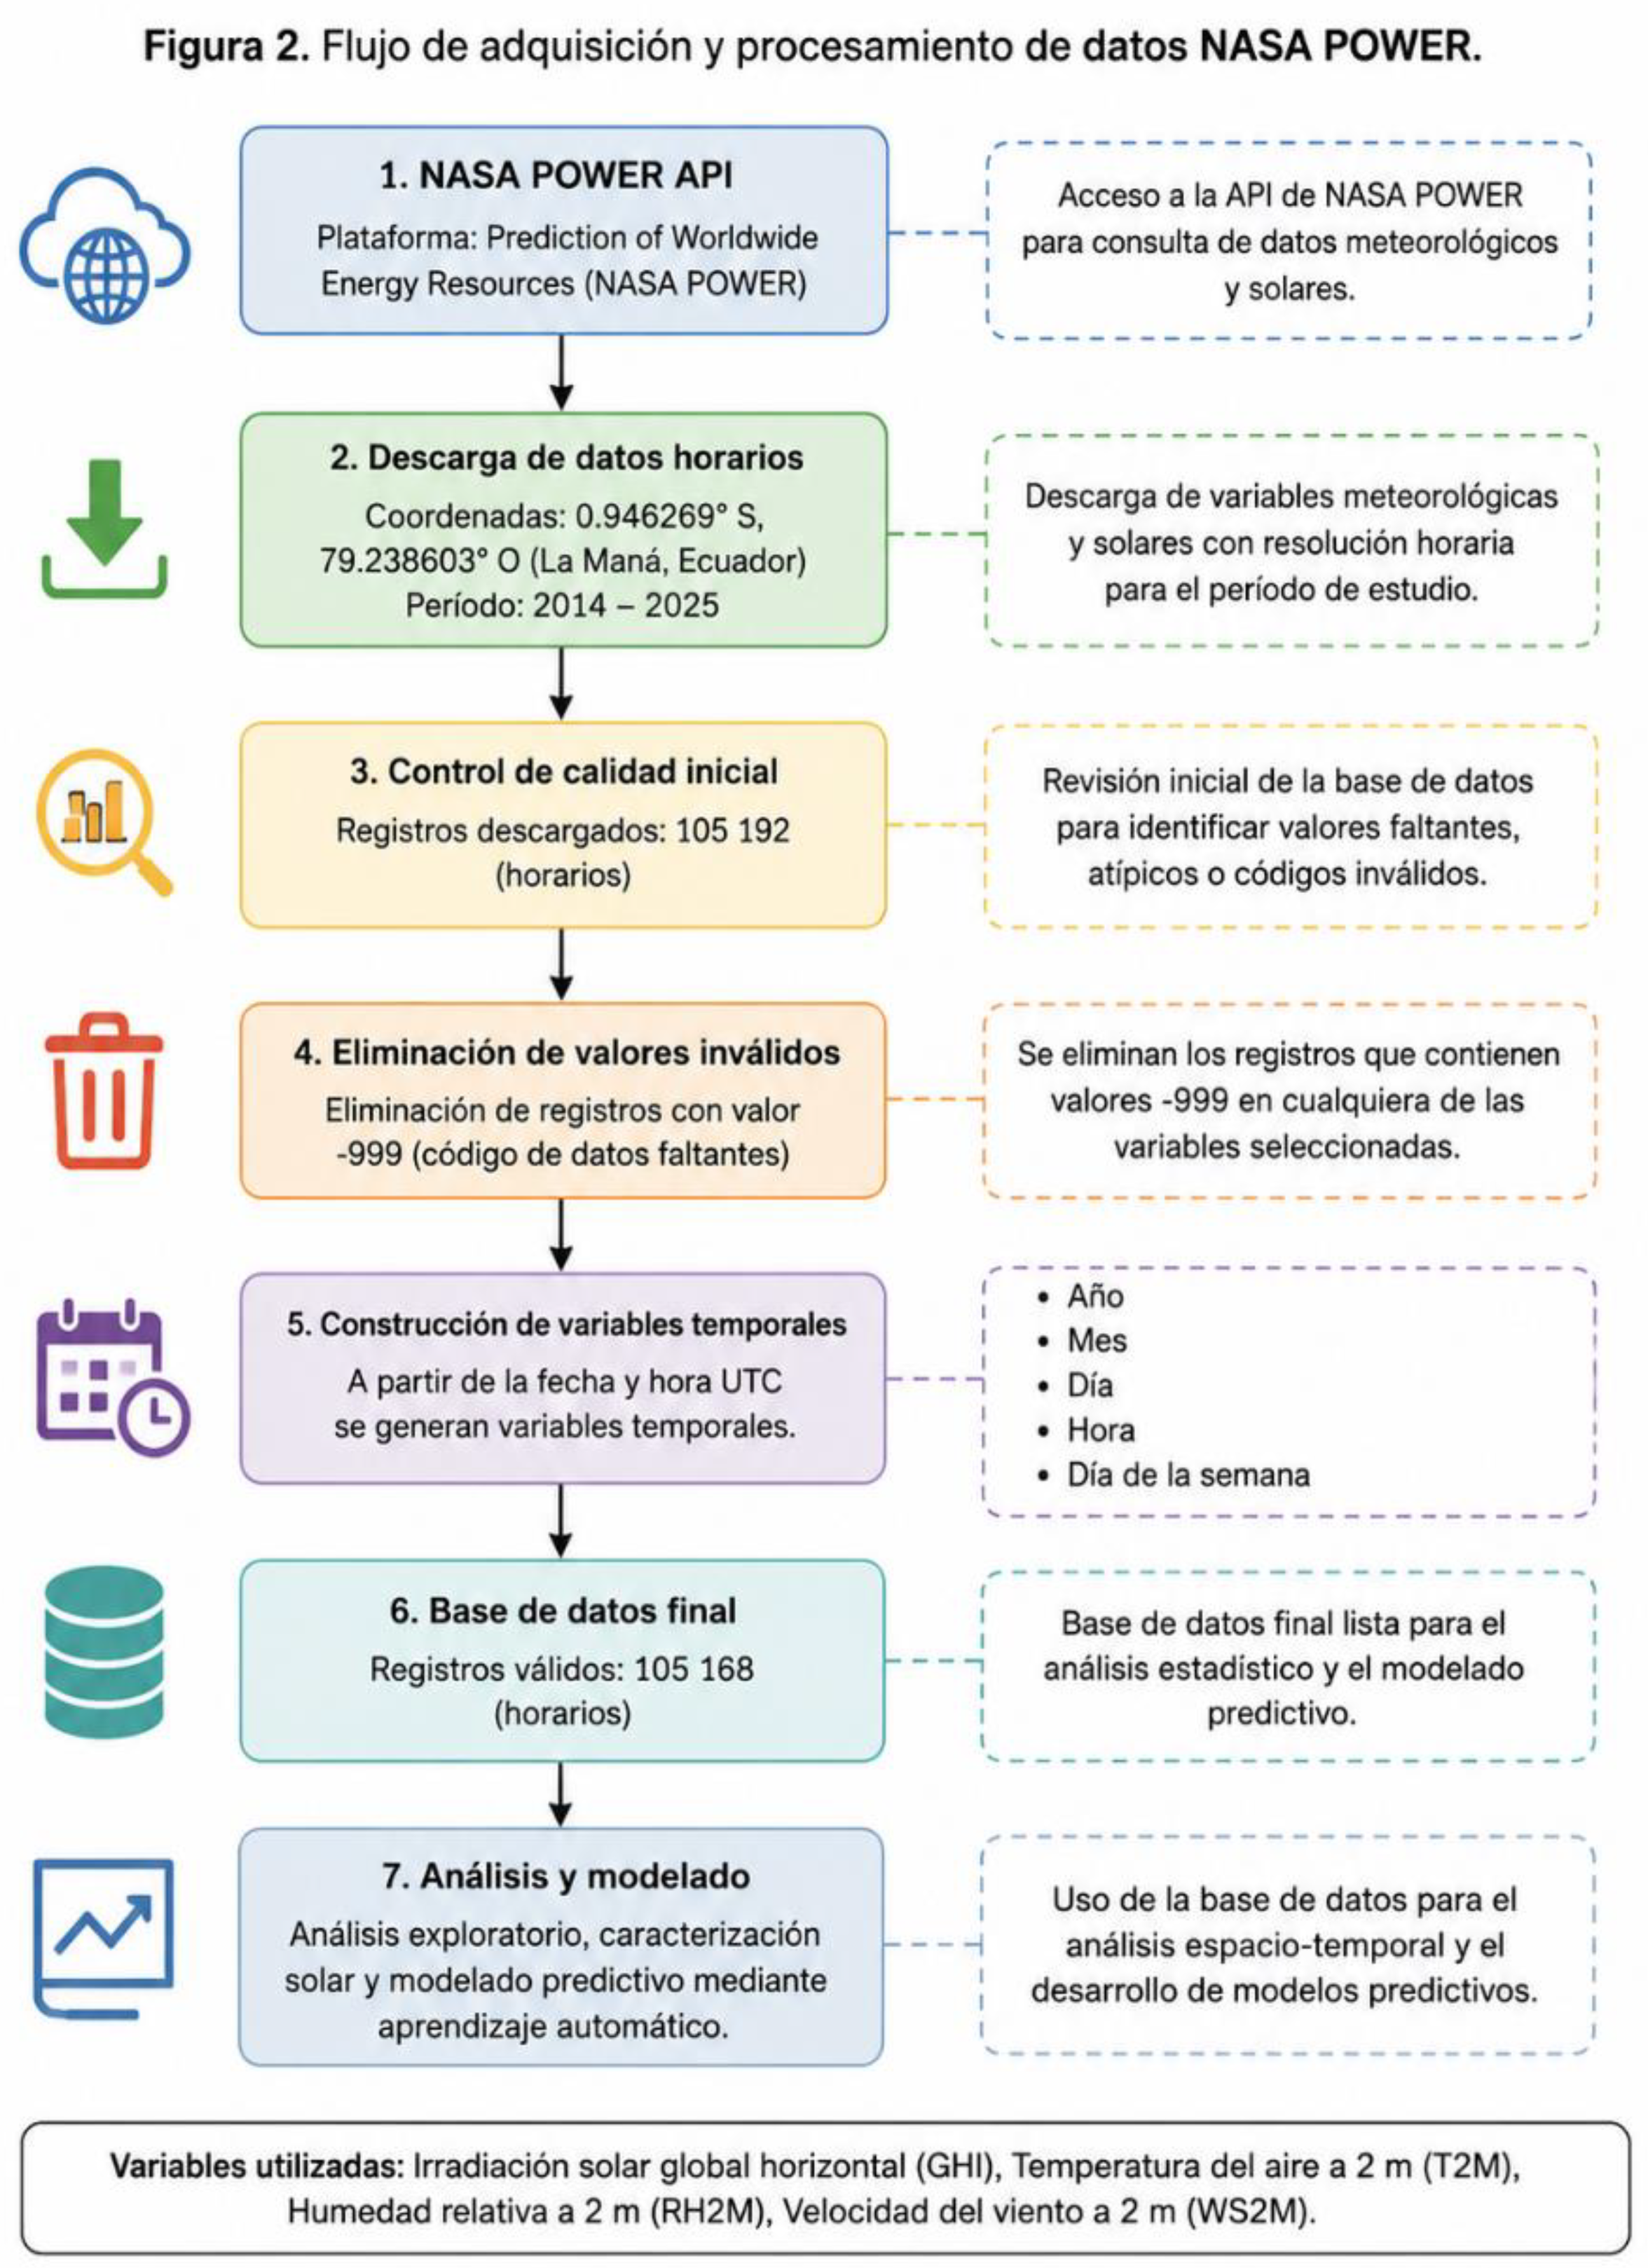
Data retrieval was performed through the NASA POWER Application Programming Interface (API) using the geographical coordinates corresponding to the canton of La Maná (0.946269° S, 79.238603° W). An hourly temporal resolution was selected to adequately capture the intraday variability of solar irradiance and associated meteorological variables, an essential condition for the development of spatiotemporal analyses and predictive models based on machine learning [6,8].
The analyzed period spanned from January 1, 2014, to December 31, 2025. Initially, 105,192 hourly records were downloaded. Subsequently, during the quality control stage, missing values encoded by NASA POWER as -999 were identified. Following the removal of these invalid records, the final dataset comprised 105,168 valid hourly observations used in the statistical analysis and the development of the predictive models.
The selected variables were global horizontal irradiance (GHI), air temperature at 2 m (T2M), relative humidity at 2 m (RH2M), and wind speed at 2 m (WS2M). These variables were chosen due to their direct influence on the energy performance of photovoltaic systems and their widespread use in research related to solar characterization and photovoltaic generation forecasting [6,12,14].
Table 2 presents a summary of the variables obtained from NASA POWER and utilized in this study.
El procedimiento para la adquisición y procesamiento de datos se lo realizó de la siguiente manera:
Figure 2.
NASA POWER data acquisition and processing workflow.
2.3. Data Processing and Cleaning
Once the data were downloaded from the NASA POWER platform, a data cleaning and conditioning process was carried out to ensure the quality, consistency, and reliability of the dataset used in the subsequent analysis. The use of quality control procedures constitutes a fundamental step in research based on meteorological time series, since the presence of missing or inconsistent records can significantly affect the accuracy of statistical analyses and predictive models [6,8].
The data processing was developed using the Python programming language within the Google Colaboratory environment. Initially, the downloaded data were organized into tabular structures using the Pandas library, enabling the efficient management of the hourly records corresponding to the period from January 2014 to December 2025. Subsequently, a comprehensive review of the integrity of the selected meteorological variables was carried out, including global horizontal irradiance (GHI), air temperature, relative humidity, and wind speed [16,17].
The NASA POWER platform uses the value -999 to represent missing or unavailable data. Consequently, a systematic search for these records within the dataset was performed, and those observations containing invalid values in any of the analyzed variables were removed. This procedure is widely recommended in energy modeling and solar forecasting studies, as it prevents the introduction of biases during the training of machine learning algorithms and improves the robustness of the obtained results [12,14].

Table 3.
Summary of the data cleaning process applied to the NASA POWER dataset.
| Stage | Records |
| Initially downloaded records | 105 192 |
| Removed records (-999) | 24 |
| Final valid records | 105 168 |
| Analyzed period | 2014–2025 |
| Temporal resolution | Hourly |
Subsequently, the time variable was converted to the DateTime format to facilitate the extraction of relevant chronological features. From this variable, new temporal features corresponding to the year, month, day, hour, and day of the week were generated. The incorporation of temporal variables is a standard practice in research focused on spatiotemporal analysis and the development of time-series-based predictive models, as it allows capturing seasonal patterns, daily cycles, and long-term trends present in meteorological and energy data [7,9,13].
After completing the data cleaning and transformation process, the final dataset comprised 105,168 valid hourly records. This information was utilized to develop the spatiotemporal characterization of the solar resource in La Maná and for the training of the machine learning models employed in the forecasting of distributed photovoltaic generation presented in the subsequent sections [5,7,12,15].
2.4. Spatiotemporal Analysis of the Solar Resource
To characterize the behavior of the available solar resource in the canton of La Maná, a spatiotemporal analysis was conducted using the hourly dataset obtained from NASA POWER for the 2014–2025 period. The characterization of the solar resource constitutes a fundamental step in the assessment of photovoltaic potential, as it allows for the identification of temporal variability patterns, long-term trends, and favorable conditions for solar-based electricity generation [8,9].
Initially, descriptive statistics were calculated for the main meteorological and solar variables used in the study. Table 4 presents the mean values, standard deviations, minimum and maximum values observed for global horizontal irradiance (GHI), air temperature, relative humidity, and wind speed. These indicators provide an overview of the prevailing climatic conditions in the study area and constitute the basis for subsequent analyses [8].
The results show that global solar irradiance exhibits high temporal variability, a common characteristic in tropical regions influenced by cloud cover and precipitation processes. Furthermore, the analyzed meteorological variables demonstrate relative climatic stability throughout the study period, a favorable condition for energy harnessing using photovoltaic systems [8,10].
Subsequently, the average behavior of solar irradiance on an hourly scale was analyzed. Figure 4 displays the mean hourly profile of solar irradiance along with the interquartile range associated with each hour of the day. It can be observed that irradiance values begin to increase at approximately 06:00 h, reaching their maximum around noon and progressively decreasing during the afternoon hours. This behavior aligns with the expected pattern of solar availability in regions near the equator and is consistent with studies conducted in other tropical zones [8,15].
Figure 3.
Mean hourly profile of global solar irradiance (GHI) in La Maná during the 2014–2025 period.
Figure 3.
Mean hourly profile of global solar irradiance (GHI) in La Maná during the 2014–2025 period.
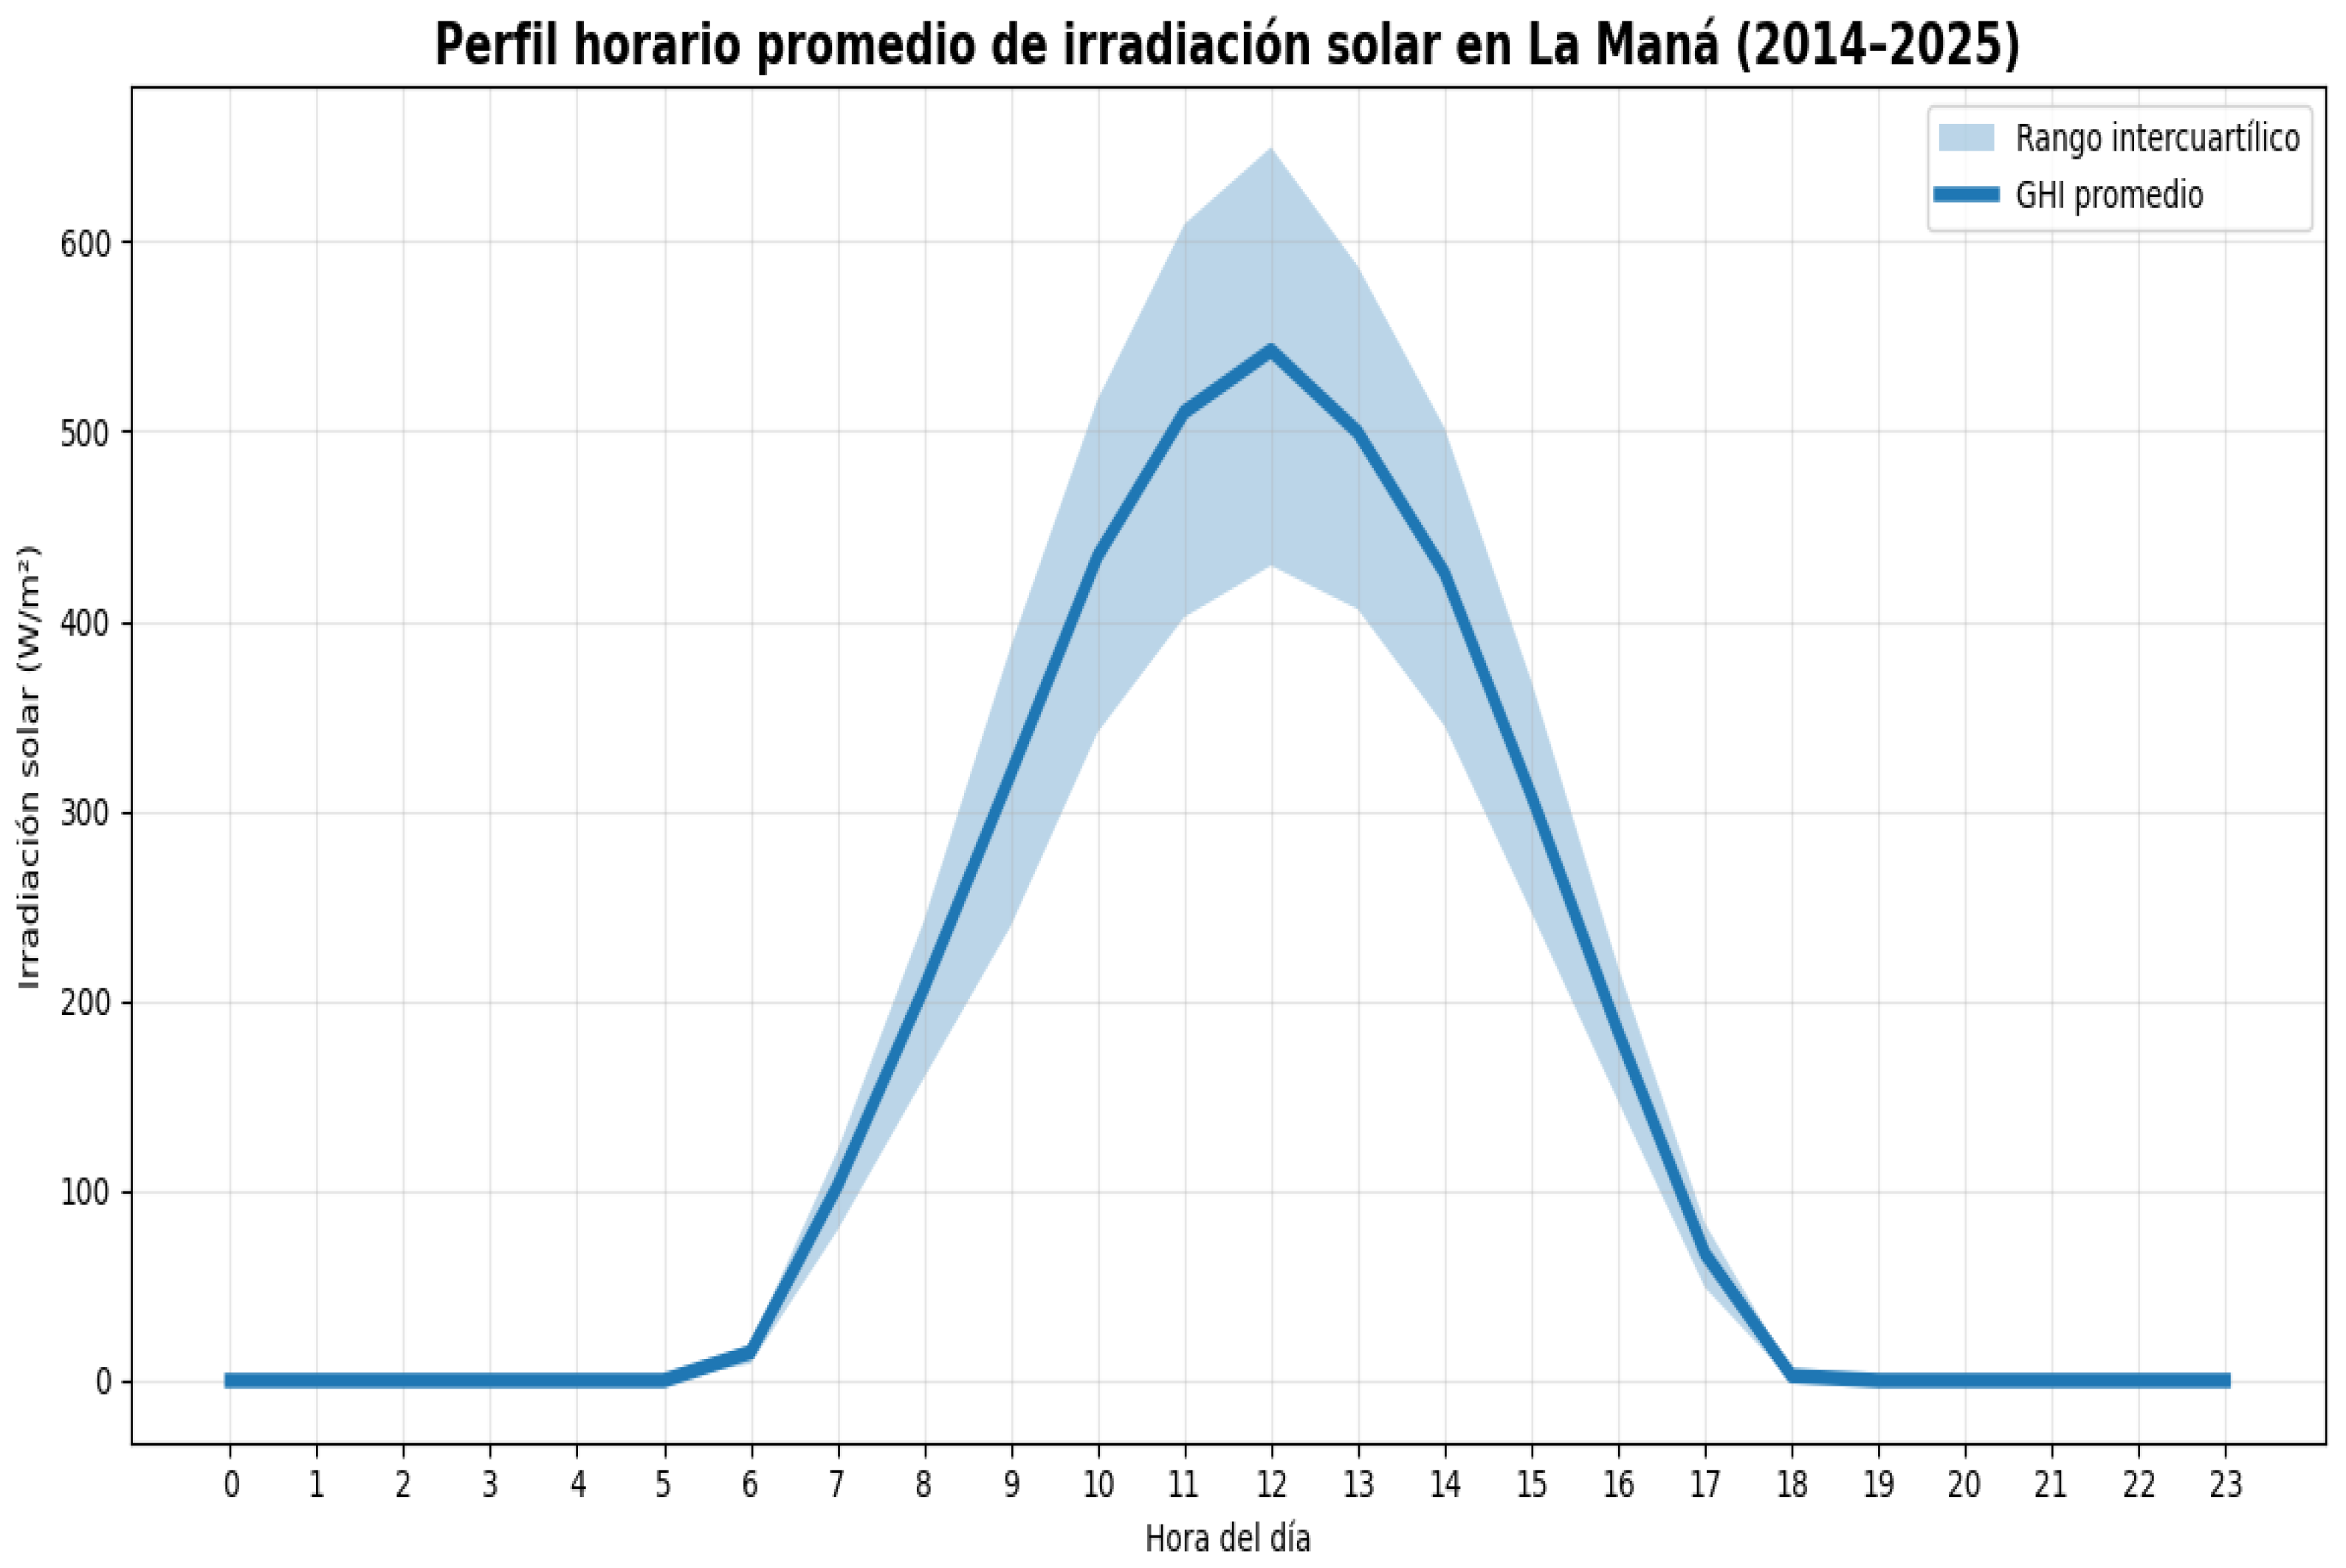
Figure 4.
Hourly and monthly distribution of average global solar irradiance in La Maná during the 2014–2025 period.
Figure 4.
Hourly and monthly distribution of average global solar irradiance in La Maná during the 2014–2025 period.
The width of the interquartile range observed during the central hours of the day demonstrates a greater dispersion of irradiance values, primarily associated with variations in cloud cover and local atmospheric phenomena. This characteristic highlights the importance of considering long-term hourly information for the accurate assessment of the solar resource and the development of robust predictive models [9,13].
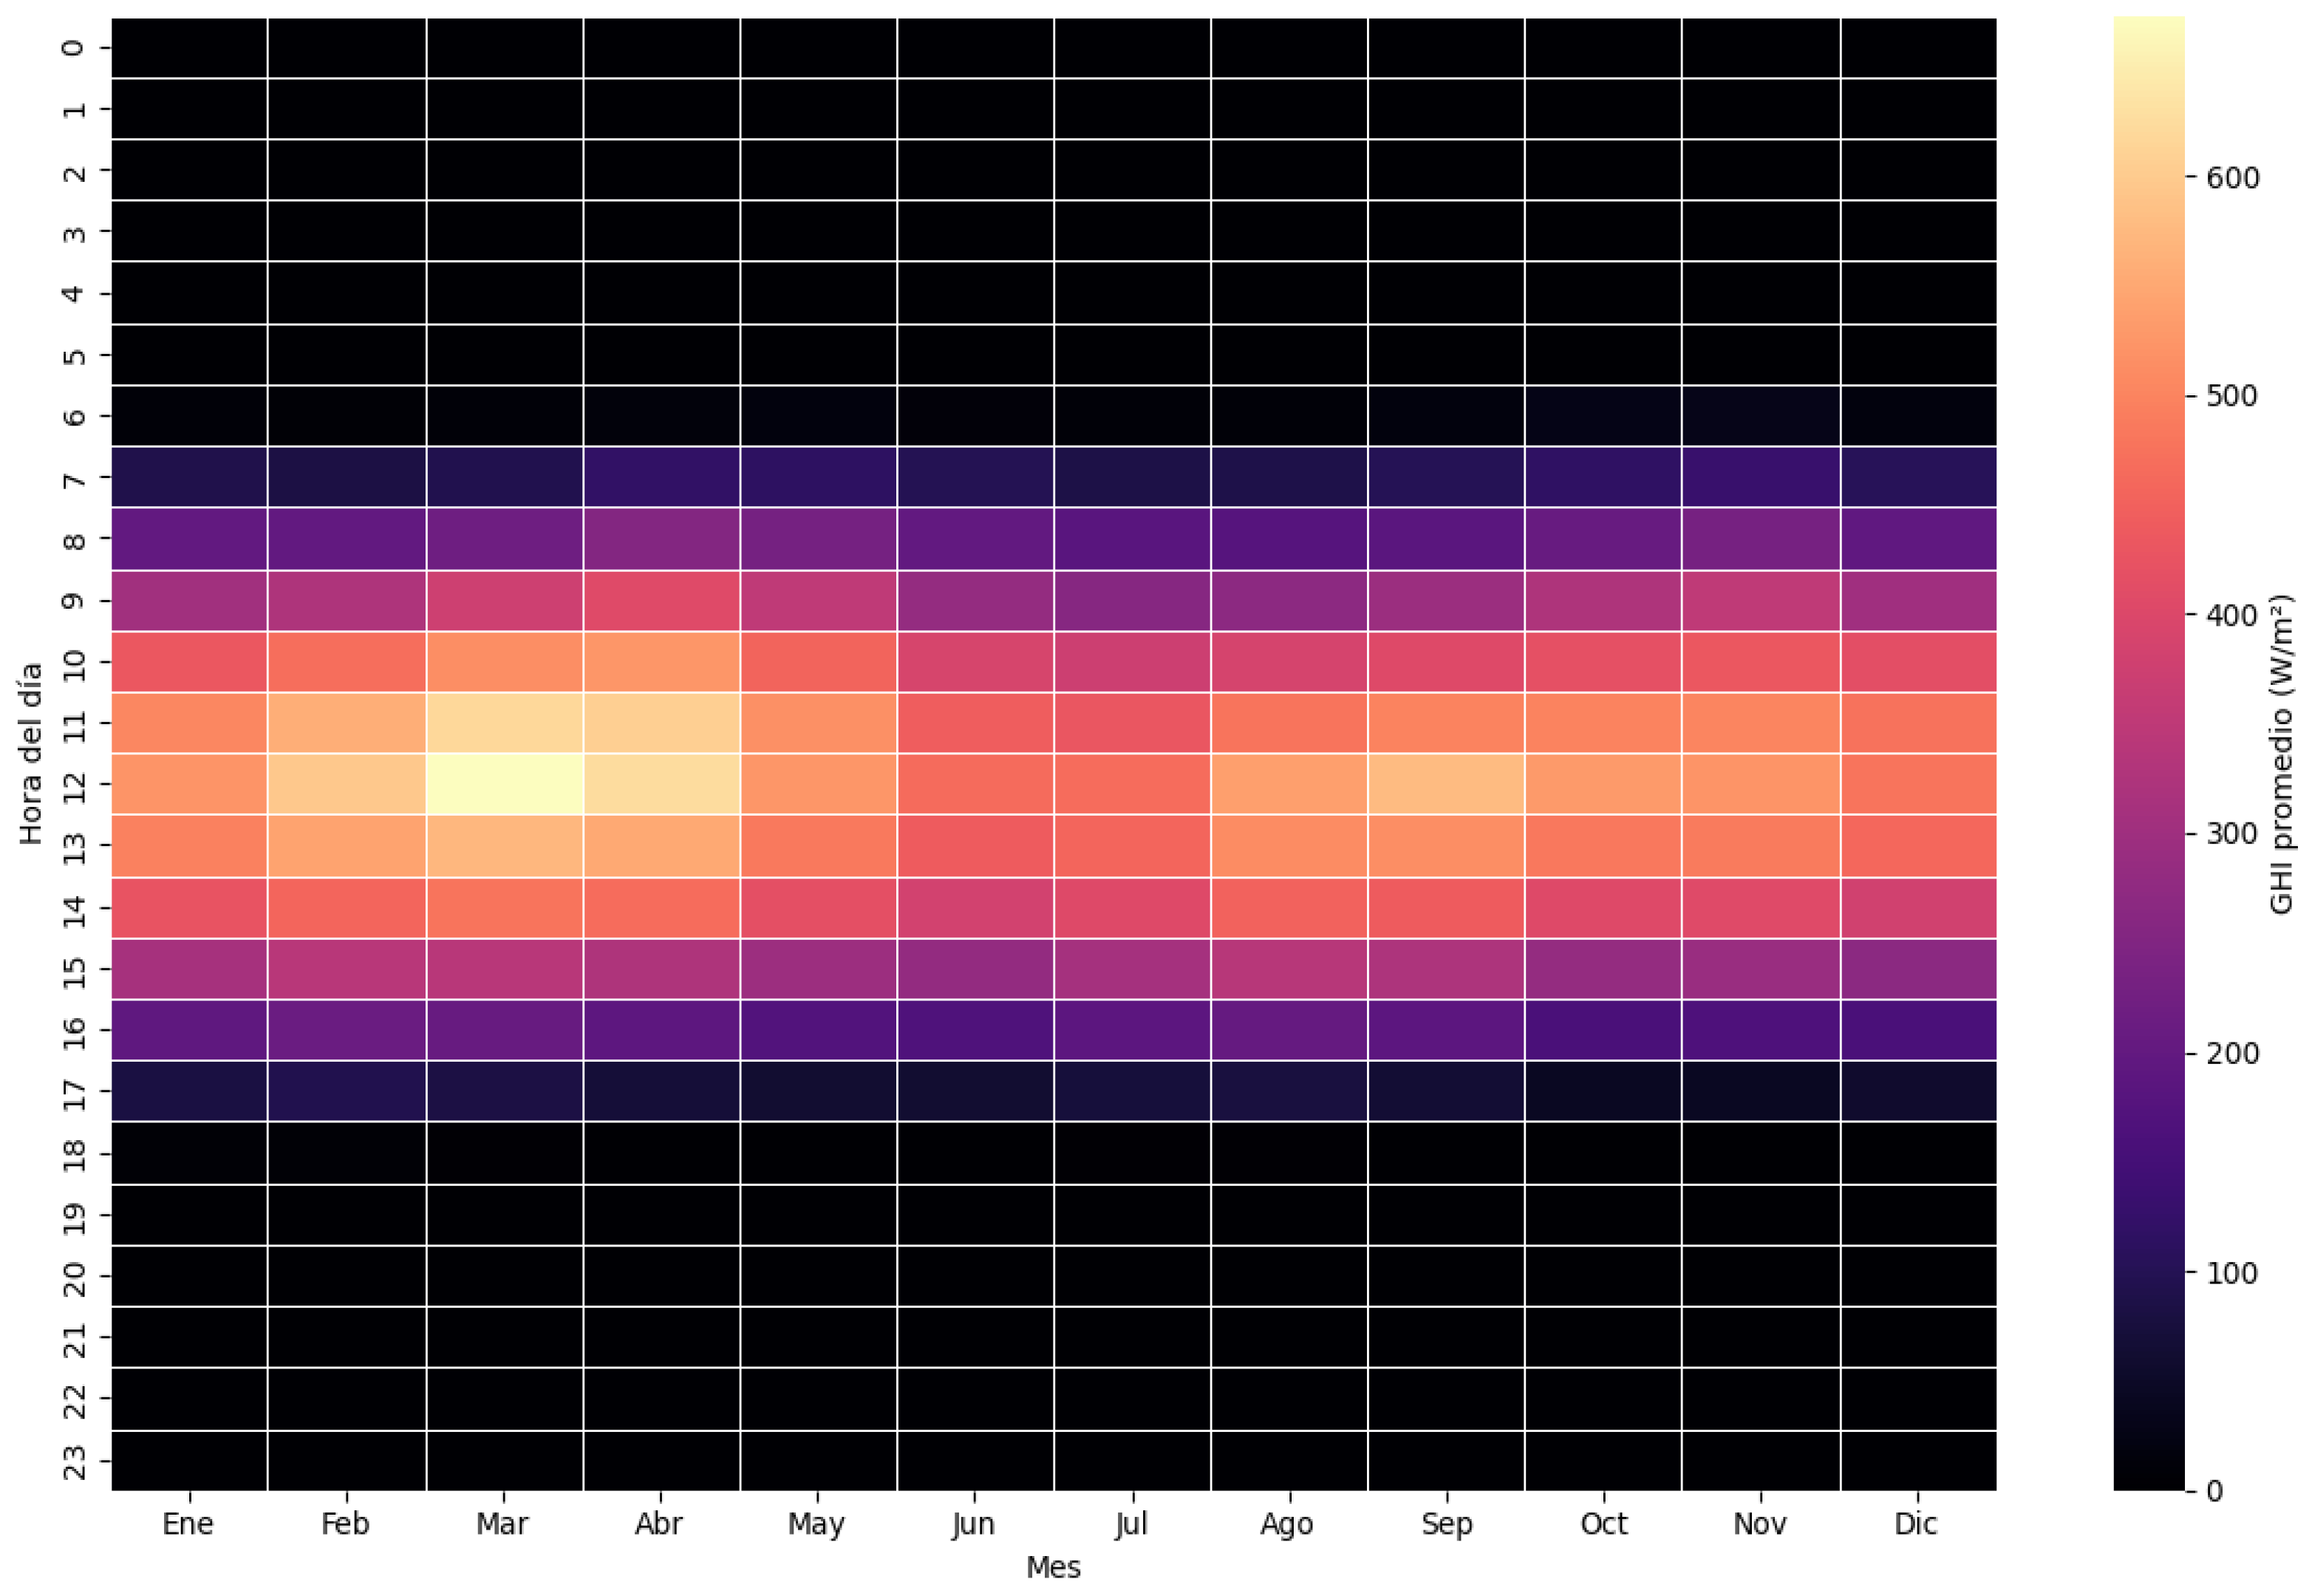
In order to simultaneously evaluate the hourly and seasonal variability of the solar resource, an average irradiance matrix organized by hours of the day and months of the year was constructed. Figure 5 presents the spatiotemporal distribution of global solar irradiance through a heatmap generated from the hourly records corresponding to the 2014–2025 period.
In order to simultaneously analyze the hourly and seasonal variability of the solar resource, an average irradiance matrix organized by hours of the day and months of the year was constructed. Figure 5 displays the spatiotemporal distribution of global solar irradiance obtained from the 105,168 analyzed hourly records. It can be observed that the highest irradiance levels are concentrated between 10:00 h and 14:00 h, reaching peak values near noon. Furthermore, the months between February and April present the highest mean values, while June, July, and August show a slight reduction in available irradiance. Nevertheless, the observed monthly variation is relatively moderate, demonstrating the low seasonality characteristic of regions near the equator [4,8].
It can be observed that the highest irradiance levels are concentrated between 10:00 h and 14:00 h, reaching peak values near noon. Additionally, the months between February and April present the highest average irradiance values, while the months of June, July, and August show a slight reduction in the available solar resource. Nevertheless, the observed difference between months is relatively moderate, demonstrating a lower seasonality compared to regions located in mid-latitudes.
These results confirm that the geographical location of La Maná favors a relatively uniform availability of the solar resource throughout the year, a particularly favorable condition for distributed generation applications, as it reduces seasonal fluctuations in energy production and enhances the stability of photovoltaic systems [4,8].
In order to assess the interannual stability of the available solar resource in La Maná, annual descriptive statistics for global horizontal irradiance (GHI) were calculated for the 2014–2025 period. Table 5 summarizes the mean values, standard deviations, minimum and maximum values observed for each analyzed year.
The results show that the annual mean solar irradiance values ranged between 271.93 W/m² and 299.44 W/m². The highest mean value was recorded in the year 2023, while the lowest mean corresponded to the year 2022. However, the observed differences between years are relatively small, demonstrating high interannual stability of the available solar resource in the study area.
Additionally, the annual maximum irradiance values exceeded 900 W/m² in all the analyzed years, reaching a peak of 996.55 W/m² in 2017. These results demonstrate the existence of favorable conditions for photovoltaic generation throughout the evaluated period. Moreover, the recorded standard deviations exhibit similar magnitudes across years, suggesting a relatively consistent behavior of long-term solar variability.
In order to visualize the annual statistical distribution of solar irradiance in greater detail, violin plots were generated for each year of the study period. This representation allows for the simultaneous analysis of the probability density, dispersion, median, and distribution of the recorded data.
Figure 6 demonstrates a notable similarity among the annual distributions of solar irradiance. The shapes observed in the violin plots exhibit consistent patterns throughout the entire analysis period, indicating that there are no significant changes in the availability of the solar resource across the different years studied. This behavior confirms the results previously obtained in Table 5 and reinforces the hypothesis of interannual stability of the photovoltaic potential in La Maná.
Although slight variations are identified in the position of the medians and the spread of the distributions, these differences are minor compared to the total variability observed within each year. In particular, the years 2015, 2017, 2020, and 2023 present distributions slightly shifted toward higher irradiance values, while 2022 exhibits a moderate reduction compared to the rest of the period. Nevertheless, these fluctuations do not substantially alter the overall behavior of the solar resource.
The results obtained indicate that the availability of solar irradiance in La Maná has remained relatively stable over the past twelve years, a highly favorable condition for the implementation of distributed generation photovoltaic systems. The observed low interannual variability contributes to reducing the uncertainty associated with the estimation of future energy production and constitutes a positive factor for the planning and economic assessment of photovoltaic projects in the region [4,5,8].
2.5. Assessment of Hourly Photovoltaic Potential
In order to assess the available photovoltaic potential in the canton of La Maná, global horizontal irradiance (GHI) was employed as the primary variable for analysis. This variable represents the incident solar energy on a horizontal surface and constitutes one of the most widely used indicators for the preliminary assessment of the solar resource in photovoltaic applications [4,8].
In contrast to a direct estimation of electricity generation, this study focuses on the analysis of hourly photovoltaic potential, avoiding the introduction of additional assumptions related to module tilt, orientation, photovoltaic technology, conversion efficiency, electrical losses, or Performance Ratio. This methodological decision allows the analysis to focus on the physical availability of the solar resource and generate reproducible results from hourly satellite data [16,17].
The hourly GHI dataset was utilized to characterize the temporal behavior of the solar resource across different analysis scales: hourly, monthly, annual, and multi-year. This approach allows for the identification of the hours with the highest solar availability, the months with the best conditions for photovoltaic applications, and the interannual stability of the resource during the 2014–2025 period.
Furthermore, the GHI variable was considered as the primary input indicator for the subsequent development of machine learning-based predictive models. Several studies have highlighted that solar irradiance is the most relevant variable for the assessment and prediction of the energy performance of photovoltaic systems, due to its direct relationship with potential solar electricity production [7,12,14].
Consequently, the photovoltaic potential in this research is interpreted as the temporal availability of the usable solar resource for future distributed photovoltaic systems, expressed through the hourly global horizontal irradiance values obtained from NASA POWER.
2.6. Predictive Modeling Using Machine Learning
In order to analyze the predictive capability of machine learning techniques applied to the solar resource, models were developed to estimate the future behavior of global horizontal irradiance (GHI) using meteorological and temporal information obtained from the NASA POWER database. The use of machine learning algorithms has demonstrated promising results in applications related to the prediction of renewable energy resources due to their ability to model complex non-linear relationships present in atmospheric systems [7,9,12,15].
Air temperature (T2M), relative humidity (RH2M), and wind speed (WS2M), as well as the temporal variables derived from data processing—including year, month, day, and hour—were considered as predictor variables. The target variable corresponded to global horizontal irradiance (GHI), considered the primary indicator of the available photovoltaic potential in the study area [8,14].
Prior to training the models, the database was divided into training, validation, and testing subsets. In order to preserve the temporal structure of the information and prevent data leakage between datasets, the split was performed following a chronological criterion. Specifically, 70% of the records were used for training, 15% for validation, and the remaining 15% for independent testing. This strategy is widely recommended in time series studies because it allows for the evaluation of the models' generalization capability on unseen data during the learning process [7,9].
To evaluate the predictive performance, statistical metrics commonly used in energy forecasting research were employed, including Mean Absolute Error (MAE), Root Mean Square Error (RMSE), and the coefficient of determination (). These metrics allow for the quantification of the models' accuracy and the objective comparison of different machine learning algorithms [12,18].
To evaluate the predictive performance of the developed models, three metrics widely used in solar irradiance and photovoltaic power forecasting studies were employed: Mean Absolute Error (MAE), Root Mean Square Error (RMSE), and the coefficient of determination (). These metrics allow for the quantification of the predictions' accuracy and the objective comparison of the performance of different machine learning algorithms [12,18].
The accuracy of the models was evaluated using Mean Absolute Error (MAE), Root Mean Square Error (RMSE), and the Coefficient of Determination (), defined by Equations (1)–(3). These metrics allow for the quantification of both the mean prediction error and the explanatory power of the machine learning models [10,18].
Mean Absolute Error (MAE) measures the average magnitude of the absolute errors between the observed values and the values predicted by the model. This metric provides a direct interpretation of the average error made during prediction and is expressed by Equation (1) [18]:
where is the total number of observations, represents the observed value of solar irradiance, corresponds to the value estimated by the model, and represents each observation of the sample.
On the other hand, the Root Mean Square Error (RMSE) gives a higher penalty to large errors, being particularly useful for identifying models sensitive to significant deviations from the actual values. Its mathematical formulation is presented in Equation (2) [12,18]:
where is the root mean square error, is the total number of observations, represents the observed value of solar irradiance, and corresponds to the value estimated by the model.
Finally, the coefficient of determination () quantifies the proportion of the target variable's variability explained by the predictive model. Values of close to 1 indicate a high goodness of fit, while values close to 0 reflect a limited explanatory power. This metric was calculated using Equation (3) [7,18]:
where represents the mean value of the observations.
The described metrics were utilized to compare the performance of the various evaluated algorithms and to select the model with the highest predictive capability for estimating the photovoltaic potential in the canton of La Maná.
2.7. Application of Predictive Modeling Using Machine Learning
In order to evaluate different machine learning approaches for the prediction of photovoltaic potential, four regression algorithms widely used in energy forecasting applications were implemented: Multiple Linear Regression (LR), Random Forest (RF), Gradient Boosting Regressor (GBR), and eXtreme Gradient Boosting (XGBoost). The selection of these models was based on their extensive use in research related to solar irradiance and photovoltaic generation forecasting, as well as their ability to model linear and non-linear relationships between meteorological and energy variables [7,9,12,18].
Linear Regression was considered as a baseline model due to its mathematical simplicity and high interpretability. On the other hand, the Random Forest, Gradient Boosting, and XGBoost algorithms belong to the family of decision tree-based ensemble methods, which have demonstrated superior performance in renewable energy forecasting problems due to their ability to capture complex patterns and non-linear relationships present in atmospheric data [9,12,15].
The dataset was chronologically divided into three independent subsets. The records spanning from 2014 to 2021 were used for training, those corresponding to 2022–2023 for validation, and the records from 2024–2025 for testing. This strategy allows for the preservation of the temporal structure of the series and the evaluation of the models' true generalization capability against future observations, preventing data leakage between datasets [18].
In order to adequately represent the periodic nature of solar and seasonal cycles, trigonometric transformations of the temporal variables were incorporated using sine and cosine functions. This procedure is widely used in time series analysis because it allows for the correct modeling of cyclical phenomena without introducing artificial discontinuities between consecutive values, such as those that occur between hours 23 and 0 or between the months of December and January [9,13].
Finally, the models were trained using air temperature, relative humidity, wind speed, and the temporal attributes derived from the observation date and time as predictor variables. The target variable corresponded to global horizontal irradiance (GHI), considered as a representative indicator of the available photovoltaic potential in the study area. The results obtained by the different algorithms were subsequently compared using the MAE, RMSE, and metrics, in order to identify the model with the highest predictive capability for energy planning applications and distributed photovoltaic utilization in the canton of La Maná.
3. Results
3.1. Spatiotemporal Characterization of Photovoltaic Potential
The spatiotemporal analysis of the hourly NASA POWER dataset (2014–2025) revealed a consistent solar resource pattern in La Maná, Ecuador. The processed database comprised 105,168 hourly observations of global horizontal irradiance (GHI), air temperature, relative humidity, and wind speed, providing a robust basis for assessing photovoltaic potential under tropical climatic conditions.
The descriptive statistics indicated an average GHI of approximately 150.7 W/m², with maximum hourly values approaching 996.6 W/m², confirming the high solar resource availability in the study area. Air temperature exhibited an annual mean of 22.8 °C, while relative humidity averaged 77.3%, reflecting the warm and humid tropical environment characteristic of the region.
Figure 4 illustrates the mean hourly solar irradiance profile. As expected, solar radiation increased rapidly after sunrise, reached its maximum around solar noon, and gradually decreased toward sunset. Peak irradiance values occurred between 11:00 and 13:00, exceeding 540 W/m² on average. This daily behavior follows the solar geometry and demonstrates the suitability of the region for photovoltaic applications.
The monthly distribution of solar irradiance (Figure 5) showed only moderate seasonal variability throughout the year. Unlike higher-latitude regions, where solar resources fluctuate considerably between seasons, La Maná exhibited relatively stable irradiance levels due to its geographical location near the equator. This characteristic is advantageous for distributed photovoltaic systems because it contributes to more uniform annual energy availability.
Interannual analysis (Figure 6) further confirmed the temporal stability of the solar resource during the twelve-year study period. Although minor year-to-year variations were observed, no significant long-term decreasing or increasing trend was detected, indicating that photovoltaic resource availability remained stable over time.
3.2. Performance of Machine Learning Models
Four machine learning algorithms were evaluated to predict photovoltaic potential using hourly meteorological variables derived from NASA POWER: Multiple Linear Regression (MLR), Random Forest (RF), Gradient Boosting Regression (GBR), and Extreme Gradient Boosting (XGBoost).
Table 6 summarizes the predictive performance of each algorithm using Mean Absolute Error (MAE), Root Mean Square Error (RMSE), and the coefficient of determination (R²).
Among the evaluated algorithms, Gradient Boosting Regression achieved the highest predictive accuracy, with an MAE of 35.14 W/m², an RMSE of 68.44 W/m², and an R² value of 0.8875. XGBoost ranked second, followed by Random Forest, while Multiple Linear Regression produced the lowest performance.
These results demonstrate that ensemble learning techniques substantially outperform conventional linear approaches when modeling the nonlinear relationships between meteorological variables and solar irradiance. The superior performance of Gradient Boosting is mainly attributed to its capability to iteratively reduce prediction errors and capture complex interactions among predictor variables.
Figure 7 compares the predictive performance of the evaluated algorithms, highlighting the reduced prediction errors achieved by ensemble-based methods. Likewise, Figure 8 illustrates the relationship between observed and predicted irradiance values obtained using the Gradient Boosting model. Most predictions closely follow the one-to-one reference line, confirming the model's high predictive capability.
3.3. Influence of Meteorological Variables
Feature importance analysis was performed to investigate the relative contribution of each predictor variable to the machine learning model.
Initially, the cyclical hourly variables (Hour_sin and Hour_cos) dominated the prediction process because they represent the daily solar cycle. Since this deterministic component masked the influence of atmospheric variables, a second feature importance analysis was conducted excluding the hourly cyclical predictors.
The results (Figure 10) revealed that air temperature became the most influential meteorological variable, accounting for approximately 84% of the total feature importance. Relative humidity ranked second, while seasonal variables showed moderate contributions. Wind speed and calendar-related variables presented comparatively lower importance.
These findings indicate that, beyond solar geometry, atmospheric conditions strongly influence photovoltaic potential in tropical climates. In particular, temperature and humidity serve as indirect indicators of cloud cover and atmospheric transmissivity, explaining much of the observed irradiance variability.
3.4. Temporal Validation of the Selected Model
The temporal validation demonstrated that the Gradient Boosting model successfully reproduced the hourly evolution of solar irradiance throughout the testing period.
Figure 11 compares observed and predicted irradiance values for a representative period. The model accurately captured the onset of solar radiation after sunrise, the midday irradiance peak, and the gradual decline during the afternoon. Furthermore, the predicted series closely matched the temporal variability observed in the reference dataset.
Small discrepancies appeared mainly during episodes of rapidly changing cloud conditions, where short-term atmospheric fluctuations introduced additional uncertainty into the prediction process. Nevertheless, the model maintained high overall agreement with observations, confirming its robustness for photovoltaic potential assessment under tropical climatic conditions.
Overall, the integration of hourly NASA POWER satellite data with Gradient Boosting provides an effective and reliable methodology for photovoltaic potential prediction in regions where ground-based meteorological observations are scarce or unavailable.
4. Discussion
The results obtained confirm that the La Maná canton possesses a relatively stable solar resource at the interannual scale, characterized by a well-defined diurnal cycle governed primarily by solar geometry and a moderate seasonal variability typical of tropical equatorial regions. This behavior is consistent with previous studies conducted in low-latitude areas, where the limited annual variation in the solar zenith angle promotes a more uniform solar energy availability compared to temperate regions. From an energy planning perspective, such stability represents a significant advantage for the deployment and operation of distributed photovoltaic systems, as it reduces long-term uncertainties associated with electricity generation.
The use of the NASA POWER database enabled the assessment of solar resource availability despite the limited presence of ground-based meteorological monitoring stations. Although satellite-derived datasets inherently contain uncertainties related to atmospheric retrieval algorithms and spatial resolution constraints, the findings demonstrate that these products provide a reliable and robust information source for solar resource assessment in regions with scarce observational infrastructure. This capability is particularly relevant for developing countries, where the lack of high-resolution climatic data often constitutes a major barrier to renewable energy planning and project development.
Regarding predictive modeling, the results reveal that ensemble-based machine learning algorithms exhibit superior performance in capturing the nonlinear atmospheric processes governing global solar irradiance. The performance achieved by the Gradient Boosting model (R² = 0.8875, MAE = 35.14 W/m², RMSE = 68.44 W/m²) indicates that a substantial proportion of irradiance variability can be explained through the combined influence of astronomical and meteorological variables. The observed superiority over conventional linear approaches suggests that the complex interactions among temperature, humidity, and seasonal factors require advanced modeling techniques capable of representing nonlinear relationships and higher-order dependencies.
The feature importance analysis provided additional insight into the physical drivers of solar irradiance variability. As expected, solar geometry emerged as the dominant explanatory factor due to its direct influence on the amount of incoming solar radiation reaching the Earth's surface. However, after accounting for this dominant effect, air temperature was identified as the most influential meteorological variable, followed by relative humidity and seasonal components. This finding highlights the importance of local atmospheric processes in modulating photovoltaic potential and underscores the need to incorporate representative meteorological predictors to improve forecasting accuracy in tropical environments.
From an applied perspective, the integration of freely accessible satellite-derived data with machine learning techniques constitutes a promising methodological framework for regional energy assessment. The proposed approach not only enables the characterization of historical solar resource availability but also provides predictive tools that can support photovoltaic system planning, distributed energy resource management, and evidence-based policymaking aimed at accelerating the transition toward sustainable energy systems.
5. Conclusions
The analysis of 105,168 hourly records spanning the period 2014–2025 enabled a comprehensive characterization of the spatiotemporal behavior of the solar resource in La Maná canton, revealing high interannual stability and a well-defined diurnal pattern consistent with the climatic characteristics of tropical equatorial regions.
NASA POWER satellite-derived data proved to be a reliable source for photovoltaic potential assessment in areas with limited meteorological monitoring infrastructure, allowing long-term analyses with adequate climatic representativeness.
Among the evaluated machine learning approaches, ensemble-based algorithms significantly outperformed conventional linear models. In particular, the Gradient Boosting model achieved the highest predictive accuracy, with a coefficient of determination (R²) of 0.8875, a mean absolute error (MAE) of 35.14 W/m², and a root mean square error (RMSE) of 68.44 W/m², demonstrating a strong capability to model the temporal dynamics of solar irradiance under tropical climatic conditions.
Solar geometry was identified as the primary driver of global irradiance variability, whereas air temperature and relative humidity contributed significantly to improving model performance, providing a physically meaningful interpretation of the atmospheric processes influencing photovoltaic potential.
The proposed methodology, which integrates satellite-derived datasets, statistical analysis, and machine learning techniques, represents a scalable and transferable framework for photovoltaic resource assessment and forecasting in regions with similar climatic conditions. Consequently, it may serve as a valuable decision-support tool for renewable energy planning and the development of sustainable energy policies.
6. Patents
Author Contributions
Conceptualization, W.P.P.N.; methodology, W.P.P.N.; software, W.P.P.N.; validation, W.P.P.N., M.A.B.R., and F.R.R.B.; formal analysis, W.P.P.N.; investigation, W.P.P.N.; data curation, W.P.P.N.; visualization, W.P.P.N.; writing—original draft preparation, W.P.P.N.; writing—review and editing, M.A.B.R., F.R.R.B., W.A.H.O., P.J.V.C., J.I.C.B., Y.M.T., C.D.B.B., D.X.C.G., and W.P.P.N.; supervision, Y.M.T. and D.X.C.G.; project administration, W.P.P.N.; resources, M.A.B.R., F.R.R.B., W.A.H.O., P.J.V.C., and J.I.C.B. All authors have read and agreed to the published version of the manuscript.
Funding
This research received no external funding.
Data Availability Statement
Data Availability Statement: The datasets analyzed during the current study are publicly available through the NASA POWER Data Access Viewer at https://power.larc.nasa.gov/.
Acknowledgments
The authors acknowledge the support provided by Universidad Técnica de Cotopaxi and NASA POWER for providing open-access meteorological data.
During
the preparation of this manuscript, the authors used ChatGPT (OpenAI) to assist in language editing and text refinement. The authors reviewed and edited all generated content and take full responsibility for the final manuscript.
Conflicts of Interest
The authors declare no conflicts of interest.
References
- Benitez, I.B.; Singh, J.G. A comprehensive review of machine learning applications in forecasting solar PV and wind turbine power output. J. Electr. Syst. Inf. Technol. 2025, 12. [Google Scholar] [CrossRef]
- Colucci, R.; Mahgoub, I. Generalizable Solar Irradiance Prediction for Battery Operation Optimization in IoT-Based Microgrid Environments. J. Sens. Actuator Netw. 2025, 14, 3. [Google Scholar] [CrossRef]
- Cordova, D.; Marrero, S.; Quinatoa, C.; Leon, M. Prospects for distributed self-consumption generation in urban circuits with the use of photovoltaic systems. Front. Energy Res. 2025, 13, 1542501. [Google Scholar] [CrossRef]
- Demir, V. Evaluation of Solar Radiation Prediction Models Using AI: A Performance Comparison in the High-Potential Region of Konya, Türkiye. Atmosphere 2025, 16, 398. [Google Scholar] [CrossRef]
- Tandon, A.; Awasthi, A.; Charan, K.; Tandon, A.; Choudhury, T. Machine learning-driven solar irradiance prediction: ad-vancing renewable energy in Rajasthan. Discov. Appl. Sci. 2025, 7. [Google Scholar] [CrossRef]
- Giovanni, A.; Pernigotto, G.; Gasparella, A. Addressing Data Scarcity in Solar Energy Prediction with Machine Learning and Augmentation Techniques. Inf. Syst. 2024, 17. [Google Scholar] [CrossRef]
- Iheanetu, K.J. Solar Photovoltaic Power Forecasting: A Review. Sustainability 2022, 14, 17005. [Google Scholar] [CrossRef]
- Quansah, A.D.; et al. Assessment of solar radiation resource from the NASA-POWER reanalysis products for tropical climates in Ghana towards clean energy application. Sci. Rep. 2022, 12. [Google Scholar] [CrossRef] [PubMed]
- Salman, D.; Direkoglu, C.; Kusaf, M.; Fahrioglu, M. Hybrid deep learning models for time series forecasting of solar power. Neural Comput. Appl. 2024, 36, 9095–9112. [Google Scholar] [CrossRef]
- Gaboitaolelwe, J.; Zungeru, A.M.; Yahya, A.; Lebekwe, C.K.; Vinod, D.N.; Salau, A.O. Machine Learning Based Solar Pho-tovoltaic Power Forecasting: A Review and Comparison. IEEE Access 2023. [Google Scholar] [CrossRef]
- Tapia, M.; Ramos, L.; Heinemann, D.; Zondervan, E. Power to the city: Assessing the rooftop solar photovoltaic potential in multiple cities of Ecuador. Phys. Sci. Rev. 2023, 8, 2285–2319. [Google Scholar] [CrossRef]
- Jeon, H.J.; Choi, M.W.; Lee, O.J. Day-Ahead Hourly Solar Irradiance Forecasting Based on Multi-Attributed Spatio-Temporal Graph Convolutional Network. Sensors 2022, 22, 7179. [Google Scholar] [CrossRef] [PubMed]
- Masson, G.; de l’Epine, M.; Kaizuka, I.; Okazaki, J. Trends in PV Applications 2025. IEA PVPS 2025. [Google Scholar] [CrossRef]
- Mogrovejo-Narvaez, M.; Barragán-Escandón, A.; Zalamea-León, E.; Serrano-Guerrero, X. Barriers to the Implementation of On-Grid Photovoltaic Systems in Ecuador. Sustainability 2024, 16, 9466. [Google Scholar] [CrossRef]
- Stackhouse, P. Prediction of Worldwide Energy Resources. NASA Earthdata. Available online: https://www.earthdata.nasa.gov/data/projects/power (accessed on 12 July 2026).
- Muñoz-Vizhñay, J.P.; Rojas-Moncayo, M.V.; Barreto-Calle, C.R. Incentivo a la generación distribuida en el Ecuador. Ingenius 2018, 19, 60–68. [Google Scholar] [CrossRef]
- NASA Prediction of Worldwide Energy Resources (POWER). Available online: https://power.larc.nasa.gov/ (accessed on 12 July 2026).
- Antonanzas, J.; Osorio, N.; Escobar, R.; Urraca, R.; Martinez-de-Pison, F.J.; Antonanzas-Torres, F. Review of photovoltaic power forecasting. Sol. Energy 2016, 136, 78–111. [Google Scholar] [CrossRef]
- Skoplaki, E.; Palyvos, J.A. On the temperature dependence of photovoltaic module electrical performance: A review of effi-ciency/power correlations. Sol. Energy 2009, 83, 614–624. [Google Scholar] [CrossRef]
Figure 1.
Geographical location of the canton of La Maná, Cotopaxi province, Ecuador.
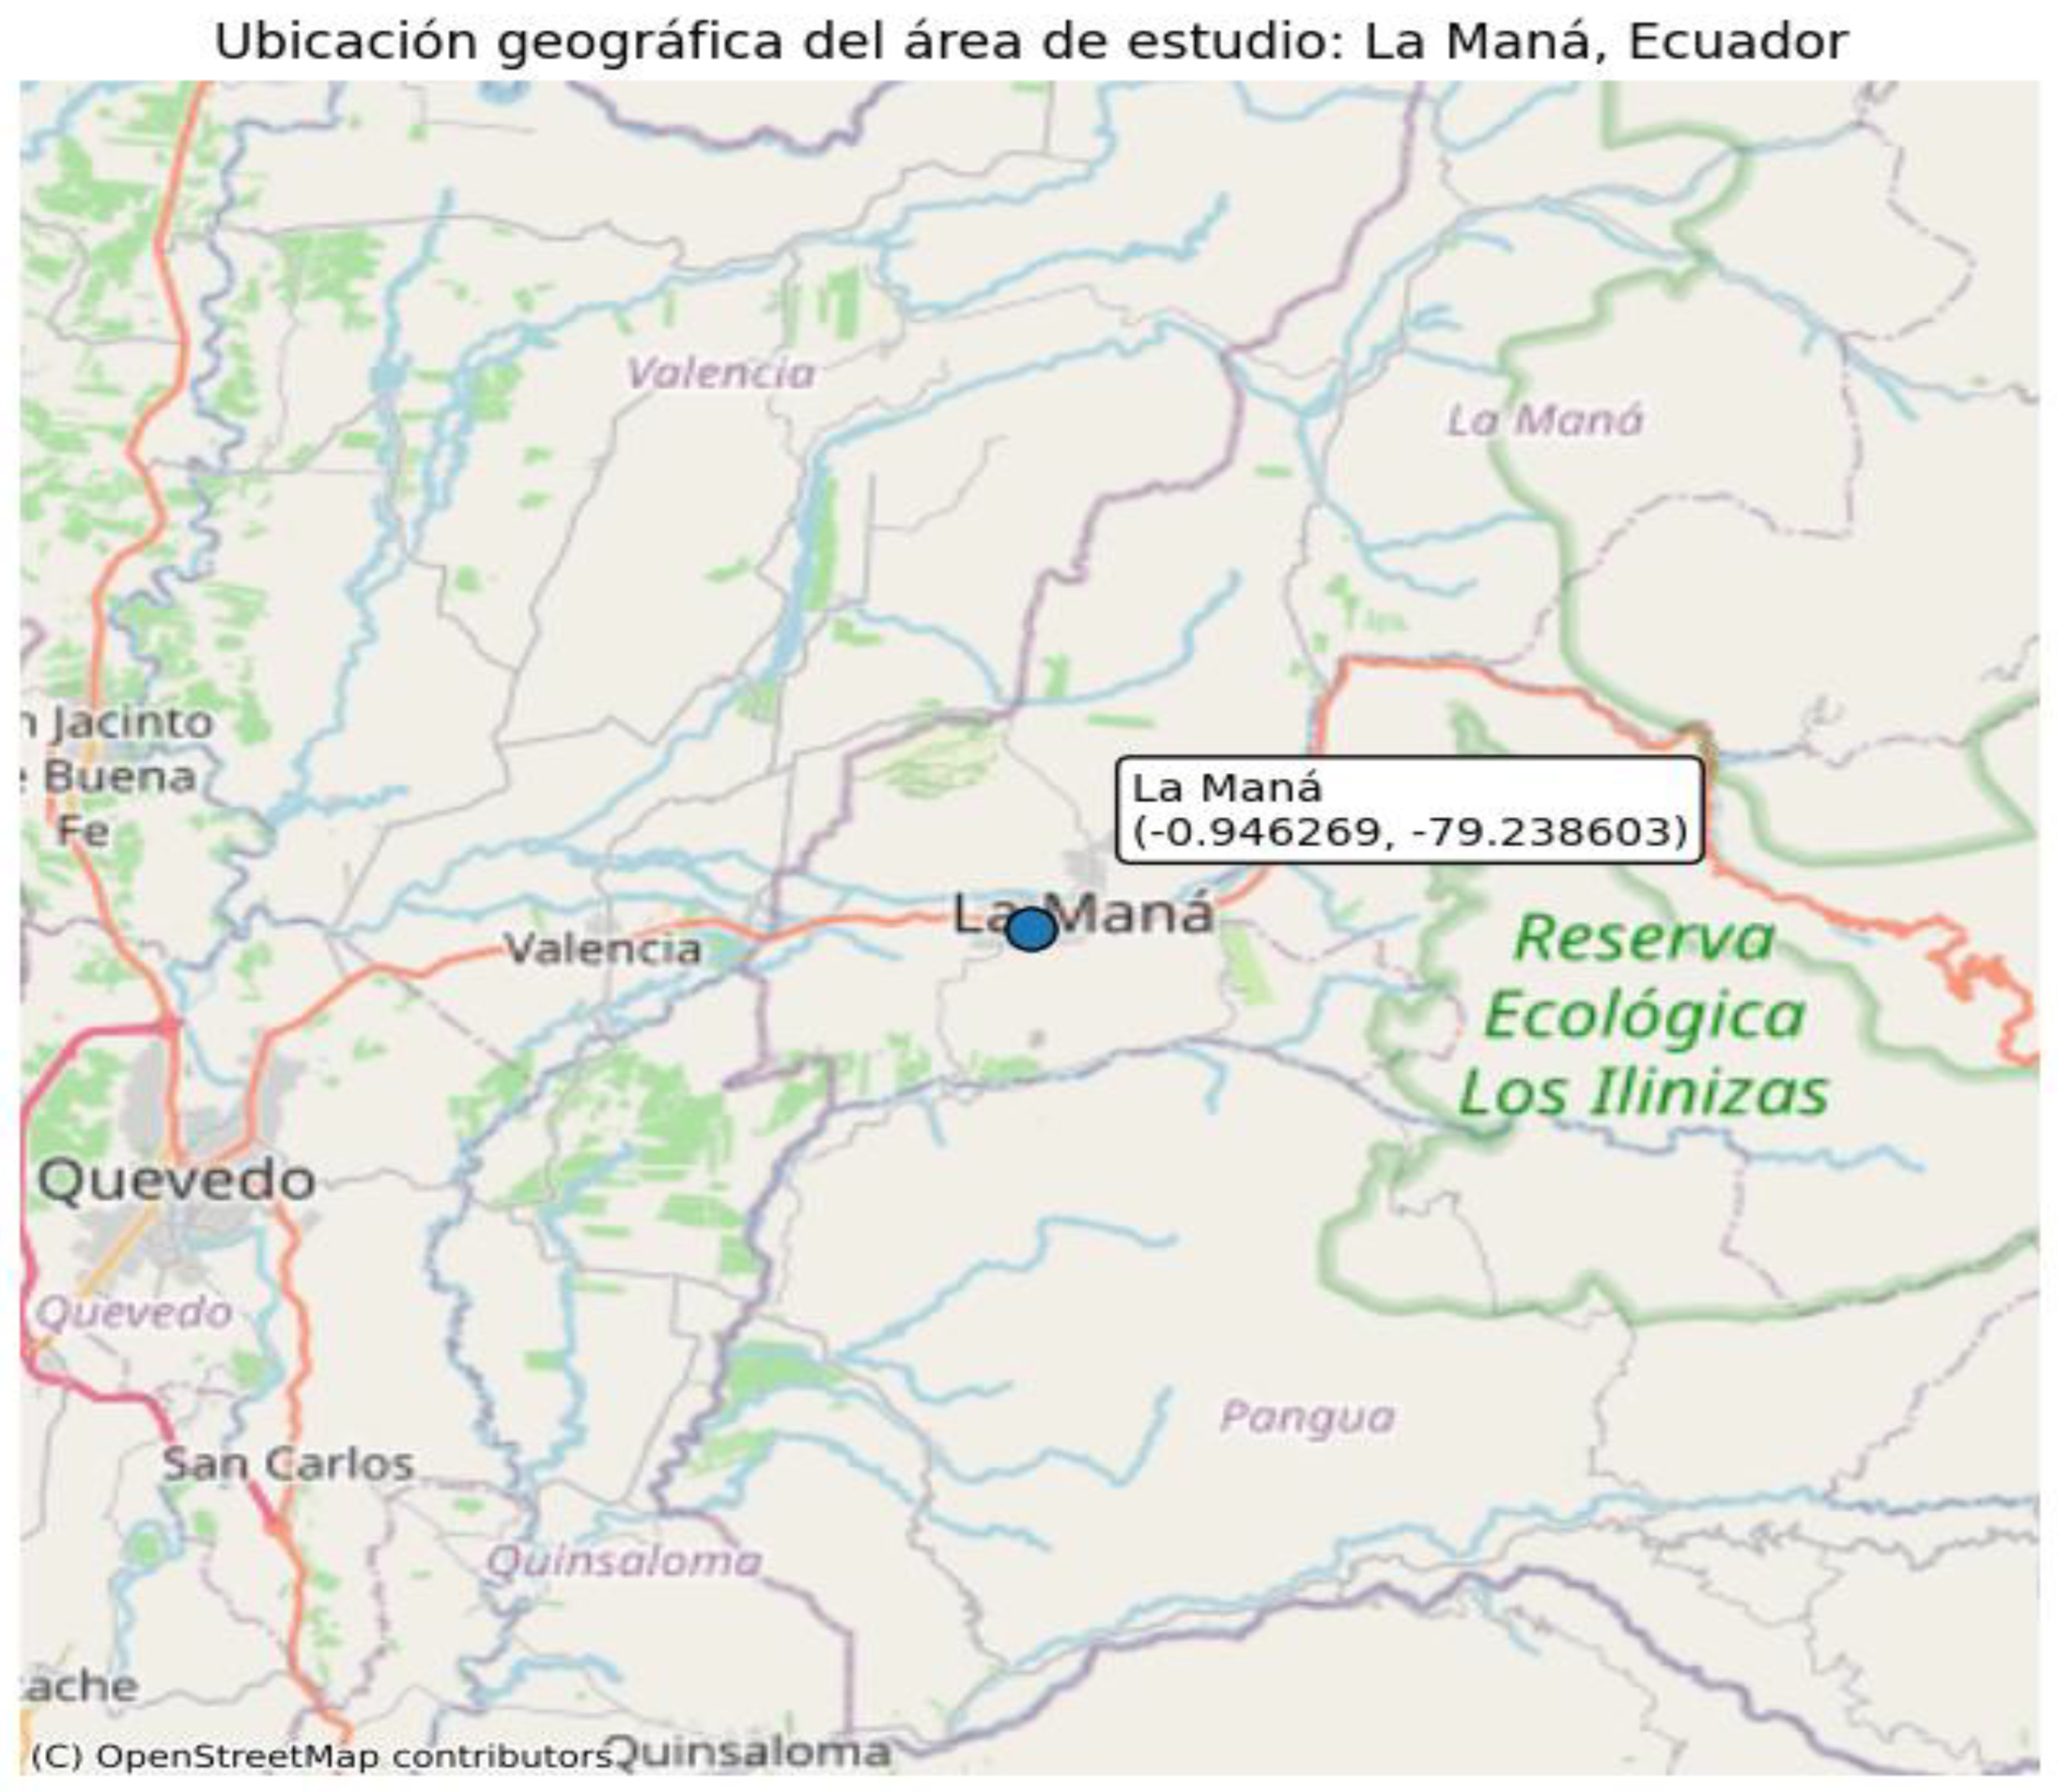
Figure 5.
Annual distribution of global solar irradiance using violin plots for the 2014–2025 period.
Figure 5.
Annual distribution of global solar irradiance using violin plots for the 2014–2025 period.
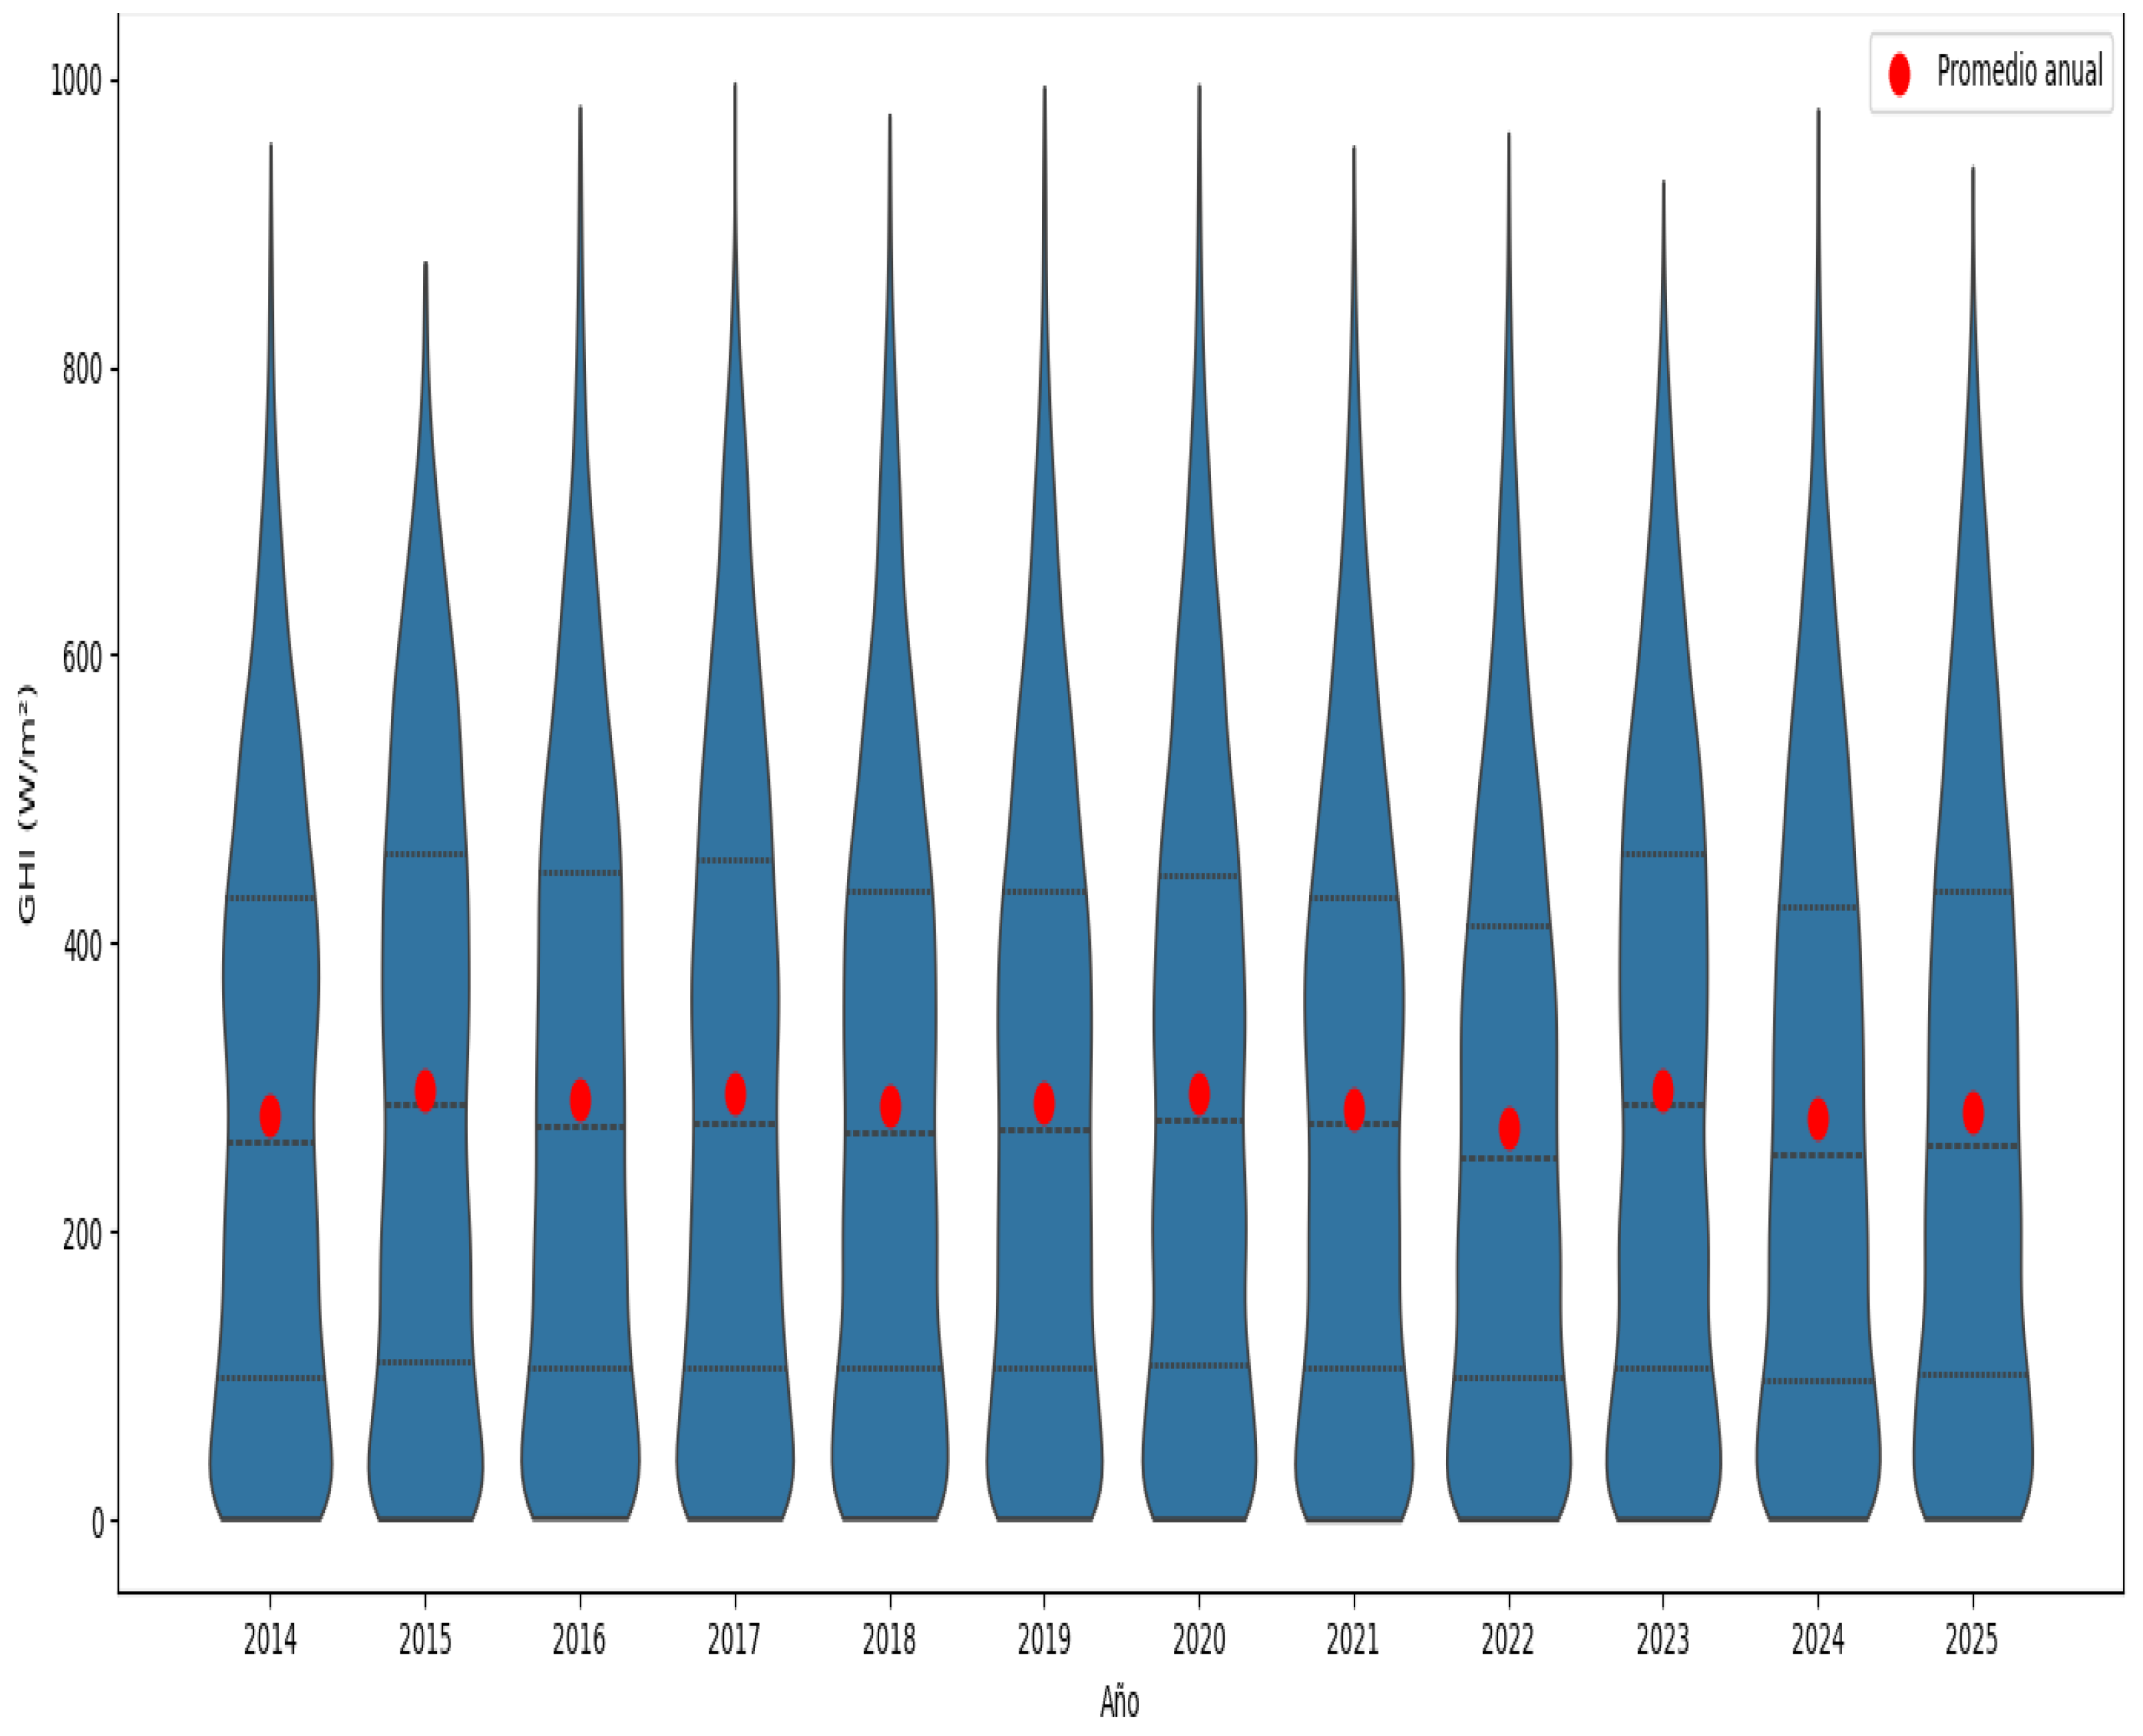
Table 1.
General characteristics of the study area.
| Parameter | Value |
| Latitude | 0.946269° S |
| Longitude Study period Hourly records Mean temperature Mean relative humidity Mean wind speed |
79.238603° W 2014–2025 105,168 22.82 °C 77.25 % 2.01 m/s |
Table 2.
Meteorological and solar variables used in the study.
| Variable | NASA POWER Code | Unit | Description |
| Global horizontal irradiance | ALLSKY_SFC_SW_DWN | W/m² | Incident solar radiation on a horizontal surface |
| Air temperature | T2M | °C | Air temperature at 2 m above the surface |
| Relative humidity | RH2M | % | Relative air humidity at 2 m |
| Wind speed | WS2M | m/s | Wind speed at 2 m height |
Table 4.
Descriptive statistics of the meteorological and solar variables recorded in La Maná during the 2014–2025 period.
Table 4.
Descriptive statistics of the meteorological and solar variables recorded in La Maná during the 2014–2025 period.
| Variable | Media | Desv. Est. | Mínimo | Máximo |
| Irradiación solar global (GHI) (W/m²) | 150.70 | 207.86 | 0.00 | 996.55 |
| Temperatura del aire (°C) | 22.82 | 3.57 | 15.02 | 35.16 |
| Humedad relativa (%) | 77.25 | 17.67 | 25.45 | 100.00 |
| Velocidad del viento (m/s) | 2.01 | 1.14 | 0.00 | 5.34 |
Table 5.
Annual statistics of global horizontal irradiance (GHI) in La Maná during the 2014–2025 period.
Table 5.
Annual statistics of global horizontal irradiance (GHI) in La Maná during the 2014–2025 period.
| Year |
Mean GH (W/m²) |
Std. Dev. (W/m²) | Minimum (W/m²) | Maximum (W/m²) |
| 2014 | 280.07 | 200.76 | 1.30 | 954.40 |
| 2015 | 299.00 | 209.68 | 1.10 | 872.08 |
| 2016 | 291.27 | 210.92 | 1.80 | 980.12 |
| 2017 | 296.32 | 215.16 | 1.35 | 996.55 |
| 2018 | 288.14 | 207.40 | 1.58 | 974.67 |
| 2019 | 288.72 | 207.49 | 1.35 | 993.97 |
| 2020 | 295.27 | 211.96 | 1.15 | 995.12 |
| 2021 | 286.02 | 202.95 | 0.65 | 952.58 |
| 2022 | 271.93 | 198.71 | 1.02 | 961.90 |
| 2023 | 299.44 | 211.09 | 1.00 | 928.60 |
| 2024 | 278.14 | 203.87 | 1.33 | 978.45 |
| 2025 | 283.72 | 205.96 | 1.33 | 938.35 |
| Period average | 288.34 | 207.16 | 1.25 | 960.73 |
Table 6.
Performance metrics of the evaluated machine learning models.
| Machine Learning Model | Validation MAE (W/m²) | Validation RMSE (W/m²) | Validation R² | Test MAE (W/m²) | Test RMSE (W/m²) | Test R² |
| Multiple Linear Regression | 75.05 | 100.02 | 0.7642 | 91.94 | 123.68 | 0.6327 |
| Random Forest | 33.82 | 67.94 | 0.8912 | 36.74 | 72.47 | 0.8739 |
| Gradient Boosting | 33.59 | 65.34 | 0.8994 | 35.14 | 68.44 | 0.8875 |
| XGBoost | 33.69 | 66.06 | 0.8971 | 35.28 | 69.6 | 0.8837 |
Disclaimer/Publisher’s Note: The statements, opinions and data contained in all publications are solely those of the individual author(s) and contributor(s) and not of MDPI and/or the editor(s). MDPI and/or the editor(s) disclaim responsibility for any injury to people or property resulting from any ideas, methods, instructions or products referred to in the content. |
© 2026 by the authors. Licensee MDPI, Basel, Switzerland. This article is an open access article distributed under the terms and conditions of the Creative Commons Attribution (CC BY) license (http://creativecommons.org/licenses/by/4.0/).
Copyright: This open access article is published under a Creative Commons CC BY 4.0 license, which permit the free download, distribution, and reuse, provided that the author and preprint are cited in any reuse.


