
Submitted:
04 August 2026
Posted:
05 August 2026
You are already at the latest version
Abstract
This paper examines the dynamic effects of economic policy uncertaintyon key macroeconomic outcomes in Sweden—industrial production, inflation, and unemployment—over the period 2014M01–2025M04. Using the Swedish News-Based Economic Policy Uncertainty Index and applying the Local Projections framework of Jordà, we trace the impulse responses of each variable to a one-standard-deviation EPU shock across a 12-month horizon. Our findings reveal a distinct temporal transmission pattern: industrial production contracts immediately and significantly, with the largest decline occurring around the second month following the shock. In contrast, inflation responds with a notable delay, exhibiting insignificant short-run effects but turning significantly negative from the eighth month onward, consistent with demand-driven disinflation. Unemployment rises more gradually but persistently, becoming statistically significant from the second month and remaining elevated throughout the horizon. These results underscore the importance of a dynamic, horizon-specific approach to understanding uncertainty shocks in a small open economy. From a policy standpoint, the findings highlight the value of forward-looking communication, automatic stabilizers, and targeted labor-market interventions to mitigate short-run output losses and persistent employment deterioration.
Keywords:
economic policy uncertainty
; local projections
; Sweden
; industrial production
; inflation
; unemployment
1. Introduction
Macroeconomic research studies how economies allocate resources over time and how policy frameworks contribute to stabilizing key objectives, including sustained output, low unemployment, and price stability (Frisch, 1933/1995; Svensson, 1997). Empirical work typically summarizes these objectives using a core set of macroeconomic indicators capturing real activity, price dynamics, and labor-market slack (Medeiros et al., 2021). Against this background, this paper examines how economic policy uncertainty affects macroeconomic outcomes in Sweden, a small open economy in which expectations and policy communication play a particularly important role.
A growing literature identifies uncertainty shocks as an independent source of macroeconomic fluctuations, operating not only through changes in expected outcomes but also through increased dispersion and a higher option value of delaying irreversible decisions (Dixit & Pindyck, 1994). Elevated uncertainty induces firms to postpone investment and hiring decisions and encourages households to delay durable consumption, thereby depressing real activity and weakening labor-market conditions (Bloom, 2009). Inflation responses are more nuanced, reflecting the interaction of demand effects, nominal rigidities, and policy reactions; demand-driven frameworks typically predict short-run disinflation, which may subsequently unwind as conditions normalize (Basu & Bundick, 2017).
This study uses the Swedish News-Based Economic Policy Uncertainty Index as the uncertainty measure (Baker, Bloom & Davis, 2016) and analyzes the responses of industrial production, CPI inflation, and unemployment. Dynamic effects are estimated using a local projections framework, which traces impulse responses flexibly across horizons without imposing restrictive parametric assumptions and is well suited to persistent and potentially nonlinear uncertainty shocks (Jordà, 2005).
2. Literature Review
The literature on economic policy uncertainty links uncertainty shocks to macroeconomic fluctuations through three closely related strands: real-economy transmission mechanisms, the measurement of uncertainty, and the empirical identification of dynamic effects.
The first strand emphasizes the real-options, or “wait-and-see,” channel, whereby heightened uncertainty raises the value of delaying irreversible investment and hiring decisions, resulting in short-run contractions in output and employment (Dixit & Pindyck, 1994; Bloom, 2009). Empirical evidence documents that spikes in uncertainty coincide with sharp declines in industrial production and employment, followed by partial recoveries consistent with temporary adjustment freezes (Bloom, 2009). Subsequent research shows that uncertainty can amplify downturns by weakening aggregate demand and slowing resource reallocation (Bloom, 2014). In models with nominal rigidities, uncertainty shocks operate similarly to demand shocks, generating declines in activity and disinflationary pressures, with medium-run dynamics shaped by policy responses and the gradual unwinding of precautionary behavior (Basu & Bundick, 2017).
A second strand focuses on the measurement of uncertainty. Text-based indicators, most notably the Economic Policy Uncertainty index constructed from newspaper coverage, provide a scalable and policy-relevant measure that has been widely applied across countries (Baker, Bloom, & Davis, 2016). At the same time, sensitivity to media composition and reporting intensity motivates robustness checks, as alternative proxies may capture distinct dimensions of uncertainty (Jurado, Ludvigson, & Ng, 2015).
The third strand concerns empirical identification. Local Projections offer a flexible approach to estimating impulse responses under persistent shocks, making them well suited for tracing Sweden’s macroeconomic responses to EPU shocks (Jordà, 2005).
3. Empirical Methodology and Model Specification
This paper investigates how unexpected increases in Swedish economic policy uncertainty affect real activity, price dynamics, and employment. Impulse responses of industrial production, inflation, and unemployment are estimated using the Local Projections approach, which avoids the restrictive joint-dynamics assumptions of VAR models and remains robust to persistence, nonlinearity, and potential model misspecification (Jordà, 2005).
3.1. Shock Construction
Let denote the monthly Swedish News-Based Economic Policy Uncertainty index (Baker, Bloom, and Davis, 2016). In the baseline analysis, the EPU shock is defined as a one-standard-deviation increase in the EPU series, constructed by standardizing to have mean zero and unit variance:
Hence, a one-unit change in corresponds to a one-standard-deviation rise in the underlying EPU index, which facilitates comparability across specifications and outcomes.
3.2. Local Projection Specification
For each horizon h=0,1,…,H, the paper estimates horizon-specific local projections of the form:
where is one of the macroeconomic outcomes and is the standardized EPU measure. The control vector includes 12 monthly lags of the three macro variables (industrial production, CPI inflation, and the unemployment rate), which flexibly captures persistence and short-run dynamics in monthly data. The coefficient traces the response of y at horizon h to a one-standard-deviation increase in EPU. Specifically, industrial production enters as monthly IP growth , while inflation and unemployment are measured in percent units.
3.3. Inference and Credibility
Inference is conducted using Newey–West HAC standard errors to account for serial correlation induced by overlapping horizons in local projections. In the implementation, the HAC lag length is allowed to vary with the forecast horizon hhh, providing conservative uncertainty bands for medium and longer horizons.
4. Data and Descriptive Analysis
The dataset consists of 136 monthly observations spanning 2014M01–2025M04. It combines a news-based measure of economic policy uncertainty for Sweden with three core macroeconomic outcomes capturing real activity, price dynamics, and labor market conditions. All series are aligned at the monthly frequency and are used in their observed units over the sample period.
Economic policy uncertainty is measured by the Swedish News-Based Economic Policy Uncertainty (EPU) index. To facilitate comparability of impulse responses across outcomes and horizons, the uncertainty shock is defined as a one-standard-deviation increase in the (standardized) EPU series. This normalization allows the estimated responses to be interpreted as the dynamic effects of a typical large uncertainty innovation in the Swedish context.
Industrial production is measured as monthly industrial production growth, constructed as , where IPI is the industrial production index (2021=100). Inflation is measured by the 12-month CPI inflation rate (year-on-year, percent). Unemployment is measured by the unemployment rate (percent) for persons aged 15–74 (seasonally adjusted). In the baseline local projections, the EPU series is standardized, while the outcome variables are kept in their observed units; therefore, estimated responses are reported in IP growth units (percentage points per month, in , CPI inflation in percentage points, and the unemployment rate in percentage points.

Table 1.
Variable definitions and data sources.
| Variable Name | Definition/Construction |
|---|---|
| EPU Index | Swedish News-Based Economic Policy Uncertainty (EPU) Index: a text-based uncertainty measure constructed from Swedish newspaper articles containing terms related to the economy, policy, and uncertainty following the Baker–Bloom–Davis methodology. The monthly EPU series is standardized to mean 0 and standard deviation 1, so a one-unit shock corresponds to a one-standard-deviation increase in EPU. |
| IP growth (100×Δln IPI) | Industrial production growth constructed as where IPI is the industrial production index (2021=100). This growth measure is used in estimation as the indicator of industrial activity. |
| CPI inflation (12-month, %) | 12-month CPI inflation rate for Sweden (year-on-year, percent), used directly as an indicator of price dynamics. |
| Unemployment rate (level, %) | Unemployment rate (percent) for persons aged 15–74 (seasonally adjusted). The level measure is used in estimation. |
Note: The EPU series is standardized (mean 0, s.d. 1), so a one-unit shock corresponds to a one-standard-deviation increase in EPU. Outcome variables are not standardized. Estimated responses are therefore reported in the units of each outcome: IP growth in percentage points per month (), CPI inflation in percentage points, and the unemployment rate in percentage points.
4.1. Temporal Analysis
Figure 1 shows that EPU remains relatively stable in normal periods but exhibits sharp spikes during major stress episodes, most notably the COVID-19 shock and the Russia–Ukraine war. Industrial production contracts and then recovers gradually, inflation displays lagged overshooting followed by disinflation, and unemployment adjusts more persistently, motivating the use of a dynamic Local Projections framework.
4.2. Descriptive Analysis
Table 2 reports descriptive statistics for the EPU index and three macroeconomic outcomes over 2014M01–2025M04. The EPU series shows wide, fat-tailed variation with occasional sharp spikes, consistent with episodic surges in uncertainty. Industrial production and inflation display pronounced cyclical movements, while unemployment varies more moderately. This combination motivates a dynamic framework to study how uncertainty shocks propagate over time.
Before estimating the baseline local projections, persistence is assessed using Augmented Dickey–Fuller (ADF) tests. The results indicate strong persistence in several monthly series: EPU rejects a unit root in levels (p = 0.0008), whereas the IPI level and unemployment rate do not reject in levels at conventional thresholds (p = 0.4279 and 0.5429). Inflation also fails to reject at the 5% level (p = 0.1194). Given this persistence, industrial production is expressed as monthly growth, constructed as (100 × Δ ln(IPI)), to focus on short-run real-activity fluctuations; inflation and unemployment are kept in percent units. Regressions include monthly lag controls, and inference relies on Newey–West HAC standard errors to address serial correlation and heteroskedasticity.
For transparency, Table 2 reports descriptive statistics in levels (including the IPI index level, 2021=100) alongside ADF statistics and p-values, while the LP estimations use the constructed outcomes. The EPU shock is standardized (one s.d.), so coefficients and impulse responses are interpreted as changes in each outcome’s original units.
4.3. Correlation Analysis
Figure 2 reports contemporaneous correlations between EPU and the three macroeconomic variables. EPU displays weak linear comovement with real activity and labor-market conditions, showing a near-zero correlation with industrial production and a slightly negative correlation with unemployment, while its correlation with inflation is modestly positive. By contrast, industrial production and inflation are strongly correlated, whereas unemployment is only weakly related to both. Overall, these patterns suggest that contemporaneous correlations understate the macroeconomic relevance of uncertainty, as EPU shocks likely propagate through lagged and dynamic adjustment rather than immediate comovement, motivating the use of Local Projections.
5. Empirical Results
This paper applies the Local Projections (LP) method (Jordà, 2005) to estimate impulse responses to a one-standard-deviation shock in the Economic Policy Uncertainty (EPU) index. The EPU shock is standardized (mean 0, s.d. 1). The baseline local projections reported in Table 3 use industrial production in monthly growth terms, constructed as 100 × Δ ln(IPI), where IPI is the chain index (2021=100). Inflation is measured by the CPI inflation rate (percent) and unemployment by the unemployment rate (percent). Accordingly, the reported coefficients and IRFs are interpreted in percentage-point units for each outcome. Figure 3 reports the impulse responses, and Table 3 presents the corresponding coefficients and significance levels (Jordà, 2005; Jordà and Marcellino, 2010).
5.1. The Impact of Uncertainty Shocks on Industrial Output (IPI)
As shown in Table 3, uncertainty shocks significantly depress industrial activity in the short run. IP growth declines between h=1h=1h=1 and h=3h=3h=3, with the largest contraction around h=2h=2h=2. The effect then weakens over the medium horizon and gradually converges toward zero, indicating partial recovery. Because the EPU shock is standardized, the estimated coefficient can be interpreted as the change in monthly IP growth () associated with a one-standard-deviation increase in EPU. For example, a coefficient of −0.169-0.169−0.169 implies that a 1-SD EPU shock lowers monthly IP growth by about 0.169 percentage points at that horizon. Figure 3 confirms a sharp short-run contraction followed by gradual dissipation, consistent with the real-options or “wait-and-see” mechanism (Dixit and Pindyck, 1994; Bloom, 2009).
5.2. The Impact of Uncertainty Shocks on Inflation
Compared with industrial production, inflation responds to uncertainty shocks with a clearer lag. As shown in the Inflation column of Table 3, estimated effects are generally small and statistically insignificant in the short run (h = 0–7), with some fluctuation in sign. However, at later horizons (h = 8–12), the coefficients become significantly negative, indicating that uncertainty shocks eventually generate persistent downward pressure on prices. This pattern is also visible in Figure 3 (“EPU shock → Inflation”). Since the EPU shock is standardized while inflation is measured in percent, coefficients and IRFs can be interpreted in percentage points as the change in CPI inflation following a one-standard-deviation increase in EPU. From a theoretical perspective, this “short-run insignificance, longer-run disinflation” result is consistent with nominal rigidities and demand-side transmission: firms adjust quantities more than prices initially, while precautionary behavior gradually weakens aggregate demand, producing delayed disinflationary effects (Gali, 2008; Basu and Bundick, 2017).
5.3. The Impact of Uncertainty Shocks on the Unemployment Rate
Compared with industrial production and inflation, the unemployment rate exhibits a more delayed and persistent response to uncertainty shocks. As shown in the Unemployment column of Table 3, an EPU shock has no statistically significant effect in the contemporaneous and very short run (h = 0–1). From h = 2 onward, however, unemployment increases significantly and remains positive across several horizons, indicating a lasting labor-market impact. This dynamic is mirrored in Figure 3 (“EPU shock → Unemployment”), where the impulse response displays a gradual and sustained rise. Because the EPU shock is standardized while the unemployment rate is measured in percent, coefficients and IRFs are interpreted in percentage points as the change in the unemployment rate associated with a one-standard-deviation increase in EPU. The pattern is consistent with standard labor-market adjustment mechanisms: firms initially respond to heightened uncertainty by freezing hiring rather than conducting immediate layoffs, and persistent weak demand gradually translates into higher unemployment (Bloom, 2009). Moreover, uncertainty can dampen investment and firm expansion, reduce matching efficiency, and slow the recovery of unemployment relative to output (Pissarides, 1990).
5.4. Interpretation of Significance and Dynamic Effects
Lack of significance at some horizons does not imply the absence of economic effects. In LP estimation, effective sample size declines with the horizon and HAC standard errors widen confidence intervals (Jordà, 2005), while measurement noise and offsetting policy responses further reduce precision (Baker et al., 2016). Overall, the results reveal a clear sequence: output contracts first, unemployment rises with a lag, and inflation declines later, consistent with wait-and-see behavior and aggregate-demand transmission.
Table 4 and Table 5 and Figure 4 show that a one-standard-deviation EPU shock generates front-loaded output losses, with industrial production falling sharply early and fading by one year. Unemployment rises more slowly but persistently, while inflation responds with a delayed and sustained disinflation, highlighting uneven yet systematic uncertainty transmission across macroeconomic outcomes.
6. Discussion of Findings
The results show an uneven transmission of EPU shocks. Output falls sharply and immediately, consistent with a wait-and-see channel. Unemployment responds more slowly but persistently, reflecting labor-market frictions. Inflation reacts with the longest lag, turning negative at medium horizons, indicating demand-driven disinflation rather than cost-push effects.
7. Conclusions and Policy Implications
This study contributes to the literature on uncertainty shocks by documenting clear, horizon-dependent macroeconomic effects using a Local Projections framework. A one-standard-deviation EPU shock leads to an immediate contraction in industrial production, a delayed disinflationary response, and a persistent increase in unemployment over a one-year horizon. These timing differences highlight that uncertainty transmission is inherently dynamic, suggesting that static linear models may understate lagged real-side adjustment and labor-market persistence. From a policy perspective, the results emphasize the importance of forward-looking communication and contingency planning to mitigate short-run output losses and delayed employment deterioration. Incorporating EPU-based indicators into macro-prudential monitoring could improve horizon-specific risk assessment, while automatic stabilizers and targeted labor-market support appear particularly valuable in the months following uncertainty spikes. Future research could explore nonlinearities across uncertainty regimes, sectoral heterogeneity, and alternative identification strategies for uncertainty shocks.
Supplementary Materials
The following supporting information can be downloaded at the website of this paper posted on Preprints.org.
Appendix A
Figure A1.
Robust Local Projections IRFs to a Swedish EPU Shock (12 Lags) (Source: The authors calculated from the data collected on Stata software).
Figure A1.
Robust Local Projections IRFs to a Swedish EPU Shock (12 Lags) (Source: The authors calculated from the data collected on Stata software).
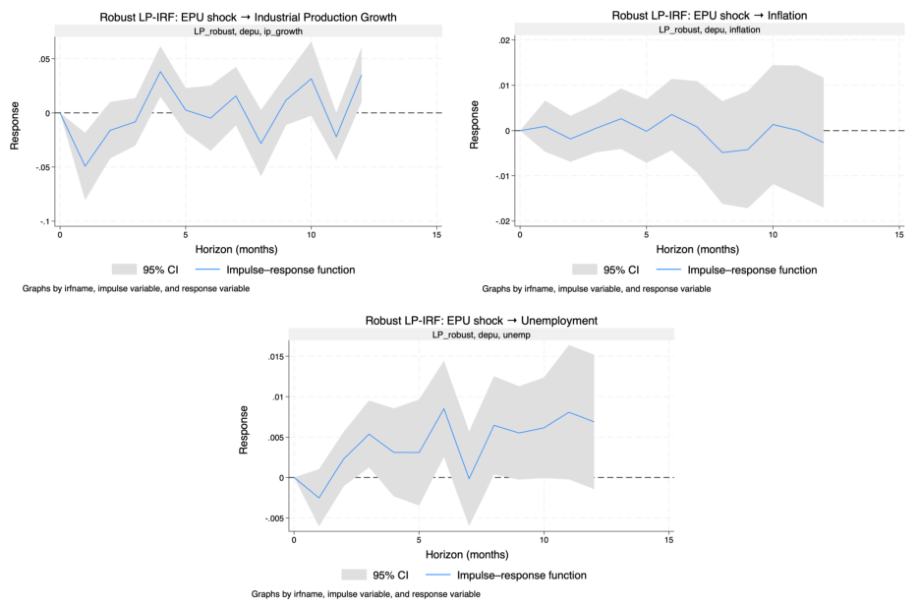
This appendix reports robust Local Projections impulse responses to a one-standard-deviation Swedish news-based EPU shock. Relative to the baseline specification with 4 lags, the robustness check uses 12 lags (one year) to absorb richer persistence and seasonal dynamics. Qualitative response patterns remain broadly stable across horizons.
References
- Baker, S. R., Bloom, N., & Davis, S. J. (2016). MEASURING ECONOMIC POLICY UNCERTAINTY. The Quarterly Journal of Economics, 131(4), 1593–1636. [CrossRef]
- Baker, S. R., Bloom, N., & Davis, S. J. (n.d.). Economic Policy Uncertainty (EPU) index: Data. Retrieved February 1, 2026, from https://www.policyuncertainty.com/sweden_monthly.html.
- Basu, S., & Bundick, B. (2017). UNCERTAINTY SHOCKS IN A MODEL OF EFFECTIVE DEMAND. Econometrica, 85(3), 937–958. [CrossRef]
- Bloom, N. (2009). The Impact of Uncertainty Shocks. Econometrica, 77(3), 623–685. [CrossRef]
- Bloom, N. (2014). Fluctuations in Uncertainty. The Journal of Economic Perspectives, 28(2), 153–175. [CrossRef]
- Dixit, A. K., & Pindyck, R. S. (1994). Investment under uncertainty / Avinash K. Dixit and Robert S. Pindyck. Princeton University Press.
- Statistics Sweden. (n.d.-a). Consumer Price Index (CPI) [Data set]. Retrieved February 1, 2026, from https://www.scb.se/en/finding-statistics/statistics-by-subject-area/prices-and-economic-trends/price-statistics/consumer-price-index-cpi/.
- Statistics Sweden. (n.d.-b). Industrial production index (IPI) [Data set]. Retrieved February 1, 2026, from https://www.scb.se/en/finding-statistics/statistics-by-subject-area/business-activities-and-foreign-trade/business-production-sales-and-finances--short-term-statistics/industrial-production-index-ipi/.
- Statistics Sweden. (n.d.-c). Unemployment rate, persons 15-74 years (seasonally adjusted) [Data set]. Retrieved February 1, 2026, from https://www.scb.se/en/finding-statistics/statistics-by-subject-area/labour-market/labour-force-supply/labour-force-surveys-lfs/pong/tables-and-graphs/seasonally-adjusted-data/time-series-on-the-unemployment-rate-persons-15-74-years/.
- Frisch, R. (1995). Propagation Problems and Impulse Problems in Dynamic Economics (in Economic Essays in Honour of Gustav Cassel, Allen & Unwin, London, 1933, pp. 171–3, 181–90, 197–203). In The Foundations of Econometric Analysis (pp. 333–346). Cambridge University Press. [CrossRef]
- Galí, J. (2008). Monetary policy, inflation, and the business cycle: An introduction to the New Keynesian framework and its applications. Princeton University Press.
- Jordà, Ò. (2005). Estimation and Inference of Impulse Responses by Local Projections. The American Economic Review, 95(1), 161–182. [CrossRef]
- Jordà, Ò., & Marcellino, M. (2010). Path forecast evaluation. Journal of Applied Econometrics (Chichester, England), 25(4), 635–662. [CrossRef]
- Jurado, K., Ludvigson, S. C., & Ng, S. (2015). Measuring Uncertainty. The American Economic Review, 105(3), 1177–1216. [CrossRef]
- Plosser, C. I., & Schwert, G. W. (1979). Potential GNP: Its measurement and significance: A dissenting opinion. Carnegie-Rochester Conference Series on Public Policy, 10(1), 179–186. [CrossRef]
- Pissarides, C. A. (1990). Equilibrium unemployment theory / Christopher A. Pissarides. Blackwell.
- Medeiros, M. C., Vasconcelos, G. F. R., Veiga, Á., & Zilberman, E. (2021). Forecasting Inflation in a Data-Rich Environment: The Benefits of Machine Learning Methods. Journal of Business & Economic Statistics, 39(1), 98–119. [CrossRef]
- Svensson, L. E. O. (1997). Inflation forecast targeting: Implementing and monitoring inflation targets. European Economic Review, 41(6), 1111–1146. [CrossRef]
Figure 1.
Variable measures (Source: The authors calculated from the data collected on Stata software).
Figure 1.
Variable measures (Source: The authors calculated from the data collected on Stata software).
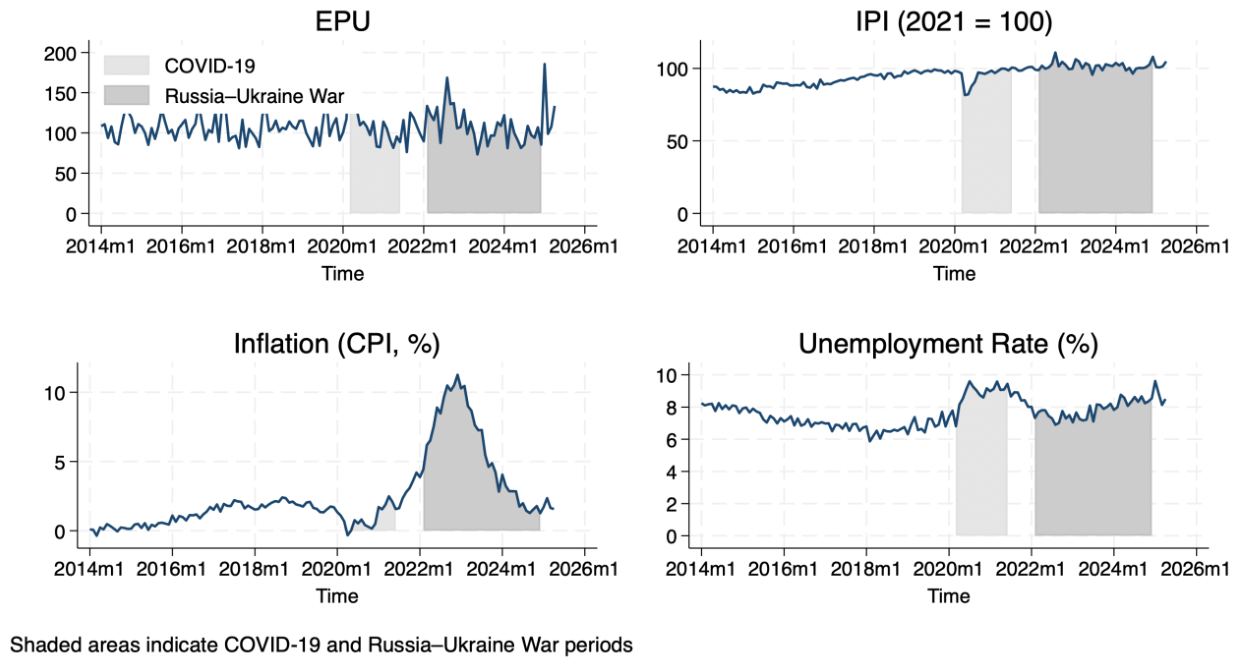
Figure 2.
Correlation heatmap (Note: Significance levels: *** p<0.01, ** p<0.05, * p<0.1) (Source: The authors calculated from the data collected on Stata software).
Figure 2.
Correlation heatmap (Note: Significance levels: *** p<0.01, ** p<0.05, * p<0.1) (Source: The authors calculated from the data collected on Stata software).
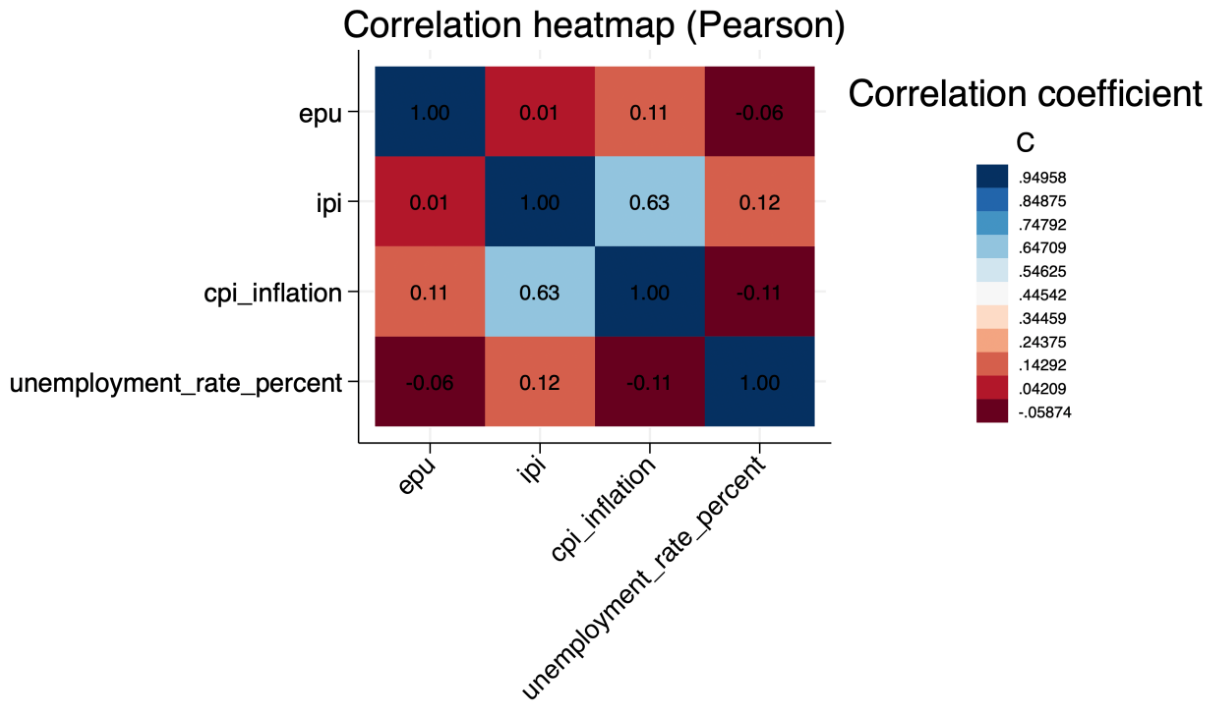
Figure 3.
Local Projections impulse response graph (Source: The authors calculated from the data collected on Stata software).
Figure 3.
Local Projections impulse response graph (Source: The authors calculated from the data collected on Stata software).
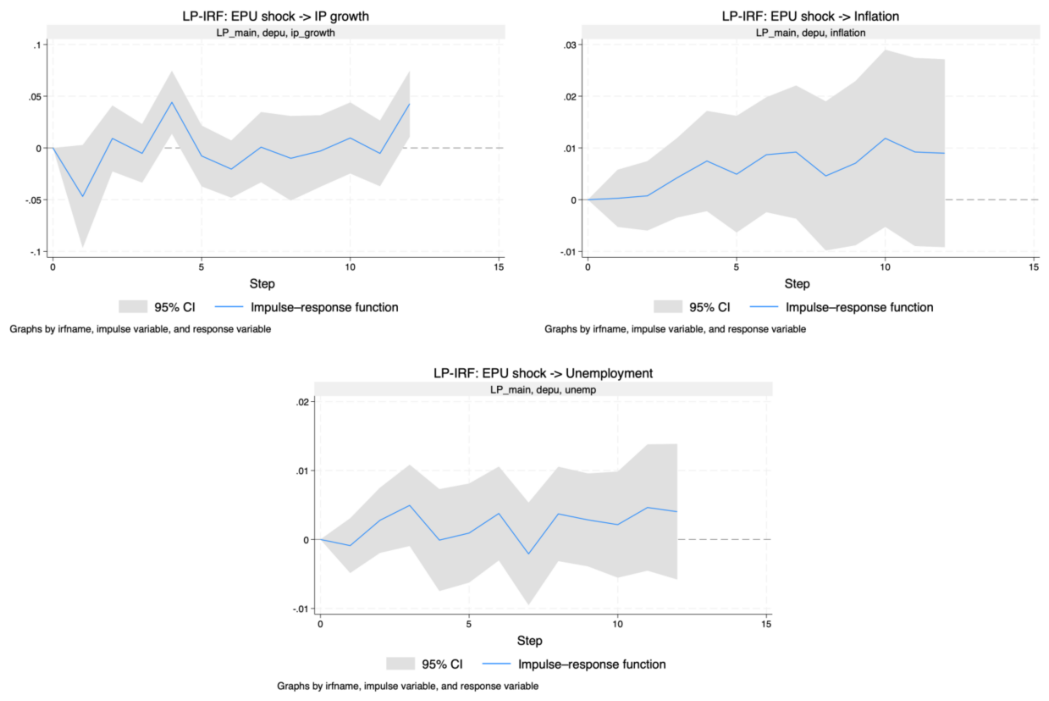
Figure 4.
Local Projections cumulative impulse response graph (Source: The authors calculated from the data collected on Stata software.).
Figure 4.
Local Projections cumulative impulse response graph (Source: The authors calculated from the data collected on Stata software.).
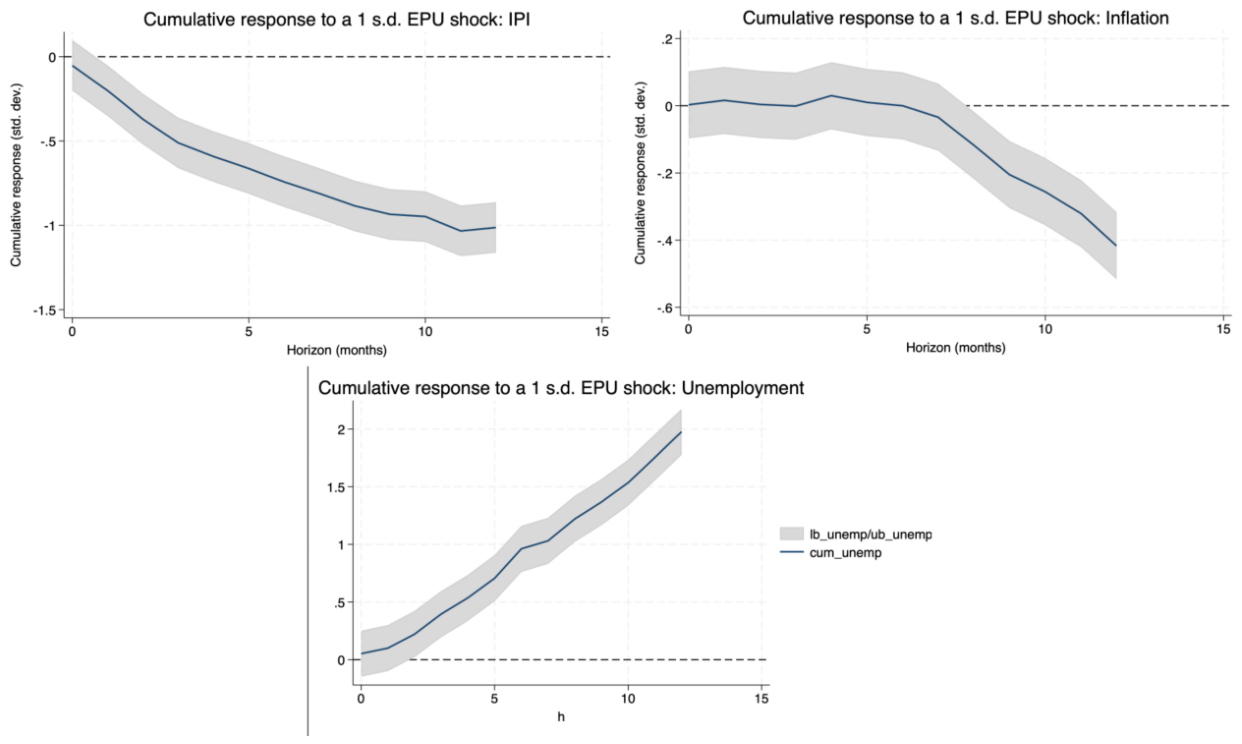
Table 2.
Descriptive Statistics.
| EPU | IPI | Inflation | Unemployment | |
|---|---|---|---|---|
| mean | 107.411 | 95.246 | 2.466 | 7.642 |
| std | 18.964 | 6.453 | 2.696 | 0.856 |
| min | 73.379 | 81.600 | -0.367 | 5.865 |
| 25% | 93.948 | 89.500 | 0.758 | 6.944 |
| 50% | 106.244 | 96.700 | 1.692 | 7.634 |
| 75% | 115.694 | 100.000 | 2.442 | 8.212 |
| max | 185.686 | 111.000 | 11.250 | 9.615 |
| skew | 1.253 | -0.334 | 1.812 | 0.327 |
| kurtosis | 6.071 | 2.259 | 5.424 | 2.316 |
| ADF Test Stat. | -4.135 | -1.706 | -2.484 | -1.481 |
| p-value | 0.0008 | 0.4279 | 0.1194 | 0.5429 |
| Observations | 136 | 136 | 136 | 136 |
Source: The authors calculated from the data collected on Stata software.
Table 3.
Local Projections estimates: effect of a 1 s.d. EPU shock.
| Horizon | IPI (response) | Inflation (response) | Unemployment (response) |
|---|---|---|---|
| h = 0 | -0.052* | 0.003 | 0.053 |
| h = 1 | -0.149*** | 0.013 | 0.048 |
| h = 2 | -0.169*** | -0.012 | 0.122** |
| h = 3 | -0.141*** | -0.005 | 0.173*** |
| h = 4 | -0.081 | 0.031 | 0.142** |
| h = 5 | -0.071 | -0.020 | 0.169** |
| h = 6 | -0.079** | -0.010 | 0.255*** |
| h = 7 | -0.069* | -0.034 | 0.069 |
| h = 8 | -0.074* | -0.084*** | 0.191*** |
| h = 9 | -0.050 | -0.087*** | 0.145*** |
| h = 10 | -0.013 | -0.051** | 0.169*** |
| h = 11 | -0.085** | -0.065*** | 0.218*** |
| h = 12 | 0.020 | -0.096*** | 0.223*** |
Note: Significance levels: *** p<0.01, ** p<0.05, * p<0.1. The EPU shock is standardized (z-score). Industrial production is measured as monthly IP growth ; inflation and unemployment are measured in percent. Coefficients are therefore interpretable in percentage-point units.
Table 4.
Statistical significance of effects across horizons for all variables.
| Variable | Immediate (h = 0) |
Short-Term (h = 1–4) |
Medium-Term (h = 5–8) |
Long-Term (h = 9–12) |
|---|---|---|---|---|
| IP growth | -0.052* | -0.149*** | -0.079** | -0.085** |
| Inflation | 0.003 | 0.031 | -0.084*** | -0.096*** |
| Unemployment rate |
0.053 | 0.173*** | 0.191*** | 0.218*** |
Note: Significance levels: *** p<0.01, ** p<0.05, * p<0.1. Source: The authors calculated from the data collected on Stata software.
Table 5.
Summary of effects.
| Factor | Key Finding |
|---|---|
| Industrial Production (IP growth) response | Contractionary effect concentrated in the short run: IPI falls on impact (−0.052*, h=0) and reaches its trough at h=2 (−0.169***), with predominantly negative responses through h=11 before reverting toward zero by h=12. |
| Inflation response | Delayed disinflation: near-term effects are small and insignificant, but inflation turns significantly negative from h=8 onward (−0.084*** at h=8; −0.096*** at h=12), consistent with a lagged demand/real-activity channel. |
| Unemployment response | Delayed and persistent labor-market deterioration: unemployment rises significantly from h=2 (0.122**) and peaks around h=6 (0.255***), remaining elevated through the one-year horizon (0.223*** at h=12). |
Note: Significance levels: *** p<0.01, ** p<0.05, * p<0.1. Source: The authors calculated from the data collected on Stata software.
Disclaimer/Publisher’s Note: The statements, opinions and data contained in all publications are solely those of the individual author(s) and contributor(s) and not of MDPI and/or the editor(s). MDPI and/or the editor(s) disclaim responsibility for any injury to people or property resulting from any ideas, methods, instructions or products referred to in the content. |
© 2026 by the authors. Licensee MDPI, Basel, Switzerland. This article is an open access article distributed under the terms and conditions of the Creative Commons Attribution (CC BY) license (http://creativecommons.org/licenses/by/4.0/).
Copyright: This open access article is published under a Creative Commons CC BY 4.0 license, which permit the free download, distribution, and reuse, provided that the author and preprint are cited in any reuse.


