

Submitted:
05 August 2026
Posted:
05 August 2026
You are already at the latest version
Abstract
Background/Objectives: Recent World Health Organization (WHO) classifications of gliomas emphasize integrated molecular diagnosis, improving diagnostic precision but increasing the need for immunohistochemistry and genetic testing. As a result, increasing costs and a decrease in diagnostic rates in developing countries have become issues. Consequently, there is growing interest in the development of image-based approaches that can extract biological information from routine histopathological slides. In this study, we investigated whether nuclear morphometric features derived from hematoxylin–eosin (HE) images of tumors can predict the molecular subtype, pathological tumor type, WHO grade, and prognosis of gliomas using machine learning (ML). Methods: A total of 157 specimens were analyzed. All HE slides were scanned and 15 regions of interest (ROIs) were chosen. About 960 features of cell nuclei in the ROIs were analyzed using support vector machine and random forest models to predict molecular alterations (isocitrate dehydrogenase 1 [IDH-1], alpha thalassemia/mental retardation syndrome X-linked, p53, and the 1p/19q codeletion), pathological diagnosis, WHO grade, and prognosis. Results: The tumor type classification and prognosis were predicted with 96% and 94% respectively. IDH-1 mutation status was predicted with 95% accuracy. Feature importance analysis indicated that parameters associated with nuclear shape, particularly orientation, eccentricity, and solidity, contributed substantially to the prediction models. Conclusions: Quantitative nuclear morphometric analysis of HE images using ML enables accurate prediction of the molecular characteristics and prognosis of gliomas. This approach may complement conventional diagnostics, and demonstrates the potential to reduce diagnostic costs. Furthermore, with the incorporation of additional genetic analyses, this approach may lead to personalized medicine in the future.
Keywords:
glioma
; artificial intelligence
; machine learning
; integrated diagnosis
1. Introduction
Gliomas are the most common primary malignant brain tumors, broadly categorized into astrocytoma (ASC), oligodendroglioma (ODG), and glioblastoma multiforme (GBM). Accurate diagnosis of the specific glioma type is crucial, as both prognosis and treatment options differ greatly among tumor types. Previously, gliomas were only classified morphologically using hematoxylin-eosin (HE)-stained sections. However, histopathological tumor classification may be affected by the expertise of the pathologist, may lack consistency, and may demonstrate inter-observer differences. With the introduction of the concept of the molecular diagnosis of gliomas in the 2016 World Health Organization (WHO) Classification of Tumors of the Central Nervous System fourth revised edition (1), integrated diagnostics, in which molecular diagnostics are added to conventional morphological diagnostics has become essential, with the possibility of a more accurate diagnosis (2). Subsequently, with the release of the fifth edition of the WHO classification, the concept of molecular GBM was introduced and it became possible to diagnose GBM not only from its morphological features, but also from its gene mutations (3). One of the advantages of molecular-based diagnosis is that it enables more objective classification by reducing reliance on subjective interpretations by pathologists. The molecular classification of gliomas is fundamentally based on isocitrate dehydrogenase 1 (IDH-1), alpha thalassemia/mental retardation syndrome X-linked (ATRX) and p53 gene mutation status, and the 1p/19q codeletion. Gliomas with wild-type IDH-1 are defined as GBM, those with IDH-1 mutations and concurrent 1p/19q codeletion as ODG, and those with IDH-1 mutations as well as ATRX and p53 mutations as ASC. The WHO grade of brain tumors is also used as an indicator of malignancy, separate from histological classification, and these grades are directly associated with prognosis. Therefore, the accurate diagnosis of these tumors is essential, but the increasing reliance on immunohistochemistry and genetic testing poses various problems, such as increased workload for pathologists and higher costs. In fact, the number of slides ((analyzed?)) per case has increased by 60% in the previous 10 years, with immunohistochemical staining doubling and molecular pathology diagnoses tripling (4). Furthermore, in developing countries, there are many regions where limited resources make it impossible to implement the newest molecular diagnostic techniques, and disparities in diagnostic accuracy due to economic inequality have become a problem. In the Asia-Pacific region, only about 26% of facilities routinely perform molecular testing for central nervous system tumors, and only about 40% are capable of evaluating molecular markers (5) (6). In recent years, artificial intelligence (AI) has gained significant attention in the medical field and is actively being investigated as a means to reduce workload. In the field of pathology, AI has also begun to be used to assist with molecular diagnostics (7). AI has enabled the use of quantitative nuclear atypia for prognostic prediction across multiple tumor types, including hepatocellular carcinoma (8), breast cancer (9), bladder cancer (10), renal cancer (11), and colorectal cancer (12). This led us to conclude that AI-based analysis of HE-stained slides may enable molecular diagnostic assessment without immunostaining or genetic analysis. If this becomes possible, it would lead to significant reductions in personnel and financial costs, and enable remote diagnosis for patients in developing countries. We hence considered whether the same AI-based methodology could be used to determine the tumor type of gliomas and classify malignancy grade. In this study, we investigated AI-based analysis of HE-stained histopathological images to directly predict patient prognosis, pathological diagnosis (GBM, ASC, or ODG), and WHO grade. Furthermore, we analyzed which features extracted from the HE images contributed to these predictions, and investigated the similarities and differences among the features utilized for prognostic estimation, pathological diagnosis, and grade prediction.
2. Materials and Methods
The analyzed samples were surgically resected specimens collected at the Department of Neurosurgery of Tokyo Medical University, from January 2010 to December 2020 (a total of 157 specimens from 133 patients who were followed up for at least 1 year after surgery). The samples comprised 86 GBMs (IDH-1 wild type), 51 ASCs (IDH-1 mutant, p53 positive, and ATRX loss), and 20 ODGs (IDH-1 mutant, 1p/19q codeletion positive) specimens. As whether or not gross total resection (GTR) is achieved greatly affects the prognosis of glioma patients, for prognostic analysis, 66 specimens obtained from primary surgeries that achieved GTR were included in dataset B (38 GBMs, 16 ASCs, and 12 ODGs). Among the samples in dataset B, about 25% were allocated for training (dataset B1), and the remaining for prediction (dataset B2), and pathological status was divided evenly. Tumor types within datasets B1 and B2 were 27 GBMs, 11 ASCs, and 9 ODGs, and 11 GBMs, 5 ASCs, and 3 ODGs, respectively. The endpoint of the prognostic analysis was defined as either confirmed tumor recurrence or death, and survival time was calculated as the number of days from the date of surgery. For pathological diagnosis and WHO grading training and prediction, the remaining 91 specimens (48 GBMs, 35 ASCs, and 8 ODGs) as dataset A were used for training, and then the results from dataset A were subsequently used for prediction testing using dataset B (Figure 1). In dataset B, the number of specimens corresponds directly to the number of patients. In contrast, dataset A includes specimens obtained from reoperations for tumor recurrence in patients originally included in dataset B; therefore, the number of specimens does not correspond one-to-one with the number of patients. For simplicity and consistency, specimens in dataset A are treated as independent cases and are described as the number of cases in the analysis.
This study was conducted in accordance with principles of the Declaration of Helsinki and was approved by the Ethics committee of Tokyo Medical University (study approval no.: SH140).
Dataset A consists of 91 specimens from patients with tumor recurrence or incomplete resection. Dataset B consists of 66 specimens from patients who underwent their first surgery, which was gross total resection.
ASC: astrocytoma; GBM: glioblastoma multiforme; ODG: oligodendroglioma; ROI: region of interest
For all patients, specimens were HE-stained, immunostained for the IDH-1R132H (Dianova, Germany), ATRX (Sigma, Japan), and p53 (Dako Agilent Technologies, USA), and scanned using a whole-slide imaging (WSI) scanner (Nano Zoomer: Hamamatsu Photonics, Japan) at ×20 image magnification. Presence of the 1p/19q codeletion was also investigated in all patients using fluorescent in situ hybridization. For machine learning analysis, regions of interest (ROIs) of 2,048 × 2,048 pixels from HE-stained WSI at ×40 magnification were obtained manually. Immunohistochemically stained images were used for tumor type classification. For the assessment of tumor cell nuclear morphology, manual selection of ROIs was performed to avoid areas of necrosis, surgically induced crush artifacts, regions with prominent neovascularization, hemorrhagic foci or abundant blood cells, and tumor margins. Consequently, 4,127 ROIs were extracted and included in the analysis. The number of ROIs for each dataset A and B (B1 and B2) are shown in Figure 1. All ROI images included microenvironmental elements, such as blood vessels, blood cells, and necrotic areas. Regions excluded from tumor cell measurements were manually masked in green. Nuclei were extracted using the free segmentation software Ilastik (13) and overlapping nuclei were separated using pix2pix, a deep learning (DL)-based approach. The nuclear mask images generated through this process were overlaid onto the original HE-stained slide images to construct images containing only tumor cell nuclei. Using CellProfiler (https://cellprofiler.org) (14), 3,726,727 nuclei within the ROIs were analyzed to extract 82 nuclear features, including nuclear morphological characteristics and intranuclear chromatin texture features. Subsequently, using individual nuclear features of Cell Feature Level Co-occurrence Matrix (CFLCM) (15) (https://github.com/Shen-tokyomed/Breast_AI_CFLCM_tool) as inputs, a total of 960 feature variables—comprising the mean, variance, and heterogeneity of each feature at the ROI level—were generated to construct the final feature dataset (Figure 2).
A total of 15 random ROIs were chosen within the HE-stained WSIs (A, B). The cytoplasm and interstitium were masked (C), and only the nuclei were extracted (D, E). Subsequently, the nuclei features and case information were integrated and analyzed using support vector machine and random forest (G, E).
ATRX: alpha thalassemia/mental retardation syndrome X-linked, CFLCM: cell feature level co-occurrence matrix, IDH-1: isocitrate dehydrogenase 1, HE: hematoxylin and eosin; ROI: region of interest, WSI: whole-slide imaging
Machine learning analyses were conducted using support vector machine (SVM; e1071 package with a linear kernel) and random forest (RF) implemented on the R platform. In addition, statistical approaches included stepwise discriminant analysis (SDA), Cox proportional hazards regression analysis, Kaplan–Meier estimation, and t-distributed stochastic neighbor embedding (t-SNE). To evaluate generalization performance, SVM models were trained and validated using five-fold cross-validation, and RF models were assessed using out-of-bag (OOB) estimation. To investigate the contribution of individual features, Cox proportional hazards regression analysis and SDA were performed. For the machine learning models, default parameter settings were used. In SDA, the criteria for feature entry and removal were set at a p-value of 0.05. The likelihood for each case was determined by averaging the ROI-level likelihoods obtained from the SVM and RF models. The contribution of each feature within each model was evaluated by calculating the percentage of the sum of its standardized weight values relative to the total weight across the entire model.
3. Results
3.1. Molecular Type, Pathological Diagnosis, and WHO Grade Analysis of the Specimens
With respect to molecular characteristics, we investigated whether nuclear morphometric features could differentiate between tumors with wild type versus mutant IDH-1 status, the presence or absence of 1p/19q codeletion, ATRX retention versus loss, and presence or absence of p53 expression, as well as tumor type (ODG, ASC, or GBM) and WHO grade (2, 3, or 4). Classification models were constructed using SVM and RF algorithms based on training dataset A, and were subsequently validated on dataset B. The results are summarized in Table 1. The confusion matrices for each analysis are shown in Supplementary Figure 1. The all ROIs model was constructed using all ROIs available in dataset A. However, except for the IDH-1 analysis, the number of training ROIs was markedly imbalanced across classes in each analysis. To address this issue, cases classified as GBM and grade 4 ASC, which accounted for the majority of ROIs, were excluded, and an additional down-sampling method was implemented so that the number of ROIs in each group differed by no more than approximately twofold. Models trained using this procedure were defined as the balanced model.
For all analytical categories except IDH-1 status, the balanced models were therefore restricted to analyses including only ODG and ASC cases. In the tumor type analysis, the all ROIs model included GBM cases and consisted of three groups, with grade 4 tumors also being included. In contrast, the balanced model for tumor type analysis was limited to a two-class classification. Across all analyses, training using the all ROIs model (2,266 ROIs) achieved accuracies of 98% for ATRX and p53, and 100% accuracy, sensitivity, and specificity for the remaining classification tasks. These results indicate that the models were in an overtrained (overfitted) state. The test results also demonstrated favorable performance for IDH-1 status, with both SVM and RF models achieving accuracies exceeding 95% and sensitivities and specificities at approximately 90%. However, for 1p/19q codeletion status, overall accuracy was approximately 78%, whereas sensitivity was below 20%. Among the 66 cases, 17 tumors had the 1p/19q codeletion; of these, only three were correctly classified by the SVM model and two by the RF model. However, all tumors without the 1p/19q codeletion, which constituted the majority, were correctly classified, resulting in an apparently moderate overall accuracy despite low sensitivity for the minority class. On the other hand, the balanced model achieved an accuracy exceeding 90%, with sensitivity also greater than 80%. In this setting, five GBM cases were classified as having the 1p/19q codeletion; consequently, only one false-negative case was observed among the 12 cases analyzed. For p53, the high prevalence of positive cases resulted in a low specificity of 47%; however, the specificity improved to more than 88% when a balanced model was applied. For ATRX, a discrepancy was observed between the SVM and RF models, with the SVM demonstrating superior performance overall. For tumor type classification, the all ROIs model involved three classes; therefore, sensitivity and specificity could not be directly calculated. The classification accuracy was 87% for the all ROIs model and improved to 96% with the balanced model, with sensitivity and specificity reaching 100% and 91%, respectively. By contrast, for tumor grade classification, the accuracy decreased in the balanced model from the original value of 89%. This reduction may be attributable to the exclusion of GBM and ASC grade 4 cases, as well as to the extremely small number of grade 2 ODG cases. In addition, tumor grade at the individual ROI level may be heterogeneous as a form of microenvironmental variability, and subjective factors in grading may also have affected the results. The results obtained from all ROIs (n = 4,127) used in this study are summarized in Table 2.
3.2. Survival Time Analysis
The results of Cox proportional hazards regression analysis for the specimens in dataset B, categorized according to molecular features, are shown in Table 3. In this dataset, more than half of the specimens were diagnosed as GBM, suggesting that GBM status is a crucial determinant of patient survival. Figure 4 shows Kaplan–Meier survival curves of the patients according to tumor type, histological grade, and molecular subtype. Regarding tumor type, ODG was associated with a favorable prognosis, whereas GBM was associated with an unfavorable prognosis. ASC demonstrated an intermediate prognosis between ODG and GBM. In terms of WHO grade, grade 4 tumors were associated with an unfavorable prognosis, whereas grade 2 and grade 3 tumors showed relatively favorable outcomes, confirming the generally recognized prognostic trend. Regarding molecular status, patients with tumors harboring an IDH-1 mutation and 1p/19q codeletion had a favorable prognosis. Additionally, tumors characterized by ATRX loss and absence of p53 expression were associated with more favorable clinical outcomes (Figure 4). Cox proportional hazards regression analysis demonstrated that only IDH-1 mutation status had a statistically significant effect on patient prognosis. Using nuclear morphometric features, we evaluated whether clinical outcomes could be predicted for the 66 cases in dataset B by applying SVM and RF models (Table 4). Confusion matrices at both the ROI level and the case level for each follow-up year, as well as OOB estimates obtained from the RF models, are shown in Supplementary Figure 2. For aggregation at the case level, the mean likelihood of recurrence or death across all ROIs for each case was calculated, and a cutoff value of 0.5 was applied. Although all patients had been followed up for at least 1 year, 6 patients were alive without recurrence but were transferred to other institutions, resulting in unknown outcomes in the second and third years. Consequently, analyses at the 2-year and 3-year follow-up time points were performed on 60 patients. At the 1-year follow-up, patients with recurrence-free survival were predominant, whereas at the 2-year and 3-year follow-ups, patients with recurrence or death became more prevalent. Therefore, a total of 12 models, i.e., models using all available ROI data and models in which ROI-level data were balanced between outcome groups were constructed. Across all SVM models, 5-fold cross-validation yielded accuracies ranging from 85% to 100%, and an accuracy of 100% was achieved at the case level. Although misclassifications were observed at the ROI level within individual cases, these errors were resolved after aggregation to the case level, resulting in correct case-level predictions. These findings indicate that survival analysis based on nuclear morphometric features is feasible.
Next, dataset B1 was used as the training cohort to evaluate the predictive performance of the models in dataset B2 (Table 5). Confusion matrices and OOB estimates obtained from the RF models are presented in Supplementary Figure 3. Six cases (4 cases in the training set and 2 cases in the test set) lacked follow-up data beyond 1 year and were therefore excluded from the corresponding analyses. Thererfore,, the analyses were performed on 43 training cases and 17 test cases. Overall, predictive performance was slightly higher at the 2-year and 3-year follow-up points than at the 1-year follow-up point. At the case level in the test cohort, all models achieved accuracies exceeding 94%. Although sensitivity at 1 year was 80% for both the SVM and RF models, and specificity decreased to 80% in the 3-year RF model, case-level accuracy remained consistently high at 94%.
(A and B) Graphs for visualizing high-dimensional datasets to confirm the results of SVM (A) and RF (B). (C) Table explaining the tumor groups. There were no tumors in group 7 (IDH-1 wild-type, 1p/19q codeletion [+], ATRX loss, p53 [−]).ATRX: alpha thalassemia/mental retardation syndrome X-linked, IDH-1: isocitrate dehydrogenase 1, ROI: region of interest; RF: random forest; SVM: support vector machine
3.3. Features Playing a Crucial Role in the Analyses
The quantified nuclear features can be broadly classified into nuclear shape-associated features and intranuclear texture features. Shape-associated features include the nuclear area, perimeter, length of the major nuclear axis and the minor axis orthogonal to it, circularity, and the orientation of the major axis within the tissue architecture. In contrast, nuclear texture features were derived after converting the images to grayscale. Intranuclear regions were represented by gray-level co-occurrence matrices, from which texture features reflecting chromatin organization were quantified using Haralick functions (16). Using these features as inputs, CFLCM was applied at the cell level to calculate the mean, variance, and heterogeneity of each feature within the ROI. The weighted contributions of individual features were then aggregated, and their relative proportions with respect to the total weight are summarized in Table 6. Although some differences were observed between the SVM and RF models, largely similar features predominated in the analyses of prognosis, molecular subtypes, tumor types, and tumor grades. All molecular type (pattern) analysis results by t-SNE are shown in Figure 4.
4. Discussion
The pathological diagnosis of tumors based on AI has been available since about 2015, and regarding genetic mutations, the first report of the diagnosis of genetic variants in prostate and lung cancer through a pipeline using DL from an HE-stained whole slide was reported in 2018 (17) (18) (19). Similarly, in the field of neurosurgery, Wang et al. reported the analysis of molecular subtypes using HE-stained slides, and Nasrallah et al. reported the use of WSI of frozen sections for rapid intraoperative diagnosis (20) (21). Furthermore, Pejrimovsky et al. analyzed histology-based risk scores calculated from HE-stained WSIs using convolutional neural networks to estimate patient prognosis. The distribution of transcriptional subtypes within the tumor was mapped, and their prognostic relevance was investigated (22). This was a breakthrough and suggested that AI may be useful for estimating the prognosis of patients from their pathological specimens, and HE-stained slides may be annotated with prognostic information to assist in postoperative adjuvant therapy in the future. In the present study we only analyzed the nuclei in the images, and deleted other structures, such as the stroma and vessels. It is common and important to analyze whole tissue structures, but in the case of brain tumors, sometimes the submitted pathology specimens are very small or have become fragmented, and may contain artifacts, such as hemorrhaging, which may also be a problem. If we could analyze whole tissue, including the stroma, we believe we would be able to gain further insights. However, the number of specimens that cannot be used because they are too small or were modified owing to operative artifacts would increase, and hence the number of specimens that can be analyzed would decrease. For these reasons, we focused only on cell nuclei in the present study.
In terms of pathological diagnosis and WHO grade, prognosis was most favorable in ODG, followed by ASC, and least favorable in GBM. The distributions of grade as well as molecular markers, including IDH-1, 1p/19q codeletion, ATRX, and p53 were largely consistent with the expected clinical and molecular characteristics. In the present cohort (dataset B, n = 66), GBM accounted for the majority of cases (38 cases). When these 38 cases were analyzed using the AI-based model, 33 cases (87%) were classified as GBM, 35 cases (92%) showed ATRX retention, and 32 cases (84%) were positive for p53, indicating a substantial predominance of ATRX retention and p53 positivity in this cohort. Therefore, the potential effects of this imbalance cannot be excluded. For the analysis of each molecular subtype, to address group imbalance, ROIs were randomly selected from the group with a larger number of ROIs. The number of selected ROIs was adjusted to be no more than twice that of the smaller comparison group. This procedure was performed in parallel as an imbalance-adjusted analytical model.
In predictions based on nuclear features for 1-, 2-, and 3-year recurrence-free survival and overall survival versus recurrence or death, the models for the 2-year and 3-year time points tended to show higher accuracy than those for the 1-year time point. This tendency is considered to be attributable to the presence of GBM cases that remain recurrence-free and alive within the first year but subsequently experience recurrence or death by the second year, as well as ASC cases in which recurrence or death occurs within the first year. In the analysis according to molecular subtype, the results were strongly influenced by GBM, which accounted for more than half of the cases. After excluding GBM, molecular alterations such as the 1p/19q codeletion, p53 expression, and ATRX loss could be differentiated on the basis of nuclear features. The relative importance of the features used differed between the models as follows: shape-associated features accounted for approximately 75% of the total importance in SVM, whereas they accounted for about 50% in RF. This difference is likely attributable to the analytical frameworks of the two methods, with SVM using a one-vs-one strategy and RF using a one-vs-rest approach. In SVM, each feature functions to differentiate the explanatory variables, such as survival condition, molecular pattern, and tumor type, based on their respective distributions. In contrast, RF emphasizes similarity-based aggregation, progressively grouping samples and deriving the final classification decision. Overall, RF tended to evaluate all features more globally. However, when the feature profiles of ROIs grouped by similarity were incorrectly mapped to the final explanatory variables, a tendency toward reduced accuracy was observed.
In the SVM model, the most strongly recognized feature was orientation. Orientation was defined as the angle between the major axis of the cell nucleus and the X-axis of the image, measured in a range from − 90° to + 90°. A high degree of heterogeneity in orientation indicates that the spatial distribution of cell nuclei is not uniform. In adenocarcinoma, nuclei are typically distributed surrounding glandular lumina, resulting in high orientation heterogeneity. In contrast, in nonadenocarcinoma tumors such as squamous cell carcinoma, orientation heterogeneity is often associated with prognosis. In the RF model, eccentricity was identified as the most important feature. Eccentricity represents the circularity of the nucleus, with a value of 0 indicating a perfect circle and higher values corresponding to increasingly elongated and elliptical shapes. Furthermore, in the analysis of 1p/19q codeletion status and tumor type, solidity emerged as an important feature. Solidity is defined as the ratio of the nuclear area to the area of its convex hull. A perfectly convex nucleus yields a value close to 1, whereas nuclei with irregular or indented contours have lower values. Thus, solidity reflects morphological characteristics of nuclear shape. The finding that ODGs with 1p/19q codeletion tend to show higher solidity may reflect the relatively round nuclear morphology characteristic of these tumors.
In glioma, prognosis is largely determined by tumor type and WHO grade. Our findings suggest that prognostic prediction based on nuclear morphological features is essentially equivalent to prediction by tumor type or grade. However, nuclear features may potentially contain additional biological information beyond conventional histopathological classification. Considering the marked heterogeneity of gliomas as a disease entity, further investigation using cohorts stratified by fixed tumor type and grade will be necessary to determine whether nuclear morphometric features provide independent prognostic value.
This study has several limitations. First, it was a retrospective study conducted at a single institution. Although the cohort represents cases accumulated over a 10-year period, the sample size remains relatively small for the development of AI-based predictive models. Therefore, further accumulation of cases is necessary to improve model stability and robustness.
Second, although the distributions of tumor types, tumor grades, and molecular alterations (positive / negative status) reflected those encountered in routine clinical practice, substantial class imbalance was present from the perspective of AI model development. To overcome this issue, adjustments based on the number of ROIs were required during model construction. Additional case collection will be necessary to further enhance model performance and generalizability. Moreover, external validation is required to assess the robustness and reproducibility of the proposed models. Third, there were a limited number of cases eligible for recurrence and survival analyses. Analyses of recurrence and prognosis require sufficient follow-up duration. However, as a tertiary referral university hospital, many patients are referred primarily for surgical treatment and subsequently return to their local hospitals for postoperative management. Consequently, long-term follow-up information is often unavailable. Fourth, in the present study, AI-based prediction of molecular patterns from H&E-stained images was performed using features extracted exclusively from cell nuclei. However, several histopathological features that play important roles in routine neuropathological diagnosis, including microvascular proliferation, necrosis, and mitotic activity, were not incorporated into the current models. In addition, ROI selection was performed manually. This approach was adopted because brain tumor specimens are frequently fragmented during surgical resection and often contain substantial surgical artifacts. Furthermore, automatic exclusion of non-neoplastic components, such as necrotic areas, blood vessels, and vascular endothelial cells, as well as gliosis regions associated with tumor infiltration, remains technically challenging. Future studies incorporating these histopathological features and automated tissue segmentation strategies may further improve model performance and clinical applicability.
5. Conclusions
This is the first report to our knowledge on the accuracy of AI prediction of the molecular classification, WHO grade, and prognosis of gliomas using HE-stained WSIs, and machine learning focusing on nuclear features. Both SVM and RF models showed high predictive performance, particularly for IDH-1 mutation status, tumor type classification, and survival prediction at the case level. These findings indicate that nuclear morphological characteristics observed in conventional HE slides contain biologically relevant information associated with molecular alterations and clinical outcomes. Our results suggest the potential of AI-based nuclear morphometric analyses as a supportive tool for the pathological diagnosis and prognostic stratification of gliomas. Such methods may help to improve diagnostic objectivity, reduce reliance on subjective interpretation, and contribute to more efficient and precise clinical decision-making in glioma treatment. This study demonstrated a potential method of diagnosis that may reduce both human and financial burdens in healthcare, and help to bridge the gap between developed and developing countries. Our results also indicate the potential for this method to contribute to personalized medicine in the future, through the incorporation of additional genetic analyses.
Supplementary Materials
The following supporting information can be downloaded at the website of this paper posted on Preprints.org, Supplementary Figure 1. Molecular pattern, pathological diagnosis, and WHO grade of the specimens divided into the training and test datasets; Supplementary Figure 2. Survival analysis of the patients; Supplementary Figure 3. Survival analysis of the patients divided into the training and test datasets.
Author Contributions
Conceptualization, Kenta Nagai; Methodology, Kenta Nagai; Software, Akira Saito and Bin Shen; Validation, Akira Saito, Hajime Horiuchi and Bin Shen; Formal analysis, Akira Saito, Bin Shen and Koji Fujita; Investigation, Kenta Nagai, Akira Saito, Hajime Horiuchi, Bin Shen and Koji Fujita; Data curation, Akira Saito and Bin Shen; Writing—original draft, Kenta Nagai; Writing—review & editing, Hajime Horiuchi, Jiro Akimoto, Shinjiro Fukami, Masahiko Kuroda and Michihiro Kohno; Visualization, Akira Saito; Supervision, Jiro Akimoto, Shinjiro Fukami, Masahiko Kuroda and Michihiro Kohno; Funding acquisition, Masahiko Kuroda. All authors have read and agreed to the published version of the manuscript.
Funding
This research received no external funding.
Institutional Review Board Statement
This study was conducted in accordance with principles of the Declaration of Helsinki and was approved by the Ethics committee of Tokyo Medical University (study approval no.: SH140).
Data Availability Statement
The original contributions presented in this study are included in the article/supplementary material. Further inquiries can be directed to the corresponding author.
Acknowledgments
The authors are indebted to Helena Akiko Popiel, Center for International Education and Research of Tokyo Medical University, for her review of the manuscript. Bin Shen has received an honorarium as the Vice President of 91360 Japan Co., Ltd.
Conflicts of Interest
The authors declare no conflict of interest.
References
- Louis DN, Perry A, Reifenberger G, von Deimling A, Figarella-Branger D, Cavenee WK, et al. The 2016 World Health Organization Classification of Tumors of the Central Nervous System: a summary. Acta Neuropathol. 2016;131(6):803-20.
- Smith HL, Wadhwani N, Horbinski C. Major Features of the 2021 WHO Classification of CNS Tumors. Neurotherapeutics. 2022;19(6):1691-704.
- Louis DN, Perry A, Wesseling P, Brat DJ, Cree IA, Figarella-Branger D, et al. The 2021 WHO Classification of Tumors of the Central Nervous System: a summary. Neuro Oncol. 2021;23(8):1231-51.
- Warth A, Stenzinger A, Andrulis M, Schlake W, Kempny G, Schirmacher P, et al. Individualized medicine and demographic change as determining workload factors in pathology: quo vadis? Virchows Arch. 2016;468(1):101-8.
- Gilani A, Altaf A, Shakir M, Minhas K, Enam SA. Challenges in implementing 2021 WHO CNS tumor classification in a resource-limited setting. Neurooncol Pract. 2025;12(3):401-12.
- Sarkar C, Rao S, Santosh V, Al-Hussaini M, Park SH, Tihan T, et al. Resource availability for CNS tumor diagnostics in the Asian Oceanian region: A survey by the Asian Oceanian Society of Neuropathology committee for Adapting Diagnostic Approaches for Practical Taxonomy in Resource-Restrained Regions (AOSNP-ADAPTR). Brain Pathol. 2025;35(4):e13329.
- Guo Y, Hao Z, Zhao S, Gong J, Yang F. Artificial Intelligence in Health Care: Bibliometric Analysis. J Med Internet Res. 2020;22(7):e18228.
- Saito A, Toyoda H, Kobayashi M, Koiwa Y, Fujii H, Fujita K, et al. Prediction of early recurrence of hepatocellular carcinoma after resection using digital pathology images assessed by machine learning. Mod Pathol. 2021;34(2):417-25.
- Shen B, Saito A, Ueda A, Fujita K, Nagamatsu Y, Hashimoto M, et al. Development of multiple AI pipelines that predict neoadjuvant chemotherapy response of breast cancer using H&E-stained tissues. J Pathol Clin Res. 2023;9(3):182-94.
- Tokuyama N, Saito A, Muraoka R, Matsubara S, Hashimoto T, Satake N, et al. Prediction of non-muscle invasive bladder cancer recurrence using machine learning of quantitative nuclear features. Mod Pathol. 2022;35(4):533-8.
- Matsubara S, Saito A, Tokuyama N, Muraoka R, Hashimoto T, Satake N, et al. Recurrence prediction in clear cell renal cell carcinoma using machine learning of quantitative nuclear features. Sci Rep. 2023;13(1):11035.
- Mazaki J, Umezu T, Saito A, Katsumata K, Fujita K, Hashimoto M, et al. Novel Artificial Intelligence Combining Convolutional Neural Network and Support Vector Machine to Predict Colorectal Cancer Prognosis and Mutational Signatures From Hematoxylin and Eosin Images. Mod Pathol. 2024;37(10):100562.
- Berg S, Kutra D, Kroeger T, Straehle CN, Kausler BX, Haubold C, et al. ilastik: interactive machine learning for (bio)image analysis. Nat Methods. 2019;16(12):1226-32.
- Kamentsky L, Jones TR, Fraser A, Bray MA, Logan DJ, Madden KL, et al. Improved structure, function and compatibility for CellProfiler: modular high-throughput image analysis software. Bioinformatics. 2011;27(8):1179-80.
- Saito A, Numata Y, Hamada T, Horisawa T, Cosatto E, Graf HP, et al. A novel method for morphological pleomorphism and heterogeneity quantitative measurement: Named cell feature level co-occurrence matrix. J Pathol Inform. 2016;7:36.
- Haralick R M SK, Dinstein I. Textural Features for Image Classification. IEEE Trans Syst Man Cybern. 1973;53(6):610-21.
- Acs B, Rantalainen M, Hartman J. Artificial intelligence as the next step towards precision pathology. J Intern Med. 2020;288(1):62-81.
- Schaumberg AJ, Rubin MA, Fuchs TJ. H&E-stained Whole Slide Image Deep Learning Predicts SPOP Mutation State in Prostate Cancer. bioRxiv. 2018.
- Coudray N, Ocampo PS, Sakellaropoulos T, Narula N, Snuderl M, Fenyo D, et al. Classification and mutation prediction from non-small cell lung cancer histopathology images using deep learning. Nat Med. 2018;24(10):1559-67.
- Wang W, Zhao Y, Teng L, Yan J, Guo Y, Qiu Y, et al. Neuropathologist-level integrated classification of adult-type diffuse gliomas using deep learning from whole-slide pathological images. Nat Commun. 2023;14(1):6359.
- Nasrallah MP, Zhao J, Tsai CC, Meredith D, Marostica E, Ligon KL, et al. Machine learning for cryosection pathology predicts the 2021 WHO classification of glioma. Med. 2023;4(8):526-40 e4.
- Roetzer-Pejrimovsky T, Nenning KH, Kiesel B, Klughammer J, Rajchl M, Baumann B, et al. Deep learning links localized digital pathology phenotypes with transcriptional subtype and patient outcome in glioblastoma. Gigascience. 2024;13.
Figure 1.
Details of the datasets.
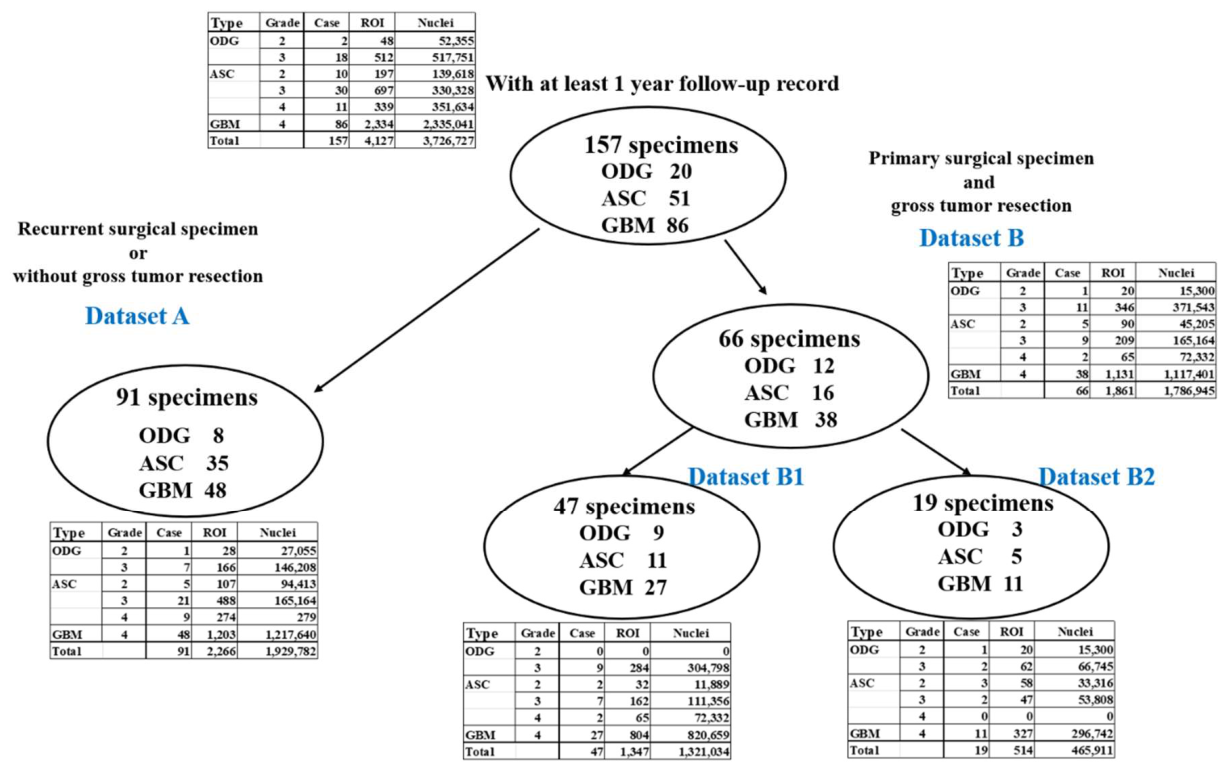
Figure 2.
Procedure of machine learning analysis.
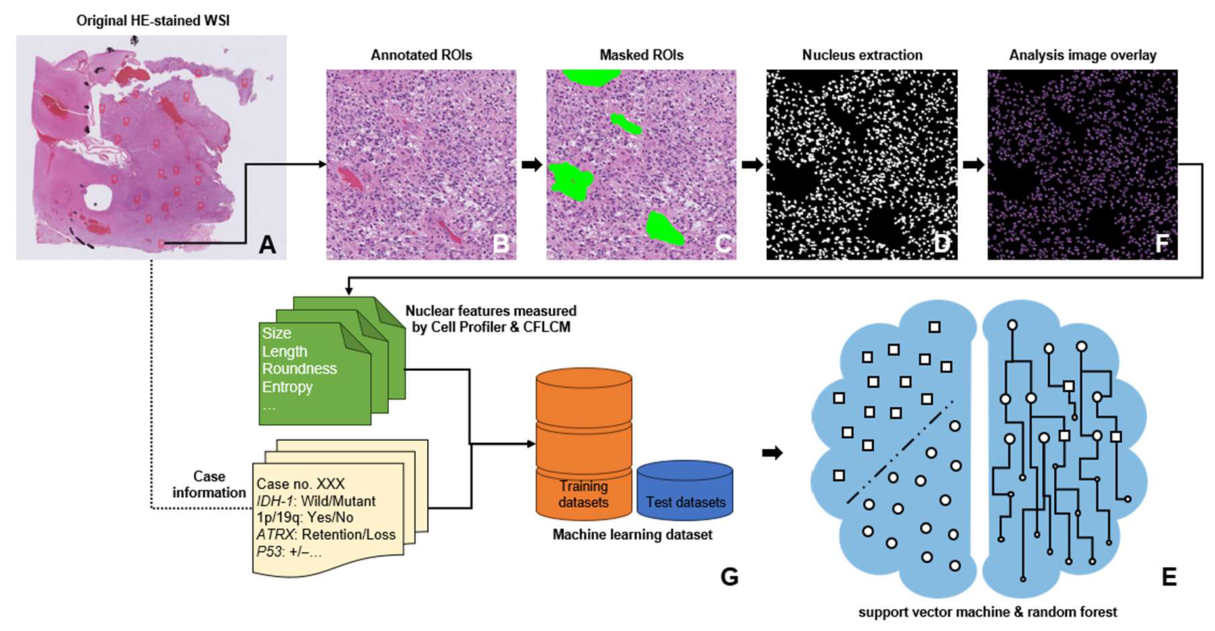
Figure 4.
Kaplan–Meier survival curves of patients with tumors grouped by various characteristics. Survival curves are shown of patients with tumors grouped by (A) pathological type, (B) WHO grade, and (C) each molecular type. ATRX: alpha thalassemia/mental retardation syndrome X-linked, IDH-1: isocitrate dehydrogenase 1.
Figure 4.
Kaplan–Meier survival curves of patients with tumors grouped by various characteristics. Survival curves are shown of patients with tumors grouped by (A) pathological type, (B) WHO grade, and (C) each molecular type. ATRX: alpha thalassemia/mental retardation syndrome X-linked, IDH-1: isocitrate dehydrogenase 1.
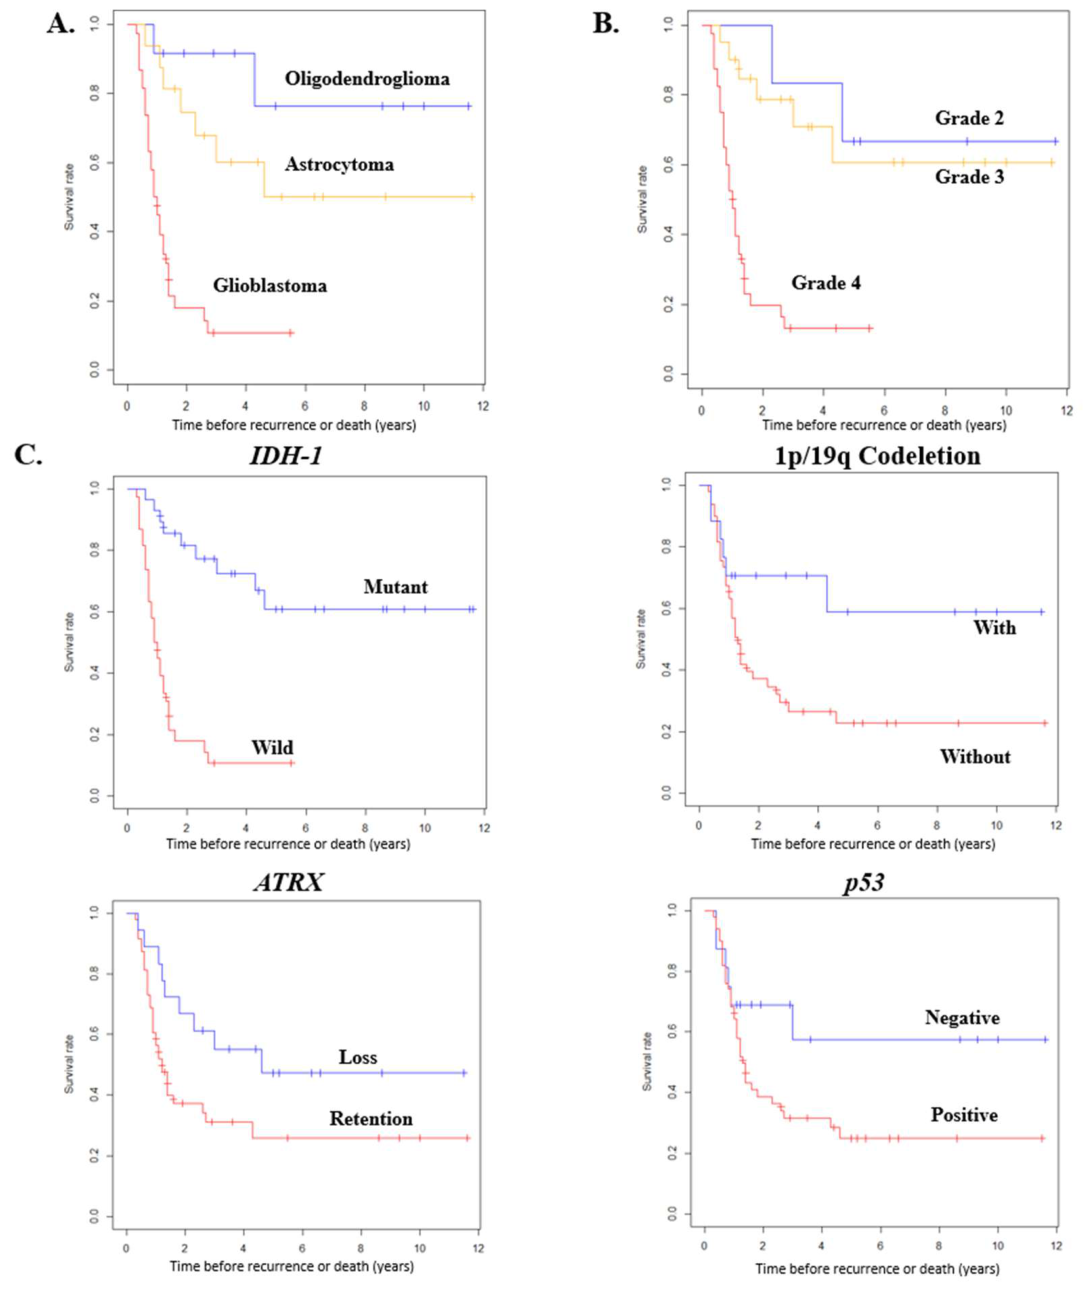
Figure 3.
T-distributed stochastic neighbor embedding analysis of molecular patterns with machine learning likelihood predictions.
Figure 3.
T-distributed stochastic neighbor embedding analysis of molecular patterns with machine learning likelihood predictions.
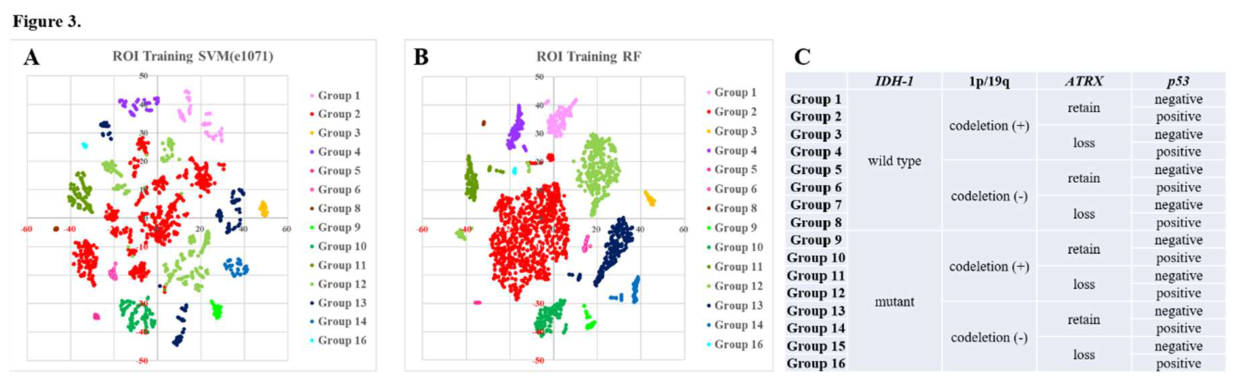

Table 1.
Molecular pattern, tumor type, and tumor grade of the training and test samples determined by nuclei features.
Table 1.
Molecular pattern, tumor type, and tumor grade of the training and test samples determined by nuclei features.
| Training | ||||||||||||||||||||||
| ROI | Accuracy (%) | Sensitivity (%) | Specificity (%) | Cross-validaton accuracy (%) | Case | Accuracy (%) | Sensitivity (%) | Specificity (%) | ||||||||||||||
| IDH-1 | SVM | 2,266 | 93.3 | 90.3 | 96.0 | 87.0 | 83.3 | 82.0 | 81.5 | 81.0 | 91 | 100.0 | 100.0 | 100.0 | ||||||||
| RF | 2,266 | 100.0 | 100.0 | 100.0 | 91 | 100.0 | 100.0 | 100.0 | ||||||||||||||
|
1p/19q codeletion |
SVM | 2,266 | 100.0 | 80.0 | 100.0 | 89.8 | 91.5 | 90.2 | 89.6 | 89.6 | 91 | 100.0 | 100.0 | 100.0 | ||||||||
| RF | 2,266 | 100.0 | 100.0 | 100.0 | 91 | 100.0 | 100.0 | 100.0 | ||||||||||||||
| ATRX | SVM | 2,266 | 91.9 | 83.0 | 97.1 | 80.9 | 90.4 | 80.2 | 81.1 | 80.0 | 91 | 98.9 | 96.9 | 100.0 | ||||||||
| RF | 2,266 | 100.0 | 100.0 | 100.0 | 91 | 100.0 | 100.0 | 100.0 | ||||||||||||||
| p53 | SVM | 2,266 | 95.4 | 99.2 | 83.7 | 85.6 | 85.4 | 83.5 | 84.3 | 87.8 | 91 | 98.9 | 100.0 | 96.0 | ||||||||
| RF | 2,266 | 100.0 | 100.0 | 100.0 | 91 | 100.0 | 100.0 | 100.0 | ||||||||||||||
| Type | SVM | 2,266 | 95.1 | 77.2 | 80.6 | 78.6 | 77.6 | 81.1 | 91 | 100.0 | ||||||||||||
| RF | 2,266 | 100.0 | 91 | 100.0 | ||||||||||||||||||
| Grade | SVM | 2,266 | 98.1 | 85.0 | 88.5 | 88.9 | 85.9 | 84.5 | 91 | 100.0 | ||||||||||||
| RF | 2,266 | 100.0 | 91 | 100.0 | ||||||||||||||||||
| ATRX | SVM | 789 | 100.0 | 100.0 | 100.0 | 80.9 | 80.4 | 80.2 | 81.1 | 80.3 | 34 | 100.0 | 100.0 | 100.0 | ||||||||
| RF | 789 | 100.0 | 100.0 | 100.0 | 34 | 100.0 | 100.0 | 100.0 | ||||||||||||||
| p53 | SVM | 789 | 99.9 | 100.0 | 99.7 | 86.2 | 85.8 | 84.1 | 84.4 | 84.2 | 34 | 100.0 | 100.0 | 100.0 | ||||||||
| RF | 789 | 100.0 | 100.0 | 100.0 | 34 | 100.0 | 100.0 | 100.0 | ||||||||||||||
|
1p/19q codeletion |
SVM | 568 | 100.0 | 100.0 | 100.0 | 85.8 | 90.8 | 77.3 | 86.5 | 85.8 | 34 | 100.0 | 100.0 | 100.0 | ||||||||
| RF | 568 | 100.0 | 100.0 | 100.0 | 34 | 100.0 | 100.0 | 100.0 | ||||||||||||||
| Type | SVM | 574 | 100.0 | 100.0 | 100.0 | 88.1 | 88.1 | 83.0 | 83.9 | 80.4 | 34 | 100.0 | 100.0 | 100.0 | ||||||||
| RF | 574 | 100.0 | 100.0 | 100.0 | 34 | 100.0 | 100.0 | 100.0 | ||||||||||||||
| Grade | SVM | 343 | 100.0 | 100.0 | 100.0 | 85.7 | 89.3 | 91.8 | 83.3 | 88.2 | 34 | 100.0 | 100.0 | 100.0 | ||||||||
| RF | 343 | 100.0 | 100.0 | 100.0 | 34 | 100.0 | 100.0 | 100.0 | ||||||||||||||
| Test | ||||||||||||||||||||||
| ROI | Accuracy (%) | Sensitivity (%) | Specificity (%) | Case | Accuracy (%) | Sensitivity (%) | Specificity (%) | |||||||||||||||
| IDH-1 | SVM | 1,861 | 82.0 | 74.8 | 86.7 | 66 | 95.5 | 89.3 | 100.0 | |||||||||||||
| RF | 1,861 | 86.7 | 79.0 | 91.7 | 66 | 97.0 | 92.9 | 100.0 | ||||||||||||||
|
1p/19q codeletion |
SVM | 1,861 | 80.8 | 37.4 | 96.6 | 66 | 78.8 | 17.7 | 100.0 | |||||||||||||
| RF | 1,861 | 83.3 | 38.0 | 99.9 | 66 | 77.3 | 11.8 | 100.0 | ||||||||||||||
| ATRX | SVM | 1,861 | 79.5 | 56.6 | 85.8 | 66 | 89.4 | 64.7 | 98.0 | |||||||||||||
| RF | 1,861 | 87.3 | 55.6 | 96.0 | 66 | 92.4 | 70.6 | 100.0 | ||||||||||||||
| p53 | SVM | 1,861 | 77.9 | 90.7 | 42.0 | 66 | 81.8 | 93.9 | 47.1 | |||||||||||||
| RF | 1,861 | 84.6 | 98.6 | 45.5 | 66 | 86.4 | 100.0 | 47.1 | ||||||||||||||
| Type | SVM | 1,861 | 79.5 | 66 | 87.9 | |||||||||||||||||
| RF | 1,861 | 80.8 | 66 | 87.9 | ||||||||||||||||||
| Grade | SVM | 1,861 | 84.1 | 66 | 89.4 | |||||||||||||||||
| RF | 1,861 | 83.6 | 66 | 86.4 | ||||||||||||||||||
| ATRX | SVM | 665 | 86.6 | 78.7 | 91.1 | 26 | 96.2 | 91.7 | 100.0 | |||||||||||||
| RF | 665 | 76.7 | 60.5 | 87.0 | 26 | 84.6 | 66.7 | 100.0 | ||||||||||||||
| p53 | SVM | 665 | 80.9 | 82.8 | 78.9 | 26 | 88.9 | 100.0 | 75.0 | |||||||||||||
| RF | 665 | 84.7 | 81.3 | 88.3 | 26 | 100.0 | 100.0 | 100.0 | ||||||||||||||
|
1p/19q codeletion |
SVM | 665 | 82.6 | 85.8 | 78.6 | 26 | 92.3 | 81.7 | 92.8 | |||||||||||||
| RF | 665 | 84.5 | 82.2 | 87.3 | 26 | 96.3 | 92.3 | 100.0 | ||||||||||||||
| Type | SVM | 665 | 83.5 | 81.6 | 85.6 | 26 | 96.2 | 100.0 | 91.7 | |||||||||||||
| RF | 665 | 84.1 | 85.3 | 83.6 | 26 | 96.2 | 100.0 | 91.7 | ||||||||||||||
| Grade | SVM | 665 | 82.3 | 86.3 | 61.3 | 26 | 88.5 | 95.0 | 66.7 | |||||||||||||
| RF | 665 | 82.6 | 88.0 | 50.9 | 26 | 88.5 | 95.0 | 66.7 | ||||||||||||||
ATRX: alpha thalassemia/mental retardation syndrome X-linked, IDH-1: isocitrate dehydrogenase 1, ROI: region of interest, RF: random forest, SVM: support vector machine, Type: pathological diagnosis, Grade: WHO grade.
Table 2.
Molecular pattern, tumor type, and tumor grade of all ROIs (datasets A+B) determined by nuclei features.
Table 2.
Molecular pattern, tumor type, and tumor grade of all ROIs (datasets A+B) determined by nuclei features.
| Training | ||||||||||||||
| ROI | Accuracy (%) | Sensitivity (%) | Specificity (%) | Cross-validaton accuracy (%) | Case | Accuracy (%) | Sensitivity (%) | Specificity (%) | ||||||
| IDH-1 | SVM | 4,127 | 91.4 | 87.1 | 94.7 | 85.6 | 82.4 | 83.1 | 82.8 | 85.5 | 156 | 100.0 | 100.0 | 100.0 |
| RF | 4,127 | 100.0 | 100.0 | 100.0 | 156 | 100.0 | 100.0 | 100.0 | ||||||
|
1p/19q codeletion |
SVM | 4,127 | 91.4 | 70.4 | 99.3 | 88.1 | 86.7 | 89.2 | 88.2 | 88.6 | 156 | 96.8 | 81.5 | 100.0 |
| RF | 4,127 | 100.0 | 100.0 | 100.0 | 156 | 100.0 | 100.0 | 100.0 | ||||||
| sdis | 4,127 | 86.9 | 82.9 | 87.8 | ||||||||||
| ATRX | SVM | 4,127 | 90.4 | 75.7 | 96.7 | 83.5 | 81.2 | 81.8 | 83.2 | 82.4 | 156 | 96.8 | 89.8 | 100.0 |
| RF | 4,127 | 100.0 | 100.0 | 100.0 | 156 | 100.0 | 100.0 | 100.0 | ||||||
| sdis | 4,127 | 83.9 | 81.5 | 84.9 | ||||||||||
| p53 | SVM | 4,127 | 92.1 | 93.3 | 74.1 | 85.1 | 84.5 | 85.9 | 84.8 | 84.7 | 96.2 | 100.0 | 85.4 | |
| RF | 4,127 | 100.0 | 100.0 | 100.0 | 100.0 | 100.0 | 100.0 | |||||||
| sdis | 4,127 | 85.6 | 86.6 | 82.2 | ||||||||||
| Type | SVM | 4,127 | 94.0 | 81.2 | 82.5 | 81.1 | 80.6 | 79.8 | 156 | 99.4 | ||||
| RF | 4,127 | 100.0 | 156 | 100.0 | ||||||||||
| sdis | 4,127 | 84.9 | ||||||||||||
| Grade | SVM | 4,127 | 96.1 | 88.2 | 88.1 | 88.0 | 85.5 | 85.4 | 156 | 100.0 | ||||
| RF | 4,127 | 100.0 | 156 | 100.0 | ||||||||||
| sdis | 4,127 | 91.0 | ||||||||||||
ATRX: alpha thalassemia/mental retardation syndrome X-linked, IDH-1: isocitrate dehydrogenase 1, ROI: region of interest, RF: random forest, sdis: standard deviation of individual scores, SVM: support vector machine.
Table 3.
Cox proportional hazards regression analysis for survival rate, categorized by molecular features.
Table 3.
Cox proportional hazards regression analysis for survival rate, categorized by molecular features.
| Exp (coef) | Exp (−coef) | Lower 0.95 | Upper 0.95 | z | Pr(>|z|) | ||
| IDH-1 | 0.1299 | 7.6985 | 0.04455 | 0.3787 | −3.738 | 0.000185 | *** |
| 1p/19q codeletion | 0.9202 | 1.0867 | 0.32757 | 2.5853 | −0.158 | 0.874689 | |
| ATRX | 1.3481 | 0.7418 | 0.51315 | 3.5416 | 0.606 | 0.544436 | |
| p53 | 1.078 | 0.9277 | 0.40191 | 2.8911 | 0.149 | 0.881458 |
ATRX: alpha thalassemia/mental retardation syndrome X-linked, cox hazard ratio, exp (−coef): reciprocal of hazard ratio, IDH-1: isocitrate dehydrogenase 1, lower 0.95: confidence interval lower, upper 0.95: confidence interval higher, Pr (>|z|): p-value, z: Probability of a value greater than the absolute value of z (Wald test).
Table 4.
Survival analysis (1 year, 2 years, and 3 years) by nuclei features.
| Training | ||||||||||||||
| ROI | Accuracy (%) | Sensitivity (%) | Specificity (%) | Cross-validaton accuracy (%) | Case | Accuracy (%) | Sensitivity (%) | Specificity (%) | ||||||
| 1-year | SVM | 1,861 | 97.8 | 95.6 | 99.0 | 85.5 | 86.0 | 84.4 | 87.9 | 86.3 | 66 | 100.0 | 100.0 | 100.0 |
| model | RF | 1,861 | 100.0 | 100.0 | 100.0 | 66 | 100.0 | 100.0 | 100.0 | |||||
| sdis | 1,861 | 94.4 | 95.1 | 94.0 | ||||||||||
| 2-year | SVM | 1,662 | 99.8 | 99.9 | 99.5 | 91.6 | 89.5 | 93.4 | 93.1 | 90.4 | 60 | 100.0 | 100.0 | 100.0 |
| model | RF | 1,662 | 100.0 | 100.0 | 100.0 | 60 | 100.0 | 100.0 | 100.0 | |||||
| sdis | 1,662 | 97.4 | 97.5 | 97.0 | ||||||||||
| 3-year | SVM | 1,662 | 100.0 | 100.0 | 10.0 | 92.8 | 92.5 | 94.3 | 93.1 | 93.4 | 60 | 100.0 | 100.0 | 100.0 |
| model | RF | 1,662 | 100.0 | 100.0 | 100.0 | 60 | 100.0 | 100.0 | 100.0 | |||||
| sdis | 1,662 | 98.4 | 98.6 | 97.7 | ||||||||||
ROI: region of interest, RF: random forest, sdis: standard deviation of individual scores, SVM: support vector machine.
Table 5.
Survival analysis (1 year, 2 years, and 3 years) and test by nuclei features.
| Training | |||||||||||||||||||||||||
| ROI | Accuracy (%) | Sensitivity (%) | Specificity (%) | Cross-validation accuracy (%) | Case | Accuracy (%) | Sensitivity (%) | Specificity (%) | |||||||||||||||||
|
All ROIs used model |
1-year | SVM | 1,347 | 98.7 | 97.8 | 99.3 | 85.6 | 86.0 | 88.7 | 86.7 | 84.6 | 47 | 100.0 | 100.0 | 100.0 | ||||||||||
| model | RF | 1,347 | 100.0 | 100.0 | 100.0 | 47 | 100.0 | 100.0 | 100.0 | ||||||||||||||||
| 2-year | SVM | 1,216 | 99.9 | 99.9 | 100.0 | 90.9 | 92.4 | 91.7 | 90.2 | 89.8 | 43 | 100.0 | 100.0 | 100.0 | |||||||||||
| model | RF | 1,216 | 100.0 | 100.0 | 100.0 | 43 | 100.0 | 100.0 | 100.0 | ||||||||||||||||
| 3-year | SVM | 1,216 | 100.0 | 100.0 | 100.0 | 92.4 | 92.4 | 94.7 | 93.9 | 92.8 | 43 | 100.0 | 100.0 | 100.0 | |||||||||||
| model | RF | 1,216 | 100.0 | 100.0 | 100.0 | 43 | 100.0 | 100.0 | 100.0 | ||||||||||||||||
|
Adjusted ROIs for balancing model |
1-year | SVM | 1,066 | 98.9 | 99.0 | 98.8 | 84.7 | 86.0 | 81.9 | 80.9 | 86.1 | 43 | 100.0 | 100.0 | 100.0 | ||||||||||
| model | RF | 1,066 | 100.0 | 100.0 | 100.0 | 43 | 100.0 | 100.0 | 100.0 | ||||||||||||||||
| 2-year | SVM | 899 | 99.9 | 99.8 | 100.0 | 87.0 | 89.6 | 88.0 | 91.0 | 88.6 | 43 | 100.0 | 100.0 | 100.0 | |||||||||||
| model | RF | 899 | 100.0 | 100.0 | 100.0 | 43 | 100.0 | 100.0 | 100.0 | ||||||||||||||||
| 3-year | SVM | 807 | 100.0 | 100.0 | 100.0 | 89.6 | 92.3 | 87.4 | 88.5 | 89.1 | 43 | 100.0 | 100.0 | 100.0 | |||||||||||
| model | RF | 807 | 100.0 | 100.0 | 100.0 | 43 | 100.0 | 100.0 | 100.0 | ||||||||||||||||
| Test | |||||||||||||||||||||||||
| ROI | Accuracy (%) | Sensitivity (%) | Specificity (%) | Case | Accuracy (%) | Sensitivity (%) | Specificity (%) | ||||||||||||||||||
|
All ROIs used model |
1-year | SVM | 514 | 82.3 | 72.6 | 86.4 | 19 | 94.7 | 80.0 | 100.0 | |||||||||||||||
| model | RF | 514 | 79.0 | 58.8 | 87.5 | 19 | 94.7 | 80.0 | 100.0 | ||||||||||||||||
| 2-year | SVM | 446 | 84.8 | 86.2 | 81.9 | 17 | 100.0 | 100.0 | 100.0 | ||||||||||||||||
| model | RF | 446 | 87.4 | 92.6 | 77.2 | 17 | 94.1 | 100.0 | 85.7 | ||||||||||||||||
| 3-year | SVM | 446 | 87.7 | 89.8 | 80.4 | 17 | 100.0 | 100.0 | 100.0 | ||||||||||||||||
| model | RF | 446 | 78.2 | 79.1 | 77.5 | 17 | 94.1 | 100.0 | 80.0 | ||||||||||||||||
|
Adjusted ROIs for balancing model |
1-year | SVM | 514 | 84.0 | 81.7 | 85.0 | 19 | 100.0 | 100.0 | 100.0 | |||||||||||||||
| model | RF | 514 | 75.7 | 62.8 | 81.2 | 19 | 100.0 | 100.0 | 100.0 | ||||||||||||||||
| 2-year | SVM | 446 | 87.0 | 88.8 | 84.6 | 17 | 100.0 | 100.0 | 100.0 | ||||||||||||||||
| model | RF | 446 | 88.1 | 90.1 | 82.6 | 17 | 94.1 | 100.0 | 85.7 | ||||||||||||||||
| 3-year | SVM | 446 | 87.7 | 89.8 | 80.4 | 17 | 100.0 | 100.0 | 100.0 | ||||||||||||||||
| model | RF | 446 | 89.7 | 92.2 | 81.3 | 17 | 94.1 | 100.0 | 80.0 | ||||||||||||||||
ROI: region of interest, RF: random forest, SVM: support vector machine.
Table 6.
Contribution of nuclei features.
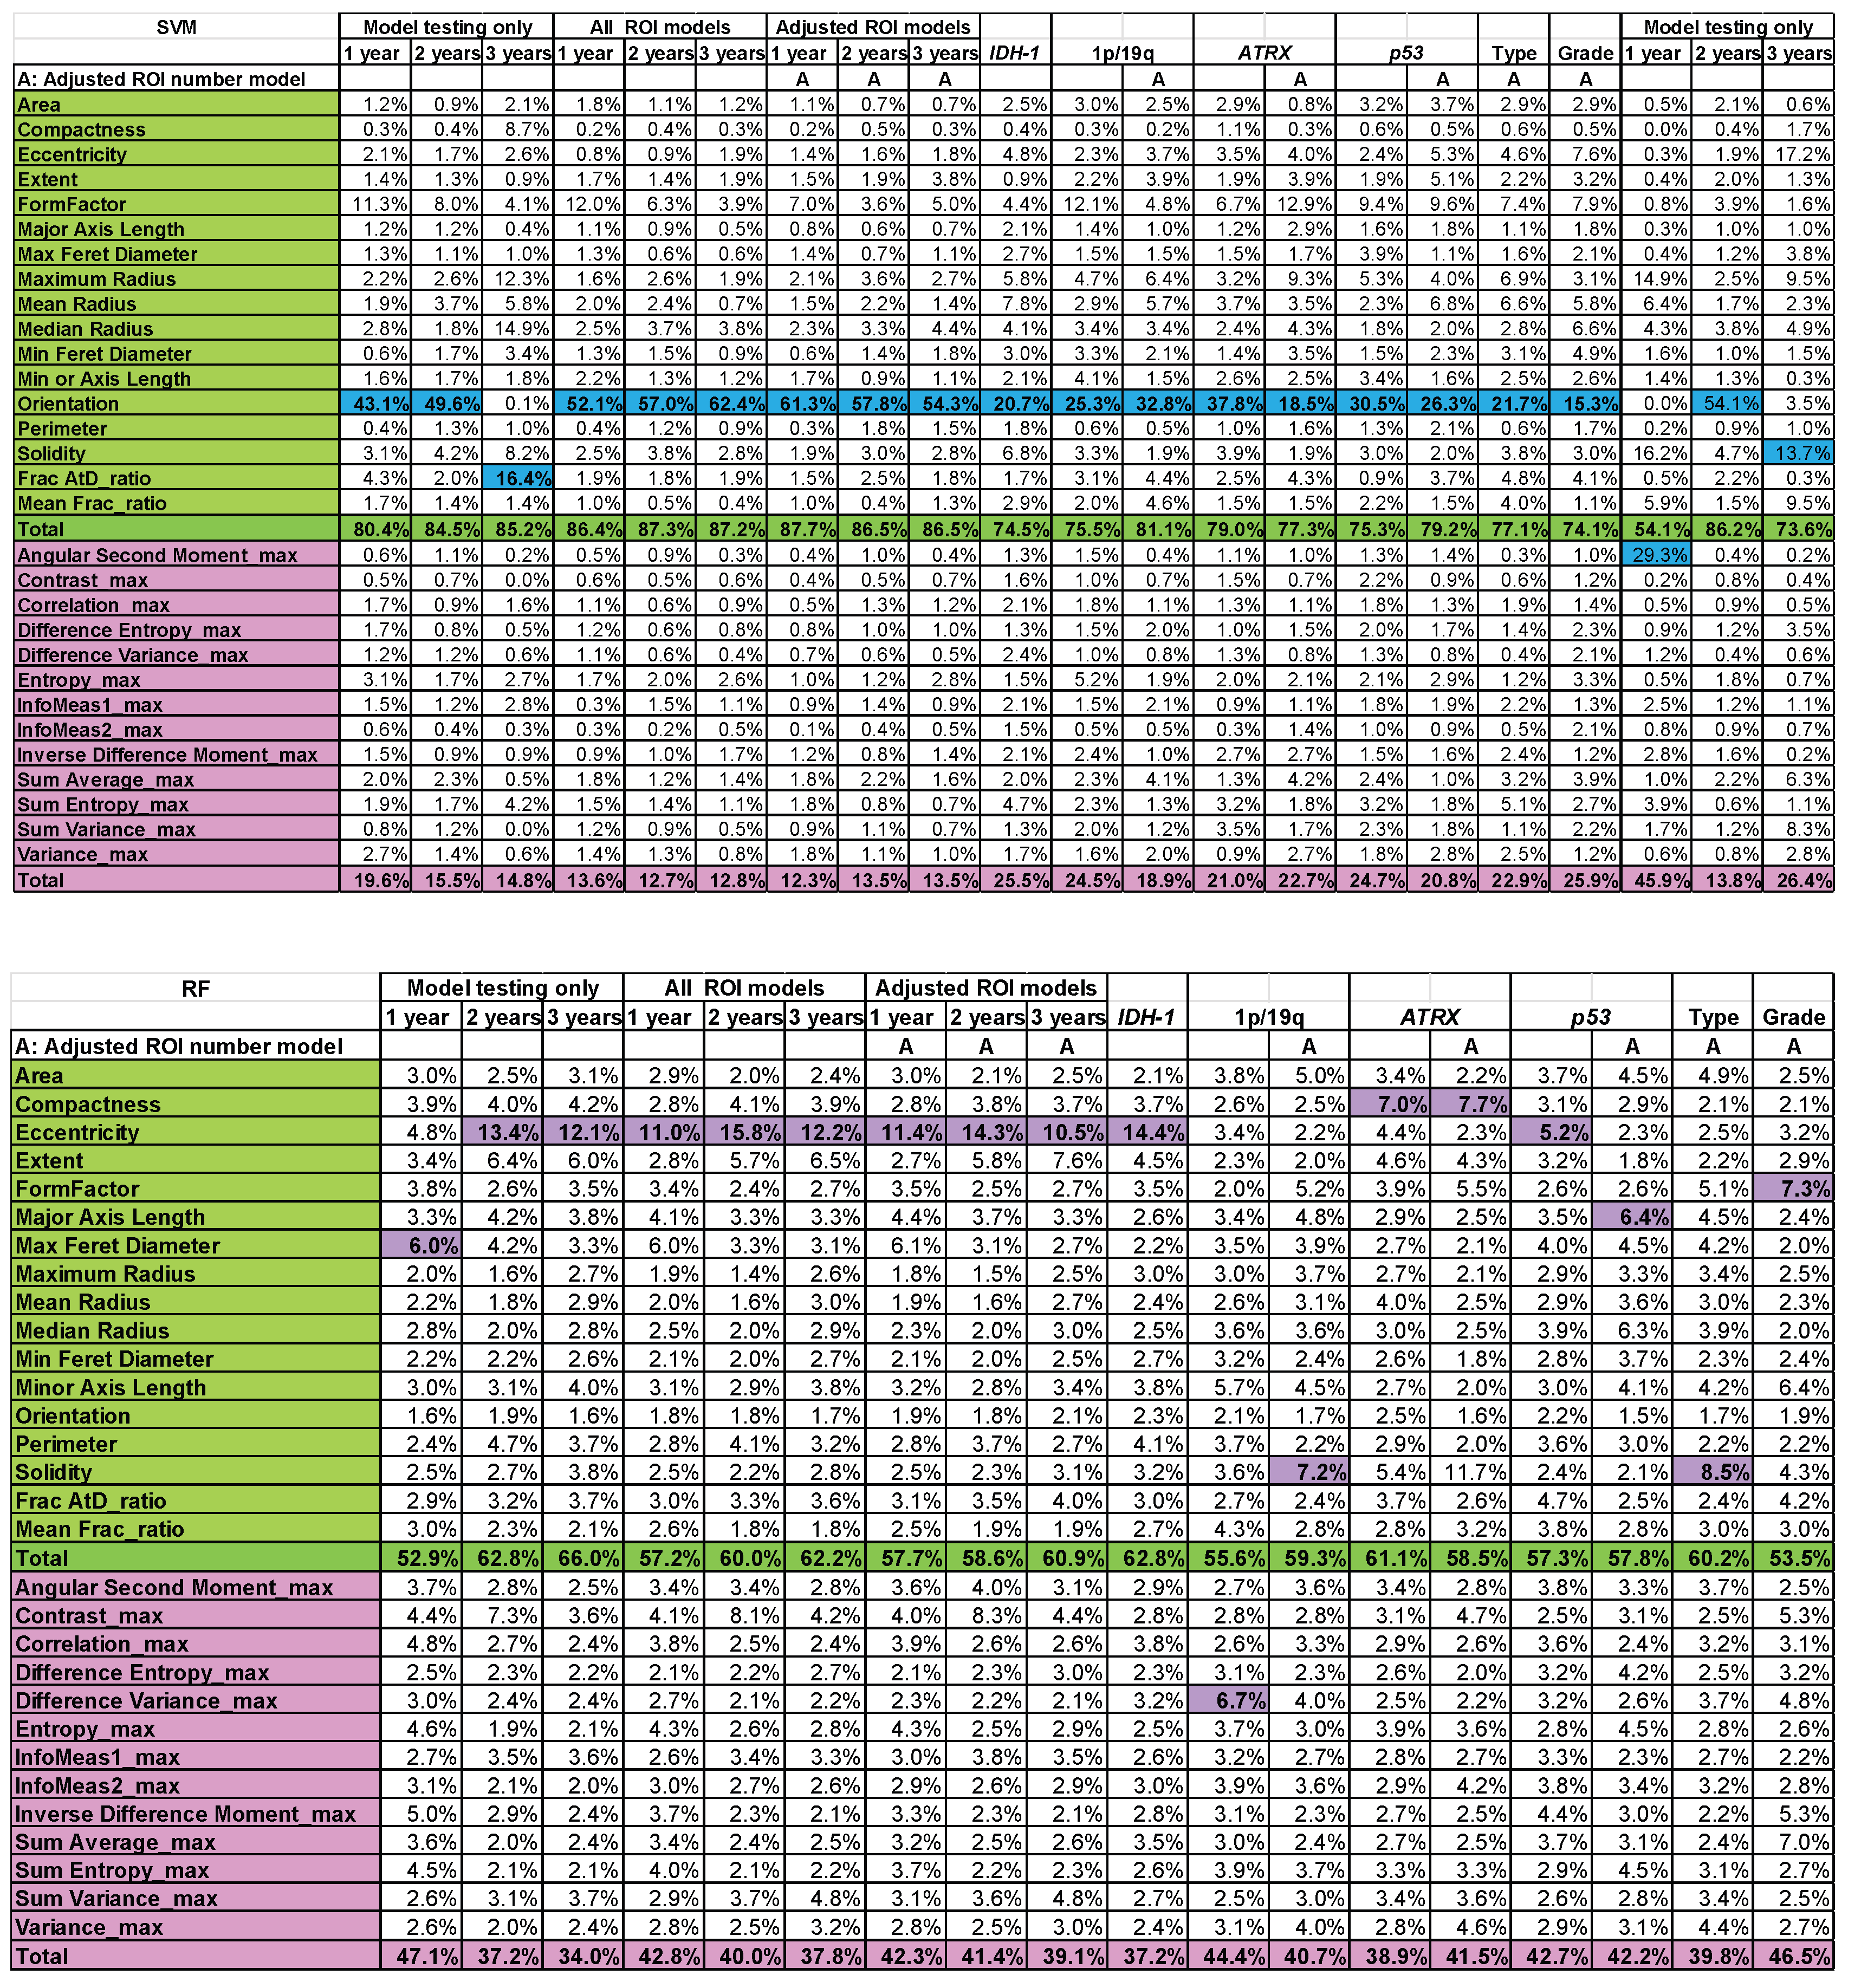 |
RF: random forest; SVM: support vector machine; SDA: stepwise discriminant analysis.
Disclaimer/Publisher’s Note: The statements, opinions and data contained in all publications are solely those of the individual author(s) and contributor(s) and not of MDPI and/or the editor(s). MDPI and/or the editor(s) disclaim responsibility for any injury to people or property resulting from any ideas, methods, instructions or products referred to in the content. |
© 2026 by the authors. Licensee MDPI, Basel, Switzerland. This article is an open access article distributed under the terms and conditions of the Creative Commons Attribution (CC BY) license (http://creativecommons.org/licenses/by/4.0/).
Copyright: This open access article is published under a Creative Commons CC BY 4.0 license, which permit the free download, distribution, and reuse, provided that the author and preprint are cited in any reuse.