

Submitted:
04 August 2026
Posted:
05 August 2026
You are already at the latest version
Abstract
Growth differentiation factor 15 (GDF15) is measured across two literatures that do not read each other. Clinical chemistry has established that it is a trait-like analyte with a stable set point: within-subject coefficients of variation of 6.3% and 7.6% in two independent cohorts against analytical variation below 1%, reference change values of 23% and 24.3% in tightly controlled healthy-volunteer protocols, and two specimens sufficient to estimate an individual’s homeostatic set point within ±10%. Exercise physiology has established that a single hour of submaximal cycling raises circulating GDF15 by 34% during exercise and 64% two hours after it ends, and that prolonged bouts raise it four- to fivefold. Read together, these yield a direct result: a single unrecorded bout of physiological load displaces GDF15 by 1.5 to 17 times the reference change value for the analyte. The stability of the set point is precisely what makes this consequential — a substantial transient is being injected into a quantity whose genuine within-person variation is under 8%, and within-subject variation is preserved across age strata (7.4% under 45 years, 7.9% at 45 and over). The problem is not confined to comparison against reference intervals. Where GDF15 is used as a continuous covariate or dichotomized at cohort-specific tertiles, unrecorded excursions produce misclassification, and where habitual activity differs between cases and controls that misclassification is directional rather than random. This paper formalizes the phasic–tonic distinction, derives its consequences for design and interpretation, reinterprets two unexplained findings in the fibromyalgia case-control literature, proposes a minimum reporting standard, and identifies the single measurement that would resolve the principal remaining uncertainty. No new primary data are presented.
Keywords:
GDF15
; biological variation
; reference change value
; index of individuality
; preanalytical variables
; mitokine
; biomarker methodology
; exercise
; fibromyalgia
1. Two Literatures That Have Not Met
GDF15 occupies an unusual position. It is a robust predictor of all-cause mortality, elevated across mitochondrial disease, malignancy, and renal and cardiac failure. It is also an exercise-responsive circulating factor, elevated by prolonged exertion in healthy young people, and elevated by metformin, where the rise is mechanistically central to the drug’s effect on appetite and body weight.[1]
The standard reconciliation is that GDF15 is non-specific — responsive to cellular stress broadly and therefore diagnostic of nothing in particular. That is accurate as far as it goes, and it has been made to function as an explanation when it is a description.
Consider heart rate. A rate of 150 during a graded exercise test is unremarkable; a rate of 150 in a seated patient is an emergency. Heart rate has never been called non-specific, because the condition under which it was obtained is recorded as a matter of course and the two situations are never confused.
The distinction is not novel in principle. Psychoneuroendocrinology formalized it for cortisol two decades ago, separating time-dependent change from total concentration through paired area-under-the-curve measures developed precisely to keep reactivity and basal secretion from being pooled.[2] That methodology is standard in an adjacent field. It has not been transferred to the mitokines.
The argument here is that the interpretive difficulty attributed to GDF15’s biology is substantially a property of how it is sampled, and that the size of the resulting problem is calculable from values already in print.
2. GDF15 Is a Trait-like Analyte with a Stable Set Point
Krintus and colleagues screened 533 adults, derived reference intervals from 173, and estimated biological variation in a substudy of 26 healthy volunteers. Within-subject coefficient of variation was 6.3% (95% CI 4.5–8.5%), with no sex difference in intraindividual variance. The reference change value was 23%. Two specimens placed the mean result within ±10% of an individual’s homeostatic set point. The upper reference limit was 866 ng/L (90% CI 733–999), and multiple regression identified age, B-type natriuretic peptide, C-reactive protein, and smoking status as determinants of the set point’s height.[3]
Sithiravel and colleagues[4] sampled 13 analyzable participants weekly for ten consecutive weeks on the same weekday, with serum stored at −80 °C and analyzed in duplicate on a single platform with analytical CV below 1%. Within-subject CV was approximately 7.6% overall, and — importantly for what follows — essentially unchanged across age strata: 7.4% in participants under 45 years and 7.9% in those aged 45 and over. The positive reference change value was approximately 24.3%. The index of individuality was 0.35 (95% CI 0.20–0.51), and the authors concluded that subject-based reference intervals are more appropriate for GDF-15 than population-based intervals.[4] That conclusion is theirs and is treated here as established.
A third study reports a substantially larger figure and must be addressed. Meijers and colleagues determined conjoint analytical and biological variation for a panel of biomarkers in 28 healthy subjects sampled over four months and 83 patients with chronic heart failure sampled over six weeks, reporting a within-subject coefficient of variation of 16.6% for GDF-15 and a reference change value of 64.3%, with variation indices comparable between healthy participants and patients.[5] Taken at face value that value would weaken the argument developed here: an excursion of 34% falls below a reference change value of 64.3%.
Three features of that study bear on the comparison. The reported variation is conjoint analytical and biological rather than biological alone. Sampling extended over four months and six weeks respectively, rather than the ten consecutive same-weekday draws of the standardized protocol. And condition of measurement was not documented — as it is not, in any study in this literature.
That last point is the argument of this paper applied to its own evidence base. If unrecorded physiological load displaces GDF15 by one and a half to seventeen reference change values, any study that does not control for it will attribute some part of that displacement to biological variation and will report an inflated within-subject coefficient. The prediction is specific and directional: within-subject variation estimates should fall as sampling conditions are more tightly controlled. The published values are consistent with it — 16.6% under four-month sampling without documented conditions, 7.6% under same-weekday sampling with analytical variation below 1%. This is offered as a hypothesis that the reporting standard proposed in Section 7 would test, not as a resolution. The estimates used throughout this paper are those from the two healthy-volunteer studies with the tighter protocols; a reader who prefers the Meijers value should read the multiples in Table 1 as correspondingly reduced, with the qualitative conclusion unchanged for every excursion above 64%.
Two independent cohorts agree. Different platforms, different countries, small samples — and within-subject CV agrees to within 1.3 percentage points, reference change value to within 1.3 percentage points. Two small studies that converge are worth considerably more than either alone.
Within-person stability is preserved with age. This is the parameter that matters for what follows, and it is the robust one. The index of individuality also stratifies by age (1.15 under 45; 0.43 at 45 and over), but those estimates rest on 5 and 8 subjects with confidence intervals of 0.40–2.03 and 0.11–0.79 respectively, and no weight is placed on them here. The stratified within-subject coefficients of variation are stable, and that is sufficient.
2.1. Why the Set Point Is Stable, and Why the Excursion Is Not
The same biology explains both.
Basal GDF15 appears to derive largely from constitutive hepatic and renal production, buffered against ordinary metabolic fluctuation. The height of that set point is determined over long time scales — by age, cardiac and inflammatory status, smoking, and by common genetic variation at the GDF15 locus.
The genetic contribution is unusually large. In the largest genome-wide association meta-analysis of circulating concentrations, conducted in approximately 5,400 community-based participants, a locus on chromosome 19 spanning nine single nucleotide polymorphisms (top SNP rs888663, p = 1.690 × 10⁻³⁵) explained 21.47% of the variance in blood MIC-1/GDF-15.[6] A single locus accounting for roughly a fifth of between-person variance is atypical for a circulating protein, and it is the structural reason that between-subject variation in this analyte is large while within-subject variation is small — the configuration that produces a low index of individuality.
The buffering is demonstrable. Thirty-six hours of fasting does not alter circulating GDF15, while chronic energy deprivation in anorexia nervosa raises the resting value approximately 1.4-fold.[7] An acute energy deficit produces no excursion; a sustained one moves the set point. Ordinary daily metabolic noise does not reach it.
Inducible production is a separate matter and appears to be hepato-splanchnic rather than muscular. Net release of GDF15 into the circulation during exercise has been demonstrated across the hepato-splanchnic bed, and no arterio-venous difference was detected across exercising skeletal muscle.[7] Muscle GDF15 transcript rises with acute exercise, but changes in muscle transcript do not correlate with circulating concentrations, and during recovery muscle expression falls back toward baseline while serum GDF15 remains elevated — a dissociation indicating that tissues other than muscle supply the systemic pool. The tissue source is not fully settled — skeletal muscle secretion of GDF15 during exercise has also been reported[8] — but nothing in the present argument turns on its resolution: the excursion occurs, and is large, whichever tissue supplies it. The hepatic route is consistent with the observation that raising the glucagon-to-insulin ratio in resting humans is itself sufficient to raise circulating GDF15, and that blunting the exercise-induced rise in that ratio blunts the GDF15 response.[7]
The picture is coherent: a slowly-set constitutive floor, overridden transiently by glucagon-driven hepatic release under load. The stability of the floor is what makes an unrecorded override consequential. A quantity whose genuine week-to-week variation is under 8% is being displaced by 34% to 500% by an event nobody recorded.
3. The Excursion
In seven healthy males cycling for one hour at 67% of VO2max, plasma GDF15 rose 34% during exercise and continued rising to 64% above resting values at 120 minutes after cessation, with no change during a resting control trial in the same subjects.[9] Kleinert and colleagues noted explicitly that exercise history should be considered when evaluating GDF15 as a clinical biomarker — a caution stated once, in 2018, and not developed since.
Klein and colleagues[10] reported that prolonged endurance exercise raises circulating GDF15 four- to fivefold, observed across four independent human studies.
Sixty minutes at approximately 70% VO2max raised serum GDF15 in both controls and patients with type 2 diabetes, with levels still elevated three hours into recovery.[11] The magnitude is reported qualitatively in the source.
Plomgaard and colleagues showed that raising the glucagon-to-insulin ratio in resting humans produced a 2.7-fold increase in circulating GDF15, that thirty-six hours of fasting did not alter it, and that resting patients with anorexia nervosa showed 1.4-fold elevation relative to controls.[7]
4. The Arithmetic
A single unrecorded bout of physiological load displaces circulating GDF15 by between 1.5 and 17 times the reference change value for that analyte.
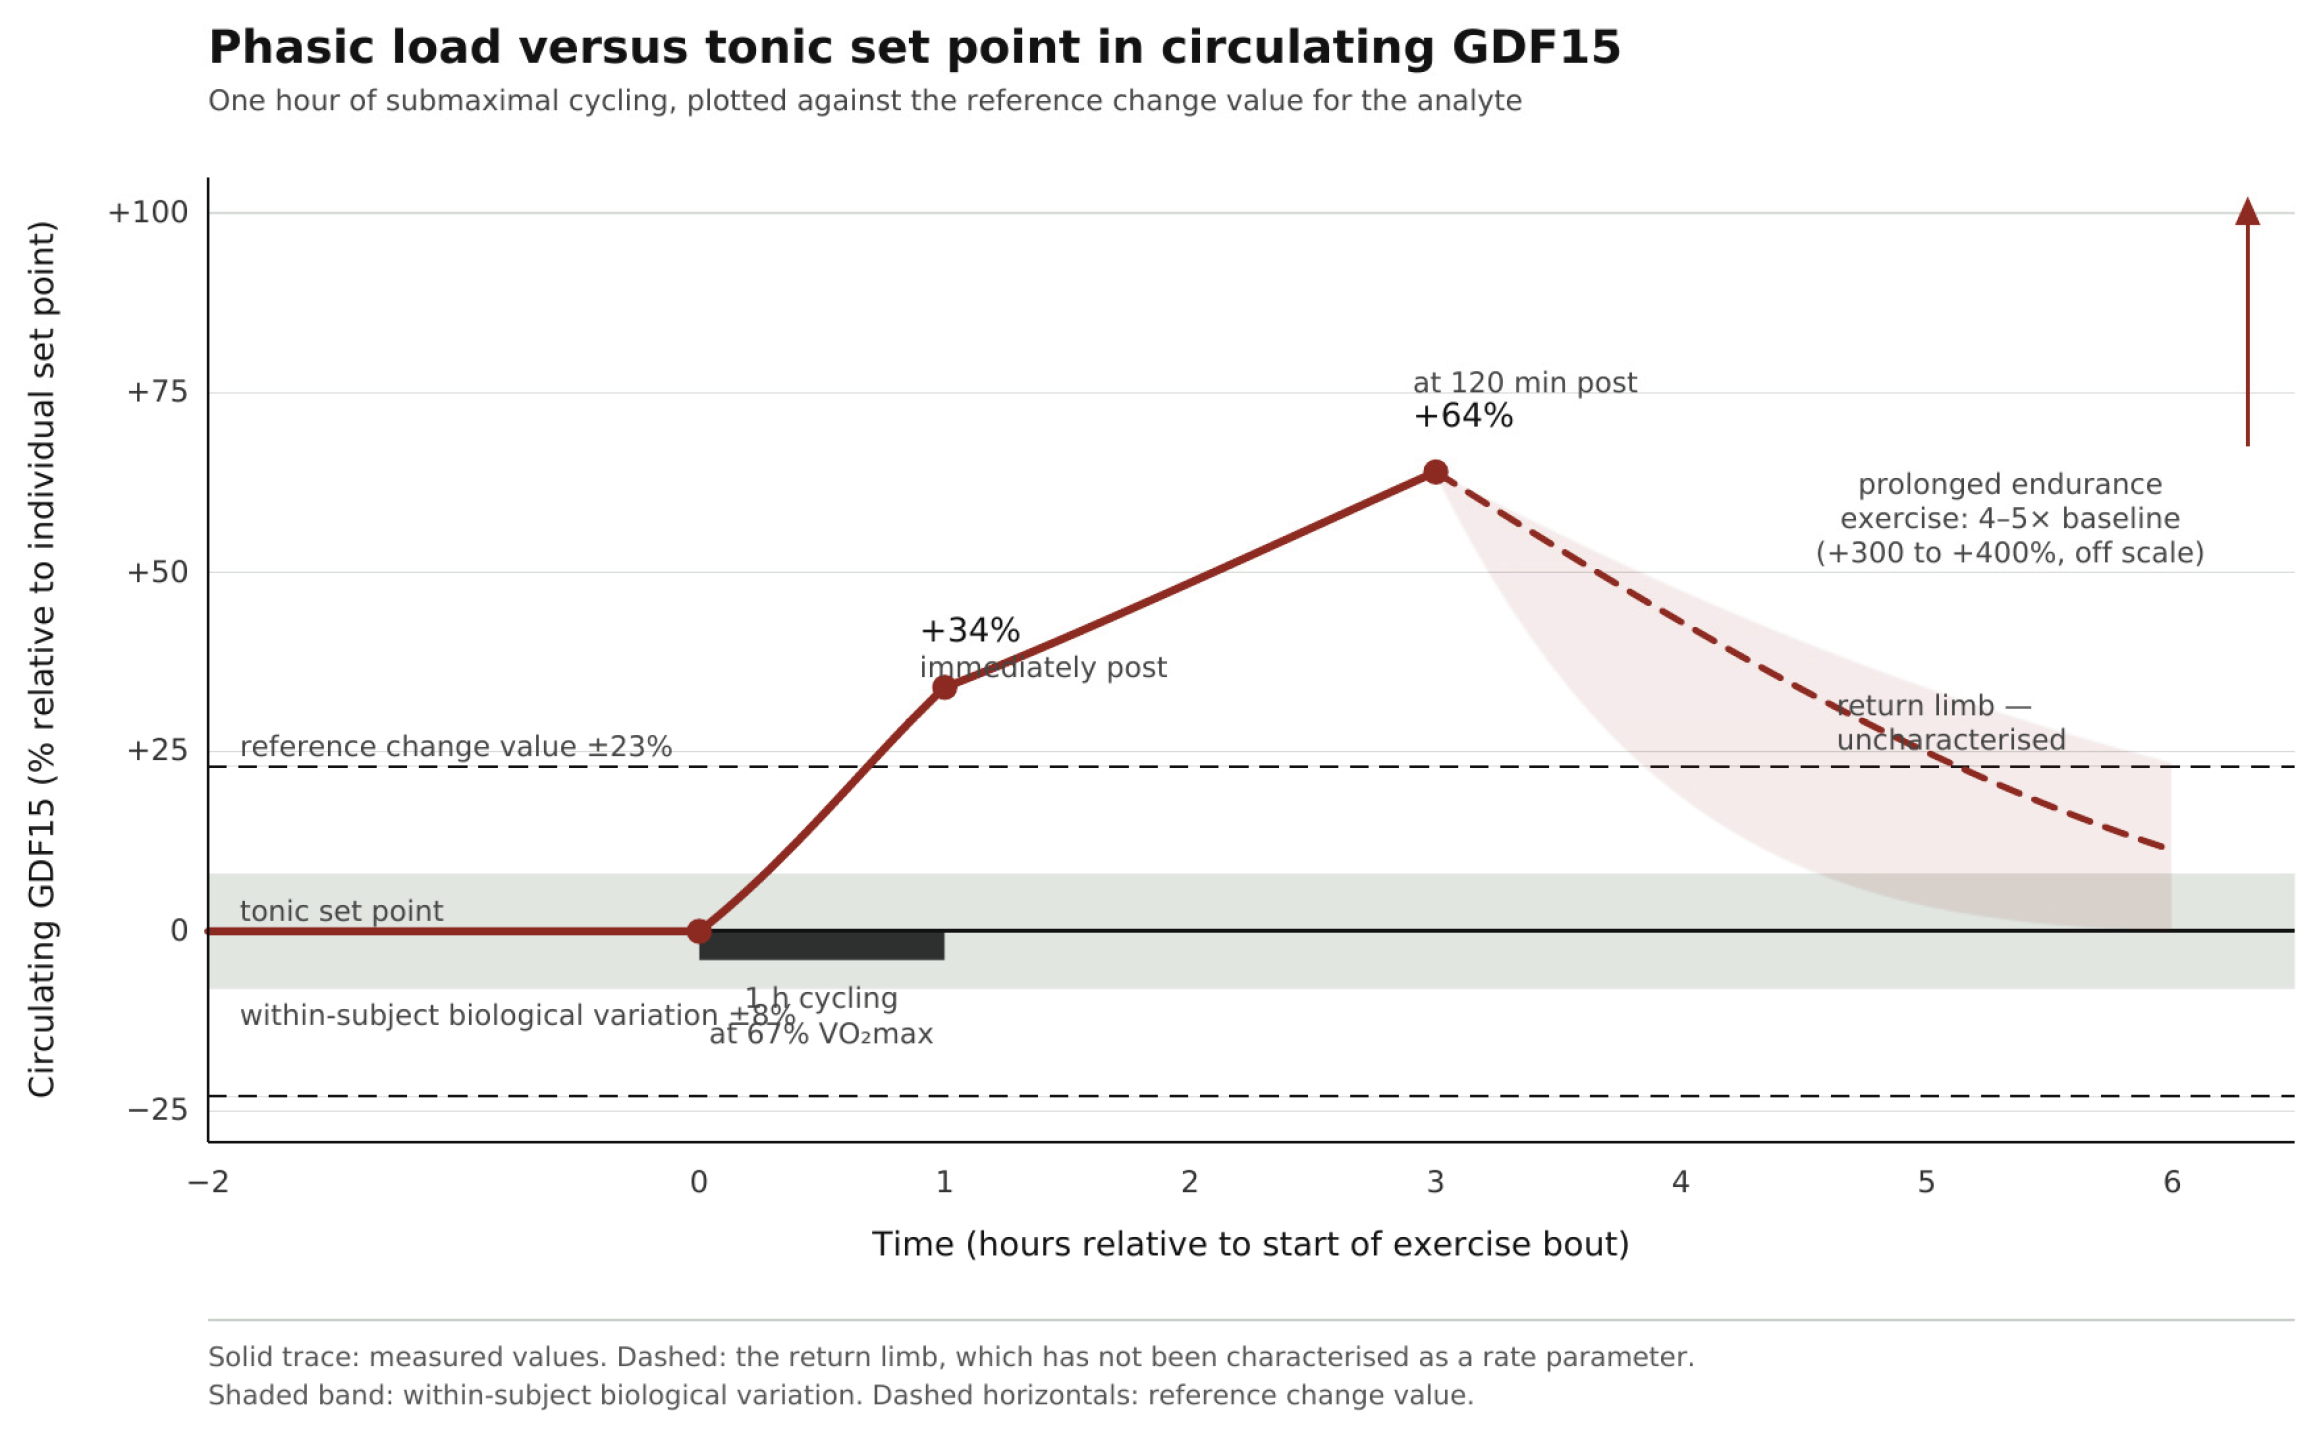
Figure 1.
Phasic load against the tonic set point in circulating GDF15. The solid trace shows measured values from one hour of submaximal cycling at 67% VO₂max: no change from the individual set point before the bout, +34% immediately post-exercise, and +64% at 120 minutes after cessation. The shaded horizontal band is within-subject biological variation (±8%); the dashed horizontals are the reference change value (±23%). Beyond the last measured point the trace is dashed and the shaded wedge indicates uncertainty: the return limb has not been characterised as a rate parameter, and doing so is the measurement proposed in Section 8. The vertical arrow marks prolonged endurance exercise at 4–5× baseline, which lies off scale.
Figure 1.
Phasic load against the tonic set point in circulating GDF15. The solid trace shows measured values from one hour of submaximal cycling at 67% VO₂max: no change from the individual set point before the bout, +34% immediately post-exercise, and +64% at 120 minutes after cessation. The shaded horizontal band is within-subject biological variation (±8%); the dashed horizontals are the reference change value (±23%). Beyond the last measured point the trace is dashed and the shaded wedge indicates uncertainty: the return limb has not been characterised as a rate parameter, and doing so is the measurement proposed in Section 8. The vertical arrow marks prolonged endurance exercise at 4–5× baseline, which lies off scale.
5. Consequences for Interpretation
The estimand. If the quantity of interest is the individual’s standing energetic burden rather than a response to a completed stimulus, the estimand is the set point, and a value obtained without documented conditions is of unknown type.
Two specimens, not one. The number required to reach ±10% of the set point is published and small. This is not a demanding standard.
Change detection is already recommended and is currently unimplementable. Subject-based interpretation against a reference change value is the recommendation of the biological variation literature for this analyte.[4,12] But a reference change value of 23% is crossed by any unrecorded exercise bout in the preceding day. Serial monitoring against a personal baseline therefore fails silently unless condition of measurement is documented at both draws — the existing recommendation cannot be executed without the reporting standard proposed below.
The problem is not limited to reference intervals. GDF15 is frequently used not against a population interval but as a continuous covariate in multivariable models, or dichotomized at cohort-specific medians or tertiles. This does not rescue the design. A participant displaced 1.5 to 17 reference change values by an unrecorded workout is misassigned within the cohort ranking. Where activity is unrelated to case status, that misclassification is non-differential and biases toward the null. Where activity differs systematically between groups — which is the situation in most of the populations where GDF15 is studied — it is differential, and the direction is predictable.
6. Worked Example: Two Unexplained Findings in the Fibromyalgia Literature
Confounding from unrecorded activity is usually assumed random, and therefore assumed to widen intervals without shifting point estimates. In conditions defined partly by activity behavior, that assumption fails predictably.
A recent prospective case-control study measured serum GDF15 in 120 women — female fibromyalgia patients and healthy controls — and stated in its own limitations that information on physical activity and dietary habits was not collected, that these variables are known to influence GDF15 concentrations, and that uncontrolled variability may have been introduced.[13] The authors identified the problem precisely. What was unavailable to them was any quantitative sense of its size. What follows is offered as a hypothesis that extends their finding rather than a correction of it: the original data cannot settle the question, and only the measurement proposed in Section 7 could.
The premise that patients and controls differ in recent activity is not speculative. Post-exertional symptom exacerbation, activity avoidance, kinesiophobia, and secondary deconditioning are among the defining behavioral features of fibromyalgia, documented throughout the clinical literature and unmistakable in ordinary rheumatologic and rehabilitation practice. A design that does not record recent activity, in a condition partly constituted by altered activity, has omitted a variable the diagnosis itself implies.
The reported findings were a large group difference and two features the study could not account for. Median serum GDF15 was 1022.33 pg/mL in patients versus 473.08 pg/mL in controls (p < 0.001) — an elevation of roughly 116%, or five reference change values, and far too large to be produced by activity confounding alone.[13] The group difference is not in question here.
The two unexplained features are.
Specificity was 53.3% at a cutoff of 478.31 pg/mL, against sensitivity of 96.7% and an area under the curve of 0.922.[13] Nearly half of healthy controls exceeded the diagnostic threshold, which sat barely above the control median of 473.08 pg/mL. If some fraction of control samples were drawn within a day of moderate or vigorous activity, those values would be displaced upward by 1.5 to 17 reference change values — and a cutoff positioned this close to the control median would be crossed by a substantial share of them. Phasic contamination of the control group is a direct candidate explanation for poor specificity in a marker that otherwise discriminates well.
GDF15 did not correlate with disease severity on the Widespread Pain Index, Symptom Severity Score, or Revised Fibromyalgia Impact Questionnaire. A strong group effect with no dose-response against severity is the characteristic signature of a real difference diluted by within-group measurement variance. Unrecorded phasic excursions are precisely such a variance source, and they attenuate correlations toward zero without touching the group means.
Neither observation is a criticism of the study. Both are findings the authors reported honestly and could not explain, and both are predicted by a framework they had no way to apply.
Three implications follow, generalizing to any condition in which habitual activity differs systematically between groups — chronic fatigue, heart failure, chronic kidney disease, depression, post-acute care populations:
- Reported effect sizes are not interpretable in magnitude.
- Null findings are uninformative, because the confounding operates against detection.
- Positive findings may be conservative rather than inflated — an unusual direction of bias, and one worth stating, because it means the existing literature may understate rather than overstate real differences.
The prediction is testable without new recruitment. In any existing cohort with banked samples and activity data, specificity should improve and severity correlations should strengthen when analysis is restricted to participants with documented rest before venipuncture.
7. A Minimum Reporting Standard
Inexpensive to collect, and sufficient to render existing designs interpretable without altering them.
- Time since last bout of moderate or vigorous physical activity, in hours.
- Duration and approximate intensity of that bout.
- Nutritional state at draw, and time since last meal.
- Current metformin use, and other agents with documented effects on GDF15.
- Time of day of venipuncture.
- Whether the value is a single draw or a mean of repeated draws, and if repeated, the interval between them.
- Whether interpretation is against a population interval, a cohort-relative rank, or a subject-based baseline.
Items 1 through 5 are questionnaire fields. Item 6 requires one additional venipuncture. Item 7 requires only that the choice be stated.
8. A Testable Prediction
In cardiovascular physiology, the rate at which heart rate returns toward baseline after exercise carries prognostic information independent of both resting and peak heart rate.[14]
If the phasic and tonic components of GDF15 are dissociable, the same structure should hold: the rate of return toward the individual’s set point after a standardized load should index reserve independently of both the resting value and the peak.
Time-course data exist — GDF15 continued rising for two hours after exercise ceased in one study and remained elevated at three hours in another[9,11] — but the return limb has not been characterized as an object in its own right, with a rate parameter estimated against a documented set point. That requires a standardized load, two prior resting draws, and sampling to at least six hours. It requires no new assay.
9. Limitations and the Decisive Gap
This is a synthesis of published values and presents no new primary data.
Both biological variation estimates rest on small analyzable samples — 26 and 13. Their close agreement across independent cohorts and platforms mitigates but does not remove this.
The Sithiravel cohort lost 43% of enrolled participants to an assay limit of quantification at 400 ng/L. That exclusion is not random: it preferentially removes individuals with lower circulating concentrations, and since GDF15 rises with age, it may distort the variance components. The direction of that distortion is not established.
Ten weekly samples characterize short-term variation. They do not capture longer-term drift from aging, subclinical disease progression, or changes in body composition — the processes that matter most in the populations where GDF15 is used prognostically. The within-subject coefficient of variation of 7–8% may underestimate true variation over clinically relevant intervals.
The decisive gap is excursion magnitude in older adults. Exercise-induced GDF15 responses have been documented predominantly in small samples of young, mostly male subjects. Basal GDF15 is substantially higher in older adults and in heart failure, chronic kidney disease, and frailty. Whether the relative excursion — the quantity comparable against a reference change value — is preserved, attenuated, or amplified in those populations has not been measured.
This should be stated as what it is. No evidence has been found that large excursions persist unchanged in adults over 60; equally, none has been found that they attenuate. The measurement has not been made. A confound cannot be dismissed as immaterial in a population where its magnitude has never been established, and the appropriate response to an unmeasured quantity in a clinically important population is to measure it. The design is undemanding: two resting draws to establish a set point, one standardized submaximal load, serial sampling to six hours, in adults over 65. It would settle the question in a single modest study.
Finally, this paper does not establish that GDF15 is the correct marker of energetic strain, nor does it relate set point to any clinical outcome. It establishes that condition of measurement is not a nuisance variable at the magnitudes involved.
The wider question of what a mitokine signal indexes — and whether energetic strain is best read as a level, a reserve, or a rate of return — belongs to frameworks that treat energy allocation as an organizing principle of physiology. Picard and Murugan have proposed circulating GDF15 as the best currently available human marker of energy resistance, linking elevated concentrations to mitochondrial constraints on electron flux and to the downstream behavioural and physiological consequences of excess resistance.[15] If that framing is correct, the distinction between a stable set point and a transient load-induced excursion becomes decisive: an unrecorded phasic rise would be misread as a sustained elevation in resistance. A control-systems account of functional reserve developed elsewhere[16] offers one architecture in which tonic and phasic components can be separated and related to reserve.
10. What Would Falsify This
If within-subject variation in resting GDF15 in older clinical populations proves substantially larger than the 6–8% reported in healthy adults, approaching the magnitude of the exercise excursion, the set point is not estimable at practical sampling densities and the framework has no operational content. The Meijers estimate of 16.6% in heart failure and healthy controls is the existing evidence bearing on this, and the interpretation offered in Section 2 is itself the hypothesis at risk here.
If relative exercise-induced excursions attenuate with age or disease to below the reference change value in the populations where GDF15 is used, the confounding is real but immaterial there. This is the open question of Section 9.
If tonic and phasic components prove non-dissociable — if individuals with elevated set points show proportionally identical excursions and the two carry equivalent prognostic information — the distinction is redundant and single-draw designs lose nothing.
Each is directly testable. None requires a new assay. The first two require only that condition of measurement be recorded in studies already underway.
Funding
None.
Data availability
No new data were generated. All values discussed are drawn from the published sources cited.
Ethics
Not applicable; no human or animal subjects were involved.
Use of artificial intelligence
Large language models were used to assist with drafting and literature retrieval. All quantitative claims, citations, and bibliographic details were verified by the author against primary sources. The conceptual framework, clinical interpretation, and responsibility for the content remain solely those of the author.
Conflicts of interest
The author declares no competing interests.
References
- Coll, A.P.; Chen, M.; Taskar, P.; Rimmington, D.; Patel, S.; Tadross, J.A.; et al. GDF15 mediates the effects of metformin on body weight and energy balance. Nature 2020, 578(7795), 444–448. [Google Scholar] [CrossRef]
- Pruessner, J.C.; Kirschbaum, C.; Meinlschmid, G.; Hellhammer, D.H. Two formulas for computation of the area under the curve represent measures of total hormone concentration versus time-dependent change. Psychoneuroendocrinology 2003, 28(7), 916–931. [Google Scholar] [CrossRef] [PubMed]
- Krintus, M.; Braga, F.; Kozinski, M.; Borille, S.; Kubica, J.; Sypniewska, G.; et al. A study of biological and lifestyle factors, including within-subject variation, affecting concentrations of growth differentiation factor 15 in serum. Clin. Chem. Lab Med. 2019. [Google Scholar] [CrossRef] [PubMed]
- Sithiravel, C.; Røysland, R.; Alaour, B.; Sylte, M.S.; Torsvik, J.; Strand, H.; Marber, M.; Omland, T.; Aakre, K.M. Biological variation, reference change values and index of individuality of GDF-15. Clin. Chem. Lab Med. 2022, 60(4), 593–596. [Google Scholar] [CrossRef] [PubMed]
- Meijers, W.C.; van der Velde, A.R.; Muller Kobold, A.C.; Dijck-Brouwer, J.; Wu, A.H.; Jaffe, A.; de Boer, R.A. Variability of biomarkers in patients with chronic heart failure and healthy controls. Eur. J. Heart Fail. 2017, 19(3), 357–365. [Google Scholar] [CrossRef] [PubMed]
- Jiang, J.; Thalamuthu, A.; Ho, J.E.; Mahajan, A.; Ek, W.E.; Brown, D.A.; et al. A meta-analysis of genome-wide association studies of growth differentiation factor-15 concentration in blood. Front Genet. 2018, 9, 97. [Google Scholar] [CrossRef] [PubMed]
- Plomgaard, P.; Hansen, J.S.; Townsend, L.K.; Gudiksen, A.; Secher, N.H.; Clemmesen, J.O.; Støving, R.K.; Goetze, J.P.; Wright, D.C.; Pilegaard, H. GDF15 is an exercise-induced hepatokine regulated by glucagon and insulin in humans. Front Endocrinol. 2022, 13, 1037948. [Google Scholar] [CrossRef] [PubMed]
- Laurens, C.; Parmar, A.; Murphy, E.; et al. Growth and differentiation factor 15 is secreted by skeletal muscle during exercise and promotes lipolysis in humans. JCI Insight 2020, 5(6), e131870. [Google Scholar] [CrossRef] [PubMed]
- Kleinert, M.; Clemmensen, C.; Sjøberg, K.A.; Carl, C.S.; Jeppesen, J.F.; Wojtaszewski, J.F.P.; Kiens, B.; Richter, E.A. Exercise increases circulating GDF15 in humans. Mol. Metab. 2018, 9, 187–191. [Google Scholar] [CrossRef] [PubMed]
- Klein, A.B.; Nicolaisen, T.S.; Ørtenblad, N.; Gejl, K.D.; Jensen, R.; Fritzen, A.M.; et al. Pharmacological but not physiological GDF15 suppresses feeding and the motivation to exercise. Nat. Commun. 2021, 12, 1041. [Google Scholar] [CrossRef] [PubMed]
- Sabaratnam, R.; Kristensen, J.M.; Pedersen, A.J.T.; Kruse, R.; Handberg, A.; Wojtaszewski, J.F.P.; Højlund, K. Acute exercise increases GDF15 and unfolded protein response/integrated stress response in muscle in type 2 diabetes. J. Clin. Endocrinol. Metab. 2024, 109(7), 1754–1764. [Google Scholar] [CrossRef] [PubMed]
- Fraser, C.G.; Harris, E.K. Generation and application of data on biological variation in clinical chemistry. Crit. Rev. Clin. Lab Sci. 1989, 27(5), 409–437. [Google Scholar] [CrossRef] [PubMed]
- Yigit, E.; Cure, O.; Huner Yigit, M.; Uzun, H. Serum GDF15 as a supportive biomarker in female fibromyalgia patients based on a prospective case-control study. Sci. Rep. 2025, 15(1), 38004. [Google Scholar] [CrossRef] [PubMed]
- Cole, C.R.; Blackstone, E.H.; Pashkow, F.J.; Snader, C.E.; Lauer, M.S. Heart-rate recovery immediately after exercise as a predictor of mortality. N Engl. J. Med. 1999, 341(18), 1351–1357. [Google Scholar] [CrossRef] [PubMed]
- Picard, M.; Murugan, N.J. The energy resistance principle. Cell Metab. 2025, 37(11), 2107–2127. [Google Scholar] [CrossRef] [PubMed]
- O’Leary, R.T. Human functional decline as a control systems problem: a mitochondrial–epigenetic framework. Preprints.org. 2026. [Google Scholar] [CrossRef]

Table 1.
Magnitudes of change in circulating GDF15, ordered against the reference change value.
| Source of change | Magnitude | Relative to RCV (23%) | Source |
| Analytical variation | <1% | 0.04× | 2 |
| Within-subject biological variation, age <45 | 7.4% | 0.32× | 2 |
| Within-subject biological variation, age ≥45 | 7.9% | 0.34× | 2 |
| Reference change value | 23% | 1× | 1 |
| 1 h cycling at 67% VO2max, immediately post | +34% | 1.5× | 3 |
| Chronic energy deprivation (anorexia nervosa, resting) | 1.4-fold | 1.7× | 5 |
| 1 h cycling at 67% VO2max, 120 min post | +64% | 2.8× | 3 |
| Glucagon:insulin ratio elevation at rest | 2.7-fold | 7.4× | 5 |
| Prolonged endurance exercise | 4–5-fold | 13–17× | 4 |
| 36 h fast | no significant change | 0× | 5 |
Disclaimer/Publisher’s Note: The statements, opinions and data contained in all publications are solely those of the individual author(s) and contributor(s) and not of MDPI and/or the editor(s). MDPI and/or the editor(s) disclaim responsibility for any injury to people or property resulting from any ideas, methods, instructions or products referred to in the content. |
© 2026 by the authors. Licensee MDPI, Basel, Switzerland. This article is an open access article distributed under the terms and conditions of the Creative Commons Attribution (CC BY) license (http://creativecommons.org/licenses/by/4.0/).
Copyright: This open access article is published under a Creative Commons CC BY 4.0 license, which permit the free download, distribution, and reuse, provided that the author and preprint are cited in any reuse.