
Submitted:
04 August 2026
Posted:
05 August 2026
You are already at the latest version
Abstract
Regional HPV genotype data for the Yangtze River Delta remain scarce, limiting evidence-based vaccine and screening policy. We retrospectively analysed all 8,515 cervical HPV genotyping records from Xishan People’s Hospital of Wuxi City (January 2024–June 2025) using a 23-type fluorescent PCR panel classified by IARC criteria. Overall HPV prevalence was 22.83% (1,944/8,515; 95% CI 21.9–23.8%). The five leading types were HPV52 (4.82%), HPV58 (3.14%), HPV16 (2.96%), HPV53 (2.50%), and HPV42 (2.08%); HPV18 (0.74%) ranked below two unvaccinated carcinogens, HPV51 (1.76%, IARC Group 1) and HPV68 (1.68%, Group 2A). Age-stratified prevalence was U-shaped (χ² = 123.27, P < 0.001), with peaks at ≤20 years (52.94%; exploratory, n = 51) and ≥61 years (34.66%). Among 1,944 positive women, 43.0% were completely unprotected by the nonavalent vaccine (all types absent from 9vHPV), and 60.4% harboured ≥1 non-9vHPV type. HPV51 and HPV68 together accounted for 15.08% of positive cases. In the co-infection network (n = 585 multiple-type infections), HPV52 achieved the highest degree centrality (281 co-infection events; normalised degree 0.0218) and was present in 8 of the 15 most frequent dual-type pairs, with observed/expected ratios of 6.5–14.8×. These findings reveal a clinically substantial protection gap and support HPV51/68 prioritisation in next-generation vaccine design.
Keywords:
human papillomavirus
; HPV genotype distribution
; vaccine protection gap
; co-infection network
; degree centrality
; hub genotype
; cervical cancer
; Wuxi
; nonavalent vaccine
; STROBE
1. Introduction
Cervical cancer kills approximately 350,000 women annually; GLOBOCAN 2022 recorded 660,000 new cases globally [1], with China contributing an estimated 150,000 new diagnoses and 55,000 deaths in the same year [2]. All invasive cervical cancers are causally attributable to persistent infection with oncogenic HPV types [3,18]; IARC classifies 13 types as definite (Group 1) or probable (Group 2A) human carcinogens [4]. The WHO Global Strategy to Accelerate the Elimination of Cervical Cancer (2020) sets a 90% vaccination coverage target for adolescent girls by 2030 [5], making accurate local genotype data a prerequisite for rational policy design.
Three prophylactic vaccines are licensed in China: bivalent (HPV16/18, 2016), quadrivalent (HPV6/11/16/18, 2017), and nonavalent (HPV6/11/16/18/31/33/45/52/58, 2018) [7,33]. The nonavalent formulation is estimated to prevent approximately 90% of HPV-attributable cervical cancers globally [8,16], but its real-world protection in East Asian populations—where HPV52 and HPV58 predominate rather than HPV16 and HPV18 [6,29]—remains incompletely characterised at the city level.
Regional surveillance studies have been published for Qingdao [9], Weifang [10], Guangzhou [11], Suzhou [12], Changsha [13], Shanghai Jinshan [14], Shanghai Xuhui [15], Chengdu [31,32], and 37 cities nationwide [28], but no large-scale, multi-type HPV epidemiological study exists for Wuxi or the broader Yangtze River Delta outside Shanghai. Wuxi Xishan District had 892,400 registered residents at end of 2024; Xishan People’s Hospital of Wuxi City is its sole tertiary-level general hospital (Grade III Class B), with an annual outpatient volume exceeding 1.14 million visits and centralised cervical HPV testing covering all inpatient and outpatient departments.
A second evidence gap concerns age distribution. Most published series focus on women aged 25–60, leaving adolescents (≤20 years) and older women (≥61 years) poorly characterised [14,15]. Adolescents represent the primary target for pre-exposure vaccination; older women constitute a dual blind spot—ineligible for vaccination (upper limit 45 years in China) and progressively disengaging from screening programmes.
A third gap concerns co-infection network topology. HPV multiple-type infection is associated with substantially elevated risk of high-grade cervical intraepithelial neoplasia [22,35], and the structure of genotype co-occurrence networks may reveal biologically important interactions. Yet formal network centrality analysis is absent from most Chinese HPV surveillance studies.
This study addressed four questions using comprehensive 23-type data from 8,515 consecutive clinical women: (1) the Wuxi-specific HPV genotype prevalence profile, with type-resolved 95% confidence intervals; (2) quantification of vaccine protection gaps across all three licensed formulations; (3) infection characteristics at both age extremes (≤20 and ≥61 years); and (4) co-infection network centrality of HPV52 as a candidate hub genotype, using degree centrality metrics and observed-versus-expected co-infection ratios. This study was conducted and reported in accordance with the STROBE guidelines for cross-sectional studies.
2. Materials and Methods
2.1. Study Design and Setting
This retrospective cross-sectional study enrolled all women who underwent cervical HPV genotyping at Xishan People’s Hospital of Wuxi City between 1 January 2024 and 30 June 2025. The Clinical Laboratory Department centralises all cervical HPV nucleic acid testing hospital-wide; results feed directly into the Laboratory Information System (LIS). Of 8,516 LIS records exported, the final entry was a system-generated null row (all genotype fields negative; age and department blank) and was excluded, leaving 8,515 analysable records.
Data cleaning resolved two coding irregularities: 99 records carrying department code "1163" were verified via the Hospital Information System (HIS) as gynaecology outpatient visits and merged accordingly; 9 records coded as "internal medicine health examination" were merged with the health examination centre group (final n = 1,732). As the exported dataset contained no unique patient identifiers or test dates, the analysis unit was the individual testing record (see Limitations).
Inclusion criteria: female sex, age ≥ 16 years, cervical exfoliated cell sample submitted for HPV genotyping as the primary clinical indication. Exclusion criteria: documented pregnancy, confirmed history of cervical surgery in HIS records, or missing or implausible age data. Eligibility was verified by HIS–LIS record linkage. This study was approved by the Institutional Review Board of Xishan People’s Hospital of Wuxi City (No. 2026-K089-01); individual informed consent was waived under Article 39 of China's Measures for Ethical Review of Biomedical Research Involving Human Subjects given the retrospective design and use of de-identified data.
2.2. Specimen Collection and HPV Genotyping
Qualified gynaecologists or nurses collected cervical exfoliated cells by rotating a cervical brush five times clockwise at the external os. Specimens were immediately transferred to proprietary preservation solution (Shengxiang Biotechnology, Changsha, China), stored at 4 °C, and processed within 24 h of collection.
Genotyping used the Shengxiang 23-type HPV nucleic acid detection kit (fluorescent multiplexed PCR) on QuantStudio™ 5 (Thermo Fisher Scientific, Waltham, MA, USA) and SLAN-96S (Shanghai Hongshi Medical Technology, Shanghai, China) real-time PCR systems. The panel covered 13 high-risk types (HPV16, 18, 31, 33, 35, 39, 45, 51, 52, 56, 58, 59, 68), 5 intermediate-risk types (HPV26, 53, 66, 73, 82), and 5 low-risk types (HPV6, 11, 42, 43, 81), classified per current IARC criteria [4]—HPV51 as Group 1 (definite carcinogen) and HPV68 as Group 2A (probable carcinogen). Positive and negative controls were included in every run.
2.3. Variable Definitions
Age groups: ≤20, 21–30, 31–40, 41–50, 51–60, and ≥61 years. Infection multiplicity: single-type (one type detected), dual-type (two types), and multiple-type infection (≥2 types).
Three vaccine coverage indices were calculated per formulation: (i) at least partial coverage (APC)—≥1 positive type falls within vaccine targets; (ii) mixed gap—≥1 positive type falls outside vaccine targets; (iii) complete unprotected (CU)—all positive types fall outside vaccine targets. APC and CU are mutually complementary (APC + CU = total positives). For bivalent and quadrivalent vaccines, CU equals mixed gap since these vaccines cover only 2 or 4 types. The nonavalent vaccine targets HPV6, 11, 16, 18, 31, 33, 45, 52, and 58.
Co-infection network metrics: degree of a genotype was defined as the total number of co-infection events in which it appeared (i.e., sum of co-detected partner types across all multiple-infected patients). Normalised degree = degree / [(N − 1) × M], where N is the number of genotypes in the panel (23) and M is the number of multiple-infected patients (585). Expected co-infection frequency for a genotype pair (A, B) was calculated under the independence assumption as: E(A,B) = P(A) × P(B) × N_positive, where P(X) is the marginal prevalence of type X in the full cohort (n = 8,515). The observed/expected (O/E) ratio quantifies enrichment above independence-expected co-occurrence.
2.4. Statistical Analysis
Analyses used SPSS 26.0 (IBM Corp., USA) and Python 3.11 (network metrics). HPV prevalence and 95% confidence intervals (CIs) were estimated by the normal approximation. Between-group prevalence comparisons used Pearson's χ² test, or Fisher's exact test when any expected cell count was < 5. Co-infection pairs were enumerated by pairwise combination of all detected types per patient. All tests were two-tailed; significance threshold α = 0.05.
3. Results
3.1. Overall Prevalence and Genotype Distribution
Among 8,515 women (age 16–87 years; mean ± SD 43.4 ± 11.9 years), 1,944 (22.83%; 95% CI 21.9–23.8%) tested positive for ≥1 HPV type. High-risk, intermediate-risk, and low-risk HPV prevalence were 17.63%, 3.86%, and 5.55%, respectively. All 23 genotypes were detected. HPV52 ranked first (4.82%; 95% CI 4.36–5.27%), followed by HPV58 (3.14%), HPV16 (2.96%), HPV53 (2.50%), and HPV42 (2.08%). Crucially, HPV18 (0.74%; 95% CI 0.56–0.92%)—the second antigen target in all licensed vaccines—was less prevalent than the unvaccinated IARC Group 1 carcinogen HPV51 (1.76%) and the Group 2A carcinogen HPV68 (1.68%). Complete type-specific data with 95% CIs are presented in Table 1.
3.2. Vaccine Protection Gaps
Of 1,944 HPV-positive women, 57.0% (n = 1,109) had at least partial nonavalent vaccine coverage (APC), while 43.0% (n = 835) were completely unprotected (CU)—all detected types absent from 9vHPV—and 60.4% (n = 1,174) harboured ≥1 non-9vHPV type (mixed gap). For 2vHPV and 4vHPV, the CU rate equalled the mixed-gap rate (84.0% and 79.4%, respectively), as these formulations cover only 2 or 4 types (Table 2).
Among the 14 genotypes excluded from 9vHPV, the five highest-burden in positive women were HPV53 (10.96%), HPV42 (9.10%), HPV81 (8.54%), HPV51 (7.72%), and HPV68 (7.36%). HPV51 and HPV68 together accounted for 15.08% of all positive cases—exceeding the combined prevalence-weighted contribution of the 9vHPV-covered types HPV31 (3.66%) and HPV45 (0.98%), and underscoring a carcinogen-coverage asymmetry in current vaccine formulations.
3.3. Age-Stratified Prevalence: U-Shaped Distribution
Prevalence differed significantly across the six age groups (χ² = 123.27, df = 5, P < 0.001; Figure 1), tracing a U-shaped curve. It peaked in the ≤20-year group (52.94%; 95% CI 39.2–66.6%; n = 51; exploratory finding—see Table 3 footnote), fell to a nadir in the 31–40-year group (19.32%), then rose progressively, reaching 34.66% (95% CI 31.3–38.0%) in women aged ≥61 years. High-risk HPV prevalence in the ≥61-year group was 29.90%—the highest among the non-exploratory strata. Triple-or-higher type infection was most frequent at both extremes: 13.73% (7/51) in ≤20 years and 5.28% (41/776) in ≥61 years. The nonavalent CU rate was lowest in the ≥61-year group (31.6%) versus 43.3–47.9% in the 21–60-year groups, consistent with higher background prevalence of 9vHPV-targeted types in older women (Table 3 and Table 4).
3.4. Co-Infection Network Centrality of HPV52
Of 1,944 positive women, 1,359 (15.96%) had single-type and 585 (6.87%) had multiple-type infection: dual 400 (4.70%), triple 134 (1.57%), quadruple 30 (0.35%), quintuple 12 (0.14%), sextuple 6 (0.07%), septuple 1 (0.01%), and octuple 2 (0.02%).
Network centrality analysis across 585 multiply infected women revealed HPV52 as the highest-degree node (degree = 281 co-infection events; normalised degree 0.0218), substantially exceeding HPV58 (degree 212), HPV53 (207), HPV81 (181), and HPV16 (174) (Table 5; Figure 2). HPV52 co-detected with all other 22 panel genotypes, yielding 21 distinct co-infection partner types. Among the five most frequent HPV52-anchored pairs, observed co-infection frequencies exceeded independence-expected values by 6.5–14.8-fold (Table 6), indicating non-random co-occurrence enrichment. HPV52 appeared in 8 of the 15 most frequent dual-type pairs. Notably, the pairs HPV53 + HPV68 (n = 21) and HPV58 + HPV68 (n = 16) featured HPV68, an unvaccinated Group 2A carcinogen.
3.5. Department-Stratified Prevalence
Prevalence differed significantly across the six departments (χ² = 183.0, df = 5, P < 0.001; Table 7). The cervical specialty clinic recorded the highest rate (33.09%; 95% CI 29.2–37.0%), 2.4-fold the health examination centre reference (13.63%; 95% CI 12.0–15.2%). A monotonic gradient was observed tracking clinical referral intensity: cervical specialty clinic (33.09%) > gynaecology OPD (26.37%) > gynaecology inpatient (16.42%) > health examination centre (13.63%). The gynaecology inpatient–health-exam-centre difference did not reach statistical significance (P = 0.056), limiting causal interpretation. An additional 85 cases from low-volume non-gynaecological departments were retained in the overall prevalence numerator but excluded from between-department comparisons; the six analysed departments totalled 8,430 women.
3.6. Risk Stratification
Of 8,515 women, 6,571 (77.17%) were HPV-negative. Among 1,944 positive women: high-risk only 1,201 (14.10%); intermediate-risk only 159 (1.87%); low-risk only 260 (3.05%); high-risk + intermediate-risk 111 (1.30%); high-risk + low-risk 154 (1.81%); intermediate-risk + low-risk 24 (0.28%); all three risk tiers 35 (0.41%).
4. Discussion
Four findings define the clinical and public-health significance of these data. First, HPV52 is the dominant high-risk type across all age strata and displays the highest co-infection network degree centrality, with observed co-infection frequencies 6.5–14.8-fold above independence-expected values—consistent with a hub-genotype architecture. Second, 43.0% of HPV-positive women in this clinical population carry types entirely absent from the nonavalent vaccine, with the IARC-classified carcinogens HPV51 and HPV68 collectively accounting for 15.08% of positive cases. Third, HPV prevalence at both age extremes (≤20 and ≥61 years) substantially exceeds the 31–40-year nadir, identifying two currently underserved prevention populations. Fourth, a 2.4-fold inter-departmental gradient demonstrates that the overall 22.83% prevalence reflects case-mix enrichment; the health examination centre rate (13.63%) provides a closer community-level approximation.
HPV52 dominance and hub-genotype topology. HPV52 displacement of HPV16/18 from the top prevalence position is consistent across East Asian epidemiology [6,9,10,11,12,13,20,27,29,32] and has been attributed to genomic and immunological characteristics that facilitate immune persistence in East Asian host populations [36]. In our network analysis, HPV52 co-detected with all 22 other panel types and achieved a normalised degree of 0.0218—29% above HPV58 (0.0165). Observed co-infection rates for HPV52 with its four most frequent partners were 6.5–14.8× the independence expectation, suggesting co-occurrence enrichment that may reflect either shared exposure windows or impaired type-specific immune clearance. This contrasts with hub-genotype analyses in other populations that implicate HPV16 as the dominant co-infection node [37]. The continued dominance of HPV52 post-9vHPV introduction warrants prospective type-replacement surveillance [10].
Vaccine protection gaps and antigen prioritisation. The 43.0% complete-unprotected rate exceeds figures reported from Suzhou (21.7%) [12], Beijing [38], and several other Chinese cities [17,25,26], reflecting both our broader 23-type panel and the referral-enriched sample. HPV51 (1.76%) and HPV68 (1.68%) together constituted 15.08% of positive cases—individually exceeding the cohort-wide prevalence of 9vHPV-covered HPV31 (0.83%) and HPV45 (0.22%) and collectively surpassing their sum. Both meet IARC carcinogenicity criteria [4,30], and epidemiological studies have attributed 3–5% of cervical cancers globally to HPV51 and HPV68 [39]. Broader-spectrum vaccines incorporating these types are in development [19]; our local frequency and O/E co-occurrence data provide a quantitative rationale for prioritising HPV51 and HPV68 in next-generation antigen selection for the East Asian market.
U-shaped age distribution: implications for prevention policy. The trough at 31–40 years and re-elevation at ≥61 years (HR-HPV 29.90%) replicate a pattern documented in Shanghai [14,15], Weifang [10], and Chengdu [31,32], and mirrors the age-specific multiple-infection pattern reported nationally [21]. Immunosenescence-driven viral reactivation and impaired T-cell-mediated clearance are the most widely cited mechanisms [24,40]; the lower 9vHPV CU rate in women ≥61 (31.6% versus 43.3–47.9% in younger groups) is consistent with higher background carriage of vaccine-targeted types accumulated over longer exposure histories. Given that Chinese recommendations cap HPV vaccination at age 45 and that elderly women progressively disengage from screening, routine high-risk HPV screening continuation beyond age 65 and colposcopy referral for HPV-positive women aged ≥61 are warranted, consistent with current Chinese cervical cancer screening guidelines [23]. The ≤20-year finding (52.94%; n = 51) is exploratory; all cases were clinical attendees with inherent selection bias, and the wide 95% CI (39.2–66.6%) reflects the small sample. Nevertheless, a similarly elevated rate in this stratum has been reported in Shanghai [14,15] and Chengdu [31], and the HPV16 prevalence of 15.69%—the highest of all age strata—is biologically plausible given rapid high-risk exposure shortly after sexual debut [41]. These data support clinician-initiated HPV risk assessment for sexually active patients below age 25 in clinical settings, without implying a need to revise national screening age thresholds.
Department gradient and external validity. The 2.4-fold prevalence gradient directly tracking clinical referral intensity confirms that overall hospital-level HPV rates are strongly confounded by case-mix. The health examination centre prevalence (13.63%) closely approximates community-level estimates from Suzhou (10.2%) [12] and Chengdu health-check cohorts (~14%) [32], suggesting that the underlying community HPV burden in Wuxi is not markedly elevated relative to adjacent cities, and that the 22.83% overall figure reflects referral enrichment rather than an intrinsically higher population prevalence. This distinction is crucial for policy translation: local cervical cancer prevention strategies should be calibrated to the community baseline (approximately 13–14%), not the referral-enriched clinical rate.
Limitations. This single-centre retrospective cross-sectional study has six limitations. First, generalisation to the broader Wuxi population requires caution. Second, retrospective data preclude adjustment for key confounders: vaccination history, number of sexual partners, contraceptive use, and smoking status. The absence of vaccination status data is a particular limitation given that this study period (2024–2025) coincides with expanding 9vHPV uptake in China; we cannot determine whether the 43.0% CU rate would differ between vaccinated and unvaccinated subgroups. Third, the ≤20-year group (n = 51, 0.60% of cohort) consists entirely of clinical attendees; prevalence is exploratory. Fourth, the cross-sectional design precludes inference on infection persistence, temporal sequence, or causal direction in co-infection pairs. Fifth, the exported dataset lacked unique patient identifiers and test dates, so the analysis unit was the individual testing record rather than the individual patient; a small number of women who submitted repeat samples during the study period were therefore counted more than once, which may have marginally influenced prevalence estimates. Sixth, LIS diagnostic field completion was 42.3%, preventing systematic HPV–cytology linkage; integration of TCT and histopathology results, alongside HPV genotyping, would substantially strengthen the clinical interpretation of these epidemiological findings [34].
5. Conclusions
This 23-type retrospective cross-sectional study of 8,515 consecutive clinical women in Wuxi establishes four actionable conclusions. HPV52 is the dominant high-risk genotype across all age strata, achieves the highest co-infection network degree centrality (degree 281; normalised degree 0.0218), and displays 6.5–14.8-fold enriched co-occurrence with its top partners—consistent with hub-genotype behaviour. The nonavalent vaccine leaves 43.0–60.4% of positive women incompletely protected; the IARC carcinogens HPV51 (Group 1) and HPV68 (Group 2A) constitute the principal unmet need, each exceeding the prevalence of 9vHPV-covered HPV31 and HPV45. A U-shaped age-prevalence distribution, with high-risk HPV rates of 29.90% in women ≥61 years and exploratory rates of 45.10% in women ≤20 years, reveals two currently underserved populations at the extremes of the age spectrum. Department-level stratification shows that the health examination centre baseline (13.63%) approximates community-level prevalence, while the 22.83% overall rate reflects case-mix enrichment from referral patients. These data support HPV51 and HPV68 as priority antigens for next-generation vaccine design and call for sustained cervical cancer screening coverage across the full clinically active age spectrum.
Author Contributions
Conceptualization, B.R. and H.W.; methodology, B.R. and H.W.; software, H.W.; validation, B.R., H.W. and F.Z.; formal analysis, H.W.; investigation, B.R. and F.Z.; resources, B.R.; data curation, B.R. and F.Z.; writing—original draft preparation, B.R. and H.W.; writing—review and editing, H.W. and B.R.; visualization, H.W.; supervision, B.R.; project administration, B.R. All authors have read and agreed to the published version of the manuscript.
Funding
This research received no external funding.
Institutional Review Board Statement
Approved by the IRB of Xishan People’s Hospital of Wuxi City (No. 2026-K089-01).
Informed Consent Statement
Informed consent was waived under Article 39 of China's Measures for Ethical Review of Biomedical Research Involving Human Subjects.
Data Availability Statement
Data are available from the corresponding author on reasonable request, subject to patient privacy protections.
Acknowledgments
The authors thank the staff of the Clinical Laboratory Department, Xishan People’s Hospital of Wuxi City, for their support in data collection and laboratory operations.
Conflicts of Interest
The authors declare no conflicts of interest.
References
- Bray F, Laversanne M, Sung H, et al. Global cancer statistics 2022: GLOBOCAN estimates of incidence and mortality worldwide for 36 cancers in 185 countries. CA Cancer J Clin. 2024;74(3):229–263. [CrossRef]
- Zheng RS, Chen R, Han BF, et al. Cancer incidence and mortality in China, 2022. Chin J Oncol. 2024;46(3):221–231. (In Chinese) . [CrossRef]
- Walboomers JM, Jacobs MV, Manos MM, et al. Human papillomavirus is a necessary cause of invasive cervical cancer worldwide. J Pathol. 1999;189(1):12–19. [CrossRef]
- IARC Working Group on the Evaluation of Carcinogenic Risks to Humans. Biological Agents. Volume 100B: A Review of Human Carcinogens. Lyon: IARC Press; 2012.
- World Health Organization. Global Strategy to Accelerate the Elimination of Cervical Cancer as a Public Health Problem. Geneva: WHO; 2020. https://www.who.int/publications/i/item/9789240014107.
- Bruni L, Diaz M, Castellsagué X, et al. Cervical human papillomavirus prevalence in 5 continents: meta-analysis of 1 million women with normal cytological findings. J Infect Dis. 2010;202(12):1789–1799. [CrossRef]
- Chinese Preventive Medicine Association Vaccines and Immunization Branch. Expert consensus on immunoprevention of HPV-associated diseases. Chin J Prev Med. 2019;53(8):761–803. (In Chinese).
- Arbyn M, Xu L, Simoens C, et al. Prophylactic vaccination against human papillomaviruses to prevent cervical cancer and its precursors. Cochrane Database Syst Rev. 2018;5(5):CD009069. [CrossRef]
- Yan YF, Li LL, Deng ZW, et al. HPV infection and genotype distribution among women in Qingdao, 2015–2019. Chin J Exp Clin Virol. 2021;35(4):424–428. (In Chinese).
- Yang HR, Wang WH, Sun LL, et al. HPV infection characteristics in women in Weifang, 2019–2023. Chin J Dis Control Prev. 2025;29(3):268–274. (In Chinese).
- Huang YT, Chen XM, Zeng LT, et al. HPV infection and genotyping among 5,892 women in Guangzhou. Chin J Prev Med. 2024;25(6):746–750. (In Chinese).
- Wang T, Luan L, Deng J, et al. Prevalence and HPV genotype distribution in Suzhou, China. Hum Vaccin Immunother. 2023;19(2):2241309. [CrossRef]
- Li P, Chen SQ, Deng CJ, et al. HPV infection and genotype distribution among 60,354 patients in Changsha. Chin J Clin Lab Sci. 2023;46(4):360–366. (In Chinese).
- Chen SS, Chen J, Xiao T. HPV infection among women of all ages in Jinshan District, Shanghai. J Int Med Res. 2024;52(11):03000605241298247. [CrossRef]
- Liu H, Jiang M, Wu J, et al. Female HPV infection and genotype distribution in Xuhui District, Shanghai. Virol J. 2025;22:59. [CrossRef]
- Lei J, Ploner A, Elfström KM, et al. HPV vaccination and the risk of invasive cervical cancer. N Engl J Med. 2020;383(14):1340–1348. [CrossRef]
- Zhang L, Xiao M, He XC, et al. HPV genotype distribution and cervical lesion characteristics in a Shenzhen cancer hospital. Chin J Prev Med. 2025;59(4):490–494. (In Chinese).
- Schiffman M, Doorbar J, Wentzensen N, et al. Carcinogenic human papillomavirus infection. Nat Rev Dis Primers. 2016;2:16086. [CrossRef]
- Hampson IN, Oliver AW. Update on effects of prophylactic HPV vaccines on type prevalence and cervical pathology. Viruses. 2024;16(8):1245. [CrossRef]
- Zhang J, Cheng K, Wang Z. HPV genotypes in cervical intraepithelial neoplasia in China: a meta-analysis. Arch Gynecol Obstet. 2020;302(6):1329–1337. [CrossRef]
- Zhou YX, Ma XH, Wang TT, et al. Age-specified genotype distribution of HPV multiple infections in China. Sci Rep. 2024;14(1):2678. [CrossRef]
- Lee SA, Kang D, Seo SS, et al. Multiple HPV infection in cervical cancer screened by HPV DNA chip. Cancer Lett. 2003;198(2):187–192. [CrossRef]
- Li MZ, Wei LH, Sui L, et al. Chinese guideline for cervical cancer screening (Part I). Chin J Obstet Gynecol Clin. 2023;24(4):437–442. (In Chinese).
- Gravitt PE, Winer RL. Natural history of HPV infection across the lifespan: role of viral latency. Viruses. 2017;9(10):267. [CrossRef]
- Ma HP, Jiao X, Zhao YH, et al. HPV genotype analysis in Tengzhou, Shandong Province. Chin J Clin Infect Dis. 2021;14(3):203–207. (In Chinese).
- Li ZM, Luo XP, Mao LZ, et al. HPV genotype distribution among 13,750 women in Chaozhou, Guangdong. Chin J Obstet Gynecol Clin (Electron Ed). 2012;8(4):432–435. (In Chinese).
- Chan PK, Ho WC, Chan MC, et al. Meta-analysis on prevalence and attribution of HPV types 52 and 58 in cervical neoplasia worldwide. PLoS One. 2014;9(9):e107573. [CrossRef]
- Wang R, Guo XL, Wisman GB, et al. Nationwide HPV prevalence and genotype distribution in 37 Chinese cities. BMC Infect Dis. 2015;15:257. [CrossRef]
- Clifford GM, Gallus S, Herrero R, et al. Worldwide HPV type distribution in cytologically normal women: IARC HPV prevalence surveys pooled analysis. Lancet. 2005;366(9490):991–998. [CrossRef]
- Muñoz N, Bosch FX, de Sanjosé S, et al. Epidemiologic classification of HPV types associated with cervical cancer. N Engl J Med. 2003;348(6):518–527. [CrossRef]
- Mo B, Ye Y, Yu M, et al. Prevalence and genotype distribution of HPV combined with cervical pathological results in women from Sichuan, 2019–2023. Cancer Med. 2024;13(16):e70148. [CrossRef]
- Deng Y, Wang Y, Zhang J, et al. Prevalence and genotype distribution of HPV infection among women in Chengdu from 2019 to 2024: a retrospective single-center study. Infect Agents Cancer. 2025;20:57. [CrossRef]
- Zhao C, Zhao Y, Li J, Li M, Shi Y, Wei L. Opportunities and challenges for human papillomavirus vaccination in China. Hum Vaccin Immunother. 2024;20(1):2329450. [CrossRef]
- Mollers M, Vossen JM, Friesen MR, et al. Current and future applications of HPV genotyping in cervical cancer screening. Am J Clin Pathol. 2012;138(4):512–519. [CrossRef]
- Trottier H, Mahmud S, Costa MC, et al. Human papillomavirus infections with multiple types and risk of cervical neoplasia. Cancer Epidemiol Biomarkers Prev. 2006;15(7):1274–1280. [CrossRef]
- de Sanjosé S, Brotons M, Pavón MA. The natural history of human papillomavirus infection. Best Pract Res Clin Obstet Gynaecol. 2018;47:2–13. [CrossRef]
- Pintos J, Black MJ, Sadeghi N, et al. Human papillomavirus infection and oral cancer: a case-control study in Montreal, Canada. Oral Oncol. 2008;44(3):242–250. [CrossRef]
- Zhang Y, Zhang Y, Dong B, et al. HPV prevalence and genotype distribution among women in eastern China during the COVID-19 pandemic. Hum Vaccin Immunother. 2023;19(2):2212571. [CrossRef]
- de Sanjosé S, Quint WG, Alemany L, et al. Human papillomavirus genotype attribution in invasive cervical cancer: a retrospective cross-sectional worldwide study. Lancet Oncol. 2010;11(11):1048–1056. [CrossRef]
- Moscicki AB, Schiffman M, Burchell A, et al. Updating the natural history of human papillomavirus and anogenital cancers. Vaccine. 2012;30(Suppl 5):F24–33. [CrossRef]
- Giuliano AR, Anic G, Nyitray AG. Epidemiology and pathology of HPV disease in males. Gynecol Oncol. 2010;117(2 Suppl):S15–19. [CrossRef]
Figure 1.
Age-stratified HPV prevalence (overall and high-risk) among 8,515 clinical women in Wuxi, China (January 2024–June 2025). Blue circles with solid lines: overall HPV prevalence with 95% confidence intervals (error bars and shaded area). Red squares with dashed lines: high-risk HPV (HR-HPV) prevalence. †The ≤20-year group (n = 51; 0.60% of cohort) consists entirely of clinical attendees; results are exploratory and must not be extrapolated to the general adolescent population. χ² = 123.27, df = 5, P < 0.001.
Figure 1.
Age-stratified HPV prevalence (overall and high-risk) among 8,515 clinical women in Wuxi, China (January 2024–June 2025). Blue circles with solid lines: overall HPV prevalence with 95% confidence intervals (error bars and shaded area). Red squares with dashed lines: high-risk HPV (HR-HPV) prevalence. †The ≤20-year group (n = 51; 0.60% of cohort) consists entirely of clinical attendees; results are exploratory and must not be extrapolated to the general adolescent population. χ² = 123.27, df = 5, P < 0.001.
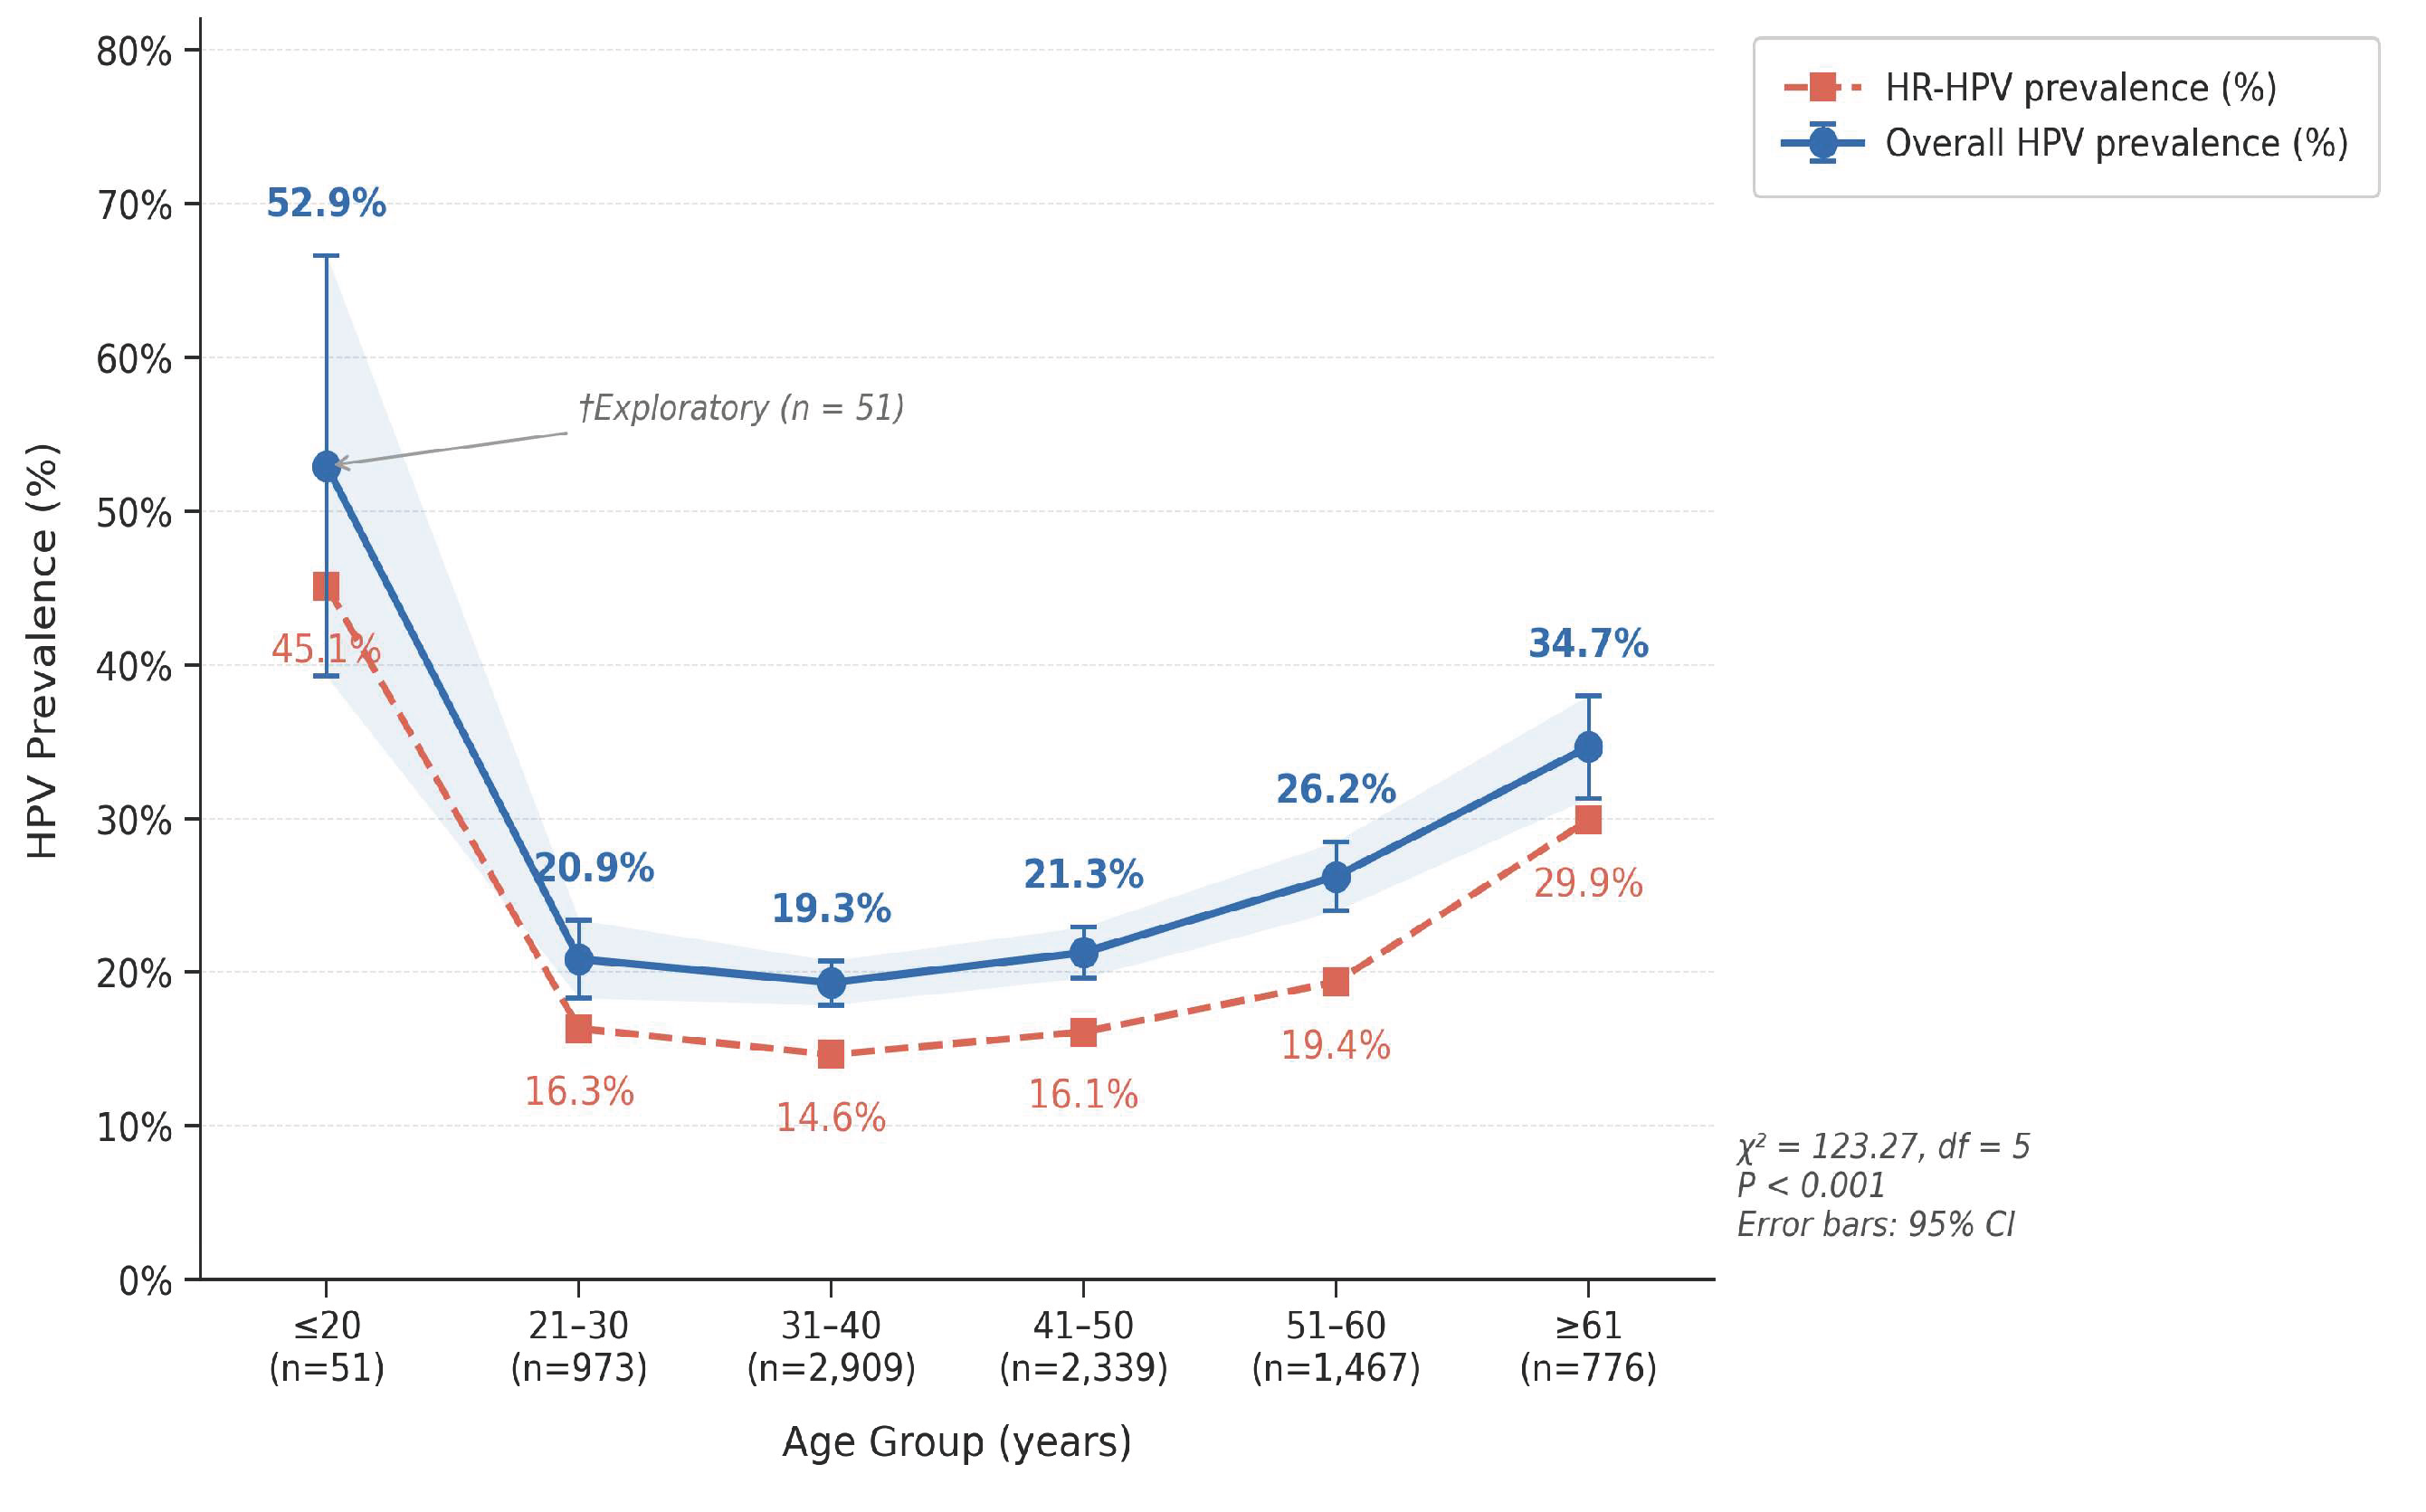
Figure 2.
Co-infection network among 585 women with multiple-type HPV infection (Wuxi, China, 2024–2025). Node size is proportional to the total number of infections for each genotype. Edge width is proportional to co-infection frequency; numbers on edges indicate pair counts for pairs with n ≥ 20. Node colour indicates risk category: red = high-risk (HR); yellow = intermediate-risk (IR); green = low-risk (LR). Dashed red rings identify HR types absent from the nonavalent (9vHPV) vaccine. HPV52 achieved the highest degree centrality (degree = 281; normalised degree = 0.0218), consistent with a hub-genotype co-infection architecture. Co-infection pair counts for HPV52 exceeded independence-expected values by 6.5–14.8-fold (see Table 6).
Figure 2.
Co-infection network among 585 women with multiple-type HPV infection (Wuxi, China, 2024–2025). Node size is proportional to the total number of infections for each genotype. Edge width is proportional to co-infection frequency; numbers on edges indicate pair counts for pairs with n ≥ 20. Node colour indicates risk category: red = high-risk (HR); yellow = intermediate-risk (IR); green = low-risk (LR). Dashed red rings identify HR types absent from the nonavalent (9vHPV) vaccine. HPV52 achieved the highest degree centrality (degree = 281; normalised degree = 0.0218), consistent with a hub-genotype co-infection architecture. Co-infection pair counts for HPV52 exceeded independence-expected values by 6.5–14.8-fold (see Table 6).
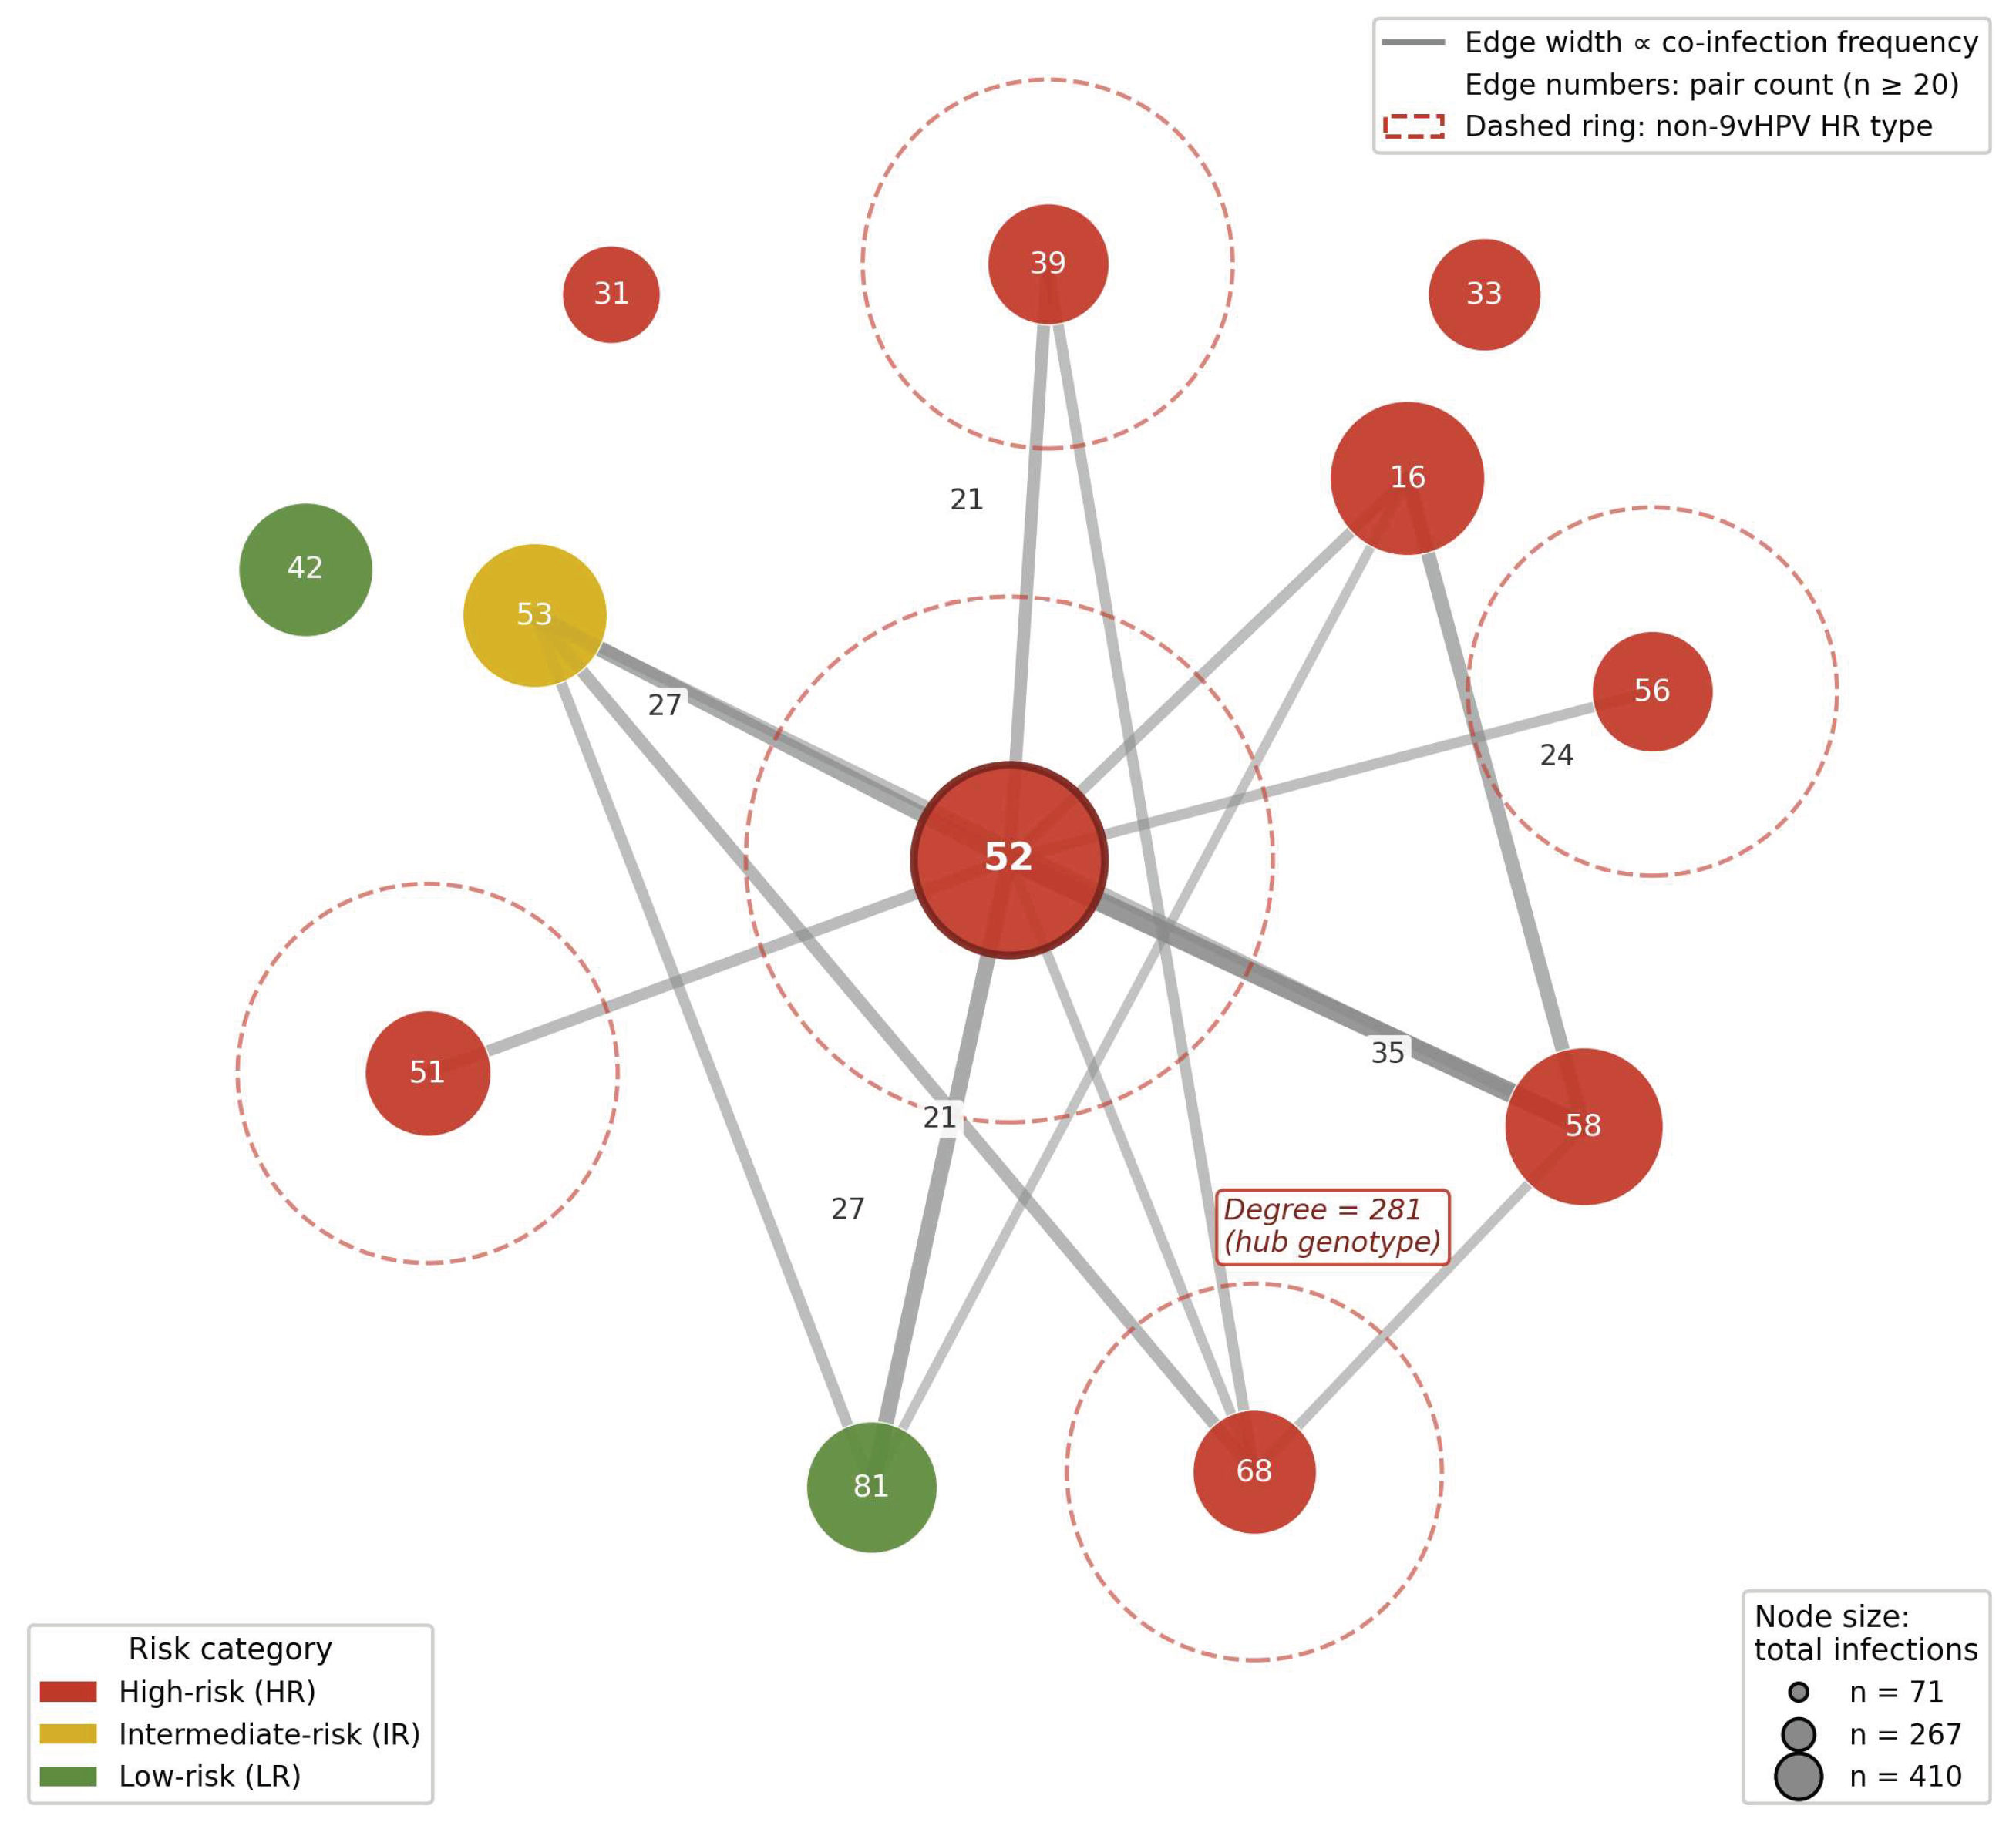

Table 1.
Distribution of 23 HPV genotypes ranked by prevalence (denominator n = 8,515; 95% CI by normal approximation).
Table 1.
Distribution of 23 HPV genotypes ranked by prevalence (denominator n = 8,515; 95% CI by normal approximation).
| HPV Type | Risk Category | n | Prevalence (%) | 95% CI (%) | 9vHPV | Notes |
| HPV52 | High-risk | 410 | 4.82 | 4.36–5.27 | No | |
| HPV58 | High-risk | 267 | 3.14 | 2.77–3.51 | Yes | 9v covered |
| HPV16 | High-risk | 252 | 2.96 | 2.60–3.32 | Yes | 2v/4v/9v covered |
| HPV53 | Inter-risk | 213 | 2.50 | 2.17–2.83 | No | IARC Group 2B |
| HPV42 | Low-risk | 177 | 2.08 | 1.78–2.38 | No | |
| HPV81 | Low-risk | 166 | 1.95 | 1.66–2.24 | No | |
| HPV51 ★ | High-risk | 150 | 1.76 | 1.48–2.04 | No | IARC Group 1; absent from all vaccines |
| HPV68 ★ | High-risk | 143 | 1.68 | 1.41–1.95 | No | IARC Group 2A; absent from all vaccines |
| HPV39 | High-risk | 136 | 1.60 | 1.33–1.86 | No | |
| HPV56 | High-risk | 135 | 1.59 | 1.32–1.85 | No | |
| HPV59 | High-risk | 113 | 1.33 | 1.08–1.57 | No | |
| HPV33 | High-risk | 111 | 1.30 | 1.06–1.54 | Yes | 9v covered |
| HPV66 | Inter-risk | 90 | 1.06 | 0.84–1.27 | No | |
| HPV6 | Low-risk | 76 | 0.89 | 0.69–1.09 | Yes | 4v/9v covered |
| HPV43 | Low-risk | 73 | 0.86 | 0.66–1.05 | No | |
| HPV31 | High-risk | 71 | 0.83 | 0.64–1.03 | Yes | 9v covered |
| HPV18 | High-risk | 63 | 0.74 | 0.56–0.92 | Yes | 2v/4v/9v covered |
| HPV35 | High-risk | 60 | 0.70 | 0.53–0.88 | No | |
| HPV11 | Low-risk | 32 | 0.38 | 0.25–0.51 | Yes | 4v/9v covered |
| HPV82 | Inter-risk | 24 | 0.28 | 0.17–0.39 | No | |
| HPV45 | High-risk | 19 | 0.22 | 0.12–0.32 | Yes | 9v covered |
| HPV73 | Inter-risk | 13 | 0.15 | 0.07–0.24 | No | |
| HPV26 | Inter-risk | 6 | 0.07 | 0.01–0.13 | No |
Inter-risk: intermediate-risk. ★ HPV51: IARC Group 1 (definite carcinogen); HPV68: IARC Group 2A (probable carcinogen)—both absent from all currently licensed HPV vaccines. 9vHPV: nonavalent vaccine covering HPV6/11/16/18/31/33/45/52/58; 4vHPV: quadrivalent; 2vHPV: bivalent.
Table 2.
Vaccine protection gap analysis across three licensed HPV formulations (denominator: 1,944 HPV-positive women).
Table 2.
Vaccine protection gap analysis across three licensed HPV formulations (denominator: 1,944 HPV-positive women).
| Vaccine | Target types (n) | APC [n (%)] | Mixed gap [n (%)] | CU [n (%)] | China approval |
| 2vHPV (bivalent) | HPV16, 18 (2) | 311 (16.0) | 1,633 (84.0) | 1,633 (84.0) | 2016 |
| 4vHPV (quadrivalent) | HPV6, 11, 16, 18 (4) | 400 (20.6) | 1,544 (79.4) | 1,544 (79.4) | 2017 |
| 9vHPV (nonavalent) | HPV6, 11, 16, 18, 31, 33, 45, 52, 58 (9) | 1,109 (57.0) | 1,174 (60.4) | 835 (43.0) | 2018 |
APC: at least partial coverage (≥1 positive type within vaccine targets). CU: complete unprotected (all positive types outside vaccine targets). Mixed gap: ≥1 positive type outside vaccine targets. For 2vHPV and 4vHPV, CU = mixed gap because all non-target types constitute a complete coverage absence in these narrow-spectrum formulations. 9vHPV: nonavalent; 4vHPV: quadrivalent; 2vHPV: bivalent.
Table 3.
Age-stratified HPV prevalence, high-risk infection, and multiple-type infection distribution.
Table 3.
Age-stratified HPV prevalence, high-risk infection, and multiple-type infection distribution.
| Age (years) | n |
HPV prevalence [n (%), 95% CI] |
HR-HPV [n (%)] |
Single [n (%)] |
Dual [n (%)] |
≥Triple [n (%)] |
9vHPV CU (%) |
| ≤20 † | 51 | 27 (52.94), 39.2–66.6% | 23 (45.10) | 12 (23.53) | 8 (15.69) | 7 (13.73) | 18.5 |
| 21–30 | 973 | 203 (20.86), 18.3–23.4% | 159 (16.34) | 125 (12.85) | 48 (4.93) | 30 (3.08) | 43.3 |
| 31–40 | 2,909 | 562 (19.32), 17.9–20.8% | 426 (14.64) | 437 (15.02) | 92 (3.16) | 33 (1.13) | 47.9 |
| 41–50 | 2,339 | 498 (21.29), 19.6–23.0% | 377 (16.12) | 377 (16.12) ‡ | 89 (3.81) | 32 (1.37) | 44.0 |
| 51–60 | 1,467 | 385 (26.24), 24.0–28.5% | 284 (19.36) | 255 (17.38) | 88 (6.00) | 42 (2.86) | 43.9 |
| ≥61 | 776 | 269 (34.66), 31.3–38.0% | 232 (29.90) | 153 (19.72) | 75 (9.66) | 41 (5.28) | 31.6 |
| Total | 8,515 | 1,944 (22.83), 21.9–23.8% | 1,501 (17.63) | 1,359 (15.96) | 400 (4.70) | 185 (2.17) | 43.0 |
95% CI by normal approximation. HR-HPV: high-risk HPV. 9vHPV CU: complete unprotected rate (all positive types absent from 9vHPV coverage). ≥Triple: triple through octuple infection. † ≤20-year group: n = 51 (0.60% of cohort), all clinical attendees; high 95% CI width reflects small n; results are exploratory and must not be extrapolated to the general adolescent population. ‡ In the 41–50-year group, the count for HR-HPV positives (377) coincidentally equals single-type infections (377); these are independent measures (single-type infections include 110 non-HR cases; HR positives include 110 multiple-type women).
Table 4.
Top three HPV genotypes by age group (prevalence within age-group denominator; high-risk types only).
Table 4.
Top three HPV genotypes by age group (prevalence within age-group denominator; high-risk types only).
| Age (years) | Rank 1 genotype (%) | Rank 2 (%) | Rank 3 (%) | Notable finding | n |
| ≤20 † | HPV52 (17.65) | HPV16 (15.69) | HPV18 (9.80) | Highest HPV16 prevalence across strata | 51 |
| 21–30 | HPV52 (5.55) | HPV16 (2.88) | HPV58 (2.36) | — | 973 |
| 31–40 | HPV52 (3.47) | HPV58 (2.68) | HPV16 (2.17) | — | 2,909 |
| 41–50 | HPV52 (3.98) | HPV58 (3.25) | HPV16 (2.95) | — | 2,339 |
| 51–60 | HPV52 (5.39) | HPV16 (2.93) | HPV58 (2.86) | — | 1,467 |
| ≥61 | HPV52 (9.54) | HPV58 (5.54) | HPV16 (5.28) | Rising prevalence with age | 776 |
HPV52 ranked first in all six age groups. † Exploratory, n = 51.
Table 5.
Co-infection network degree centrality for the six highest-degree genotypes (multiple-type infection group, n = 585 women; full 23-type panel).
Table 5.
Co-infection network degree centrality for the six highest-degree genotypes (multiple-type infection group, n = 585 women; full 23-type panel).
| Genotype | Degree (co-infection events) | Normalised degree | Direct co-infection partners (n) | Observed/expected ratio (top 5 pairs) |
| HPV52 | 281 | 0.0218 | 21 (all other types) | 6.5–14.8× |
| HPV58 | 212 | 0.0165 | — | — |
| HPV53 | 207 | 0.0161 | — | — |
| HPV81 | 181 | 0.0141 | — | — |
| HPV16 | 174 | 0.0135 | — | — |
| HPV68 | 156 | 0.0121 | — | — |
Degree: total number of co-infection events in which a genotype appeared across all multiple-infected patients. Normalised degree = degree / [(N − 1) × M], where N = 23 genotypes and M = 585 multiple-infected patients. Observed/expected ratios shown for HPV52's five most frequent co-infection pairs; expected values computed under independence assumption (see Methods 2.3). "—": O/E not computed for genotypes other than HPV52 in this table.
Table 6.
The 15 most frequent dual-type co-infection pairs with observed/expected ratios (multiple-type infection group, n = 585).
Table 6.
The 15 most frequent dual-type co-infection pairs with observed/expected ratios (multiple-type infection group, n = 585).
| Rank | Co-infection pair | Observed (n) | Expected (n) * | O/E ratio | HPV52 involved |
| 1 | HPV52 + HPV58 | 35 | 2.9 | 11.9× | Yes |
| 2 | HPV52 + HPV53 | 27 | 2.3 | 11.5× | Yes |
| 3 | HPV52 + HPV81 | 27 | 1.8 | 14.8× | Yes |
| 4 | HPV16 + HPV58 | 24 | — | — | No |
| 5 | HPV53 + HPV68 | 21 | — | — | No |
| 6 | HPV39 + HPV52 | 21 | 1.5 | 14.0× | Yes |
| 7 | HPV51 + HPV52 | 19 | — | — | Yes |
| 8 | HPV53 + HPV81 | 18 | — | — | No |
| 9 | HPV16 + HPV52 | 18 | 2.8 | 6.5× | Yes |
| 10 | HPV53 + HPV58 | 18 | — | — | No |
| 11 | HPV39 + HPV68 | 18 | — | — | No |
| 12 | HPV52 + HPV56 | 17 | — | — | Yes |
| 13 | HPV52 + HPV68 | 16 | — | — | Yes |
| 14 | HPV58 + HPV68 | 16 | — | — | No |
| 15 | HPV16 + HPV81 | 15 | — | — | No |
* Expected co-infection count under independence: E(A,B) = P(A) × P(B) × N_positive, where P(X) is the marginal prevalence of type X in the full cohort (n = 8,515) and N_positive = 1,944. O/E ratios shown only for HPV52-involving pairs with n ≥ 18. "—": O/E not computed for pairs with complex multi-way co-infection contexts or insufficient n.
Table 7.
HPV prevalence by clinical department (Pearson χ² test, reference: health examination centre).
Table 7.
HPV prevalence by clinical department (Pearson χ² test, reference: health examination centre).
| Department | Tested (n) | Positive (n) | Prevalence (%) | 95% CI (%) | χ² vs. Health Exam Centre |
| Cervical Specialty Clinic | 553 | 183 | 33.09 | 29.2–37.0 | P < 0.001 |
| Gynaecology OPD | 5,066 | 1,336 | 26.37 | 25.2–27.6 | P < 0.001 |
| Gynaecology (Inpatient) | 962 | 158 | 16.42 | 14.1–18.8 | P = 0.056 |
| Health Exam Centre | 1,732 | 236 | 13.63 | 12.0–15.2 | Reference |
| Preventive Health Clinic | 85 | 14 | 16.47 | 8.6–24.4 | P = 0.560 |
| Menopause Clinic | 32 | 2 | 6.25 | 0–14.7 | P = 0.343 |
Gynaecology OPD (n = 5,066) includes 99 records originally coded as department "1163" (verified as gynaecology OPD by HIS). Health Exam Centre (n = 1,732) includes 9 records coded as "internal medicine health examination". Menopause Clinic and Preventive Health Clinic: small cell counts; P-values are indicative only and should not be used for between-clinic comparisons. 95% CI: normal approximation.
Disclaimer/Publisher’s Note: The statements, opinions and data contained in all publications are solely those of the individual author(s) and contributor(s) and not of MDPI and/or the editor(s). MDPI and/or the editor(s) disclaim responsibility for any injury to people or property resulting from any ideas, methods, instructions or products referred to in the content. |
© 2026 by the authors. Licensee MDPI, Basel, Switzerland. This article is an open access article distributed under the terms and conditions of the Creative Commons Attribution (CC BY) license (http://creativecommons.org/licenses/by/4.0/).
Copyright: This open access article is published under a Creative Commons CC BY 4.0 license, which permit the free download, distribution, and reuse, provided that the author and preprint are cited in any reuse.


