
Submitted:
04 August 2026
Posted:
05 August 2026
You are already at the latest version
Abstract
Hereditary hemolytic anemias (HHAs) have quite similar clinical manifestations, complicating differential diagnosis and determining treatment, such as splenectomy. For the differential diagnosis of hereditary spherocytosis (HS), pyruvate kinase deficiency (PKD), and hereditary stomatocytosis (HSt), we proposed to measure erythrocyte filterability through membrane filters with a pore diameter of 3 or 3.5 μm. Our modified method provides improved reproducibility reducing the variation in results caused by differences in the filters used. The filterability of erythrocytes significantly differs in patients with HS, HSt and PKD (medians and 1.5 IQR were: 0.045 [0; 0.51] (n=88); 0.685 [0.46; 0.79] (n=12) and 0.75 [0.55; 0.86] (n=28) rel. un., respectively). The specificity of the filterability test for HS diagnosis was 100%, comparable to the best available tests, while its sensitivity (85.2%) was somewhat lower than that of some alternative methods. Only the filterability test could identify a second subgroup in HS patients (14.8%) with higher filterability (close to normal), but their HS diagnosis was confirmed by the decreased filterability by 3-µm pore filter. This subgroup requires further detailed study. The proposed filterability measurement method is promising for diagnosing HS. It has high sensitivity and specificity and can be performed quickly without expensive equipment.
Keywords:
red blood cell
; hereditary hemolytic anemia
; differential diagnosis
; hereditary spherocytosis
; hereditary stomatocytosis
; pyruvate kinase deficiency
; filterability of erythrocytes
; EMA test
; osmotic resistance of erythrocytes
; sphericity index
1. Introduction
Anemia is a condition that reduces the oxygen-carrying capacity of the blood due to a decrease in hemoglobin concentration and/or a decrease in the number of red blood cells (erythrocytes, RBCs), which, in turn, can cause hypoxia and hypoxemia. One of the main mechanisms of anemia — hemolytic anemia (HA) — is associated with accelerated destruction and, consequently, a shortened lifespan of RBCs in the bloodstream.
Hereditary hemolytic anemias (HHAs) can have various causes related to abnormalities in erythrocyte enzymes, membranes, or hemoglobin structure [1,2,3]. These causes vary, but the clinical signs of hemolytic anemia, which can occur in the presence of these disorders, are often very similar. Typically, these include hemolysis of RBCs, a decrease in their number, a decrease in the concentration of hemoglobin in the blood (to <110 g/L of blood), jaundice, an increase in the number of reticulocytes, splenomegaly, the development of cholelithiasis, an increase in the concentration of unconjugated bilirubin in the serum, and decreased levels of haptoglobin, lactate, and pyruvate [4].
To perform their physiological function (transport of gases), erythrocytes must circulate in the bloodstream for a long time, reaching all tissues, including repeatedly passing through narrow capillaries and splenic sinuses, the diameter of which is two to three times smaller than the diameter of erythrocytes. This is ensured by the unique flexibility and deformability of RBCs, which is a function of the structure of cytoskeletal proteins and depends on maintaining erythrocyte volume and the ratio of membrane surface area to cell volume. Inability to deform leads to a shortened RBC lifespan and, consequently, to hemolytic anemia [5,6]. First of all, erythrocyte deformability affects blood microrheology rather than macrorheology, since in narrow capillaries, the forces acting on erythrocytes (shear stress) can be 10-100 times greater than those acting on them in large vessels [7]. Currently, various methods are used to determine erythrocyte deformability. A detailed description of these methods can be found in reviews [5,8,9,10,11]. However almost all these methods, are not suitable for routine diagnostics of erythrocyte capability to pass through narrow capillaries. Some methods measure the deformation of erythrocytes (their deviation from the discoid shape) when a cell suspension flows in a high-density medium through a channel whose diameter is greater than the diameter of the erythrocyte. This approach allows us to determine only the average parameters of deformability in the entire population of RBCs, but is unable to identify a small proportion of cells (~0.1-1% of their total number) with reduced deformability, although these cells can seriously affect the microrheology of blood in the body. Such methods include ektacytometry (in different versions) [12,13,14,15] or real-time deformability cytometry [16], when images of RBCs flowing through a flowcytometer chamber taken under a microscope with a very high-speed camera are analyzed. Other methods (erythrocyte aspiration into a microcapillary [17], atomic force microscopy [18,19], optical tweezers [20,21,22], etc.) are not suitable for routine diagnostics, because they work with single cells, and, therefore, in order to reliably identify a small proportion of poorly deformable cells using such methods, it is necessary to process 50-70 thousand individual cells, which is very time-consuming and labor-intensive. Thus, to improve the diagnosis of the hemolytic anemia causes, it is necessary to have a method that allows us to determine the ability of RBCs to deform and pass through narrow capillaries, since it is this ability that determines the microrheology of the blood.
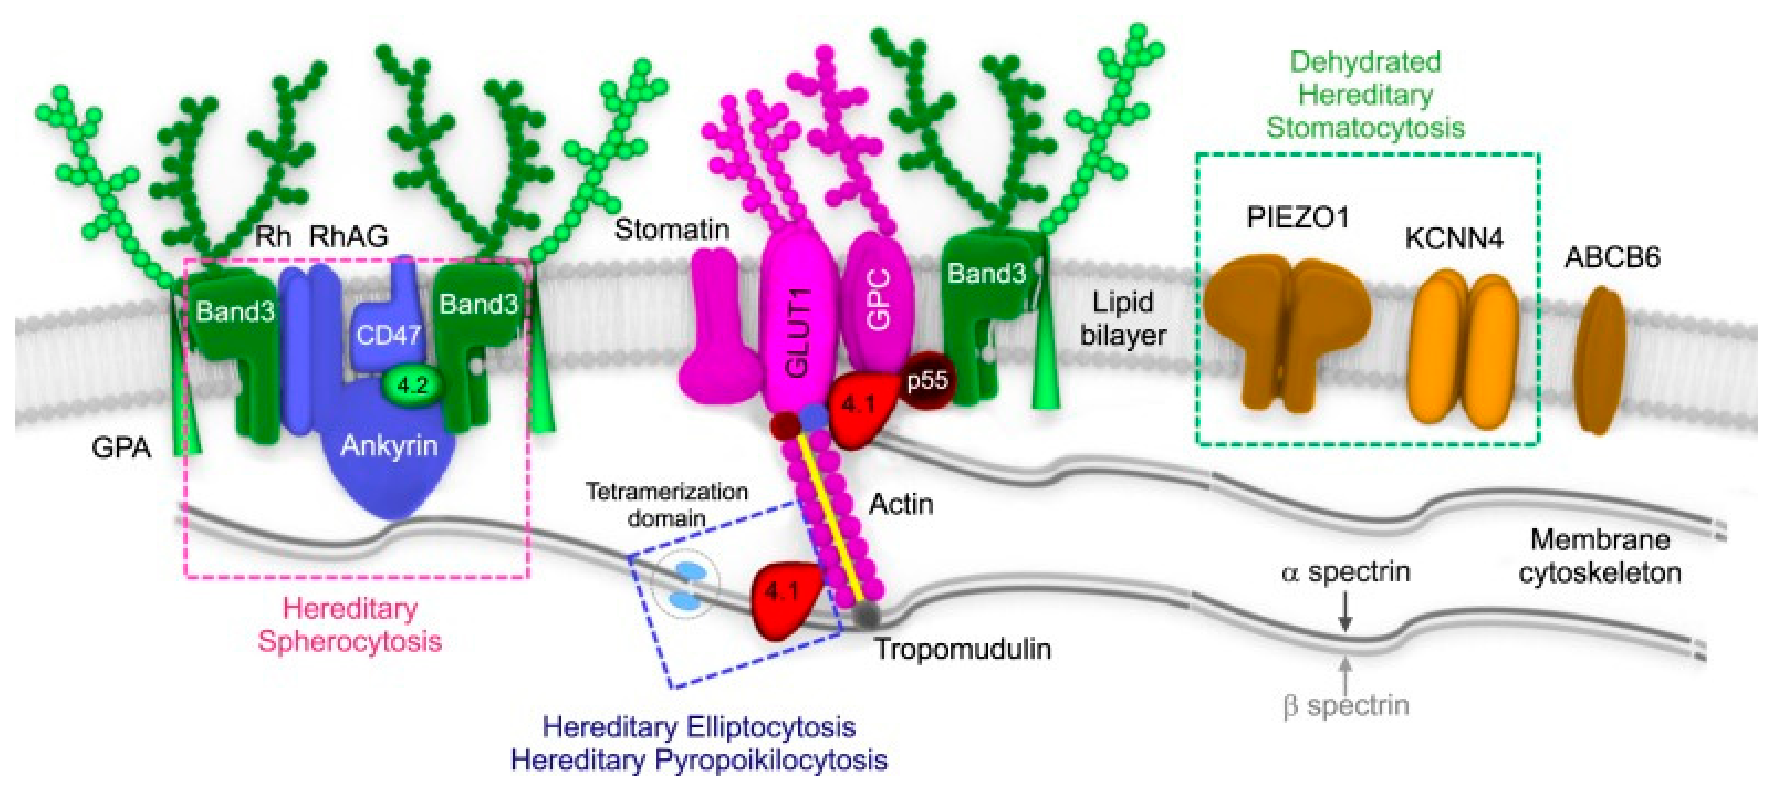
To diagnose HHAs, in addition to family history and the Coombs test, laboratory tests such as the study of osmotic resistance of erythrocytes (RBCOR), the test of eosin-5′-maleimide binding to erythrocytes (EMA test) and the measurement of erythrocyte indices (mean corpuscular hemoglobin concentration (MCHC), mean corpuscular volume (MCV), sphericity index (SphI)) are used. The most suitable method to characterize the ability of erythrocytes to pass through narrow capillaries, is measuring the filterability of erythrocytes through artificial membrane filters with a pore diameter of 3 to 5 μm. However, this method has never been used for diagnosing HHAs, as the versions of this method described in the literature have poor reproducibility (due to clogging of the filter pores by leukocytes or platelet aggregates when working with whole blood, as well as due to heterogeneity in the filters used) [23,24,25]. This study, for the first time, proposes using a modified method for measuring RBC filterability through artificial membrane filters with a pore diameter of 3.5 and 3.0 μm for the differential diagnosis of hereditary spherocytosis (HS), hereditary stomatocytosis (HSt) and pyruvate kinase deficiency (PKD). The mechanisms underlying anemia in these pathologies vary. While erythrocyte metabolism and energy balance are disrupted in PKD due to decreased activity of the glycolytic enzyme pyruvate kinase, in HS and HSt anemias are caused by genetic mutations that cause a qualitative or quantitative deficiency of certain membrane proteins (Figure 1).
In HS, interactions between proteins that bind the cytoskeleton of the erythrocyte inner membrane and its outer lipid bilayer (proteins of complexes that determine vertical interactions in the membrane) are disrupted [1]. Stomatocytoses are disorders of erythrocyte hydration. They constitute a heterogeneous group of disorders associated with disturbances in the water-salt balance of erythrocytes due to changes in membrane permeability for potassium and sodium ions, leading to changes in erythrocyte volume [26,27,28].
Figure 1.
Schematic representation of proteins (separate ion channel proteins (PIEZO1 and KCNN4) or complexes of erythrocyte membrane cytoskeleton proteins), that are responsible for the development of various erythrocyte membranopathies. The abbreviations used: GPA, GPC – glycophorin A and C, respectively; Band 3 –band 3 protein, Rh –rhesus factor protein, RhAG –Rh factor-associated glycoprotein; 4.1 – protein 4.1R; GLUT1 - glucose transporter; 4.2 - protein 4.2; CD47 – cellular determinants 47; p.55 - protein 55; PIEZO1 is a mechanosensitive channel that forms a pore in the membrane through which ions, ATP, other small molecules, and water can be transported; KCNN4 is a Ca2+-activated potassium channel (Gardos channel). The dotted frames indicate protein complexes, disturbances in which cause certain types of diseases. Reproduced from [29] under CC BY-NC 4.0 license.
Figure 1.
Schematic representation of proteins (separate ion channel proteins (PIEZO1 and KCNN4) or complexes of erythrocyte membrane cytoskeleton proteins), that are responsible for the development of various erythrocyte membranopathies. The abbreviations used: GPA, GPC – glycophorin A and C, respectively; Band 3 –band 3 protein, Rh –rhesus factor protein, RhAG –Rh factor-associated glycoprotein; 4.1 – protein 4.1R; GLUT1 - glucose transporter; 4.2 - protein 4.2; CD47 – cellular determinants 47; p.55 - protein 55; PIEZO1 is a mechanosensitive channel that forms a pore in the membrane through which ions, ATP, other small molecules, and water can be transported; KCNN4 is a Ca2+-activated potassium channel (Gardos channel). The dotted frames indicate protein complexes, disturbances in which cause certain types of diseases. Reproduced from [29] under CC BY-NC 4.0 license.
Any membrane abnormalities are accompanied by a decrease in the erythrocytes ability to deform at passing through microcapillaries. Such erythrocytes are sequestered by the spleen, leading to anemia. For diagnosing HHAs we proposed a modified method for measuring erythrocyte filterability. The sensitivity of this method was increased by using a suspension of washed RBCs rather than whole blood, and by reducing the scatter of results arising from the imperfections of the filters used. To do this, we determined the filterability of each suspension as the ratio of the time it takes for the buffer to flow through the filter to the time it takes for an equal volume of erythrocyte suspension to flow through the same filter. This approach demonstrated that RBCs filterability decreases most significantly relative to the filterability of RBCs from healthy donors in spherocytosis, less significantly in HSt, and remains virtually unchanged in PKD.
The obtained results showed that the erythrocyte filterability test is sufficiently specific and sensitive in diagnosing HS. The greatest reduction in filterability was observed in patients with HS. However, patients with relatively high filterability were also identified in this group. We believe that the presence of high filterability rates in patients suspected of having HS may require a more thorough their evaluation to establish an accurate diagnosis. To increase the sensitivity of the test, we proposed measuring the erythrocyte filterability of these patients using filters with a smaller pore diameter (3.0 µm). Under these conditions, the results of all the patients tested, who had near-normal filterability on filters with a pore diameter of 3.5 µm, were below the normal range, confirming the diagnosis of HS.
The proposed method is very simple, does not require expensive equipment, and can be easily performed in any laboratory. All this makes this test promising for diagnosing HS.
2. Results
2.1. Comparison of Different Tests Used to Diagnose HHAs
The aim of this study was to compare the erythrocyte filterability test with other diagnostic methods for HS and to evaluate its specificity and sensitivity.
The values of erythrocyte filterability (filters with pore diameter 3.5 µm), the EMA test, the osmotic resistance of erythrocytes (RBCOR), which is characterized by concentration of NaCl (in %) causing 50% lysis of RBCs after 24 hours of incubation at 37°C (H50a) and the sphericity index values obtained in patients with HS, HSt, and PKD are presented in Figure 2. All parameters measured in each patient group are presented in Table S1 in the Supplementary Materials (SMs). The calculated medians and ranges (1.5 Interquartile Range (1.5 IQR)) of values for each test in all groups are presented in Table 1.
As shown in our previous work [30], patients with HS typically had low filterability values, but with increasing the number of samples tested, it becomes apparent that within the HS group, patients can be divided into subgroups with very low (in the range of 0–0.42 relative units) and higher filterability (Figure 2B). In this study, the proportion of patients with higher filterability was 14.8%. The filterability cut-off value for this division (red dotted line) was obtained by calculating the receiver operating characteristic curve (ROC curve) for HS and was 0.42 (see below). None of the other tests demonstrate the emergence of a second subgroup of patients with different result values.
Figure 2 shows that, despite this, the method of measuring RBCs filterability reliably distinguishes the HS group from the other groups studied. The reasons for dividing these patients into subgroups remain unclear. Since the entire group of patients with HS is analyzed as a single entity, such separation will undoubtedly reduce the sensitivity of the filtering method for diagnosing HS, calculated using the ROC curve. All methods reliably distinguish HS from HSt or PKD, but none of them reliably distinguishes between HSt and PKD. When using the filtering method, all patient groups differ significantly from the control group. Filterability values for control groups using different filters and hematocrit (Ht) are presented in Figure S1 in the SMs.
2.2. Filterability Measurement Using Filters with Pore Diameter 3 µm
The results of the study of erythrocyte filterability in patients with different HHAs, carried out on filters with a pore diameter of 3 μm, are presented in Figure 3 and in Table S3 in the SMs. They showed that all patients with genetically confirmed HS and high filterability on 3.5-μm filters had a significant reduction in filterability compared to the normal value using 3-μm filters. Thus, the reduction in filter pore size (and hematocrit) allowed us to confirm the diagnosis of HS even in these patients. However, the obtained results cannot yet be considered definitive due to the small sample size of experimental samples for these filters. Further studies are needed to confirm their use in detecting HS.
2.3. Sensitivity and Specificity of Different Methods for Diagnosing HS
To assess the sensitivity and specificity of different methods in diagnosing HS, the corresponding ROC-curves were constructed for methods of measurement of RBCs filterability (at pore diameter of 3.5 µm and Ht 1%), EMA test, RBCOR method, and measuring erythrocyte sphericity index (Figure 4). The values of sensitivity and specificity obtained for each of the studied methods are shown in Table 2.
2.4. Comparison of Areas Under the ROC Curves Obtained in the Diagnosis of HS by Different Methods
The ROC curve for the filterability measurement method had a slightly lower AUC value, but, like more part of methods, it had 100% specificity for diagnosing HS. For a more accurate comparison of AUC values for all methods, the De Long method was used [31]. The results obtained are presented in Table 3.
The data in Table 3 show that differences in the areas under the ROC curves were significant only for the comparison of the filterability measurement method with other methods. However, the level of this significance was not very high (p < 0.05). It is possible that the significance of the differences in these cases was due to the fairly high power of the analysis (n = 74, 92, or 102 pairs) and not due to a true clinically significant difference in these areas. This is because with a very large sample size, even extremely small differences can produce a small p value, despite the practical (clinical) insignificance of the difference. In addition, as mentioned above, the measured differences in AUCs are influenced by the presence of a second subgroup with higher filterability in the filterability data for patients with spherocytosis.
2.5. Comparison of the Sensitivity of Different Methods for the Diagnosis of HS in Patients with Different Mutations of Membrane Proteins
The composition of the spherocytosis patient population in our study differed significantly from those previously published in some studies [32,33]. In particular, in our population of patients with HS, there were few patients with mutations in the band 3 protein (gene SLC4A1) and α-spectrin (gene SPTBA1), but almost half were patients with mutations in the gene ANK1. Among the 92 patients, 44 had a mutation in the SPTB gene (47.8%), 43 had a mutation in the ANK1 gene (46.7%), and only 5 had other mutations (3 mutations in the SLC4A1 gene (3.3%) and 2 in the SPTA1 gene (2.2%). This allowed us to compare the relative sensitivity of studied methods for detecting spherocytosis caused by mutations in the SPTB and ANK1 genes encoding different erythrocyte membrane proteins. Figure 5 presents the results obtained. Comparisons between paired groups were performed using the Mann-Whitney U test. The results are also presented in Table 4.
It can be seen that all the tests studied are highly sensitive to HS. However, only the RBC filterability test and the EMA test reliably differentiated patients with mutations in the SPTB or ANK1 gene. Moreover, the EMA test was found to be superior for the SPBT gene mutations (100% of such patients were identified by this test as having HS versus 89.3% of patients with a mutation in the ANK1 gene). Vice versa, the filterability test was superior for the ANK1 mutation (the disease was confirmed in 87.8% of such patients versus 84.1% in the case of SPTB mutation). This means that the RBC filterability test may detect some patients with HS who would not be detected by the EMA test.
2.6. Preliminary Analysis of the Possible Relationship Between the Number of Microcytes Detected in Peripheral Blood Smears of Patients with HS and the Value of Erythrocyte Filterability in These Patients
Peripheral blood smear data from 31 patients were analyzed, and the percentage of microdiscocytes, microechinocytes, microstomatocytes, microelliptocytes, and microspherocytes in the blood was calculated (Figure 6). Additionally, the dependence of erythrocyte filterability on the total number of microcytes in the suspension minus microdiscocytes was plotted (Figure 6F).
Different types of microcytes influenced filterability to varying degrees. Thus, an increase in the number of microdiscocytes increased filterability, indicating that these cells have a high deformability, whereas microechinocytes, microstomatocytes, and microspherocytes decreased it. The presence of microelliptocytes had virtually no effect on filterability (see Figure 6 and Table S5 in the SMs).
3. Discussion
Hereditary spherocytosis is the most common cause of congenital hemolytic anemia. It is diagnosed with a frequency of 1 in 2,000–5,000 individuals, although a significant number of asymptomatic cases may remain unrecognized [34,35]. The cause of anemia in HS is a shortened lifespan of red blood cells in the bloodstream due to decreased deformability. Qualitative or quantitative deficiencies of membrane proteins caused by genetic mutations disrupt the connection between the inner cytoskeleton of the erythrocyte’s membrane and its outer lipid bilayer. This is accompanied by a decrease in the ability of the RBC to deform, progressive loss of membrane area as RBCs pass through microvessels and narrow slits of venous sinuses in the spleen (a decrease in the cell surface area to volume ratio), and cell sequestration by the spleen, leading to a shortened RBCs lifespan and anemia.
Molecular defects leading to HS are highly heterogeneous. These include mutations in genes encoding erythrocyte membrane proteins such as ankyrin, spectrins α and β, band 3 protein, and protein 4.2. Because the ratio of these mutations may vary in different populations, information about these ratios in the literature is contradictory. In work [35], the author writes that the most common causes of HS are band 3 protein deficiency (54%) and spectrin deficiencies (31%), however, in our work, the main proportion of mutations in patients with confirmed HS were mutations in spectrin β and ankyrin, encoded by the SPTB (47.8%) and ANK1 (44.6%) genes.
No one laboratory diagnostic method can detect all cases of HS, so many laboratories use several tests simultaneously. Most often, this is the EMA test and some version of RBCOR measurement [32,36]. The diagnosis is considered established if the patient has a Coombs-negative hemolytic anemia, a reduced EMA test value, reduced osmotic resistance of RBCs, a reduced sphericity index, and an increased mean corpuscular hemoglobin concentration (MCHC). Differential diagnosis of HS is a complex task due to the similarity of clinical and laboratory manifestations in patients with this disease and other forms of HHAs (erythrocyte pyruvate kinase deficiency, dyserythropoietic anemia type II, hereditary stomatocytosis etc.), as well as because of the low availability of molecular genetic testing [36,37].
Although RBCOR and EMA test are the main methods in the diagnosis of HS, they have limitations. RBCOR is not highly specific for HS, as false negative values can be obtained in 10–20% of HS cases [38,39]. In the work of Y.J. Shim et al. [40], the sensitivity and specificity of RBCOR in the diagnosis of HS were 66% and 81.8%, respectively. However, it has been shown that the RBCOR test using flow cytometry (FCMOF) can increase the sensitivity and specificity to 91.3% and 95.8%, respectively [40]. The RBCOR test also does not differentiate HS from other conditions accompanied by the appearance of spherocytes in the peripheral blood, in particular from autoimmune hemolytic anemia [36,38].
Unlike RBCOR, the EMA test demonstrates higher sensitivity and specificity. The method involves binding the fluorescent dye eosin-5-maleimide (EMA) to the band 3 protein. The N-terminal region of band 3 protein interacts with ankyrin and protein 4.2, which in turn binds to the spectrin cytoskeleton, providing additional stability to the erythrocyte membrane. The absence or decreased expression of any of these erythrocyte membrane proteins leads to disruption of the cell’s cytoskeleton stability and a decrease in an amount of band 3 protein on the erythrocyte membrane surface. As a result, the binding of EMA to the band 3 protein decreases, and, accordingly, the measured fluorescence decreases. The data presented by M. King et al. [36,41] indicate high sensitivity (92.7%) and specificity (99.1%) of the method, which allows the authors to recommend it as the primary method for diagnosing HS. Significant limitations of this method include the need for a flow cytometer, which is not always available in diagnostic laboratories, the high cost of the EMA dye used, and the lack of standard reference values due to the wide range of fluorescence scales on different flow cytometer models.
All methods studied in this work had a high sensitivity and specificity in diagnosing HS. The highest sensitivity demonstrated the sphericity index (97.5%); however, it had the lowest specificity among the methods studied (88.9%). The remaining methods had a specificity of 100% (at the threshold values chosen in the work) and a sensitivity of 85.2, 93.0 and 94.5% for the erythrocyte filtration method, the EMA test and the RBCOR measurement method, respectively. All methods had high areas under the ROC curve (when compared across all data collected). When comparing these areas with the De Long method, a significant decrease was observed only for the erythrocyte filterability method. This could be due to both the very large number of samples analyzed when even very minor differences may be formally, but not clinically significant, and the fact that the erythrocyte filterability method distinguishes two subgroups within the group of patients with spherocytosis (Figure 2B).
Apparently, it is this second circumstance that is the main reason for the decrease in AUC for this method. The observed separation of patients in the HS group cannot be explained by poor reproducibility of the method, since a recent study [30] showed that the method has excellent repeatability (the relative error in repeated measurements is 2.79%) [42]. When measuring red blood cell filterability in donor groups (using different filters), as well as in groups of patients with HSt and PKD, no significant scatter in measurement results was observed (Figure 2B and Figure S1 in the SMs). All this suggests that the method does, in fact, identify a group of patients who, for some reason, differ from the rest of the population of patients with spherocytosis. The reasons for this distinction are not yet fully understood.
Further studies of these subgroups are needed to determine the exact cause of these differences. The proportion of such patients in our work was 14.8%. We attempted to analyze other available parameters for patients with HS but with different RBC filterability, but so far we have not been able to identify any clear patterns. Based on most of the results from other analyses, they are similar to those observed in the general population of patients with HS (Figure 2). Additional data on blood hemoglobin concentrations and total and unconjugated bilirubin levels also did not provide a clear and unambiguous explanation (see Figure S2 and Table S4 in the SMs). However they did reveal a trend that could be interpreted as a more severe condition in patients with poor RBCs filterability (they have lower hemoglobin levels but higher levels of both total and unconjugated bilirubin).
The next step in studying different subgroups of patients with spherocytosis was to examine the results of peripheral blood smears. We hypothesized that the presence of all types of microcytes (except microdiscocytes, which, although reduced in size, retain the ability to deform due to their discoid shape) could impair the measured mean RBCs filterability. Therefore, we plotted the dependencies of RBC suspension filterability on the amount of each microcyte type (see Figure 6).
It turned out that all the obtained dependencies can be approximated by a linear function (but with a large scatter of results at very low filterability (F<0.1 rel. un.), where filterability is apparently determined not only by the presence of microcytes, but also by other mechanisms). Moreover, the more microdiscocytes a patient had, the higher the ability of his RBCs to be filtered, which confirms that microdiscocytes have good deformability. Increasing the number of other microcytes reduced filterability to varying degrees. Microspherocytes had the greatest impact on filterability. They accounted for almost 90% of the overall reduction in filterability mediated by the presence of microcytes. Taking all this into account, we obtained a good correlation between the measured value of erythrocyte filterability and the number of microcytes in the patient’s smear when we plotted filterability against the total number of microcytes minus microdiscocytes (Figure 6F). Thus, it can be concluded that the more microdiscocytes a patient has, the higher the ability of his RBCs to filtering. However, what influences the ratio of different microcyte types remains unclear. We believe that HS patients with elevated RBC filterability have some as-yet-unknown mechanisms that improve this filterability. However, the number of such cases is small. Therefore, if a patient is suspected of having HS but his RBC filterability is quite high, a detailed examination is necessary for a more accurate diagnosis.
The lack of an explanation for the occurrence of a subgroup with high filterability in patients with confirmed spherocytosis is a limitation of our study. The characteristics of this subgroup require further investigation. Furthermore, the lack of data on red blood cell filterability in other types of hemolytic anemia also is a limitation. Additionally, the cut-off value used to calculate sensitivity and specificity was derived from ROC analysis of the same dataset used to estimate these parameters; therefore, the reported accuracy estimates may be subject to optimism bias. Validation of this cut-off in an independent patient cohort is warranted. These aspects should be the subject of further research.
4. Materials and Methods
4.1. Patients and Donors
The study involved 152 patients from the Dmitry Rogachev National Medical Research Center of Pediatric Hematology, Oncology, and Immunology (Ministry of Healthcare of the Russian Federation, Moscow), who were diagnosed with hereditary hemolytic anemia in accordance with current clinical guidelines. RBC filterability was studied in 132 patients using 3.5 μm filters, and in 20 patients using 3.0 μm filters. To determine normal ranges of RBC filterability, 70 healthy donors were studied (47 using 3.5 μm filters and 23 using 3.0 μm filters) (Table 5). None of the patients had splenectomy and received a transfusion of donor RBCs for more than 3 months prior to the study. For all patients, molecular genetic testing results were subsequently obtained (Table S1 in SMs).
All patients were divided into groups according to the results of genetic analysis. In the main part of the study, which included 132 patients (in whom RBC filterability was measured on 3.5 μm filters), the HS group included 92 patients, the HSt group included 12 patients, and the PKD group included 28 patients. Basic data of the patients included in the study are presented in Table 5, and the test results obtained for each patient are presented in Table S1 in the SMs. Among the patients there were siblings (in the PKD group these are patients: 9, 10 and 15, 16; in the HSt group: 32, 33; in the HS group: 60, 61 and 69, 70, 71).
The remaining 20 patients were involved to test filters with a 3-μm pore diameter. These data are also presented in Table 5.
4.2. Materials
All reagents for buffer preparation were purchased from Sigma-Aldrich (St. Louis, MO, USA). Polyethylene terephthalate membrane filters with cylindrical pores (3.5 μm diameter and 10 μm length, and 3.0 μm diameter and 7 μm length) were provided by the Joint Institute for Nuclear Research (Dubna, Moscow region, Russia).
4.3. Standard Tests for Differential Diagnosis of HHAs
Diagnosis of patients was based on family history, the negative Coombs test and standard diagnostic tests for HHAs. These tests included a complete blood count (CBC), determination of red blood cell indices (MCV – mean corpuscular volume, MCHC – mean corpuscular hemoglobin concentration), reticulocyte and normoblast counts, measurement of RBCs osmotic resistance, an analysis of EMA (eosin-5’-maleimide) binding to the RBC membrane, erythrocytometry with calculation of the sphericity index, and analysis of a peripheral blood smear. Hemoglobin, total bilirubin, and indirect bilirubin concentrations were also measured. In addition, RBCs filterability was measured in patients and donors. All standard laboratory diagnostic tests were carried out in the clinical diagnostic laboratory of the Dmitry Rogachev Center by standard methods with standard sets of reagents used in the hospital [38,39,43,44]. The measurement of erythrocyte filterability was carried out in the Center’s laboratory of Biophysics using the described method [45].
4.4. Preparation of Blood Samples for Filterability Measurement
Blood from all patients and donors was collected in 2.6 ml vacuum tubes (S-monovette, Sarstedt, Germany) containing K3EDTA as an anticoagulant. To isolate erythrocytes, blood was centrifuged at 1000 g for 8 min. The supernatant plasma layer together with the buffy coat was removed. The erythrocytes were washed twice by centrifugation at 1000 g for 8 min with a fourfold volume of phosphate-buffered saline (PBS), and then with Tyrode’s solution (135 mM NaCl, 4 mM KCl, 0.33 mM NaH2PO4, 1 mM MgCl2, 11 mM glucose, 2.5 mM CaCl2, 10 mM HEPES and 1 mg/ml bovine serum albumin, pH 7.4). Washed erythrocytes were sequentially resuspended in the same solution to a hematocrit of 1% (with an accuracy of 1 ± 0.05%) and used to measure filterability.
4.5. Measurement of Erythrocyte Filterability
The determination of erythrocyte filterability was carried out in accordance with the previously described method [45] using the IDA-01 filterometer patented by us [46,47] (Figure 7). Using the IDA-0 1 instrument, the flow time through the same filter was measured, first for 250 µl of buffer (tb), then for 250 µl of a 1% (or 0.1%) suspension of the erythrocytes being studied (ts). Filterability (F) was calculated in relative units as the ratio tb/ts.
To minimize the risk of test-review bias, erythrocyte filterability measurements were performed and recorded before the results of molecular genetic testing became available; laboratory personnel conducting the filterability assay were therefore unaware of the patients’ genetic diagnosis at the time of testing [48].
4.6. Routine Hematological Indices
Routine hematological indices were measured using XN Series analyzers from Sysmex (Hyogo, Japan).
4.7. Genetic Analysis
Genetic analysis was performed using the Hemolytic Anemia panel or using whole-genome high-throughput DNA sequencing (NGS). The enriched DNA library was sequenced through the Illumina NextSeq platform (San Diego, CA, USA).
4.8. Determination of Pyruvate Kinase Activity
The activity of pyruvate kinase in the diagnosis of its deficiency was determined by the spectrophotometric method of E. Beutler [49], based on the rate of decrease in the optical density of NADH in the coupled biochemial reactions of pyruvate kinase and lactate dehydrogenase.
4.9. Data Analysis
Statistical analyses and data visualization were performed using Python 3.12.3 with the following libraries: SciPy 1.17.1, NumPy 2.4.4, Matplotlib 3.10.8, scikit-learn 1.8.0, and pandas 3.0.2. The mean values for each of the biochemical and hematological parameters presented in Table 1 were estimated as the median and 1.5 Interquartile Range (IQR). The significance of the difference between three groups of patients was assessed using the Kruskal–Wallis H-test and post-hoc Dunn’s test with Bonferroni correction. The Mann-Whitney U test was used to compare two groups of patients with spherocytosis and mutations in the SPTB or ANK 1 genes. The differences were considered significant at p < 0.05. Differences in areas under the ROC curves (AUC) were calculated using the De Long’s method [31]. Confidence intervals (95% CI) for ROC curves were obtained using the bootstrap method with 10 thousand iterations.
5. Conclusions
The RBC filterability test demonstrated relatively high sensitivity and specificity in the differential diagnosis of HS from other HHAs, primarily PKD. This simple and accessible method for measuring RBC filterability can be easily implemented in any laboratory and represents a reliable alternative to the expensive and not always available EMA test. Further research is needed on the identified subgroup of patients with HS, which differs from the main group in terms of RBC filterability, to characterize this subgroup for a more accurate diagnosis.
Supplementary Materials
The following supporting information can be downloaded at the website of this paper posted on Preprints.org, Figure S1: Determination of normal ranges of erythrocyte filterability under various experimental conditions. Figure S2: Comparison of hemoglobin, total bilirubin, and indirect bilirubin levels in two groups of patients with HS and different filterability. Table S1: Parameters of all tests measured in patients divided into groups according to molecular genetic analysis data. Table S2: Reference range values for erythrocyte filterability in different experimental conditions. Table S3: Erythrocyte filterability in patients with PKD, HSt and HS, measured using 3.0 μm pore diameter and 7 μm pore length filters. Table S4: Levels of hemoglobin, total and indirect bilirubin in the blood of patients with hereditary spherocytosis with different erythrocyte filterability. Table S5: Pearson’s coefficients and slope angles for linear approximations of the dependencies of erythrocyte filterability in patients with HS on the content of different types of microcytes in their blood.
Author Contributions
E.I.S., F.I.A and N.S.S developed the concept and design of this study. D.S.P. and E.A.B. developed the methodology. D.S.P., E.A.B., L.K., I.A.D., N.S.K., A.S.S. and S.S.S. acquired the data. E.I.S., F.I.A., D.S.P., E.A.B., I.A.D., N.S.K, A.S.S., L.K. and S.S.S. analyzed and interpreted the data. E.A.Br., I.A.C., S.G.K., S.A.P and N.S.S. provided the patient data. E.I.S. wrote the manuscript; E.I.S., D.S.P., L.K., and E.A.B. reviewed and/or revised the manuscript. All authors have read and agreed to the published version of the manuscript.
Funding
This research was funded by the Russian Science Foundation (grant number 25-25-00998).
Institutional Review Board Statement
The study was conducted according to the guidelines of the Declaration of Helsinki and approved by the Independent Ethical Committee of Dmitriy Rogachev National Medical Research Center of Pediatric Hematology, Oncology, and Immunology, Ministry of Healthcare of Russia, Moscow (Permit Number: 1/6-2024 from 20 February 2024).
Informed Consent Statement
Informed written consent was obtained from all subjects involved in the study or their authorized representatives.
Data Availability Statement
All the data obtained or analyzed during this study are included in the published article and Supplementary Materials. Further inquiries can be directed to the corresponding authors.
Acknowledgments
The authors sincerely thank the patients who participated in this study. This article is dedicated to the memory of our teacher and friend, Academician of the Russian Academy of Sciences Fazoil I. Ataullakhanov, who passed away on 24 March 2026.
Conflicts of Interest
The authors declare no conflicts of interest.
References
- Gallagher, P.G. Red Blood Cell Membrane Disorders. In “Hematology: Basic Principles and Practice”, 7th ed.; Hoffman, R., Benz, E.J., Silberstein, L.E., Heslop, H.E., Weitz, J.I., Anastasi, J., Salama, M.E., Abutalib, A.A., Eds.; Elsevier, 2018; pp. 626–647. [Google Scholar] [CrossRef]
- Gallagher, P.G. Diagnosis and management of rare congenital nonimmune hemolytic disease. Hematol. Am. Soc. Hematol. Educ. Program 2015, 2015, 392–399. [Google Scholar] [CrossRef] [PubMed]
- Al-Samkari, H.; Shehata, N.; Lang-Robertson, K.; Bianchi, P.; Glenthøj, A.; Sheth, S.; Neufeld, E.J.; Rees, D.C.; Chonat, S.; Kuo, K.H.M.; Rothman, J.A.; Barcellini, W.; van Beers, E.J.; Pospíšilová, D.; Shah, A.J.; van Wijk, R.; Glader, B.; Mañú Pereira, M.D.M.; Andres, O.; Kalfa, T.A.; Eber, S.W.; Gallagher, P.G.; Kwiatkowski, J.L.; Galacteros, F.; Lander, C.; Watson, A.; Elbard, R.; Peereboom, D.; Grace, R.F. Diagnosis and management of pyruvate kinase deficiency: international expert guidelines. Lancet Haematol. 2024, 11, e228–e239. [Google Scholar] [CrossRef] [PubMed]
- Naeim, F. Disorder of Red Blood Cells: Anemias. In “Hematopathology: Morphology, Immunophenotype, Cytogenetics and Molecular Approaches”, chapter 23; Jaffe, E.S., Harris, N.L., Stein, H., Vardiman, J.W., Eds.; Academic Press (Elsevier): Amsterdam; Boston, 2008; pp. 529–565. [Google Scholar] [CrossRef]
- Mohandas, N.; Gallagher, P.G. Red cell membrane: past, present, and future. Blood 2008, 112, 3939–3948. [Google Scholar] [CrossRef] [PubMed]
- Perrotta, S.; Gallagher, P.G.; Mohandas, N. Hereditary spherocytosis. Lancet 2008, 372, 1411–1426. [Google Scholar] [CrossRef] [PubMed]
- Popel, A.S.; Johnson, P.C. Microcirculation and hemorheology. Annu. Rev. Fluid Mechan. 2005, 37, 43–69. [Google Scholar] [CrossRef] [PubMed]
- Kim, J.; Lee, H.; Shin, S. Advances in the measurement of red blood cell deformability: A brief review. J. Cell. Biotechnol. 2015, 1, 63–79. [Google Scholar] [CrossRef]
- Matthews, K.; Lamoureux, E.S.; Myrand-Lapierre, M.E.; Duffy, S.P.; Ma, H. Technologies for measuring red blood cell deformability. Lab. Chip. 2022, 22, 1254–1274. [Google Scholar] [CrossRef] [PubMed]
- Prudinnik, D.S.; Kussanova, A.; Vorobjev, I.A.; Tikhonov, A.; Ataullakhanov, F.I.; Barteneva, N.S. Deformability of heterogeneous red blood cells in aging and related pathologies. Aging Dis. 2024, 16, 1242–1264. [Google Scholar] [CrossRef] [PubMed]
- Musielak, M. Red blood cell-deformability measurement: Review of techniques. Clin. Hemorheol. Microcircul. 2009, 42, 47–64. [Google Scholar] [CrossRef] [PubMed]
- Baskurt, O.K.; Meiselman, H.J. Data reduction methods for ektacytometry in clinical hemorheology. Clin. Hemorheol. Microcircul. 2013, 54, 99–107. [Google Scholar] [CrossRef] [PubMed]
- Parrow, N.L.; Violet, P.C.; Tu, H.; Nichols, J.; Pittman, C.A.; Fitzhugh, C.; Fleming, R.E.; Mohandas, N.; Tisdale, J.F.; Levine, M. Measuring deformability and red cell heterogeneity in blood by ektacytometry. J. Vis. Exp. 2018, 131, 56910. [Google Scholar] [CrossRef] [PubMed]
- Llaudet-Planas, E.; Vives-Corrons, J.L.; Rizzuto, V.; Gómez-Ramírez, P.; Sevilla Navarro, J.; Coll Sibina, M.T.; García-Bernal, M.; Ruiz Llobet, A.; Badell, I.; Velasco-Puyó, P.; Dapena, J.L.; Mañú-Pereira, M.M. Osmotic gradient ektacytometry: A valuable screening test for hereditary spherocytosis and other red blood cell membrane disorders. Int. J. Lab. Hematol. 2018, 40, 94–102. [Google Scholar] [CrossRef] [PubMed]
- Sadaf, A.; Seu, K.G.; Thaman, E.; Fessler, R.; Konstantinidis, D.G.; Bonar, H.A.; Korpik, J.; Ware, R.E.; McGann, P.T.; Quinn, C.T.; Kalfa, T.A. Automated oxygen gradient ektacytometry: A novel biomarker in sickle cell anemia. Front. Physiol. 2021, 12, 636609. [Google Scholar] [CrossRef] [PubMed]
- Kubankova, M.; Hohberger, B.; Hoffmanns, J.; Fürst, J.; Herrmann, M.; Guck, J.; Kräter, M. Physical phenotype of blood cells is altered in COVID-19. Biophys. J. 2021, 120, 2838–2847. [Google Scholar] [CrossRef] [PubMed]
- Hochmuth, R.M. Micropipette aspiration of living cells. J. Biomech. 2000, 33, 15–22. [Google Scholar] [CrossRef] [PubMed]
- Radmacher, M. Measuring the elastic properties of living cells by the atomic force microscope. In “Methods in Cell Biology”; Jena, B.P., Hörber, J.K.H., Eds.; Elsevier Science, USA, 2002; vol. 68, chapter 4; pp. 67–90. ISSN 0091-679X. [Google Scholar]
- Girasole, M.; Dinarelli, S.; Boumis, G. Structure and function in native and pathological erythrocytes: a quantitative view from the nanoscale. Micron 2012, 43, 1273–1286. [Google Scholar] [CrossRef] [PubMed]
- Ashkin, A. Forces of a single-beam gradient laser trap on a dielectric sphere in the ray optics regime. In “Methods in Cell Biology”; Sheetz, M.P., Ed.; 1997; vol. 55, chapter 1; pp. 1–27. ISSN 0091-679X/98. [Google Scholar] [CrossRef]
- Dao, M.; Lim, C.T.; Suresh, S. Mechanics of the human red blood cell deformed by optical tweezers. J. Mech. Phys. Solids 2003, 51, 2259–2280, Erratum in J. Mech. Phys. Solids 2003, 53, 493-494. https://doi.org/10.1016/j.jmps.2004.10.003. [Google Scholar] [CrossRef]
- Mills, J.P.; Qie, L.; Dao, M.; Lim, C.T.; Suresh, S. Nonlinear elastic and viscoelastic deformation of the human red blood cell with optical tweezers. Mech. Mater. 2004, 36, 1031–1045. [Google Scholar] [PubMed]
- Reid, H.L.; Barnes, A.J.; Lock, P.J.; Dormandy, J.A.; Dormandy, T.L. A simple method for measuring erythrocyte deformability. J. Clin. Pathol. 1976, 29, 855–858. [Google Scholar] [CrossRef] [PubMed]
- Stuart, J.; Stone, P.C.W.; Bareford, D.; Bilto, Y.Y. Effect of pore diameter and cell volume on erythrocyte filterability. Clin. Hemorheol. Microcircul. 2016, 5, 449–461. [Google Scholar] [CrossRef]
- Chien, S.; Sung, K.L.; Skalak, R.; Usami, S.; Tözeren, A. Theoretical and experimental studies on viscoelastic properties of erythrocyte membrane. Biophys. J. 1978, 24, 463–487. [Google Scholar] [CrossRef] [PubMed]
- Gallagher, P.G. Disorders of red cell volume regulation. Curr. Opin. Hematol. 2013, 20, 201–207. [Google Scholar] [CrossRef] [PubMed]
- Bruce, L.J. Hereditary stomatocytosis and cation-leaky red cells: recent developments. Blood Cells Mol. Dis. 2009, 42, 216–222. [Google Scholar] [CrossRef] [PubMed]
- Stewart, G.W.; Turner, E.J. The hereditary stomatocytoses and allied disorders: congenital disorders of erythrocyte membrane permeability to Na and K. Baillieres Best Pract. Res. Clin. Haematol. 1999, 12, 707–727. [Google Scholar] [CrossRef] [PubMed]
- Kim, Y.; Park, J.; Kim, M. Diagnostic approaches for inherited hemolytic anemia in the genetic era. Blood Res. 2017, 52, 84–94. [Google Scholar] [CrossRef] [PubMed]
- Prudinnik, D.S.; Koleva, L.; Bovt, E.A.; Kushnir, N.S.; Suvorova, A.S.; Dolgikh, I.A.; Shakhidzhanov, S.S.; Vitvitsky, V.M.; Ataullakhanov, F.I.; Sinauridze, E.I.; Plyasunova, S.A.; Smetanina, N.S. Erythrocyte filterability method in the diagnosis of hereditary spherocytosis. Pediatr. Hematol. Immunopathol. 2024, 23, 145–151. (in Rissian). [Google Scholar] [CrossRef]
- DeLong, E.R.; DeLong, D.M.; Clarke-Pearson, D.L. Comparing the areas under two or more correlated receiver operating characteristic curves: a nonparametric approach. Biometrics 1988, 44, 837–845. [Google Scholar] [CrossRef] [PubMed]
- Bianchi, P.; Fermo, E.; Vercellati, C.; Marcello, A.P.; Porretti, L.; Cortelezzi, A.; Barcellini, W.; Zanella, A. Diagnostic power of laboratory tests for hereditary spherocytosis: a comparison study in 150 patients grouped according to molecular and clinical characteristics. Haematologica 2012, 97, 516–523. [Google Scholar] [CrossRef] [PubMed]
- Chen, J.; Zhou, Y.; Gao, Y.; Cao, W.; Sun, H.; Lie, Y.; Wang, C. A genetic features and gene interaction study for identifying the genes that cause hereditary spherocytosis. Hematology 2017, 22(4), 240–247. [Google Scholar] [CrossRef] [PubMed]
- Ciepiela, O. Old and new insights into the diagnosis of hereditary spherocytosis. Ann. Transl. Med. 2018, 6, 339 (10 pp.). [Google Scholar] [CrossRef] [PubMed]
- Bianchi, P. Current diagnostic approach and screening methods for hereditary spherocytosis. Thalass. Rep. 2013, 3(s1), e32 (3 pp.). [Google Scholar] [CrossRef]
- King, M.J.; Zanella, A. Herediary red cell membrane disorders and laboratory diagnostic testing. Int. J. Lab. Hem. 2013, 35, 237–243. [Google Scholar] [CrossRef] [PubMed]
- Bolton-Maggs, P.H.; Langer, J.C.; Iolascon, A.; Tittensor, P.; King, M.J. Guidelines for the diagnosis and management of hereditary spherocytosis – 2011 update. Br. J. Haematol. 2012, 156, 37–49. [Google Scholar] [CrossRef] [PubMed]
- Layton, M.; Roper, D. Investigation of the hereditary haemolytic anaemias: membrane and enzyme abnormalities. In “Dacie and Lewis Practical Haematology”, 12th ed.; Bain, B.J., Bates, I., Laffan, M.A., Eds.; 2017 Elsevier Ltd.; chapter 12; pp. 228–253. ISBN 978-0-7020-6696-2. [CrossRef]
- Dacie, J.V.; Lewis, S.M. The osmotic fragility test and other methods for the diagnosis of hereditary spherocytosis. In “Practical Heamatology”, 9th Edition; Lewis, S.M., Bain, B.J., Bates, I., Eds.; Churchill Livingstone, Harcourt Publishers Limited: London, 2001; pp. 444–451. ISBN 978-0-443-07306-5. [Google Scholar]
- Shim, Y.J.; Won, D.I. Flow cytometric osmotic fragility testing does reflect the clinical severity of hereditary spherocytosis. Cytom. B Clin. Cytom. 2014, 86, 436–443. [Google Scholar] [CrossRef] [PubMed]
- King, M.J.; Behrens, J.; Rogers, C.; Flynn, C.; Greenwood, D.; Chambers, K. Rapid flow cytometric test for the diagnosis of membrane cytoskeleton-associated haemolytic anaemia. Br. J. Haematol. 2000, 111, 924–933. [Google Scholar] [CrossRef]
- Suvorova, A.S.; Kushnir, N.S.; Prudinnik, D.S.; Bovt, E.A.; Ataullakhanov, F.I.; Sinauridze, E.I. Verification of the method for measuring erythrocyte filterability using the IDA-01 device. Pediatr. Hematol. Immunopathol. 2026, 25, 154–164, (in Russ.). [Google Scholar] [CrossRef]
- King, M.-J.; Garçon, L.; Hoyer, J.D.; Iolascon, A.; Picard, V.; Stewart, G.; Bianchi, P.; Lee, S.-H.; Zanella, A.; for the International Council for Standardization in Haematology. ICSH guidelines for the laboratory diagnosis of nonimmune hereditary red cell membrane disorders. Int. J. Lab. Hematol. 2015, 37, 304–325. [Google Scholar] [CrossRef] [PubMed]
- Arora, R.D.; Dass, J.; Maydeo, S.; Arya, V.; Radhakrishnan, N.; Sachdeva, A.; Kotwal, J.; Bhargava, M. Flow cytometric osmotic fragility test and eosin-5′-maleimide dye-binding tests are better than conventional osmotic fragility tests for the diagnosis of hereditary spherocytosis. Int. J. Lab. Hematol. 2018, 40, 335–342. [Google Scholar] [CrossRef] [PubMed]
- Prudinnik, D.S.; Sinauridze, E.I.; Shakhidzhanov, S.S.; Bovt, E.A.; Protsenko, D.N.; Rumyantsev, A.G.; Ataullakhanov, F.I. Filterability of Erythrocytes in Patients with COVID-19. Biomol. Spec. Issue “Biochemical Biophys. Prop. Red. Blood Cells Dis. 2022, 12, 782. [Google Scholar] [CrossRef] [PubMed]
- Ataullakhanov, F.I.; Vitvitsky, V.M.; Kostyna, M.A.; Lisovskaya, I.L. Method and device for measuring red blood cell deformability. Patent of Russian Federation N 2052194C1 of 27.11.1991. date of publication: 10.01.1996; (In Russ.).
- Lisovskaya, I.L.; Shurkhina, E.S.; Nesterenko, V.M.; Rozenberg, J.M.; Ataullakhanov, F.I. Determination of the content of nonfilterable cells in erythrocyte suspensions as a function of the medium osmolality. Biorheology 1998, 35, 141–153. [Google Scholar] [CrossRef]
- Bossuyt, P.M.; Reitsma, J.B.; Bruns, D.E.; Gatsonis, C.A.; Glasziou, P.P.; Irwig, L.; Lijmer, J.G.; Moher, D.; Rennie, D.; de Vet, H.C.; Kressel, H.Y.; Rifai, N.; Golub, R.M.; Altman, D.G.; Hooft, L.; Korevaar, D.A.; Cohen, J.F.; STARD Group. STARD 2015: an updated list of essential items for reporting diagnostic accuracy studies. BMJ Open 2015, 351, h5527. [Google Scholar] [CrossRef] [PubMed]
- Beutler, E. “Red Cell Metabolism. A Manual of Biochemical Methods”, 2nd ed.; Gruen & Stratton Inc: Orlando, FL, USA, 1984. [Google Scholar]
Figure 2.
The values of EMA test (A), filterability (filter pore diameter 3.5 µm, Ht 1%) (B), RBCs osmotic resistance (concentration of NaCl (in %) at which 50% of cells lyse after 24 h of incubation at 37o C) (C), sphericity index (D) in the groups of the patients with hereditary spherocytosis (HS), pyruvate kinase deficiency (PKD), and hereditary stomatocytosis (HSt). The box sizes represent the 25th to 75th percentile of all measured values, with horizontal lines indicating the medians and the whisker range including 1.5 interquartile range. So-called “violin plots” of the data distribution width are also shown. In all the tests, the significance of differences between the patient groups was determined using the Kruskal–Wallis H test and Dunn’s post-hoc test with Holm-Bonferroni correction (for 3 pairwise comparisons). The differences were considered significant at p < 0.05. The shaded areas represent normal ranges for all tests (ranges including from 5% to 95% of all healthy donor results). ns – The differences are not significant; ** p < 0.01; *** p < 0.001.
Figure 2.
The values of EMA test (A), filterability (filter pore diameter 3.5 µm, Ht 1%) (B), RBCs osmotic resistance (concentration of NaCl (in %) at which 50% of cells lyse after 24 h of incubation at 37o C) (C), sphericity index (D) in the groups of the patients with hereditary spherocytosis (HS), pyruvate kinase deficiency (PKD), and hereditary stomatocytosis (HSt). The box sizes represent the 25th to 75th percentile of all measured values, with horizontal lines indicating the medians and the whisker range including 1.5 interquartile range. So-called “violin plots” of the data distribution width are also shown. In all the tests, the significance of differences between the patient groups was determined using the Kruskal–Wallis H test and Dunn’s post-hoc test with Holm-Bonferroni correction (for 3 pairwise comparisons). The differences were considered significant at p < 0.05. The shaded areas represent normal ranges for all tests (ranges including from 5% to 95% of all healthy donor results). ns – The differences are not significant; ** p < 0.01; *** p < 0.001.
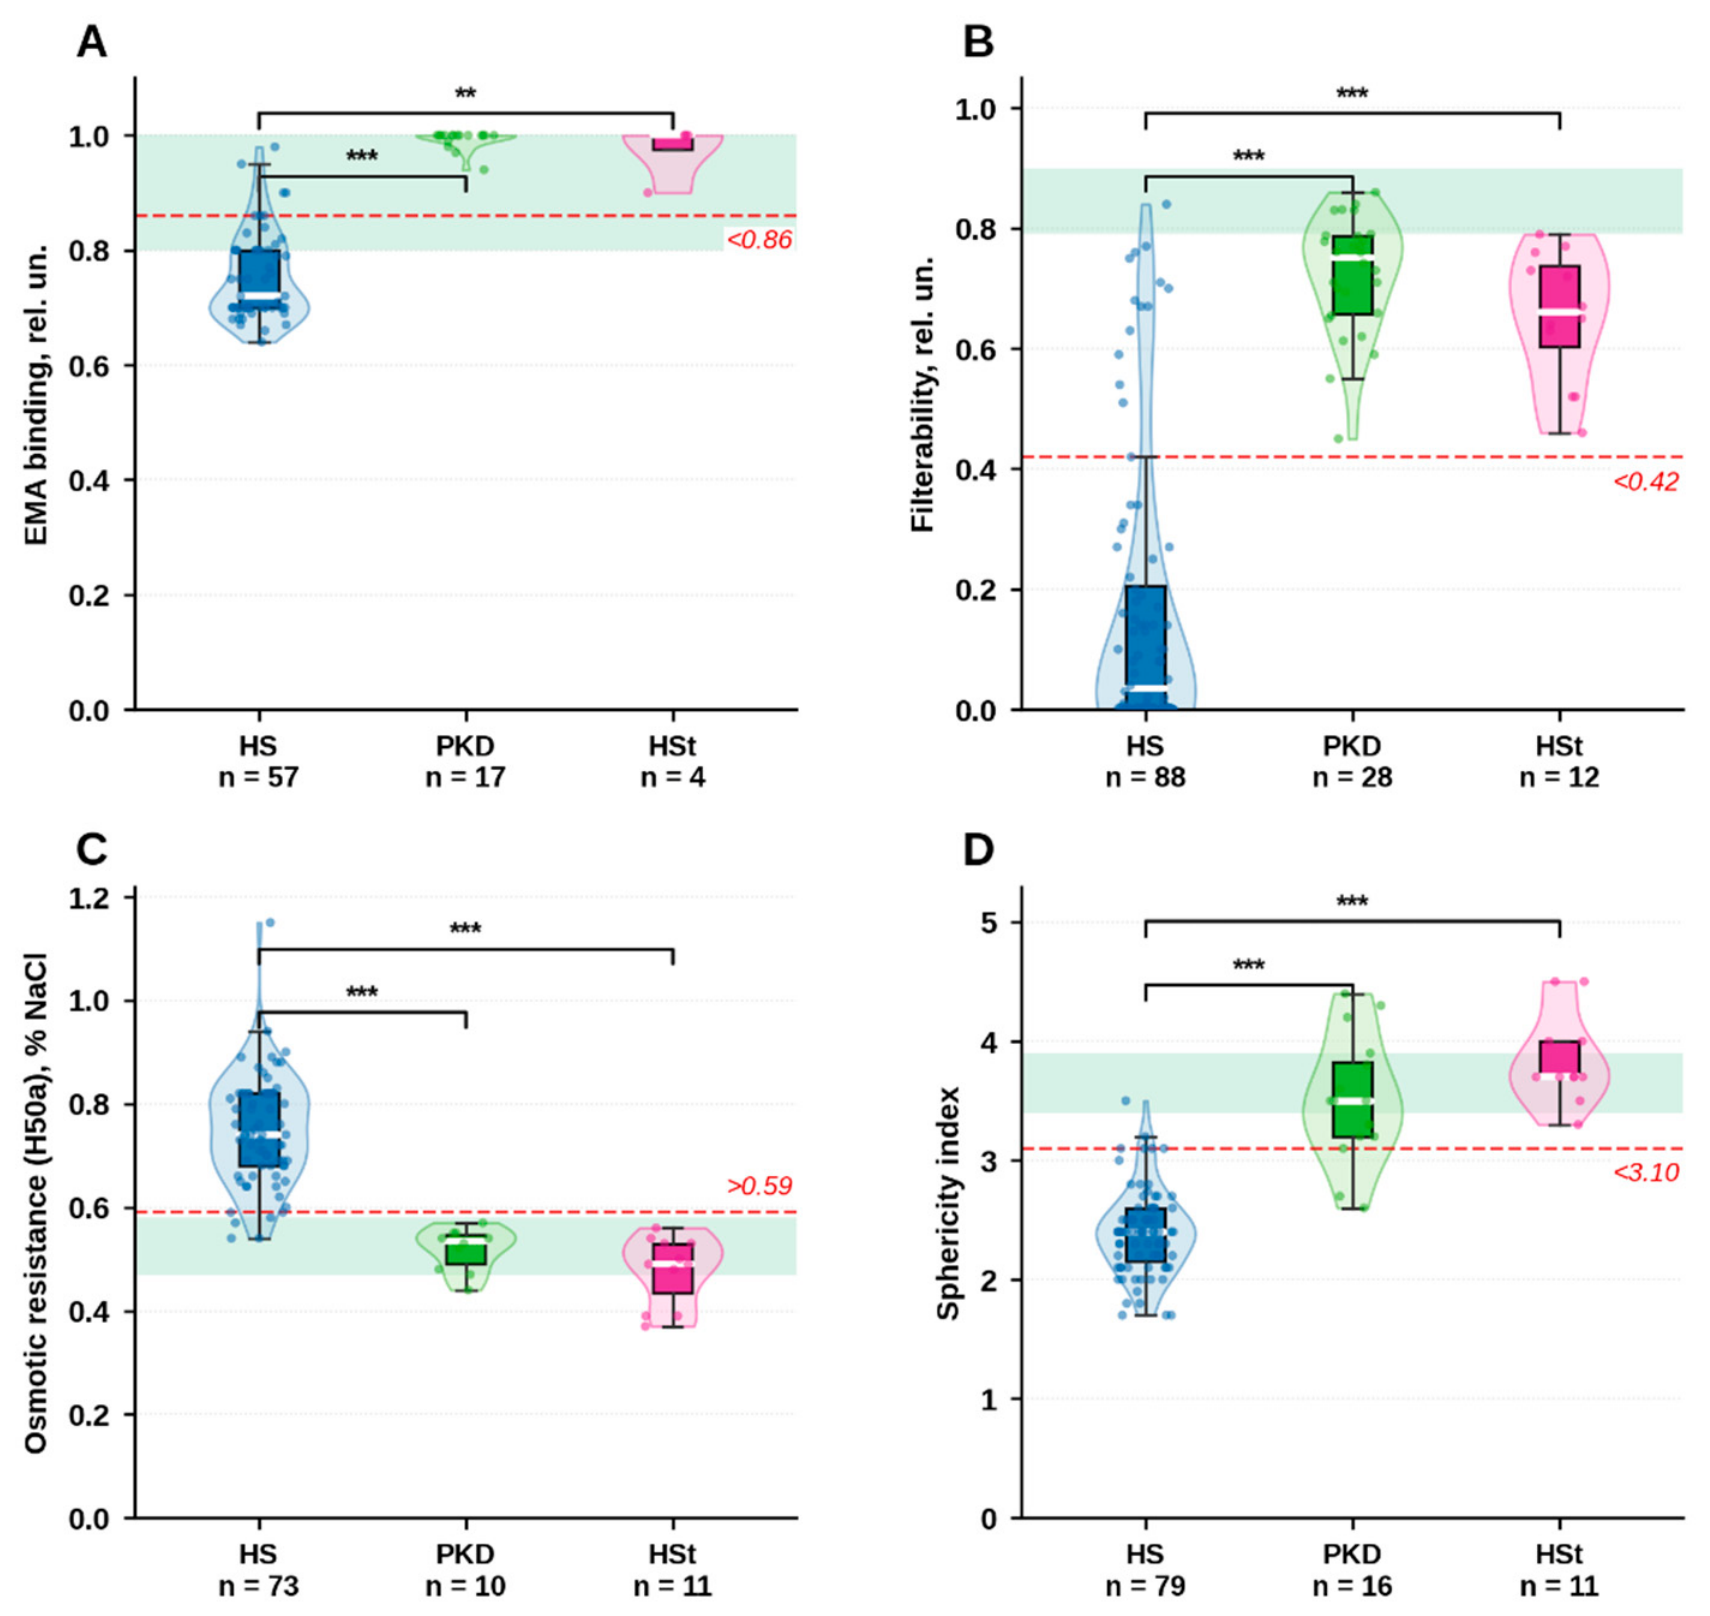
Figure 3.
Filterability of erythrocytes from patients with HS, PKD, and HSt measured using filters with a pore diameter of 3.0 μm. A. – Hematocrit of the tested erythrocyte suspension is 1%. B. – Hematocrit of the suspension is 0.1%. The box sizes represent the 25th to 75th percentile of all measured values, with horizontal lines indicating the medians and the whisker ranges including 1.5 interquartile range (1.5 IQR). “Violin plots” of the data distribution width are also shown. Normal ranges (shaded areas) for healthy donors were defined as ranges that included 5% to 95% of all measured values for each experiment type. The number of blood samples from normal donors was n = 16 and n = 7, for suspensions with a hematocrit of 1% and 0.1%, respectively (see Figure S1 in the SMs). In all the tests, the significance of differences between the patient groups was determined using the Kruskal–Wallis H-test and post-hoc Dunn’s test with Holm-Bonferroni correction. The differences were considered significant at p < 0.05. ns – The difference is not significant; * p < 0.05;** p < 0.01.
Figure 3.
Filterability of erythrocytes from patients with HS, PKD, and HSt measured using filters with a pore diameter of 3.0 μm. A. – Hematocrit of the tested erythrocyte suspension is 1%. B. – Hematocrit of the suspension is 0.1%. The box sizes represent the 25th to 75th percentile of all measured values, with horizontal lines indicating the medians and the whisker ranges including 1.5 interquartile range (1.5 IQR). “Violin plots” of the data distribution width are also shown. Normal ranges (shaded areas) for healthy donors were defined as ranges that included 5% to 95% of all measured values for each experiment type. The number of blood samples from normal donors was n = 16 and n = 7, for suspensions with a hematocrit of 1% and 0.1%, respectively (see Figure S1 in the SMs). In all the tests, the significance of differences between the patient groups was determined using the Kruskal–Wallis H-test and post-hoc Dunn’s test with Holm-Bonferroni correction. The differences were considered significant at p < 0.05. ns – The difference is not significant; * p < 0.05;** p < 0.01.
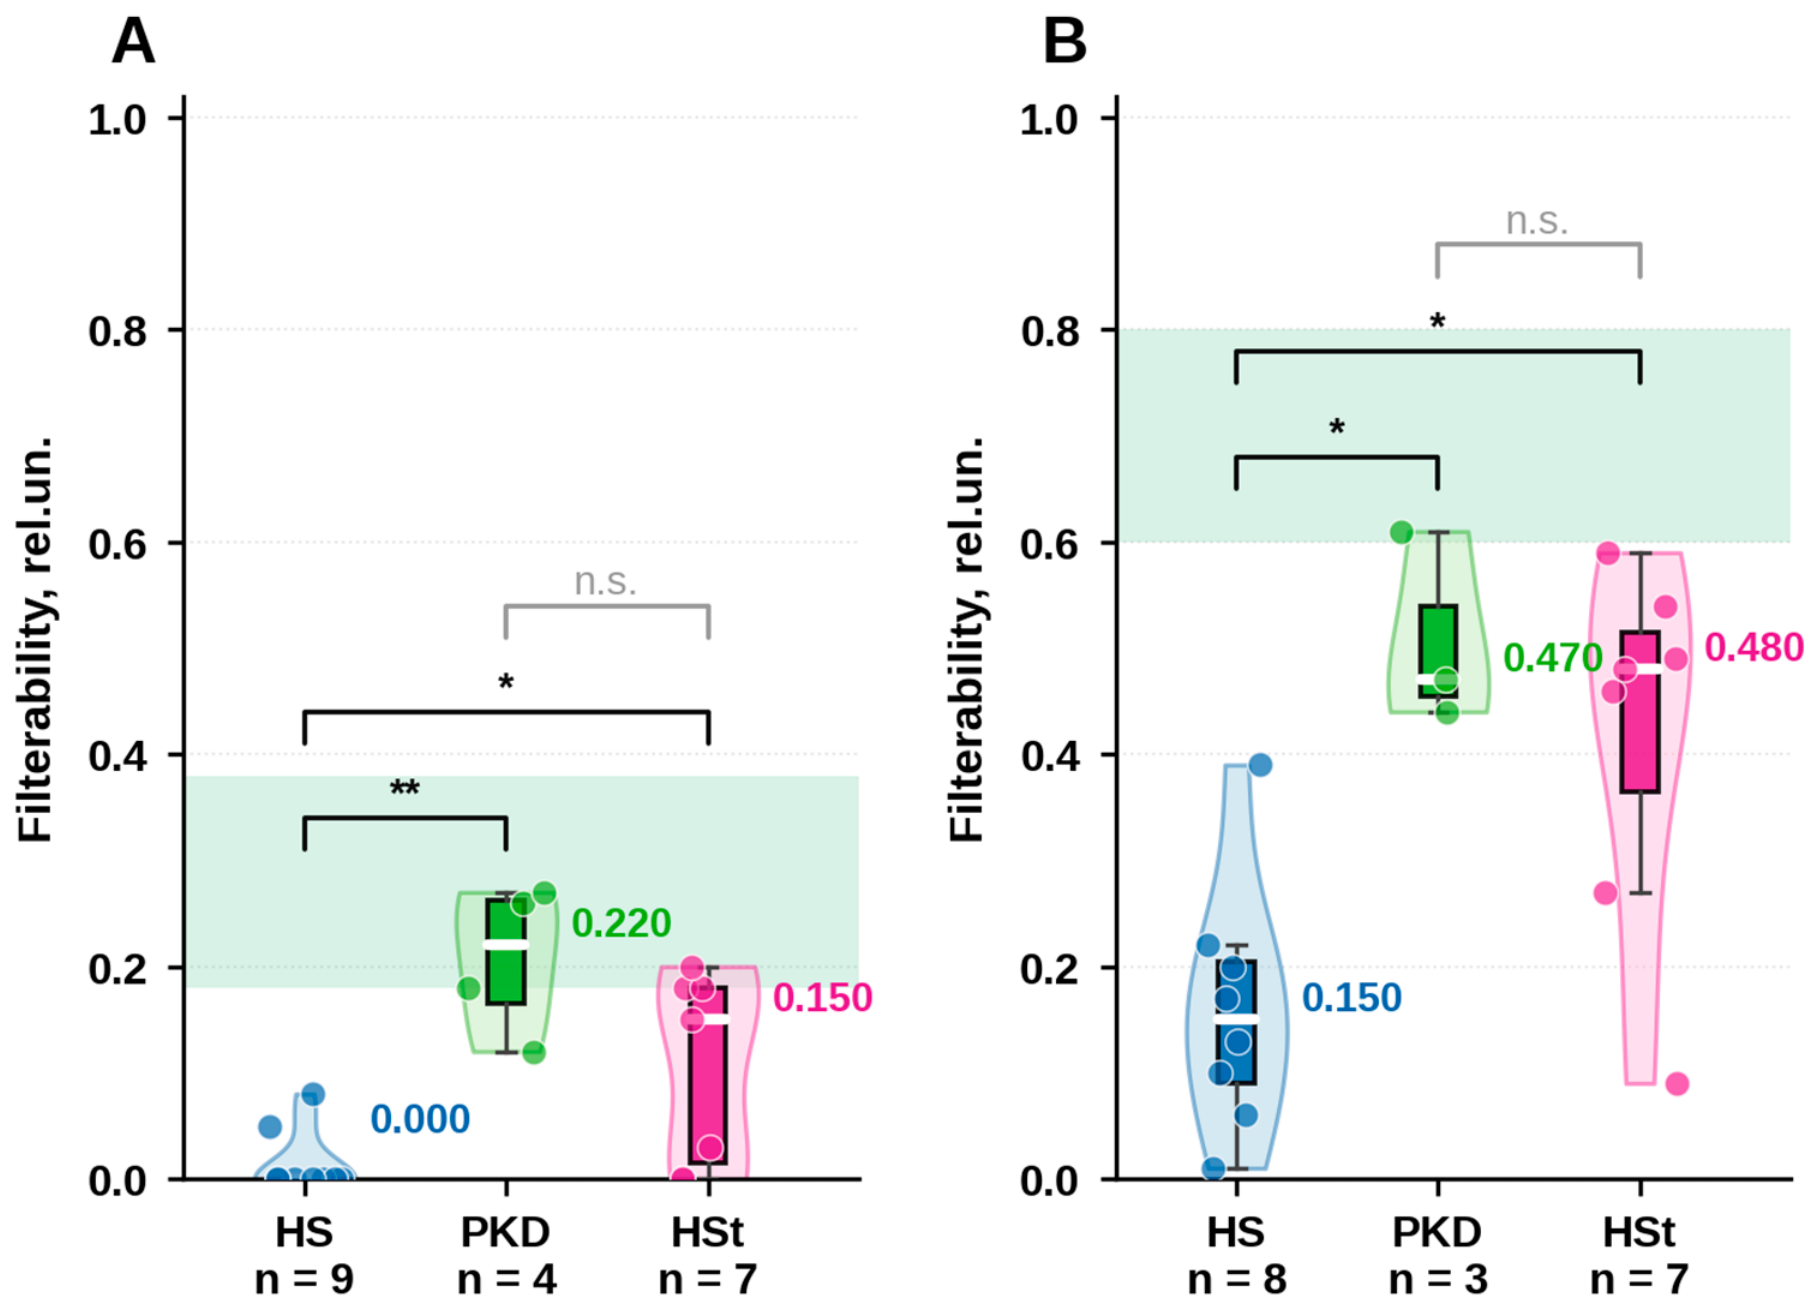
Figure 4.
ROC curves constructed for diagnostics of HS using all studied methods. Total number of patients n=132.
Figure 4.
ROC curves constructed for diagnostics of HS using all studied methods. Total number of patients n=132.
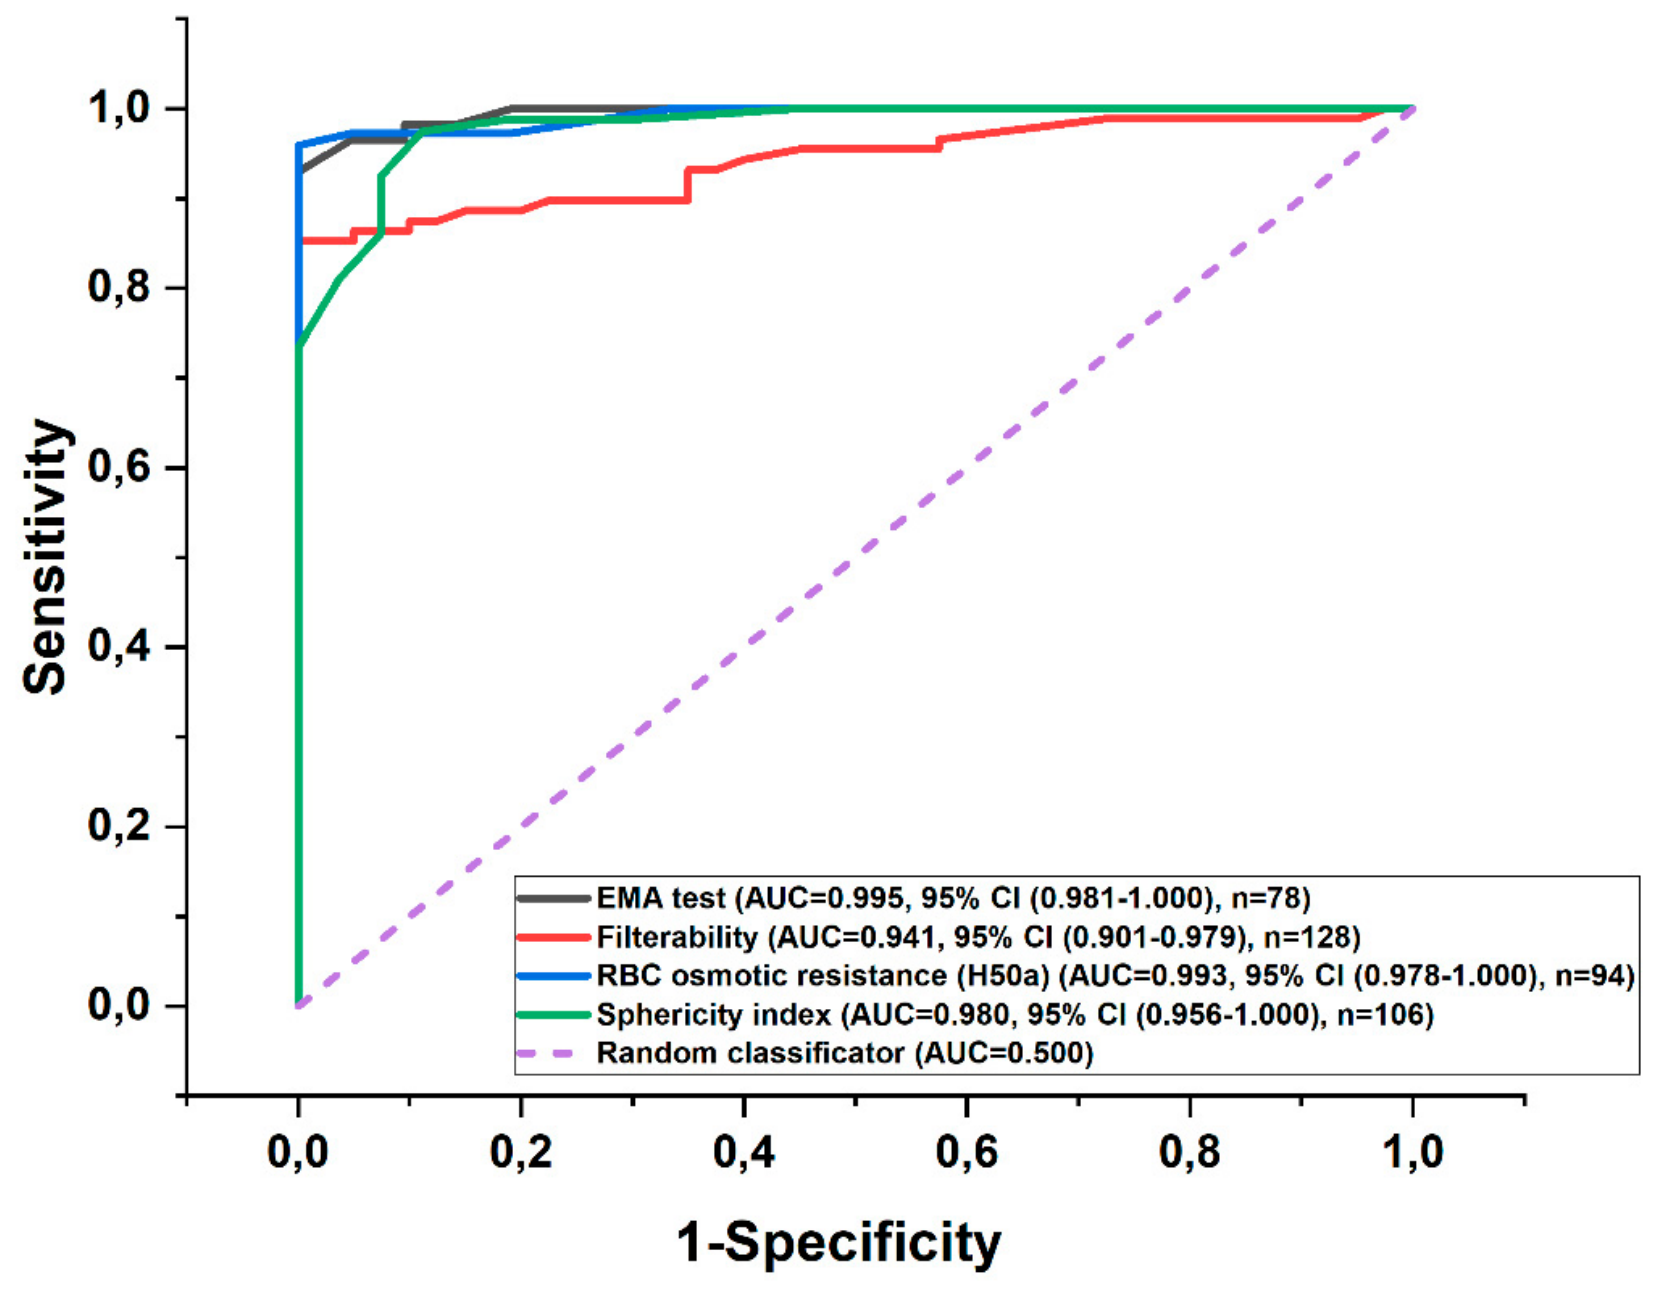
Figure 5.
The values of EMA test (A), RBCs filterability (filter pore diameter 3.5 µm, Ht 1%) (B), RBCs osmotic resistance (concentration of NaCl (in %) at which 50% of cells lyse after 24 h of incubation at 37o C) (C), and sphericity index (D) in the groups of the patients with hereditary spherocytosis, caused by mutations in the SPTB or ANK1 genes. The box sizes represent the 25th to 75th percentile of all measured values, with horizontal lines indicating the medians and the whisker range in 1.5 IQR. “Violin plots” of the data distribution width are also shown. In all the cases, the significance of differences between the patient groups was determined using the Mann-Whitney U test. The differences were considered significant at p < 0.05. The shaded areas represent normal ranges including results from 5% to 95% of all healthy donor. The red dotted line represents the cut-off value for each method, determined above when constructing the ROC curves. A diagnosis of HS was considered to be confirmed only if the measured parameter value in the patient fell within the region defined by this cut-off value as the disease region. ns – The differences are not significant; ** p < 0.01; *** p < 0.001.
Figure 5.
The values of EMA test (A), RBCs filterability (filter pore diameter 3.5 µm, Ht 1%) (B), RBCs osmotic resistance (concentration of NaCl (in %) at which 50% of cells lyse after 24 h of incubation at 37o C) (C), and sphericity index (D) in the groups of the patients with hereditary spherocytosis, caused by mutations in the SPTB or ANK1 genes. The box sizes represent the 25th to 75th percentile of all measured values, with horizontal lines indicating the medians and the whisker range in 1.5 IQR. “Violin plots” of the data distribution width are also shown. In all the cases, the significance of differences between the patient groups was determined using the Mann-Whitney U test. The differences were considered significant at p < 0.05. The shaded areas represent normal ranges including results from 5% to 95% of all healthy donor. The red dotted line represents the cut-off value for each method, determined above when constructing the ROC curves. A diagnosis of HS was considered to be confirmed only if the measured parameter value in the patient fell within the region defined by this cut-off value as the disease region. ns – The differences are not significant; ** p < 0.01; *** p < 0.001.
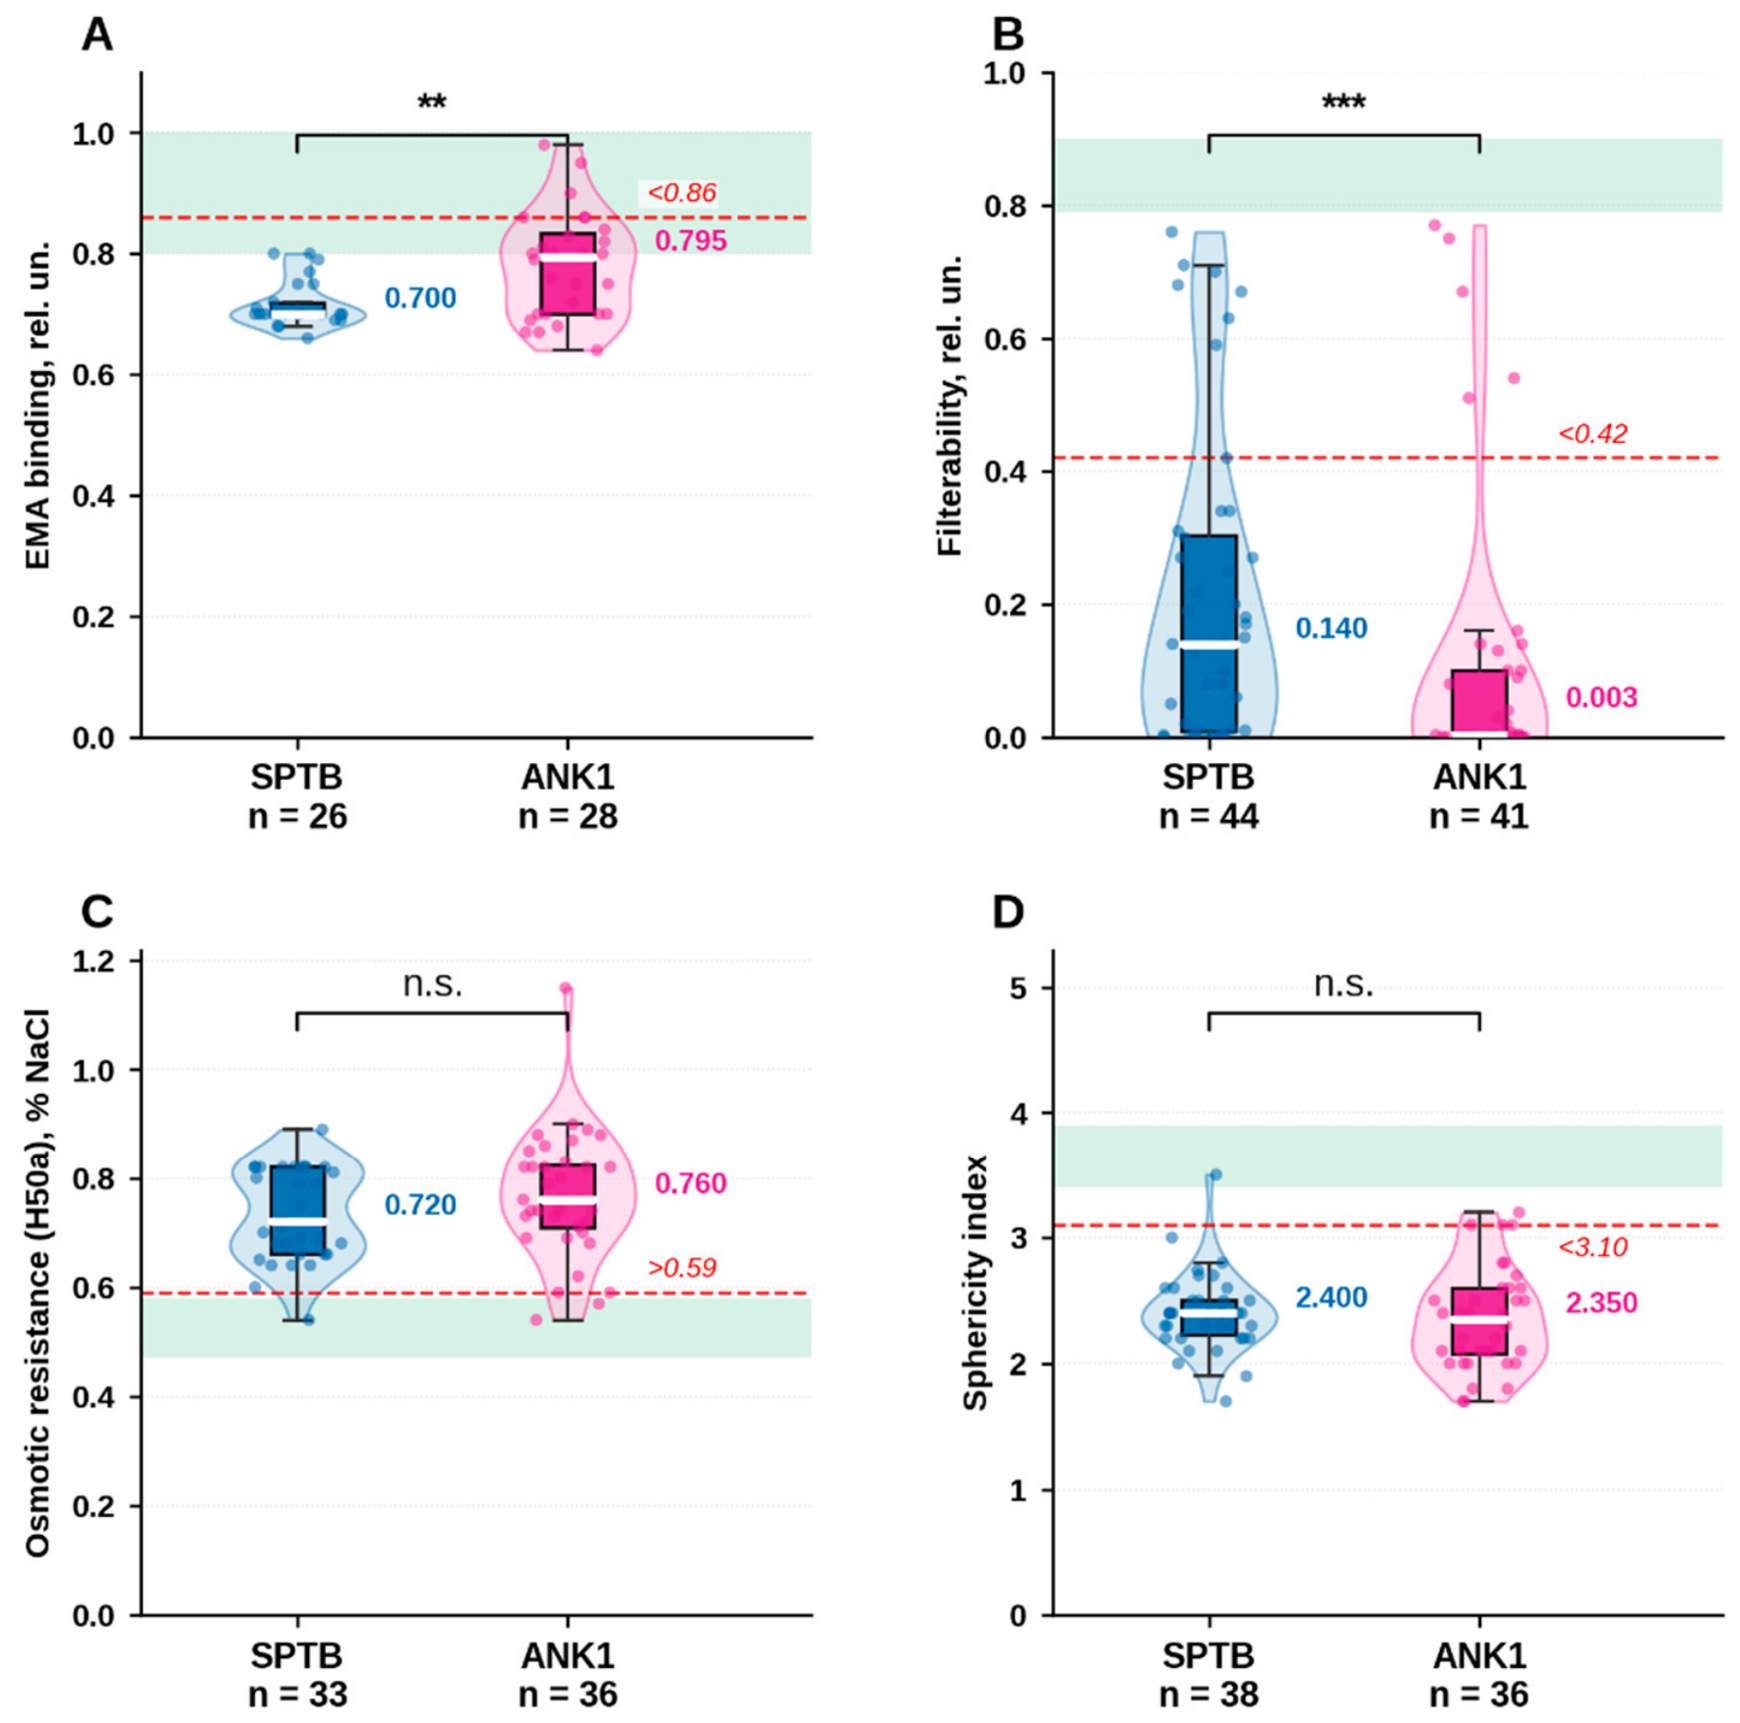
Figure 6.
Dependence of erythrocyte filterability of patients with hereditary spherocytosis on the content of microdiscocytes (A), microechinocytes (B), microstomatocytes (C), microspherocytes (D) and microelliptocytes (E) in the blood, as well as on the sum of all microcytes excluding microdiscocytes (∑M-disc) (F), calculated from the data of peripheral blood smears.
Figure 6.
Dependence of erythrocyte filterability of patients with hereditary spherocytosis on the content of microdiscocytes (A), microechinocytes (B), microstomatocytes (C), microspherocytes (D) and microelliptocytes (E) in the blood, as well as on the sum of all microcytes excluding microdiscocytes (∑M-disc) (F), calculated from the data of peripheral blood smears.
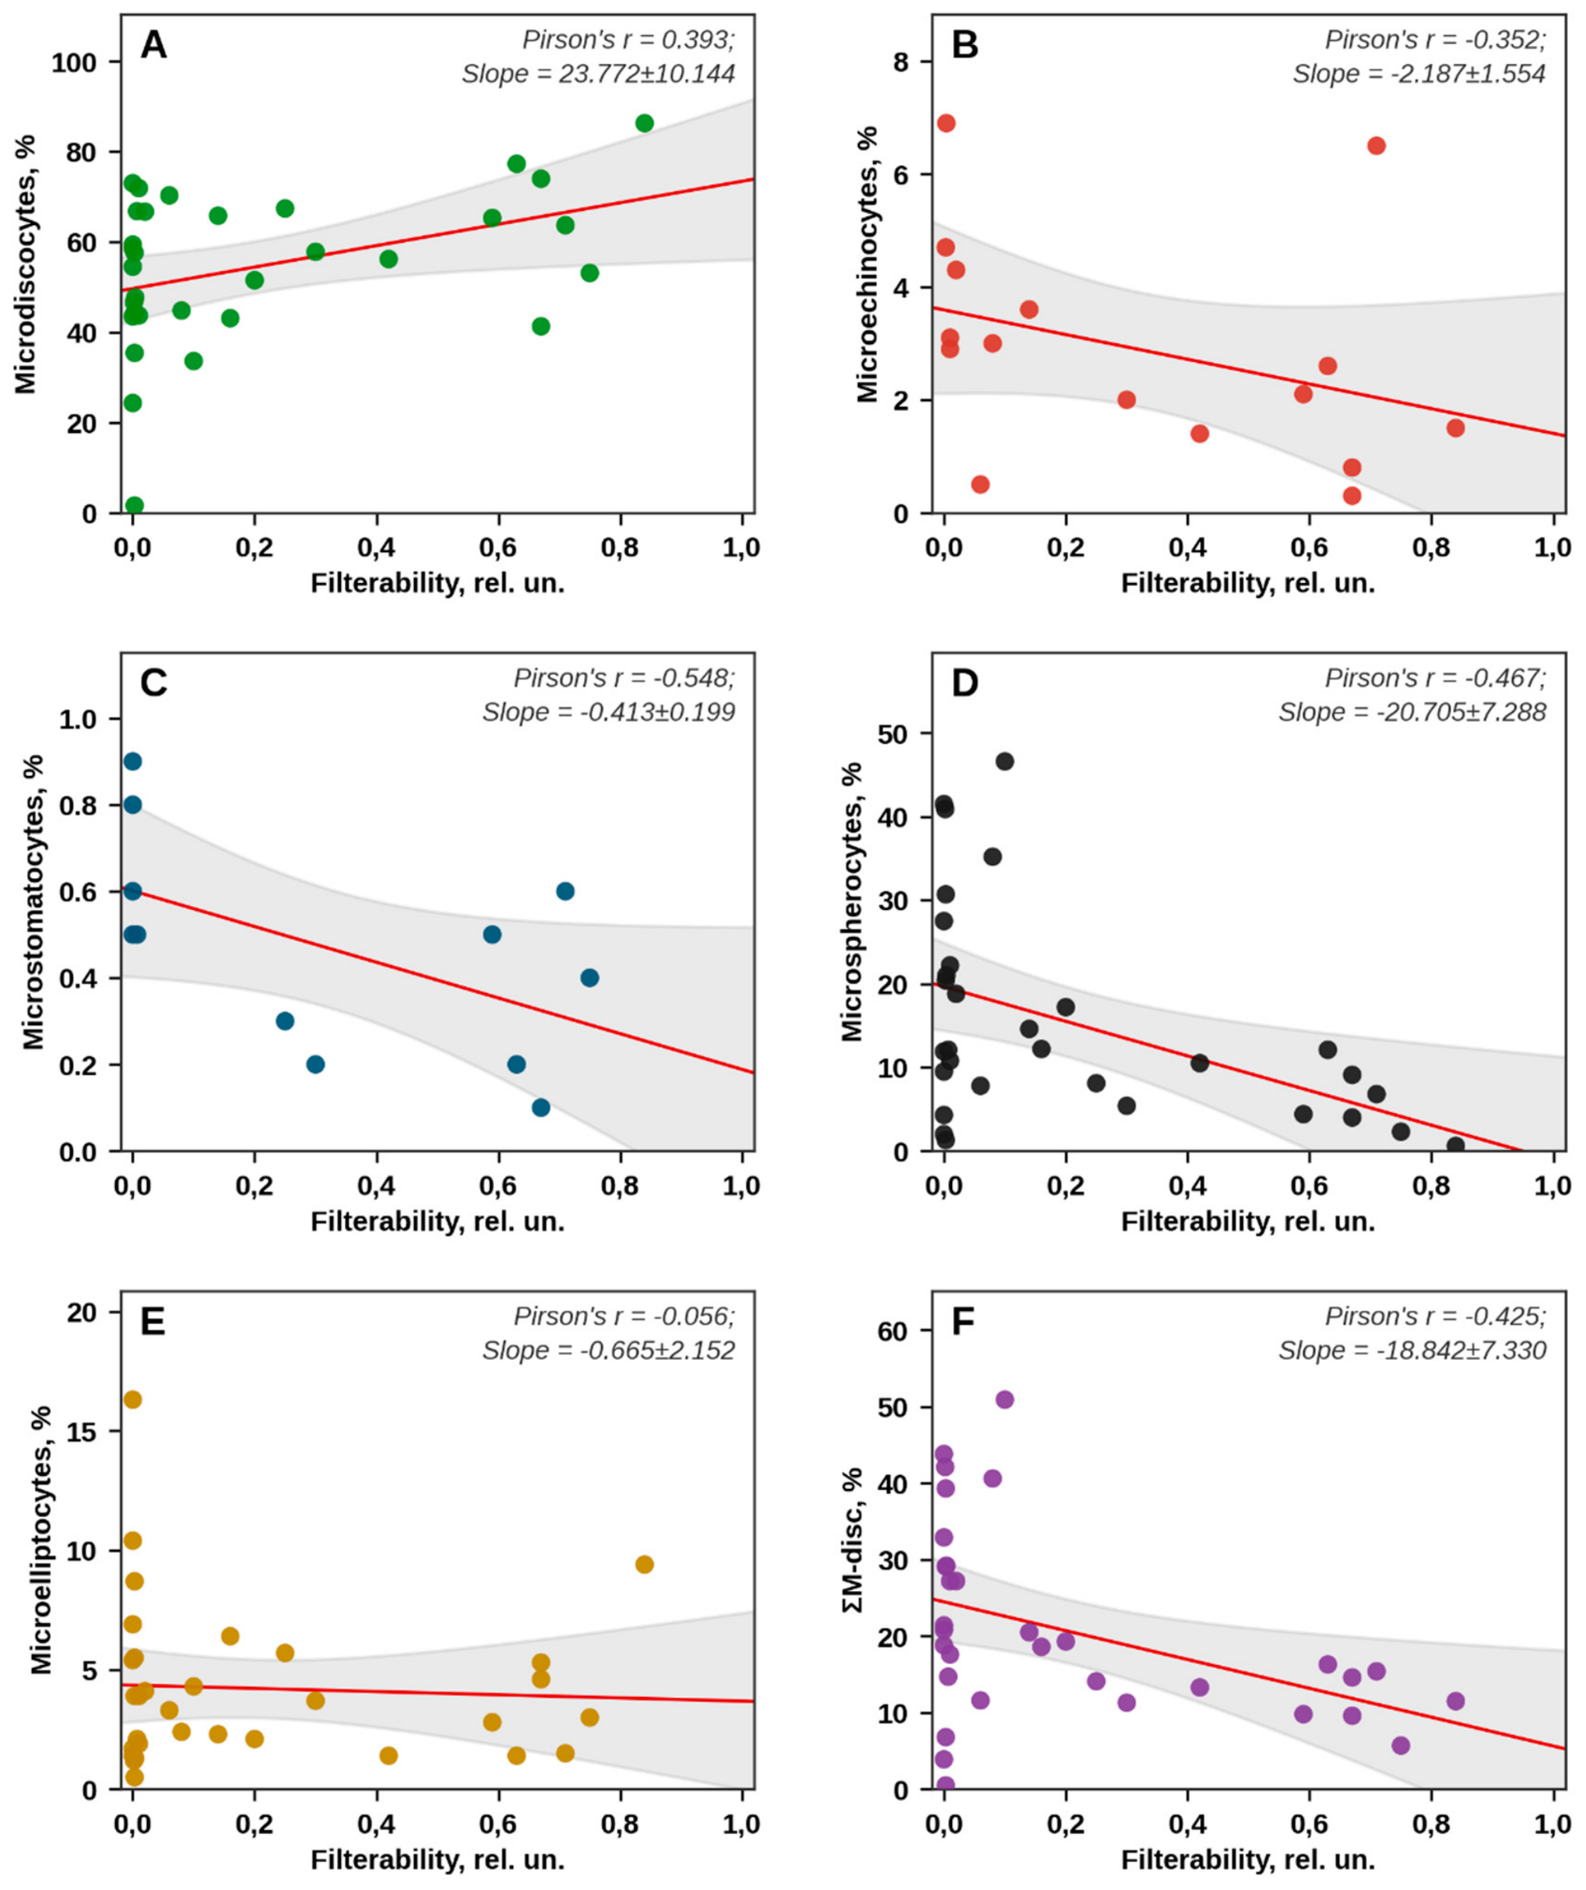
Figure 7.
Diagram (A) and general view (B) of the IDA-01 filterometer. 1 - Column; 2 – column holder; 3 – sample cell; 4 – measuring probe; 5 – recording unit; 6 – 3-core PVC cable; 7 – 2-core PVC cable with adapter for connection to the power supply; 8 – polyethylene terephthalate filter; 9 – shutter.
Figure 7.
Diagram (A) and general view (B) of the IDA-01 filterometer. 1 - Column; 2 – column holder; 3 – sample cell; 4 – measuring probe; 5 – recording unit; 6 – 3-core PVC cable; 7 – 2-core PVC cable with adapter for connection to the power supply; 8 – polyethylene terephthalate filter; 9 – shutter.
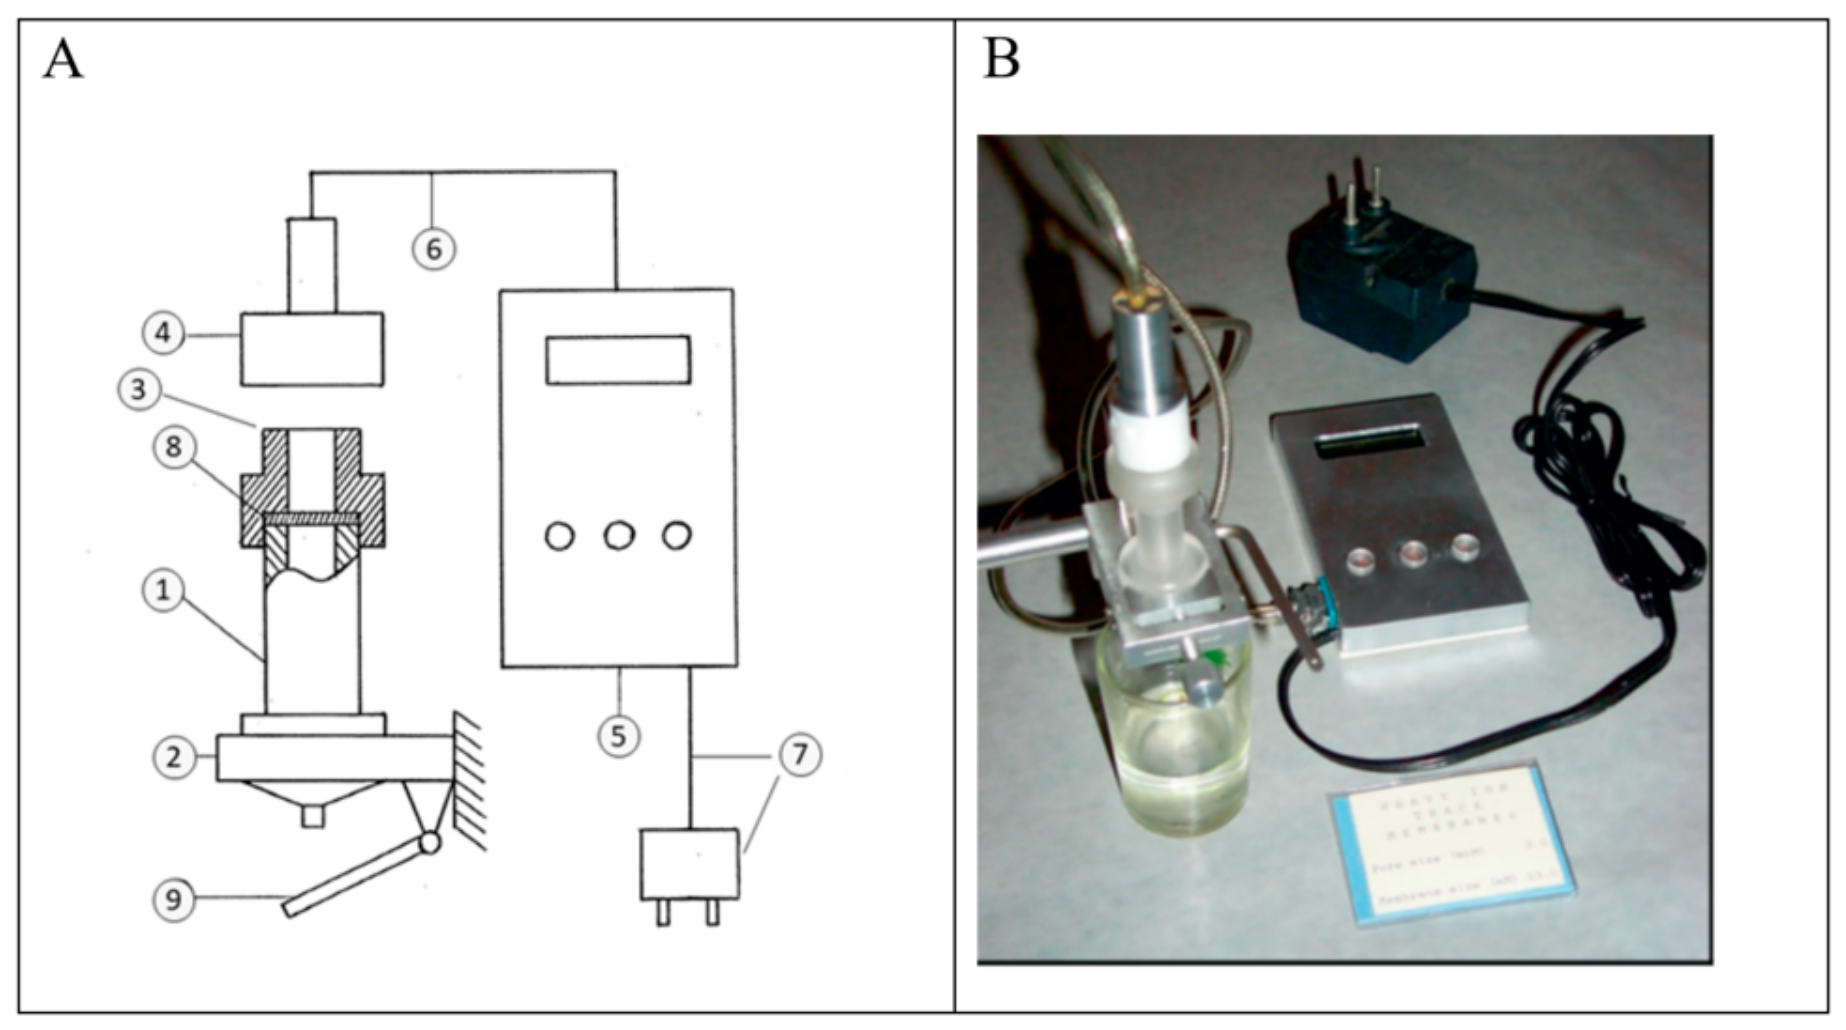

Table 1.
The median values and 1.5 IQRs of the test results in different groups of the patients. (a).
Table 1.
The median values and 1.5 IQRs of the test results in different groups of the patients. (a).
| Group of patients | ||||
|---|---|---|---|---|
| Parameter | HS | HSt | PKD | Normal range |
| Filterability (pore diameter 3.5 µm, Ht 1%), rel. un. | 0.045 (0; 0.51) |
0.685 (0.46; 0.79) |
0.75 (0.55; 0.86) |
0.79 – 0.90 |
| EMA test, rel. un. | 0.72 (0.64; 0.95) |
1.00 (0.90; 1.00) |
1.00 (1.00; 1.00) |
0.80 – 1.00 |
| RBCOR H50a, % NaCl |
0.74 (0.54; 0.94) |
0.49 (0.37; 0.56) |
0.54 (0.44; 0.57) |
0.47 – 0.58 |
| Sphericity index | 2.4 (1.7; 3.2) |
3.7 (3.3; 4.0) |
3.5 (2.6; 4.4) |
3.4 – 3.9 |
(a) Medians and ranges corresponding to 1.5 IQR are presented. The “Normal range” column presents the values accepted at the Dmitry Rogachev National Medical Research Center of Pediatric Hematology, Oncology, and Immunology (these are ranges including from 5 to 95 percentiles of all values in donors). Abbreviations used: HS – hereditary spherocytosis; HSt- hereditary stomatocytosis; PKD – pyruvate kinase deficiency; EMA test – eosin-5’-maleimide binding test to the erythrocyte membrane; RBCOR H50a – RBCs osmotic resistance (% NaCl, causing 50% lysis after 24 h of incubation at 37o C); rel. un. - relative unit.
Table 2.
The sensitivity and specificity of various methods for HS diagnostics. (a).
| Parameter (number of measurements, n) |
AUC 95% CI (L; U) |
Cut-off, units | Sensitivity, % 95% CI (L; U) |
Specificity, % 95% CI (L; U) |
|---|---|---|---|---|
| RBCs filterability (n=128) | 0.941 (0.901; 0.979) |
0.42 rel. un. | 85.2 (77.3; 92.0) |
100.0 (97.5; 100.0) |
| RBCOR (H50a after 24 h incubation at 37o C), (n=94) |
0,992 (0.978; 1.000) |
0,59% NaCl | 94.5 (89.0; 98.6) |
100.0 (100.0; 100.0) |
| Sphericity index (n=106) | 0.980 (0.956; 1.000) |
3.1 | 97.5 (93.7; 100.0) |
88.9 (77.8; 100.0) |
| EMA test (n=78) | 0.995 (0.981; 1.000) |
0.86 rel. un. | 93.0 (86.0; 96.2) |
100.0 (100.0; 100.0) |
(a) AUC – area under ROC curve; CI – confidence interval; L and U – lower and upper limits of 95% CI, respectively; RBCOR – osmotic resistance of RBCs; H50a is the NaCl concentration (in %) at which 50% of erythrocytes are lysed after 24 h of incubation at 37o C; EMA test characterizes binding eosin-5’-maleimide with the RBC membrane.
Table 3.
Comparison of areas under the ROC curves obtained in the diagnosis of HS by different methods using the De Long’s method. (a).
Table 3.
Comparison of areas under the ROC curves obtained in the diagnosis of HS by different methods using the De Long’s method. (a).
| Compared methods | AUC1 | AUC2 | Δ AUC= AUC1-AUC2 |
p value | n (pairs) | |
|---|---|---|---|---|---|---|
| 1 | 2 | |||||
| EMA test | Filterability | 0.995 | 0.933 | +0.0620 | 0.0259 (*) | 74 |
| EMA test | RBCOR | 0,995 | 0,986 | +0.009 | 0.3755 | 61 |
| EMA test | SphI | 0,998 | 0,977 | +0.020 | 0.2409 | 65 |
| Filterability | RBCOR | 0,928 | 0,992 | -0.064 | 0.0132 (*) | 92 |
| Filterability | SphI | 0,926 | 0,981 | -0.055 | 0.0429 (*) | 102 |
| SphI | RBCOR | 0,998 | 0,993 | +0.005 | 0.3871 | 85 |
(a) Abbreviations used: AUC — area under the receiver operating characteristic curve (ROC curve); EMA test — test of eosin-5′-maleimide binding to the erythrocyte membrane; RBCOR — erythrocyte osmotic resistance test (H50a - NaCl concentration (in %) at which 50% of the cells were lysed after 24 h of incubation at 37o C); SphI — sphericity index; * - the difference between AUC values is significant (p < 0.05).
Table 4.
Comparison of the sensitivity of different methods to hereditary spherocytosis caused by mutations in the SPTB or ANK1 gene (a).
Table 4.
Comparison of the sensitivity of different methods to hereditary spherocytosis caused by mutations in the SPTB or ANK1 gene (a).
| Method | Mutation in gene | Median(1.5 IQR) | n total (∑n) |
n+ (disease) | n+/∑n (%) | p value |
|---|---|---|---|---|---|---|
| Filterability measurement |
SPTB ANK1 |
0.140 (0; 0.710) 0.003 (0; 0.160) |
44 41 |
37 36 |
37/44 (84.1%) 36/41 (87.8%) |
7.31937E-4 (***) |
| EMA test |
SPTB ANK1 |
0.70 (0.68; 0.75) 0.80 (0.64; 0.98) |
26 28 |
26 25 |
26/26 (100%) 25/28 (89.3%) |
0.00586 (**) |
| RBCOR (H50a) |
SPTB ANK1 |
0.72 (0.54; 0.89) 0.76 (0.54; 0.9) |
33 36 |
32 34 |
32/33 (97.0%) 34/36 (94.4%) |
0.11949 |
| Sphericity index |
SPTB ANK1 |
2.40 (1.90; 2.80) 2.35 (1.70; 3.20) |
38 36 |
37 35 |
37/38 (97.4%) 35/36 (97.2%) |
0.36967 |
(a) Abbreviations used: EMA test — test of eosin-5′-maleimide binding to the erythrocyte membrane; RBCOR — erythrocyte osmotic resistance test (H50a - NaCl concentration (in %) at which 50% of the cells were lysed after 24 h of incubation at 37o C); n+ - the number of the patients with confirmed by studied test HS. The differences between the groups with mutations in the SPTB and ANK1 genes were compared by the Mann-Whitney U test; ** p < 0.01; *** p < 0.001. Tests showing significant differences between mutations are highlighted in color.
Table 5.
The basic characteristics of donors and patients in different subgroups.
| Subgroup | n total | Age, years (a) | Sex (M/F) (b) |
|---|---|---|---|
| Filters with pore diameter 3.5 µm and hematocrit 1% | |||
| HS | 92 | 9 (1; 26) | 47/45 |
| HSt | 12 | 11 (1; 20) | 8/4 |
| PKD | 28 | 8.5 (1; 26) | 9/19 |
| Healthy donors | 47 | 36 (19; 75) | 35/12 |
| Filters with pore diameter 3.0 µm (hematocrit 1% and 0.1%) | |||
| HS | 9 | 5 (1; 14) | 5/4 |
| HSt | 7 | 12 (3; 15) | 2/5 |
| PKD | 4 | 6 (1; 8) | 2/2 |
| Healthy donors | 23 | 22 (19; 45) | 18/5 |
(a) Mean values are presented as medians and ranges (minimum to maximum). (b) Abbreviations used: M — male, F — female; HS — hereditary spherocytosis; HSt - hereditary stomatocytosis; PKD — pyruvate kinase deficiency.
Disclaimer/Publisher’s Note: The statements, opinions and data contained in all publications are solely those of the individual author(s) and contributor(s) and not of MDPI and/or the editor(s). MDPI and/or the editor(s) disclaim responsibility for any injury to people or property resulting from any ideas, methods, instructions or products referred to in the content. |
© 2026 by the authors. Licensee MDPI, Basel, Switzerland. This article is an open access article distributed under the terms and conditions of the Creative Commons Attribution (CC BY) license (http://creativecommons.org/licenses/by/4.0/).
Copyright: This open access article is published under a Creative Commons CC BY 4.0 license, which permit the free download, distribution, and reuse, provided that the author and preprint are cited in any reuse.


