

Submitted:
03 August 2026
Posted:
05 August 2026
You are already at the latest version
Abstract
Risk-based prioritization frameworks such as the Intelligent Pedestrian Model (IPM) rank pedestrians by an instantaneous, reference-normalized risk score. They indicate which pedestrian requires attention first. This study examines the temporal stability of such rankings. We computed an observation-only kinematic Exposure proxy frame by frame on three ETH/UCY benchmark scenes. In these scenes, the highest-priority identity changes rapidly: the median top-1 persistence is two frames (0.8 s). We introduce a switch classification that separates established switches from entry-driven and forced switches. Grace-period exclusion is evaluated as a sensitivity variant and shown to remove up to 82% of evaluable time in short-track scenes. Established flicker rates range from one switch per 2.7 s in dense scenes to one per 25.4 s in sparse scenes, with switches concentrated at small top-1–top-2 risk gaps. The results show that instantaneous rankings alone may be insufficient for sustained attention allocation and motivate future work on temporal priority management.
Keywords:
pedestrian safety
; risk prioritization
; temporal stability
; priority flicker
; vulnerable road users
; Advanced Driver Assistance Systems (ADAS)
; trajectory analysis
; ranking dynamics
; decision stability
1. Introduction
Pedestrians account for roughly 23% of all road traffic deaths worldwide [1]. In urban traffic, Advanced Driver Assistance Systems (ADAS) and automated vehicles operate with limited attention, computation, and intervention capacity. They cannot treat every pedestrian equally at every moment. Risk-based prioritization addresses this constraint. The Intelligent Pedestrian Model (IPM) [2], developed within the authors’ research program on vulnerable road user protection [2,3], expresses pedestrian risk as a reference-normalized scalar with Exposure and Severity components. It answers a question that trajectory prediction leaves open: who requires attention first?
In our review of the related literature (Section 2), we found no prior work that explicitly measures the temporal persistence of pedestrian priority rankings. Informally, a priority that flickers is not a priority.
Within the broader IPM research program, this work adds the time dimension to risk-based prioritization. The first-generation IPM identifies which pedestrian should receive attention now; this study measures how that assignment evolves across frames. The resulting phenomenon is priority flicker: rapid changes in the top-priority identity. Figure 1 places the study within the research program.
The paper provides a baseline temporal stability assessment. It uses an existing IPM-style Exposure proxy to isolate ranking dynamics and define a reproducible measurement protocol.
Unlike trajectory-prediction evaluations that optimize per-frame displacement, this study treats the induced priority ranking itself as the object of analysis. The novelty is therefore not a new pedestrian-risk score, but a measurement protocol for testing whether an instantaneous risk ranking can remain usable as a sustained attention signal.
Our work makes four contributions. We characterize priority flicker as a previously unquantified temporal limitation of instantaneous pedestrian prioritization. We introduce an established–entry–forced switch classification to separate ranking instability from composition effects. We quantify the phenomenon on three ETH/UCY scenes with different pedestrian densities. And we evaluate grace-period exclusion and show why the classification is preferable in short-track scenes.
The guiding research question is: does instantaneous risk-based pedestrian prioritization exhibit temporal instability, and how can that instability be measured reproducibly?
2. Related Work
2.1. Per-Frame Optimization in Trajectory Prediction and Risk Ranking
Pedestrian motion modeling has been dominated by trajectory prediction since the Social Force Model [4]. Social pooling [5], generative adversarial training [6], and dynamically feasible multimodal predictors [7] have improved displacement accuracy, and surveys show that per-frame displacement remains the dominant objective [8,9]. Surrogate safety measures such as Time-to-Collision quantify instantaneous conflict severity [10], while context-based prediction adds behavioral mode switching [11]. These methods are evaluated frame by frame. They do not require or report temporal consistency of the induced agent ranking.
A smaller body of work ranks road users directly. Refaat et al. [12] rank nearby agents by their impact on autonomous-vehicle planning. Gao et al. [13] estimate object importance in on-road driving videos; later work adds interaction graphs [14] and semi-supervised learning [15]. These systems address a question related to the IPM—who matters most now—but use different importance definitions. They are usually evaluated per frame, and temporal stability of the ordering is not commonly reported. This study addresses that measurement gap.
2.2. Identity Persistence Is Not Priority Persistence
Multi-object tracking solves a persistence problem of its own. SORT [16] and DeepSORT [17] maintain stable track identities across frames. This is not the phenomenon studied here. Tracking preserves identity: the association between detections and agents over time. Priority persistence concerns which correctly tracked agent should keep system priority, and it becomes meaningful only once identities are stable. Identity persistence is an input to prioritization, not a substitute for it. All experiments in this paper use the ground-truth identities of the benchmark, so the measured instability comes from the ranking alone.
2.3. Ranking Stability, Decision Oscillation, and Temporal Consistency
Ranking stability has also been studied directly. Iñiguez et al. [18] analyzed thirty real-world ranking systems and found that newly entering elements strongly affect stability. The entry/established distinction used here applies the same idea to a safety-critical ranking recomputed at sub-second intervals. In visual perception, Zhang and Wang [19] introduced stability metrics for video object detection and showed that stability correlates only weakly with per-frame accuracy. The same distinction applies to rankings: a ranking can be accurate at each frame and still be unstable over time.
In autonomous driving, decision oscillation is a recognized failure mode, and hysteresis is a common remedy. The MOBIL lane-changing model uses a switching threshold to suppress oscillatory lane hopping [20], and recent decision frameworks use distinct trigger and release thresholds for similar reasons [21]. Temporal consistency has also been formulated as a verifiable property of intelligent systems [22]. Priority flicker can be viewed as a pedestrian-prioritization case of these broader decision-stability challenges.
3. Measurement Methodology
3.1. Frame-Level Risk Ranking from Observation-Only Kinematics
The measurements use the observation-only kinematic Exposure proxy of the IPM [2]. For each pedestrian, three motion descriptors are computed over a sliding window of eight annotations (3.2 s at the benchmark interval of 0.4 s): velocity magnitude, acceleration magnitude, and directional change between consecutive velocity vectors. Each descriptor is summarized by its 90th percentile, and the scalar proxy is
following the canonical Proxy v1 definition of [2]. The eight-observation window matches the standard ETH/UCY prediction protocol [5,6] and the IPM setup [2]. It provides enough samples for percentile descriptors while retaining responsiveness to behavioral change. Section 5.3 discusses the fixed-window assumption.
r(X) = 0.7·sp90 + 0.7·ap90 + 0.6·θp90,
The Exposure proxy is used here only as a deterministic ranking signal. The study does not claim that this proxy is the optimal pedestrian-risk estimator, nor does it validate the proxy against collision outcomes. This separation is deliberate: the goal is to measure the temporal behavior of a risk-induced ranking under a fixed and reproducible scoring rule.
For directional change, frames in which either consecutive velocity magnitude falls below 0.05 m/s receive zero angular change. This prevents numerical noise from dominating near-stationary pedestrians. The ranking induced by r(X) is invariant under monotone normalization, so raw proxy values are used directly. The assessment is deterministic and requires no training, calibration, or normalization set.
At every frame, all pedestrians with a valid window are ranked by r(X), and the top-1 identity is recorded. Frames with fewer than three rankable pedestrians are excluded, since prioritization is only meaningful under co-presence. Figure 2 summarizes the workflow.
3.2. The Warm-Up Period and Its Consequences
The proxy needs an eight-frame window, so each pedestrian becomes rankable 3.2 s after track initiation. This warm-up affects stability measurement. When a newly warmed-up pedestrian enters the ranking, the ranked set changes, and the top-1 identity may change for reasons unrelated to the behavior of previously ranked agents. A naive switch count would mix composition effects with ranking instability.
3.3. Switch Classification
Established switches occur when both the outgoing and incoming leader have already been rankable for at least 3.2 s at the moment of the leadership change. They are the primary indicator of instability because the ranked set is not being disturbed by a newly rankable leader. Entry switches occur when either leader entered the ranking within the preceding 3.2 s; they capture composition-driven reassignments. Forced switches occur when the outgoing leader left the scene or lost rankability; they are excluded from instability counts because the previous leader could not be retained.
3.4. Grace-Period Sensitivity Variant
A related alternative is to exclude each pedestrian for an additional grace period after warm-up, so that newly rankable agents cannot cause switches. We evaluate this variant as a sensitivity analysis. In short-track scenes it removes much of the evaluable data: on ETH, evaluable time decreases from 178 s to 32 s, a loss of 82%. It also changes the operational meaning of prioritization, because newly appeared pedestrians are temporarily excluded. The classification retains all rankable agents while still separating composition effects from instability.
3.5. Stability Metrics
Two metrics quantify stability. Switch Rate is the number of switches of a given class per second of evaluated time; the established rate is the primary indicator. Priority Dwell Time is the length of an uninterrupted top-1 tenure, summarized by median and mean. We also record the top-1–top-2 risk gap at every evaluated frame and at each established switch. This gap shows how close the competing risk values are when leadership changes. Algorithm 1 summarizes the procedure for one scene.
Algorithm 1. Priority flicker evaluation on one scene.
| Input: trajectory annotations (frame, id, x, y); window W = 8; step Δt = 0.4 s; warm-up T = (W−1)·Δt = 3.2 s; minimum co-presence n_min = 3 Output: switch counts per class; dwell times; risk gaps 1: for each pedestrian id: assemble its trajectory sorted by frame 2: for each frame f and each id with W consecutive annotations ending at f: 3: r[f][id] ← Exposure proxy of the window, Equation (1) 4: for each frame f with at least n_min ranked pedestrians, in temporal order: 5: top[f] ← argmax over id of r[f][id]; record gap r(top-1) − r(top-2) 6: if the previous frame was evaluated and top[f] ≠ top[previous]: 7: if top[previous] is no longer ranked at f: class ← forced 8: else if top[f] or top[previous] entered the ranking less than T ago: class ← entry 9: else: class ← established 10: close the current dwell run and record its duration 11: else: extend the current dwell run 12: report switch rates per class, dwell time distribution, and gap distributions |
4. Results
4.1. Experimental Setup
Three ETH/UCY benchmark scenes [23,24] are evaluated: ETH-Hotel and ETH (sparse to moderate density) and UCY-Univ (high density). Mean co-presence of rankable pedestrians is 4.2 per evaluated frame in both ETH scenes and 27.9 in UCY-Univ. The analysis focuses on the top-1 priority, i.e., the single agent receiving the main attention resource. All quantities are computed at the native 0.4 s interval.
4.2. Baseline Temporal Stability
Table 1 summarizes the results. Across scenes and switch classes, the median top-1 dwell time is 0.8 s, or two frames (means 1.0–1.3 s). Thus, the highest-priority identity typically persists for only two consecutive annotations. A representative 40 s ETH-Hotel segment is shown in Figure 3, where the raw top-1 identity changes 30 times among 19 pedestrians.
4.3. Density Dependence and the Role of the Switch Classes
The classification shows that churn differs strongly across scenes. In dense UCY-Univ, established switches dominate (80 of 154; one per 2.7 s), indicating instability among long-present agents. In sparse ETH, 94% of flicker is entry-driven and only 7 established switches occur (one per 25.4 s), reflecting short tracks and frequent newly ranked agents. ETH-Hotel lies between the two (one established switch per 6.0 s; 67% entry share).
These patterns show why the classification matters. Established flicker is strongest in the dense scene, where sustained prioritization is especially relevant. Yet the two ETH scenes have similar mean co-presence (4.2) but established rates that differ more than fourfold, so track length also affects the rate. A naive switch count mixes composition effects with instability, while entry exclusion can hide part of the instability. Reporting the classes separately makes these effects visible.
4.4. Risk Gaps at Leadership Changes
Figure 4 compares the top-1–top-2 risk gap over all evaluated frames with the gap at established switches. In ETH-Hotel and UCY-Univ, leadership changes concentrate at small gaps. ETH shows the same direction descriptively, but the established-switch sample is small (n = 7), so it should be treated as indicative only. The median gap overcome at an established switch (0.150–0.207 raw proxy units) is below the median of the overall frame population (0.219–0.390). Established flicker therefore appears mainly as a near-tie phenomenon: top-ranked agents often have risk values separated by less than typical proxy variation. The 90th percentile of switch gaps (about 0.3–0.8 raw units) indicates the fluctuation range that stabilization mechanisms may need to tolerate.
4.5. Sensitivity: The Grace-Period Variant
The grace-period sensitivity analysis confirms the same qualitative pattern. Excluding each pedestrian for an additional 3.2 s after warm-up reduces evaluable time from 238 s to 116 s on ETH-Hotel and from 178 s to 32 s on ETH; UCY-Univ changes little (213 s to 210 s) because its tracks are longer. Surviving flicker rates remain comparable to the established rates of the main analysis, and the median dwell time remains 0.8 s under all variants. The classification therefore captures the relevant instability while preserving more data in short-track scenes.
5. Discussion
5.1. Interpretation of the Findings
The evaluated instantaneous prioritization changes at a timescale that can be short for downstream use. With a median top-1 persistence of 0.8 s, the ranking may change as fast as, or faster than, many downstream decision processes. Three design choices support the result: the strictest switch definition requires both agents to be long-present; the sensitivity analysis gives similar dwell times when entering agents are excluded; and ground-truth identities isolate ranking dynamics from tracking errors.
The classification may also be useful beyond this study. Future evaluations of ranking stability and stabilization mechanisms face the same need to separate composition effects from instability. The established/entry/forced classification provides a transferable protocol. The near-tie character of established switches also clarifies the operating regime of the phenomenon, while the gap analysis quantifies the relevant fluctuation scale.
5.2. Implications for Risk-Based Prioritization Systems
These findings suggest temporal stabilization as the next step. Candidate mechanisms include hysteresis margins, temporal smoothing, minimum holding times, confidence margins, and stateful priority management. This study defines the measurement problem and provides quantitative guidance on the fluctuation scale such methods should handle.
5.3. Threats to Validity
Construct validity. The study evaluates ranking stability, not the correctness of the underlying risk estimate. The Exposure proxy is used as a deterministic IPM-style ranking signal, and ETH/UCY provides no collision ground truth. The conclusions therefore concern ranking dynamics rather than safety outcomes.
Internal validity. The experiments use benchmark ground-truth identities, which separates ranking instability from tracking or association errors. The pipeline is deterministic, with no training or calibration step. Reporting entry-driven switches separately also shows the possible influence of track fragmentation in short-track scenes.
External validity. The magnitude of flicker may depend on the particular Exposure formulation, but the measurement method is independent of the risk source. The analysis uses the community-standard eight-observation window; the influence of the window length on flicker magnitude was not varied here and remains open. It focuses on top-1 priority, the direct case of single-resource attention allocation. Validation on the remaining ETH/UCY folds and independent recordings is a natural extension.
6. Conclusions
This study asked whether instantaneous risk-based pedestrian prioritization is temporally stable and how that stability can be measured.
The results show that priority flicker occurs in the evaluated setup, is measurable, and is not captured by conventional per-frame evaluation. The switch classification separates ranking instability from composition effects, while the grace-period variant removes large portions of evaluable data in short-track scenes.
For the IPM research program, the findings identify a temporal limitation of instantaneous pedestrian prioritization. The first-generation IPM determines who should receive attention now; this study shows that maintaining that priority over time remains an open problem. This methodology provides a basis for future work on temporal priority management.
Quantitatively, the median top-1 dwell time across scenes is 0.8 s, and the established switch rate ranges from 0.039 to 0.375 per second. These values provide concrete design targets: a stabilization mechanism would need to tolerate risk-gap fluctuations of up to 0.8 raw proxy units (90th percentile) while maintaining response latency below the observed dwell time. The density dependence of the phenomenon—established flicker dominates in dense scenes whereas entry-driven flicker prevails in sparse ones—also suggests that different stabilization strategies may be needed for different traffic regimes.
The switch classification itself is a transferable contribution. Any future risk-based ranking system—regardless of the underlying risk estimator—faces the same need to separate composition-driven changes from true instability. The established/entry/forced taxonomy and the associated measurement protocol provide a ready-made evaluation framework for such systems.
Author Contributions
Conceptualization, methodology, software, validation, formal analysis, investigation, data curation, writing—original draft preparation, and visualization were performed by Z.R. Supervision, writing—review and editing, and project administration were carried out by I.L. All authors have read and agreed to the published version of the manuscript.
Funding
This research received no external funding.
Data Availability Statement
Conflicts of Interest
The authors declare no conflicts of interest.
References
- World Health Organization. Global Status Report on Road Safety 2023; World Health Organization: Geneva, Switzerland, 2023. [Google Scholar]
- Rózsás, Z.; Lakatos, I. Intelligent Pedestrian Model as a Risk-Based Framework for Pedestrian Prioritization. Futur. Transp. 2026, 6, 108. [Google Scholar] [CrossRef]
- Rózsás, Z.; Lakatos, I.; Péter, T. Building a Training Dataset for Machine Learning, Radar-Based Pedestrian Detection. Int. J. Automot. Sci. Technol. 2025, 9, 72–76. [Google Scholar] [CrossRef]
- Helbing, D.; Molnár, P. Social force model for pedestrian dynamics. Phys. Rev. E 1995, 51, 4282–4286. [Google Scholar] [CrossRef] [PubMed]
- Alahi, A.; Goel, K.; Ramanathan, V.; Robicquet, A.; Fei-Fei, L.; Savarese, S. Social LSTM: Human Trajectory Prediction in Crowded Spaces. In Proceedings of the 29th IEEE Conference on Computer Vision and Pattern Recognition, Las Vegas, NV, USA, 26 June–1 July 2016; pp. 961–971. [Google Scholar] [CrossRef]
- Gupta, A.; Johnson, J.; Fei-Fei, L.; Savarese, S.; Alahi, A. Social GAN: Socially Acceptable Trajectories with Generative Adversarial Networks. 2018 IEEE/CVF Conference on Computer Vision and Pattern Recognition (CVPR); COUNTRY; pp. 2255–2264.
- Ivanovic, B.; Pavone, M. The Trajectron: Probabilistic Multi-Agent Trajectory Modeling With Dynamic Spatiotemporal Graphs. 2019 IEEE/CVF International Conference on Computer Vision (ICCV), South Korea; pp. 2375–2384.
- Rudenko, A.; Palmieri, L.; Herman, M.; Kitani, K.M.; Gavrila, D.M.; O Arras, K. Human motion trajectory prediction: a survey. Int. J. Robot. Res. 2020, 39, 895–935. [Google Scholar] [CrossRef]
- Bharilya, V.; Kumar, N. Machine learning for autonomous vehicle's trajectory prediction: A comprehensive survey, challenges, and future research directions. Veh. Commun. 2024, 46. [Google Scholar] [CrossRef]
- Zheng, L.; Ismail, K.; Meng, X. Traffic conflict techniques for road safety analysis: open questions and some insights. Can. J. Civ. Eng. 2014, 41, 633–641. [Google Scholar] [CrossRef]
- Kooij, J.F.P.; Flohr, F.; Pool, E.A.I.; Gavrila, D.M. Context-Based Path Prediction for Targets with Switching Dynamics. Int. J. Comput. Vis. 2018, 127, 239–262. [Google Scholar] [CrossRef]
- Refaat, K.S.; Ding, K.; Ponomareva, N.; Ross, S. Agent Prioritization for Autonomous Navigation. 2019 IEEE/RSJ International Conference on Intelligent Robots and Systems (IROS), China; pp. 2060–2067.
- Gao, M.; Tawari, A.; Martin, S. Goal-oriented Object Importance Estimation in On-road Driving Videos. 2019 International Conference on Robotics and Automation (ICRA), Canada.
- Zhang, Z.; Tawari, A.; Martin, S.; Crandall, D. Interaction Graphs for Object Importance Estimation in On-road Driving Videos. 2020 IEEE International Conference on Robotics and Automation (ICRA), France; pp. 8920–8927.
- Li, J.; Gang, H.; Ma, H.; Tomizuka, M.; Choi, C. Important Object Identification with Semi-Supervised Learning for Autonomous Driving. 2022 IEEE International Conference on Robotics and Automation (ICRA), United States; pp. 2913–2919.
- Bewley, A.; Ge, Z.; Ott, L.; Ramos, F.; Upcroft, B. Simple online and realtime tracking. In Proceedings of the 2016 IEEE International Conference on Image Processing (ICIP), Phoenix, AZ, USA, 25–28 September 2016; pp. 3464–3468. [Google Scholar]
- Wojke, N.; Bewley, A.; Paulus, D. Simple online and realtime tracking with a deep association metric. In Proceedings of the 2017 IEEE International Conference on Image Processing (ICIP), Beijing, China, 17–20 September 2017; pp. 3645–3649. [Google Scholar]
- Iñiguez, G.; Pineda, C.; Gershenson, C.; Barabási, A.-L. Dynamics of ranking. Nat. Commun. 2022, 13, 1–7. [Google Scholar] [CrossRef] [PubMed]
- Zhang, H.; Wang, N. On the Stability of Video Detection and Tracking. arXiv 2016, arXiv:1611.06467. [Google Scholar] [CrossRef]
- Kesting, A.; Treiber, M.; Helbing, D. General Lane-Changing Model MOBIL for Car-Following Models. Transp. Res. Rec. J. Transp. Res. Board 2007, 1999, 86–94. [Google Scholar] [CrossRef]
- Li, S.; Liu, C.; Chen, W.-H. An HMDP-MPC Decision-Making Framework with Adaptive Safety Margins and Hysteresis for Autonomous Driving. arXiv Accept. IEEE Int. Conf. Robot. Autom. ICRA 2026, arXiv:2603.17802. [Google Scholar]
- Lu, C.; Li, C.; Liu, C.; Wu, X.; Huang, Y. Verification of temporal consistency constraints in the evolution of software for intelligent unmanned systems driven by model checking. Sci. Rep. 2025, 15, 1–26. [Google Scholar] [CrossRef] [PubMed]
- Pellegrini, S.; Ess, A.; Schindler, K.; van Gool, L. You'll never walk alone: Modeling social behavior for multi-target tracking. 2009 IEEE 12th International Conference on Computer Vision (ICCV), Japan; pp. 261–268.
- Lerner, A.; Chrysanthou, Y.; Lischinski, D. Crowds by Example. Comput. Graph. Forum 2007, 26, 655–664. [Google Scholar] [CrossRef]
Figure 1.
Relationship between the original IPM framework [2], the temporal instability examined in this work, and the proposed future direction: temporal priority management.
Figure 1.
Relationship between the original IPM framework [2], the temporal instability examined in this work, and the proposed future direction: temporal priority management.
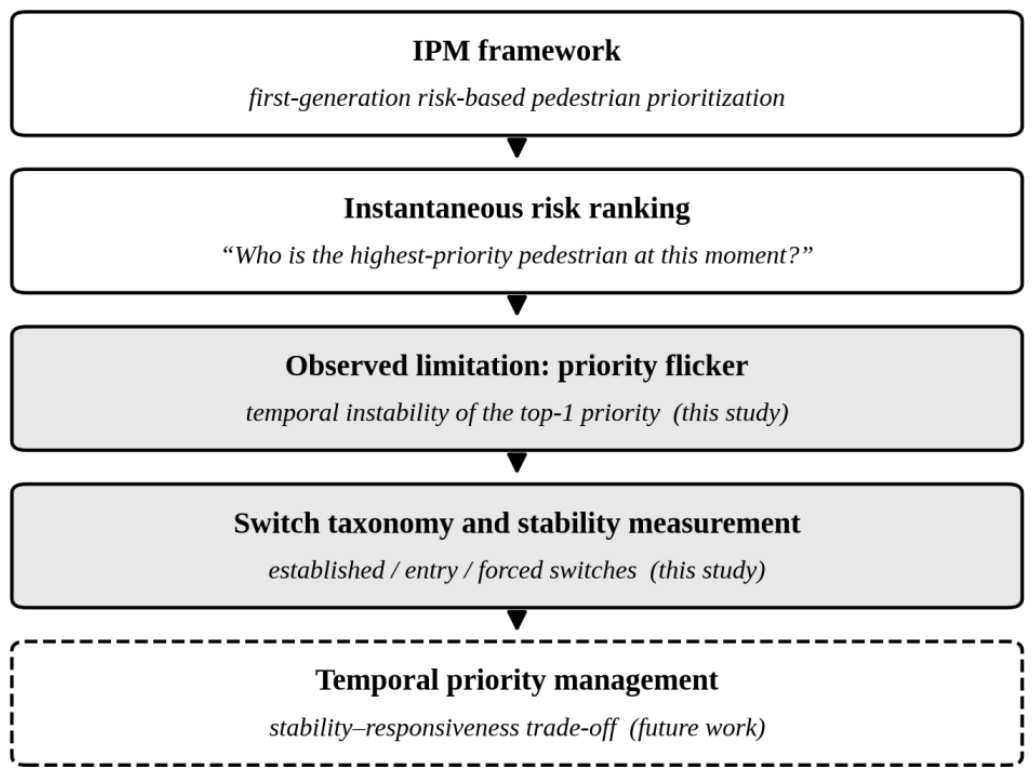
Figure 2.
Measurement workflow. Raw benchmark trajectories are processed with a sliding observation window into the Exposure proxy of Equation (1); per-frame rankings are compared between consecutive evaluated frames, switches are classified into the categories of Section 3.3, and the stability metrics of Section 3.5 are computed.
Figure 2.
Measurement workflow. Raw benchmark trajectories are processed with a sliding observation window into the Exposure proxy of Equation (1); per-frame rankings are compared between consecutive evaluated frames, switches are classified into the categories of Section 3.3, and the stability metrics of Section 3.5 are computed.
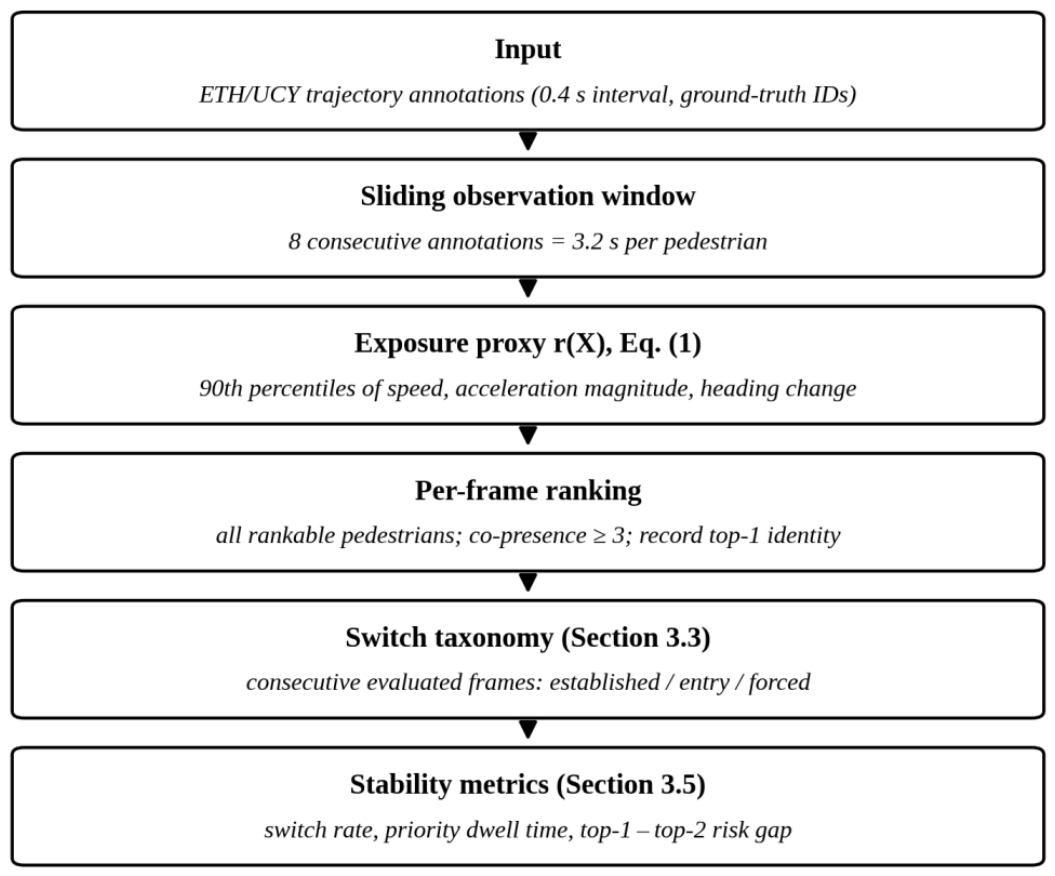
Figure 3.
Raw top-1 pedestrian identity over a 40 s segment of the ETH-Hotel scene (co-presence ≥ 3). Vertical gray lines mark consecutive-frame leadership changes; the identity changes 30 times among 19 distinct pedestrians within the segment. Pedestrian identities are the ground-truth track IDs of the benchmark annotation files. Computed from the ETH/UCY benchmark annotations [23,24].
Figure 3.
Raw top-1 pedestrian identity over a 40 s segment of the ETH-Hotel scene (co-presence ≥ 3). Vertical gray lines mark consecutive-frame leadership changes; the identity changes 30 times among 19 distinct pedestrians within the segment. Pedestrian identities are the ground-truth track IDs of the benchmark annotation files. Computed from the ETH/UCY benchmark annotations [23,24].
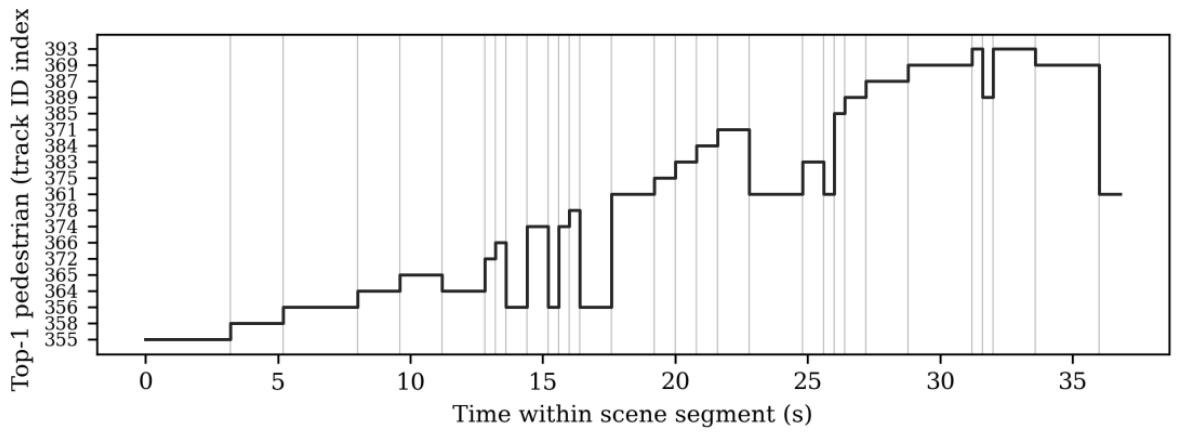
Figure 4.
Distribution of the top-1–top-2 risk gap over all evaluated frames (light) and at established switches (dark), per scene. Boxes span the interquartile range; whiskers omit outliers. Established switches occur at smaller gaps than the overall frame population. Sample sizes: n = 40 (ETH-Hotel), n = 7 (ETH, indicative only), and n = 80 (UCY-Univ). Computed from the ETH/UCY benchmark annotations [23,24].
Figure 4.
Distribution of the top-1–top-2 risk gap over all evaluated frames (light) and at established switches (dark), per scene. Boxes span the interquartile range; whiskers omit outliers. Established switches occur at smaller gaps than the overall frame population. Sample sizes: n = 40 (ETH-Hotel), n = 7 (ETH, indicative only), and n = 80 (UCY-Univ). Computed from the ETH/UCY benchmark annotations [23,24].
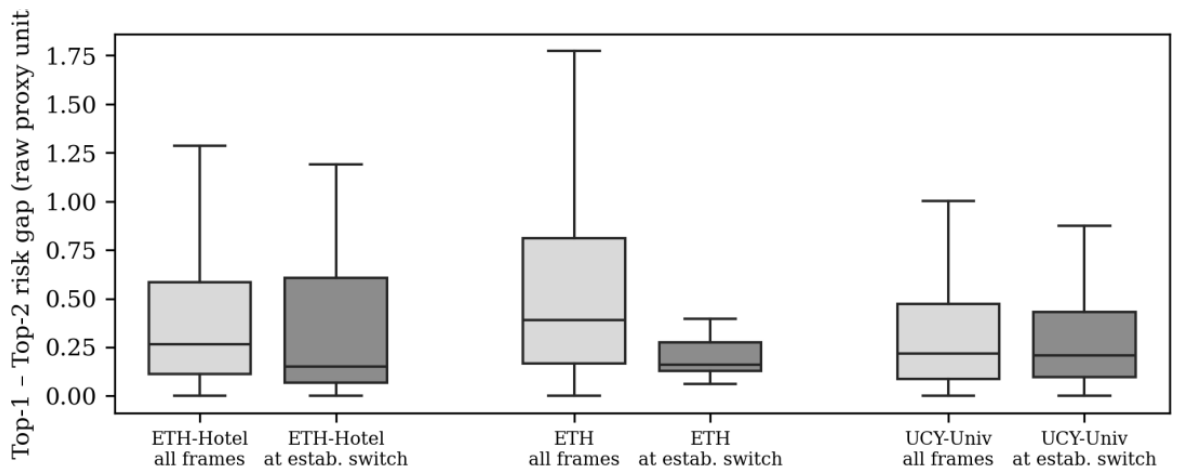

Table 1.
Switch classification results on the three evaluated scenes (co-presence ≥ 3 rankable pedestrians; strict two-sided established definition). Rates are per second of evaluated time.
Table 1.
Switch classification results on the three evaluated scenes (co-presence ≥ 3 rankable pedestrians; strict two-sided established definition). Rates are per second of evaluated time.
| Scene | SceneEval. time (s) | SceneNon-forced flicker | SceneEntry | SceneEstablished | SceneForced | SceneEstab. rate (1/s) | SceneDwell med./mean (s) |
| ETH-Hotel | 238 | 120 | 80 | 40 | 40 | 0.168 (1 per 6.0 s) | 0.8 / 1.3 |
| ETH | 178 | 108 | 101 | 7 | 49 | 0.039 (1 per 25.4 s) | 0.8 / 1.0 |
| UCY-Univ | 213 | 154 | 74 | 80 | 25 | 0.375 (1 per 2.7 s) | 0.8 / 1.2 |
1 Non-forced flicker is the sum of Entry and Established switches; Forced switches are excluded because the outgoing leader left the scene.
Disclaimer/Publisher’s Note: The statements, opinions and data contained in all publications are solely those of the individual author(s) and contributor(s) and not of MDPI and/or the editor(s). MDPI and/or the editor(s) disclaim responsibility for any injury to people or property resulting from any ideas, methods, instructions or products referred to in the content. |
© 2026 by the authors. Licensee MDPI, Basel, Switzerland. This article is an open access article distributed under the terms and conditions of the Creative Commons Attribution (CC BY) license.
Copyright: This open access article is published under a Creative Commons CC BY 4.0 license, which permit the free download, distribution, and reuse, provided that the author and preprint are cited in any reuse.