

Submitted:
03 August 2026
Posted:
05 August 2026
You are already at the latest version
Abstract
This study examines the nonlinear relationship between loan portfolio diversification and credit risk in Vietnamese commercial banks. While diversification is generally con-sidered an effective risk management strategy, its impact on credit risk may vary de-pending on the degree of diversification. Using an unbalanced panel dataset of Viet-namese commercial banks from 2012 to 2025, this study employs the two-step System Generalized Method of Moments (System GMM) estimator to address endogeneity, unobserved heterogeneity, and the dynamic persistence of credit risk. Loan portfolio diversification is measured using the Shannon Entropy Index, and a quadratic specifi-cation is applied to capture potential nonlinear effects. The results reveal a significant U-shaped relationship between diversification and credit risk. Moderate diversification reduces the non-performing loan ratio by mitigating sectoral concentration risk, whereas excessive diversification increases credit risk because higher monitoring costs and in-formation asymmetry outweigh the benefits of risk dispersion. The estimated turning point indicates that diversification improves loan quality only up to an optimal level. Credit risk is also found to be highly persistent over time, while inflation has a positive effect on non-performing loans. These findings suggest that maintaining an optimal level of diversification is essential for effective credit risk management and banking sector stability.
Keywords:
loan diversification
; commercial bank
; credit risk
; nonlinear relationship
1. Introduction
Commercial banks play a central role in promoting economic growth by mobilizing savings and allocating credit to productive sectors. However, their contribution to economic development largely depends on maintaining sound asset quality and effective credit risk management. Among various indicators of banking stability, non-performing loans (NPLs) have attracted considerable attention because they directly affect bank profitability, capital adequacy, liquidity, and lending capacity. A persistent increase in NPLs not only weakens the financial performance of individual banks but also undermines financial stability and constrains economic growth through the credit channel (Berger & DeYoung, 1997; Beck et al., 2015; IMF, 2021). Consequently, identifying effective strategies to reduce credit risk has become an important issue for both banking practitioners and policymakers.
The issue has become particularly relevant in Vietnam, where the banking sector has experienced increasing pressure on asset quality following the COVID-19 pandemic, the prolonged downturn of the real estate market, and heightened global economic uncertainty. During 2024–2025, Vietnamese commercial banks experienced renewed pressure on asset quality, with on-balance-sheet non-performing loans remaining elevated following the downturn in the real estate sector and broader macroeconomic challenges. One of the underlying structural concerns is the excessive concentration of bank lending in a limited number of industries, particularly the real estate sector and related business groups. Such concentration exposes banks to sector-specific shocks and amplifies credit risk when adverse market conditions occur (Acharya et al., 2006; OECD, 2025). Therefore, improving the diversification of loan portfolios has become an increasingly important strategy for enhancing banking resilience.
This issue has gained further importance following the enactment of the Law on Credit Institutions No. 32/2024/QH15, which introduces a gradual tightening of large exposure limits for Vietnamese commercial banks. Under the new regulation, the maximum credit exposure to a single customer will be progressively reduced from 15% to 10% of regulatory capital, while the limit applicable to a customer and its related parties will decline from 25% to 15% by 2029. Although the law does not explicitly require banks to diversify their loan portfolios, stricter concentration limits effectively encourage banks to spread credit exposures across a broader range of borrowers and economic sectors (BCBS, 2024). As a result, loan diversification is becoming not only a strategic managerial decision but also an increasingly important response to regulatory changes. This policy shift raises an important empirical question: Does greater loan diversification necessarily improve credit quality, or can excessive diversification eventually increase credit risk?
The relationship between loan diversification and bank risk remains theoretically and empirically inconclusive. According to Modern Portfolio Theory (Markowitz, 1952), diversification reduces idiosyncratic risk by allocating assets across imperfectly correlated investments, implying that broader loan portfolios should enhance banking stability. Similar arguments have been developed in banking studies, suggesting that diversified lending reduces concentration risk and improves banks’ resilience against sector-specific shocks (Diamond, 1984). In contrast, the focus hypothesis argues that excessive diversification may weaken banks’ informational advantages and increase monitoring costs. Expanding lending into unfamiliar industries can reduce screening quality, intensify information asymmetry, and increase adverse selection problems, ultimately deteriorating loan quality (Winton, 1999; Acharya et al., 2006; Hayden et al., 2007; Elsas et al., 2010). Consequently, diversification may improve bank performance only up to a certain point, beyond which its benefits gradually diminish.
Empirical evidence on the relationship between loan portfolio diversification and credit risk remains inconclusive. While some studies find that diversification reduces concentration risk and improves loan portfolio quality (Hayden et al., 2007; Shim, 2019), others report insignificant or even adverse effects, suggesting that the benefits of diversification are not universal (Acharya et al., 2006; Huynh & Dang, 2022). One possible reason for these inconsistent findings is that most existing studies implicitly assume a linear relationship between diversification and credit risk, despite theoretical arguments indicating that diversification may involve a trade-off between risk dispersion and monitoring efficiency (Winton, 1999; Acharya et al., 2006). Consequently, whether diversification remains beneficial as banks expand lending across an increasing number of sectors remains an open empirical question, particularly in emerging banking markets such as Vietnam.
Against this background, this study examines the relationship between loan diversification and credit risk in Vietnamese commercial banks. Unlike previous studies that focus primarily on linear effects, this study explicitly investigates whether the impact of loan diversification is nonlinear and whether an optimal level of diversification exists. The study further contributes to the literature by providing evidence from Vietnam during a period of significant regulatory reform under the 2024 Law on Credit Institutions. The findings are expected to enrich the literature on bank diversification and credit risk while offering useful policy implications for commercial banks and regulators seeking to balance concentration risk and portfolio management efficiency.
The remainder of the paper is structured as follows. Section 2 reviews the relevant literature and develops research hypotheses. Section 3 presents the research methodology, data description and estimation method. Section 4 gives the model resultsand discussions, and Section 5 concludes the study and provides policy implications.
2. Literature Review and Hypothesis Development
2.1. Loan Portfolio Diversification and Credit Risk
Non-performing loans (NPLs) are widely regarded as the most direct indicator of banks’ credit risk because they reflect the deterioration of loan quality resulting from ineffective credit screening, monitoring, and risk management (Berger & DeYoung, 1997). High NPL ratios not only erode bank profitability and capital but also constrain lending activities and threaten financial stability (Louzis et al., 2012). Previous studies suggest that NPLs are influenced by both macroeconomic conditions and bank-specific factors, particularly the quality of borrower screening and loan monitoring (Berger & DeYoung, 1997; Louzis et al., 2012). Since loan portfolio diversification directly affects portfolio concentration, borrower selection, and monitoring activities, it has become an important strategy for managing credit risk. However, whether diversification consistently improves loan quality remains an open empirical question.
The traditional view is grounded in Modern Portfolio Theory (MPT), which argues that portfolio risk can be reduced by combining assets with imperfectly correlated returns (Markowitz, 1952). Applied to bank lending, diversification enables banks to spread credit exposures across sectors that respond differently to economic shocks, thereby reducing concentration risk and lowering the probability that a downturn in a single industry will trigger widespread loan defaults. Accordingly, a more diversified loan portfolio is expected to improve loan quality by reducing non-performing loans (NPLs) (Diamond, 1984; Winton, 1999). This perspective is also reflected in banking regulation. The Basel Committee on Banking Supervision identifies excessive credit concentration as one of the primary sources of credit losses and recommends portfolio diversification as a fundamental principle of prudent credit risk management (BCBS, 2000). Empirical studies generally support this view. For example, Elsas et al. (2010) show that diversification can improve banks’ risk-adjusted performance by reducing exposure to sector-specific shocks. Rossi et al. (2009) also report that greater loan portfolio diversification is associated with lower credit risk among Austrian banks. Shim (2019) finds that diversified loan portfolios are associated with lower bank risk, while Kamp et al. (2007) document that diversified banks experience lower volatility in non-performing loans and loan loss provisions than specialized banks, although specialized banks exhibit slightly higher profitability and lower average credit losses.
An alternative perspective, however, argues that diversification may weaken rather than improve loan quality. Building on the delegated monitoring framework of Diamond (1984), the Focus Hypothesis argues that banks develop valuable informational advantages through repeated lending relationships within particular industries or customer segments (Winton, 1999). Such specialization allows banks to better evaluate borrowers, monitor loan performance, and detect credit problems at an early stage. As banks expand lending into unfamiliar sectors, these informational advantages gradually diminish, making credit assessment more difficult. This argument is closely related to information asymmetry theory, which suggests that imperfect information between lenders and borrowers becomes more severe when banks lack industry-specific knowledge (Stiglitz & Weiss, 1981; Berger & Udell, 2002). Moreover, greater portfolio diversification increases organizational complexity and monitoring costs, potentially creating agency problems that weaken lending discipline (Jensen & Meckling, 1976; Cerasi & Daltung, 2000). Consistent with these theoretical arguments, Acharya et al. (2006) show that diversification across lending sectors reduces monitoring efficiency and lowers banks’ risk-adjusted performance. Similarly, Foos et al. (2010) find that rapid loan expansion is associated with significantly higher future loan losses, suggesting that aggressive portfolio expansion may lead to weaker lending standards and deteriorating loan quality. More recent evidence also suggests that the effectiveness of loan diversification depends on bank characteristics and the surrounding institutional environment rather than being universally beneficial. Using Vietnamese commercial banks, Huynh & Dang (2022) find that sectoral loan portfolio diversification is associated with lower profitability for many banks, although its effect varies across ownership structures and bank size, implying that diversification entails significant management and monitoring costs.
Taken together, the literature suggests that loan portfolio diversification influences non-performing loans through two competing mechanisms. Diversification initially improves loan quality by reducing credit concentration and limiting sector-specific default risk. However, as banks expand lending across increasingly diverse industries, the costs of information acquisition, borrower screening, and loan monitoring also increase. If these additional costs eventually outweigh the benefits of risk dispersion, the improvement in loan quality may diminish, implying that the relationship between diversification and NPLs is unlikely to remain constant across different levels of diversification.
Despite extensive research on loan portfolio diversification, two important gaps remain. First, most previous studies estimate the relationship between diversification and credit risk using linear specifications, implicitly assuming that the marginal effect of diversification remains constant regardless of the degree of portfolio diversification. Recent studies increasingly recognize that the outcomes of bank diversification are heterogeneous and may vary with bank-specific characteristics, competitive conditions, and risk profiles, suggesting that the marginal effect of diversification is unlikely to remain constant across banks. Second, empirical evidence from emerging banking systems remains relatively limited, particularly in Vietnam, where commercial banks have traditionally maintained concentrated lending portfolios and where the Law on Credit Institutions No. 32/2024/QH15 has introduced progressively tighter large-exposure limits, creating stronger incentives for banks to diversify their loan portfolios. These institutional changes provide a valuable setting to re-examine whether loan portfolio diversification consistently improves credit quality or whether its effect changes as diversification increases. Accordingly, this study investigates the relationship between loan portfolio diversification and non-performing loans in Vietnamese commercial banks while allowing for potential variation in the marginal effect of diversification.
2.2. Hypothesis Development
The preceding literature suggests that the relationship between loan portfolio diversification and credit risk is theoretically ambiguous. The diversification hypothesis argues that spreading credit exposures across different industries, borrower groups, and geographic regions reduces concentration risk and limits the impact of sector-specific shocks on banks’ loan portfolios (Markowitz, 1952; BCBS, 2000). By lowering the likelihood of simultaneous borrower defaults, diversification is expected to improve loan quality and reduce non-performing loans.
Conversely, the focus hypothesis suggests that excessive diversification may undermine banks’ informational advantages and weaken credit risk management. As banks expand lending into unfamiliar sectors, they incur higher information acquisition costs, face greater monitoring complexity, and may experience a deterioration in screening quality (Winton, 1999; Stiglitz & Weiss, 1981). These challenges can weaken lending standards and increase the probability of borrower default, ultimately leading to higher non-performing loans (Acharya et al., 2006).
Taken together, these arguments indicate that loan portfolio diversification exerts both beneficial and adverse effects on credit risk. Therefore, whether diversification improves or deteriorates loan quality remains an empirical issue.
H1: Loan portfolio diversification has a significant effect on the non-performing loan ratio of commercial banks.
Although the existing literature generally examines the relationship between loan portfolio diversification and credit risk using linear models, the underlying economic mechanisms suggest that the marginal effect of diversification may change as banks become increasingly diversified. At relatively low levels of diversification, the benefits of reducing concentration risk are likely to dominate, leading to improvements in loan quality. However, as diversification increases, banks face growing information asymmetry, higher monitoring costs, and greater organizational complexity. Consequently, the incremental benefits of diversification may diminish and eventually be offset by the additional costs associated with managing a highly diversified loan portfolio.
Accordingly, rather than assuming a constant marginal effect, this study argues that the impact of loan portfolio diversification on non-performing loans may vary across different levels of diversification.
H2: The marginal effect of loan portfolio diversification on the non-performing loan ratio varies with the degree of loan portfolio diversification.
3. Data and Methodology
3.1. Sample and Data Sources
This study employs a balanced panel dataset of 14 Vietnamese commercial banks over the period 2012–2025, yielding 196 bank-year observations. The sample was selected based on the availability of consistent disclosures on sectoral loan portfolios throughout the study period, which are required to construct the loan portfolio diversification index. Collectively, these banks account for approximately 75–80% of the total assets and outstanding loans of the Vietnamese banking system, ensuring a high degree of representativeness.
The study period covers fourteen years and captures several important phases of Vietnam’s banking development, including the post-restructuring period following banking sector reforms, a phase of stable economic growth, the COVID-19 pandemic, the corporate bond and real estate market downturn, and the implementation of the Law on Credit Institutions No. 32/2024/QH15. The new law gradually tightened limits on large credit exposures, thereby encouraging banks to diversify their loan portfolios and strengthen credit risk management.
Loan portfolio diversification is measured using the Shannon Entropy Index (SE), one of the most widely adopted indicators for capturing the degree of diversification in bank loan portfolios (Acharya et al., 2006; Hayden et al., 2007; Shim, 2019; Huynh & Dang, 2022). The index reflects the distribution of bank lending across different economic sectors and is calculated as follows:
where denotes the proportion of outstanding loans allocated to economic sector in the total loan portfolio of bank at time , and represents the number of economic sectors. A higher value of the Shannon Entropy Index indicates a more diversified loan portfolio, whereas a value closer to zero implies a higher degree of lending concentration. Compared with simple concentration measures, the Shannon Entropy Index captures both the number of lending sectors and the distribution of loan shares across sectors, making it particularly suitable for evaluating loan portfolio diversification in banking studies (Hayden et al., 2007; Shim, 2019).
Bank-specific financial data were collected from audited annual financial statements and accompanying notes disclosed on banks’ official websites. Macroeconomic variables, including GDP growth and inflation, were obtained from the General Statistics Office of Vietnam (GSO) and the World Development Indicators (WDI) database published by the World Bank.
Table 1 presents the definitions and measurements of the variables used in the empirical analysis. Credit risk is proxied by the non-performing loan ratio (NPL). Loan portfolio diversification is measured using the Shannon Entropy Index (SE), while its squared term (SE2) is included to capture potential nonlinear effects. Following the existing literature, the model also incorporates bank-specific characteristics (SIZE, CAP, CRG, and ROE) and macroeconomic conditions (GDP and INF) as control variables.
3.2. Empirical Model
To examine the impact of loan portfolio diversification on bank credit risk, the following baseline empirical model is specified:
where denotes the non-performing loan ratio of the bank in year ; is the Shannon Entropy Index measuring loan portfolio diversification; is the squared diversification term included to capture potential nonlinear effects; , , , and represent bank-specific control variables; and denote annual GDP growth and inflation, respectively. The term captures unobserved bank-specific effects, while is the idiosyncratic error term.
To account for the persistence of credit risk and potential endogeneity arising from reverse causality and omitted variables, the baseline model is extended into a dynamic panel specification by incorporating the lagged dependent variable:
The inclusion of the lagged dependent variable reflects the persistence of non-performing loans over time, as current credit risk is likely to be influenced by its historical level (Louzis et al.,2012). The dynamic specification also provides a more appropriate framework for estimating the effect of loan portfolio diversification while mitigating potential endogeneity bias. Consequently, the model is estimated using the two-step System Generalized Method of Moments (System GMM), which is well suited for dynamic panel data with potential endogeneity and unobserved bank-specific heterogeneity.
3.3. Estimation Method
This study estimates the proposed model using Pooled OLS, Fixed Effects Model (FEM), Random Effects Model (REM), and the two-step System Generalized Method of Moments (System GMM). While the first three estimators are employed for comparison purposes, the two-step System GMM estimator developed by Arellano and Bover (1995) and Blundell and Bond (1998) is adopted as the primary estimation method because it effectively addresses unobserved heterogeneity, endogeneity, heteroskedasticity, serial correlation, and the dynamic persistence of credit risk.
Prior to model estimation, diagnostic tests indicate the presence of heteroskedasticity and first-order serial correlation in the panel data, suggesting that conventional static panel estimators may yield inefficient estimates. In addition, although the Hausman test supports the use of the random-effects specification, neither FEM nor REM adequately addresses the potential endogeneity between loan portfolio diversification and credit risk. Therefore, the System GMM estimator is employed as the main estimation approach.
The validity of the estimated System GMM model is confirmed by the diagnostic tests. The Arellano–Bond test indicates no evidence of second-order serial correlation (AR(2), p = 0.237), while the Hansen test fails to reject the null hypothesis of instrument validity (p = 0.147). Furthermore, the number of instruments (13) is lower than the number of cross-sectional units (14), indicating that instrument proliferation is unlikely to affect the estimation results. These diagnostic statistics confirm that the System GMM estimator is appropriate for the empirical analysis.
4. Model Result and Discussion
4.1. Preliminary Analysis
Table 2 reports the descriptive statistics of the variables used in the study. The sample consists of 196 bank-year observations from 14 Vietnamese commercial banks over the period 2012–2025. The average non-performing loan ratio (NPL) is 2.12%, with values ranging from 0.47% to 8.83%, indicating considerable variation in credit risk across banks and over time. The mean value of the Shannon Entropy Index (SE) is 1.554, suggesting that the sampled banks generally maintain relatively diversified loan portfolios, although the observed range indicates noticeable differences in diversification strategies. The control variables also exhibit substantial variation, particularly bank size, credit growth, and profitability, reflecting the heterogeneity of the Vietnamese banking sector. Overall, the descriptive statistics indicate sufficient cross-sectional and time-series variation to support the subsequent panel data analysis.
Table 3 reports the Pearson correlation matrix of the study variables. The high correlation between SE and SE2 is expected because the quadratic term is constructed directly from the original variable. This phenomenon is commonly referred to as structural (or nonessential) multicollinearity and is inherent in polynomial regression models rather than indicating a specification problem (Aiken & West, 1991). Consequently, both variables are retained to test the potential nonlinear relationship between loan portfolio diversification and credit risk.
4.2. Estimation Results
Table 4 reports the estimation results obtained from the four estimation techniques. While Pooled OLS, FEM, and REM are estimated for comparison purposes, the two-step System GMM estimator serves as the primary specification because it addresses endogeneity, unobserved heterogeneity, and the dynamic persistence of credit risk. Overall, the estimated coefficients are broadly consistent across the four models, with the signs of the key variables remaining stable.
The lagged dependent variable exhibits a positive and highly significant coefficient (β = 0.650, p < 0.01), confirming the persistence of non-performing loans over time. This finding suggests that current credit risk is strongly influenced by historical loan quality, highlighting the importance of adopting a dynamic estimation framework. The result is consistent with previous banking studies that document the persistent nature of non-performing loans.
The coefficients of SE and SE2 represent the main findings of this study. The coefficient of SE is negative and statistically significant at the 10% level (β = –0.080, p < 0.10), while the coefficient of SE2 is positive and also significant at the 10% level (β = 0.031, p < 0.10). The opposite signs of the linear and quadratic terms indicate a nonlinear relationship between loan portfolio diversification and credit risk. Specifically, the results suggest that the marginal effect of diversification changes as the degree of diversification increases. At relatively low levels of diversification, greater diversification is associated with a lower non-performing loan (NPL) ratio. The estimated turning point is 1.316, indicating that the beneficial effect of diversification on credit risk diminishes beyond this level. Thereafter, further diversification is associated with a higher NPL ratio, providing evidence of a U-shaped relationship between loan portfolio diversification and credit risk.
Figure 1 illustrates the estimated U-shaped relationship between loan portfolio diversification (SE) and the non-performing loan ratio (NPL). The turning point (SE = 1.316) lies within the observed range of the data, indicating that the nonlinear relationship is economically meaningful rather than merely a statistical artifact.
Notably, the nonlinear relationship is statistically significant only under the two-step System GMM estimator. In contrast, the coefficients of SE and SE2 are insignificant in the Pooled OLS, FEM, and REM estimations. This finding suggests that the nonlinear effect is more reliably identified after accounting for endogeneity, unobserved bank-specific heterogeneity, and the dynamic persistence of non-performing loans. Among the control variables, inflation (INF) remains statistically significant across most model specifications, whereas the remaining bank-specific variables are insignificant in the preferred System GMM model.
Among the control variables, inflation (INF) remains the only statistically significant determinant of credit risk in the preferred System GMM model (β = 0.065, p < 0.10), although its significance declines compared with the Pooled OLS, FEM, and REM estimations. By contrast, bank size (SIZE), capital ratio (CAP), credit growth (CRG), profitability (ROE), and GDP growth (GDP) are statistically insignificant after controlling for endogeneity and dynamic effects.
4.3. Discussion
The empirical findings provide several important insights into the determinants of credit risk in Vietnamese commercial banks.
First, the positive and highly significant coefficient of the lagged dependent variable confirms the strong persistence of non-performing loans. This finding indicates that current credit risk is strongly influenced by its historical level, implying that the accumulation and resolution of non-performing loans are gradual rather than instantaneous processes. Once problem loans emerge, they often remain on banks’ balance sheets for several periods due to lengthy restructuring procedures, legal constraints in collateral recovery, and persistent weaknesses in borrowers’ financial conditions. Consequently, past loan quality continues to shape current credit risk. This result is consistent with Louzis et al. (2012) and highlights the importance of modelling credit risk within a dynamic framework, where ignoring persistence may lead to biased estimates of the effects of bank-specific characteristics.
Second, the study provides robust evidence of a nonlinear relationship between loan portfolio diversification and credit risk. The negative coefficient of the Shannon Entropy Index (SE), together with the positive coefficient of its squared term (SE2), indicates a U-shaped relationship between diversification and the non-performing loan ratio. This finding suggests that the impact of diversification is conditional rather than uniformly beneficial. At relatively low levels of diversification, expanding lending across economic sectors reduces exposure to sector-specific shocks and mitigates concentration risk, thereby improving overall portfolio quality. This result is consistent with the predictions of Modern Portfolio Theory (Markowitz, 1952), which argues that diversification enhances risk-adjusted portfolio performance by reducing unsystematic risk.
However, the results also demonstrate that the benefits of diversification are subject to diminishing returns. As banks continue to expand lending into a wider range of industries, they face increasing information acquisition costs, greater heterogeneity among borrowers, and higher monitoring complexity. Unlike concentrated lending, highly diversified portfolios require banks to develop expertise across multiple industries with different business cycles, regulatory environments, and risk characteristics. This may weaken banks’ informational advantages, reduce the effectiveness of borrower screening and post-lending supervision, and ultimately increase credit risk. These findings support the focus hypothesis proposed by Winton (1999) and Acharya et al. (2006), which argues that excessive diversification can impair banks’ monitoring efficiency and offset the benefits of risk dispersion. Therefore, diversification should not be viewed as an objective in itself but rather as a strategy whose effectiveness depends on its degree.
The estimated turning point (SE* = 1.316) provides additional economic insight into this nonlinear relationship. Importantly, this threshold lies within the observed range of the diversification index, indicating that the U-shaped relationship is economically meaningful rather than merely a statistical artifact. Moreover, the average diversification level of Vietnamese commercial banks exceeds this threshold, suggesting that many banks may already operate in the region where additional diversification generates limited risk-reduction benefits. Rather than continuing to expand lending across increasingly diverse sectors, banks may achieve better credit quality by strengthening sector-specific expertise, improving borrower screening procedures, and enhancing post-lending monitoring systems. These findings imply that the objective of loan portfolio management should be to identify an optimal level of diversification rather than simply maximizing diversification.
Third, inflation is the only control variable that remains statistically significant in the preferred System GMM specification. The positive relationship indicates that adverse macroeconomic conditions continue to play an important role in determining bank credit risk. Rising inflation increases production costs for firms while simultaneously reducing households’ real purchasing power, thereby weakening borrowers’ debt-servicing capacity and increasing the probability of loan default. This mechanism may be particularly relevant in Vietnam, where bank lending remains concentrated in small and medium-sized enterprises and household borrowers that are relatively vulnerable to macroeconomic fluctuations. The finding therefore reinforces previous evidence that inflation is an important macroeconomic driver of banking sector vulnerability (Nkusu, 2011).
Finally, the remaining bank-specific variables—including bank size, capital ratio, credit growth, profitability, and GDP growth—are not statistically significant once endogeneity and the persistence of non-performing loans are explicitly controlled for. This does not necessarily imply that these variables are irrelevant for credit risk. Rather, it suggests that their contemporaneous effects are relatively small compared with the strong dynamic persistence of loan quality. Credit risk typically evolves through cumulative lending decisions and borrower behaviour over multiple periods, meaning that current bank characteristics may exert only limited additional explanatory power after historical credit risk has been incorporated into the model. Similar conclusions have been reported in dynamic panel studies of banking risk, where the inclusion of lagged non-performing loans substantially reduces the significance of several conventional bank-specific determinants (Tabak et al., 2011; Louzis et al., 2012).
Overall, the findings challenge the conventional assumption that greater loan portfolio diversification necessarily improves bank asset quality. Instead, the results indicate that diversification exhibits diminishing marginal benefits and becomes counterproductive beyond an optimal level. This study therefore contributes to the banking literature by demonstrating that effective credit risk management should emphasize optimal diversification rather than maximum diversification. For Vietnamese commercial banks, maintaining an appropriate balance between risk dispersion and monitoring capability appears to be more important than continuously expanding lending across an increasing number of economic sectors.
5. Conclusion
This study examines the nonlinear relationship between loan portfolio diversification and credit risk in Vietnamese commercial banks over the period 2012–2025 using the two-step System GMM estimator. By incorporating both the Shannon Entropy Index (SE) and its squared term, the study extends the existing literature by investigating whether the effect of diversification on credit risk varies with the degree of diversification.
The empirical results show that credit risk exhibits strong persistence over time. More importantly, loan portfolio diversification has a significant U-shaped relationship with the non-performing loan ratio. While moderate diversification reduces credit risk by mitigating sectoral concentration, excessive diversification increases credit risk as the benefits of risk dispersion are outweighed by higher monitoring costs and information asymmetry. The estimated turning point further suggests that diversification improves loan quality only up to an optimal level. Among the control variables, inflation remains the only significant determinant of credit risk in the preferred System GMM model.
These findings contribute to the banking literature by providing empirical evidence that the diversification–credit risk relationship is nonlinear rather than uniformly beneficial in an emerging banking market. The results also have important practical implications. Rather than maximizing diversification, commercial banks should aim to achieve an optimal degree of loan portfolio diversification while strengthening sector-specific credit assessment, borrower monitoring, and portfolio management. For policymakers, enhancing banks’ risk management capabilities may be more effective than encouraging broad credit expansion across industries.
Although the study provides robust evidence of a nonlinear relationship between loan portfolio diversification and credit risk, several limitations should be acknowledged. First, loan portfolio diversification is measured only by sectoral diversification using the Shannon Entropy Index, which does not capture other dimensions of diversification such as borrower characteristics, geographical distribution, or loan maturity. Second, the analysis focuses exclusively on Vietnamese commercial banks, which may limit the generalizability of the findings to other countries or banking systems. Future research could employ alternative diversification measures, conduct cross-country comparisons, or examine whether factors such as digital transformation, macroprudential policies, or institutional quality influence the nonlinear relationship between loan portfolio diversification and credit risk.
Funding statement
This work was financially supported by the Banking Academy of Vietnam (Grant Number: 241/NQ-HĐHV).
Institutional Review Board Statement
Not applicable.
Informed Consent Statement
Not applicable.
Data availability statement
The data presented in this study are available from the corresponding author upon reasonable request. The dataset was manually compiled from publicly available annual reports of Vietnamese commercial banks, the State Bank of Vietnam, and publicly available macroeconomic sources. The research dataset includes variables that were processed and constructed by the authors for the purposes of this study and is therefore not publicly available.
Conflicts of Interest
The authors declare no conflicts of interest.
Acknowledgments
We are grateful to the Banking Academy of Vietnam for the financial support. During the preparation of this manuscript/study, the authors used ChatGPT for language editing to improve the grammar, clarity, and readability of the manuscript. It was not used to generate scientific content, analyze data, interpret results, or draw conclusions. All research design, analyses, interpretations, and conclusions were developed and verified by the authors, who take full responsibility for the manuscript.
References
- Acharya, V. V.; Hasan, I.; Saunders, A. Should banks be diversified? Evidence from individual bank loan portfolios. J. Bus. 2006, 79(3), 1355–1412. [Google Scholar] [CrossRef]
- Aiken, L. S.; West, S. G. Multiple Regression: Testing and Interpreting Interactions; Sage Publications, 1991. [Google Scholar]
- Arellano, M.; Bover, O. Another look at the instrumental variable estimation of error-components models. J. Econom. 1995, 68(1), 29–51. [Google Scholar] [CrossRef]
- Basel Committee on Banking Supervision. Principles for the Management of Credit Risk. Bank for International Settlements, 2000. [Google Scholar]
- Basel Committee on Banking Supervision. Core Principles for Effective Banking Supervision. In Bank for International Settlements; 2024. [Google Scholar]
- Beck, R.; Jakubík, P.; Piloiu, A. Key determinants of non-performing loans: New evidence from a global sample. Open Econ. Rev. 2015, 26(3), 525–550. [Google Scholar] [CrossRef]
- Berger, A. N.; Udell, G. F. Small business credit availability and relationship lending: The importance of bank organisational structure. Econ. J. 2002, 112(477), F32–F53. [Google Scholar] [CrossRef]
- Berger, A. N.; DeYoung, R. Problem loans and cost efficiency in commercial banks. J. Bank. Financ. 1997, 21(6), 849–870. [Google Scholar] [CrossRef]
- Blundell, R.; Bond, S. Initial conditions and moment restrictions in dynamic panel data models. J. Econom. 1998, 87(1), 115–143. [Google Scholar] [CrossRef]
- Cerasi, V.; Daltung, S. The optimal size of a bank: Costs and benefits of diversification. Eur. Econ. Rev. 2000, 44(9), 1701–1726. [Google Scholar] [CrossRef]
- Diamond, D. W. Financial intermediation and delegated monitoring. Rev. Econ. Stud. 1984, 51(3), 393–414. [Google Scholar] [CrossRef]
- Elsas, R.; Hackethal, A.; Holzhäuser, M. The anatomy of bank diversification. J. Bank. Financ. 2010, 34(6), 1274–1287. [Google Scholar] [CrossRef]
- Foos, D.; Norden, L.; Weber, M. Loan growth and riskiness: Evidence from individual banks. J. Bank. Financ. 2010, 34(12), 2929–2940. [Google Scholar] [CrossRef]
- Hayden, E.; Porath, D.; von Westernhagen, N. Does Diversification Improve the Performance of German Banks? Evidence from Individual Bank Loan Portfolios. J. Financ. Serv. Res. 2007, 32(3), 123–140. [Google Scholar] [CrossRef]
- Huynh, J.; Dang, V. D. Exploring the asymmetric effects of loan portfolio diversification on bank profitability. J. Econ. Asymmetries 26 2022, e00250. [Google Scholar] [CrossRef]
- International Monetary Fund. Global Financial Stability Report: COVID-19, preemptive policies, and avoiding a new wave of financial instability. 2021. Available online: https://www.imf.org/en/Publications/GFSR/Issues/2021/04/06/global-financial-stability-report-april-2021.
- Jensen, M. C.; Meckling, W. H. Theory of the firm: Managerial behavior, agency costs and ownership structure. J. Financ. Econ. 1976, 3(4), 305–360. [Google Scholar] [CrossRef]
- Kamp, A.; Pfingsten, A.; Porath, D. Do banks diversify loan portfolios? J. Financ. Serv. Res. 2007, 32(3), 132–153. [Google Scholar] [CrossRef]
- Klein, N. Non-performing loans in CESEE: Determinants and impact on macroeconomic performance. In IMF Working Paper; 2013; p. 13/72. [Google Scholar]
- Louzis, D. P.; Vouldis, A. T.; Metaxas, V. L. Determinants of non-performing loans in the Greek banking sector. Manag. Financ. 2012, 38(11), 1012–1027. [Google Scholar] [CrossRef]
- Markowitz, H. Portfolio selection. J. Financ. 1952, 7(1), 77–91. [Google Scholar] [CrossRef]
- National Assembly of Vietnam. Law on Credit Institutions No. 32/2024/QH15; 2024.
- Nkusu, M. Nonperforming loans and macrofinancial vulnerabilities in advanced economies; IMF Working Paper No. 11/161; International Monetary Fund, 2011. [Google Scholar]
- Organisation for Economic Co-operation and Development. OECD Economic Surveys: Viet Nam 2025; OECD Publishing, 2025. [Google Scholar]
- Rossi, S. P. S.; Schwaiger, M. S.; Winkler, G. How loan portfolio diversification affects risk, efficiency and capitalization: A managerial behavior model for Austrian banks. J. Bank. Financ. 2009, 33(12), 2218–2226. [Google Scholar] [CrossRef]
- Shim, J. Loan portfolio diversification, market structure and bank stability. J. Bank. Financ. 104 2019, 103–115. [Google Scholar] [CrossRef]
- Stiglitz, J. E.; Weiss, A. Credit rationing in markets with imperfect information. Am. Econ. Rev. 1981, 71(3), 393–410. [Google Scholar]
- Tabak, B. M.; Fazio, D. M.; Cajueiro, D. O. The effects of loan portfolio concentration on Brazilian banks’ returns and risk. J. Bank. Financ. 2011, 35(11), 3065–3076. [Google Scholar] [CrossRef]
- Winton, A. Don’t put all your eggs in one basket? Diversification and specialization in lending; (NBER Working Paper No. 7255); National Bureau of Economic Research, 1999. [Google Scholar] [CrossRef]
Figure 1.
The Relationship Between Loan Portfolio Diversification (SE) and the Non-Performing Loan Ratio (NPL) of Vietnamese Commercial Banks, 2012–2025. Source: Authors’ calculation.
Figure 1.
The Relationship Between Loan Portfolio Diversification (SE) and the Non-Performing Loan Ratio (NPL) of Vietnamese Commercial Banks, 2012–2025. Source: Authors’ calculation.
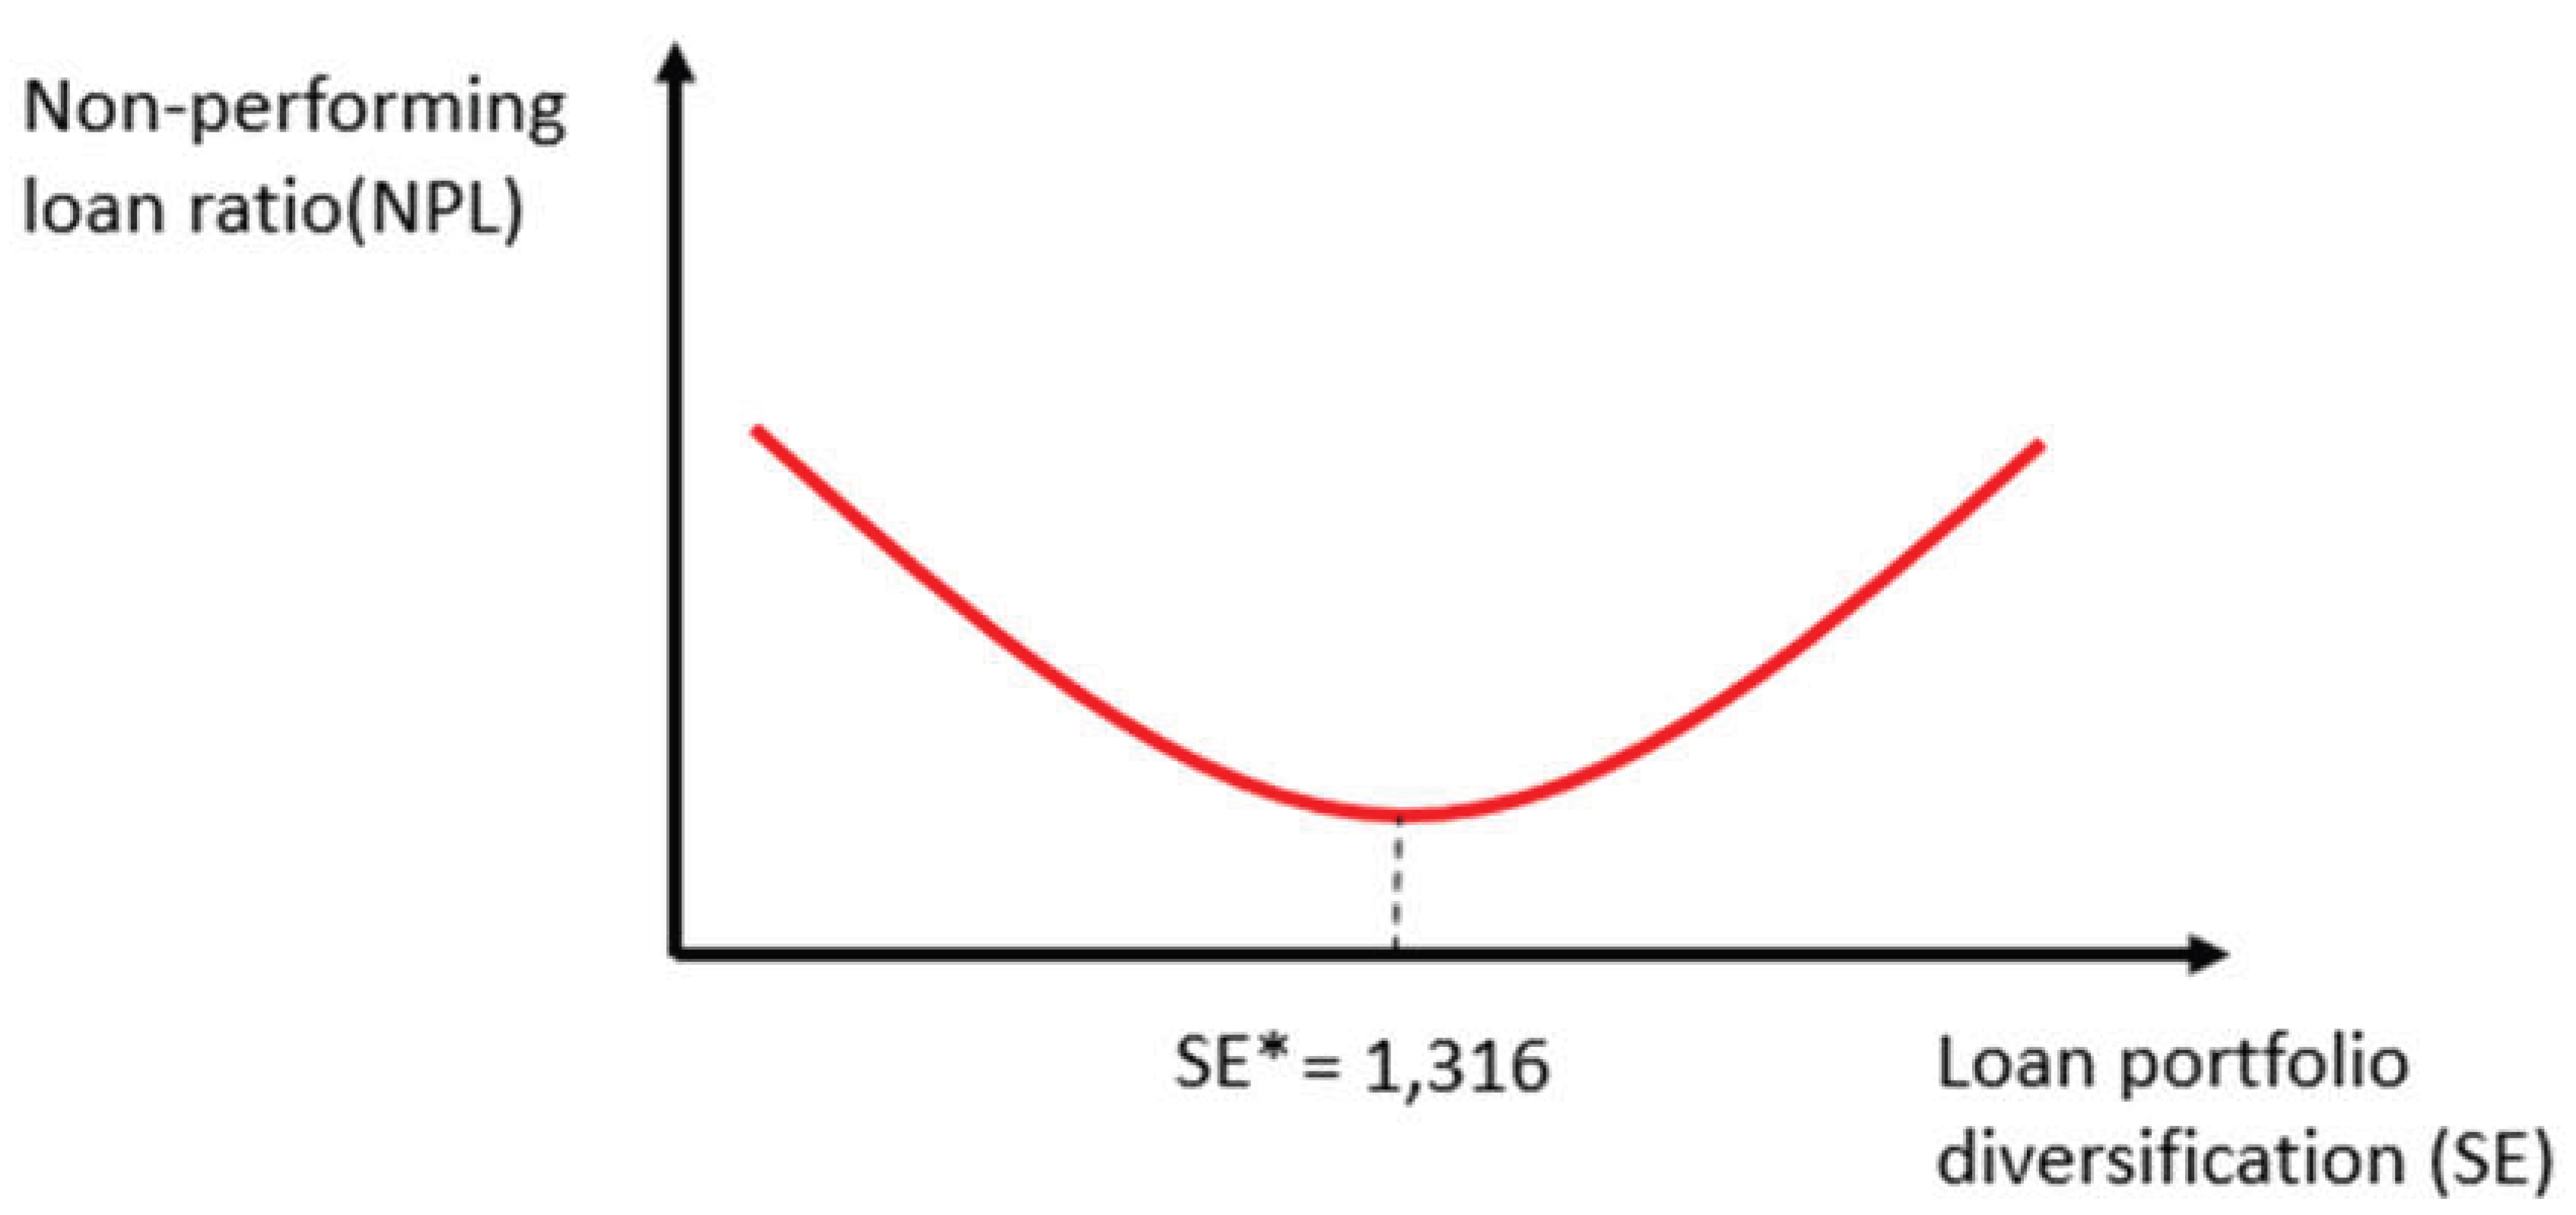

Table 1.
Variable definitions.
| Variable | Symbol | Measurement | Expected sign | References |
| Non-performing loan ratio | NPL | Non-performing loans (Non-performing loans / Total loans | Dependent | Berger & DeYoung (1997); Louzis et al. (2012) |
| Loan portfolio diversification | SE | Shannon Entropy Index | – | Acharya et al., 2006; Shim, 2019; Huynh & Dang, 2022 |
| Diversification squared | SE2 | Square of Shannon Entropy Index | N/A | |
| Bank size | SIZE | ln(Total assets) | ± | Louzis et al. (2012) |
| Capital ratio | CAP | Equity / Total assets | – | Berger & DeYoung (1997) |
| Credit growth | CRG | Annual growth rate of total loans | + | Foos et al. (2010) |
| Profitability | ROE | Net income / Equity | – | Louzis et al. (2012) |
| GDP growth | GDP | Annual GDP growth (%) | – | Louzis et al. (2012) |
| Inflation | INF | Annual inflation rate (%) | + | Nkusu (2011), Klein (2013) |
Source: Authors’ synthesis.
Table 2.
Descriptive analysis.
| Variable | Mean | Std. dev. | Min | Max | Observations | |
| NPL | Overall | 0.0211721 | 0.0119288 | 0.0046662 | 0.0882669 | N = 196 |
| SE | Overall | 1.553601 | 0.2418758 | 0.5842355 | 1.973909 | N = 196 |
| SE2 | Overall | 2.471882 | 0.6679987 | 0.3413312 | 3.896317 | N = 196 |
| SIZE | Overall | 12.73159 | 1.191186 | 9.623798 | 15.01875 | N = 196 |
| CAP | Overall | 0.0862478 | 0.0319937 | 0.0406177 | 0.2195059 | N = 196 |
| CRG | Overall | 0.2123516 | 0.1637409 | -0.2333325 | 1.081994 | N = 196 |
| ROE | Overall | 0.1345908 | 0.0628816 | 0.0062947 | 0.3240667 | N = 196 |
| GDP | Overall | 0.0600857 | 0.0160239 | 0.0258 | 0.0802 | N = 196 |
| INF | Overall | 0.0378429 | 0.0192511 | 0.0063 | 0.0921 | N = 196 |
Source: Authors’ calculation.
Table 3.
Correlation matrix.
| NPL | SE | SE2 | SIZE | CAP | CRG | ROE | GDP | INF | |
| NPL | 1.0000 | ||||||||
| SE | 0.0313 0.6627 |
1.0000 | |||||||
| SE2 | 0.0446 0.5344 |
0.9875 0.0000 |
1.0000 | ||||||
| SIZE | -0.3482 0.0000 |
-0.1524 0.0329 |
-0.1926 0.0068 |
1.0000 | |||||
| CAP | 0.3005 0.0000 |
-0.0341 0.6347 |
-0.0493 0.4925 |
-0.3794 0.0000 |
1.0000 | ||||
| CRG | 0.0772 0.2820 |
0.0602 0.4016 |
0.0746 0.2990 |
-0.2326 0.0010 |
0.0858 0.2320 |
1.0000 | |||
| ROE | -0.3393 0.0000 |
-0.2702 0.0001 |
-0.2363 0.0009 |
0.5200 0.0000 |
-0.1485 0.0378 |
0.0577 0.4219 |
1.0000 | ||
| GDP | -0.0131 0.8555 |
-0.0006 0.9936 |
-0.0174 0.8084 |
0.0808 0.2600 |
-0.0232 0.7468 |
0.0098 0.8914 |
0.0349 0.6272 |
1.0000 | |
| INF | 0.3846 0.0000 |
-0.0271 0.7058 |
-0.0432 0.5477 |
-0.2617 0.0002 |
0.0817 0.2550 |
0.1081 0.1316 |
-0.2379 0.0008 |
-0.0547 0.4465 |
1.0000 |
Source: Authors’ calculation.
Table 4.
Estimation results.
| (1) | (2) | (3) | (4) | |
| VARIABLES | OLS | FEM | REM | GMM |
| NPL = L, | 0.650*** | |||
| (0.154) | ||||
| SE | -0.0705*** | -0.0229 | -0.0291 | -0.0803* |
| (0.0229) | (0.0240) | (0.0230) | (0.0378) | |
| SE2 | 0.0254*** | 0.0106 | 0.0122 | 0.0305* |
| (0.00828) | (0.00872) | (0.00833) | (0.0149) | |
| SIZE | 0.000580 | -0.000791 | -0.000456 | 0.00148 |
| (0.000936) | (0.00135) | (0.00117) | (0.00142) | |
| CAP | 0.101*** | 0.122*** | 0.117*** | 0.00812 |
| (0.0256) | (0.0281) | (0.0261) | (0.0382) | |
| CRG | 0.00215 | 0.00499 | 0.00458 | -0.00817 |
| (0.00470) | (0.00438) | (0.00424) | (0.0136) | |
| ROE | -0.0579*** | -0.0205 | -0.0261* | -0.0285 |
| (0.0158) | (0.0157) | (0.0150) | (0.0211) | |
| GDP | 0.0303 | 0.0234 | 0.0233 | 0.0269 |
| (0.0456) | (0.0372) | (0.0367) | (0.0189) | |
| INF | 0.202*** | 0.198*** | 0.200*** | 0.0653 |
| (0.0402) | (0.0348) | (0.0337) | (0.0376) | |
| Constant | 0.0498*** | 0.0230 | 0.0254 | 0.0370* |
| (0.0152) | (0.0223) | (0.0197) | (0.0174) | |
| Observations | 196 | 196 | 196 | 182 |
| R-squared | 0.311 | 0.347 | ||
| Number of bank_id | 14 | 14 | 14 |
Standard errors in parentheses. *** p<0.01, ** p<0.05, * p<0.1. Source: Authors’ calculation.
Disclaimer/Publisher’s Note: The statements, opinions and data contained in all publications are solely those of the individual author(s) and contributor(s) and not of MDPI and/or the editor(s). MDPI and/or the editor(s) disclaim responsibility for any injury to people or property resulting from any ideas, methods, instructions or products referred to in the content. |
© 2026 by the authors. Licensee MDPI, Basel, Switzerland. This article is an open access article distributed under the terms and conditions of the Creative Commons Attribution (CC BY) license (http://creativecommons.org/licenses/by/4.0/).
Copyright: This open access article is published under a Creative Commons CC BY 4.0 license, which permit the free download, distribution, and reuse, provided that the author and preprint are cited in any reuse.


