

Submitted:
31 July 2026
Posted:
04 August 2026
You are already at the latest version
Abstract
Background/Objectives: Type 1 diabetes mellitus (T1DM) has historically been associated with impaired linear growth and delayed pubertal development due to chronic insulin deficiency. Advances in intensive insulin therapy and glucose monitoring may have substantially reduced these effects. This study evaluated growth and pubertal development in children with T1DM treated with multiple daily injections (MDI) or continuous subcutaneous insulin infusion (CSII) compared with healthy controls and investigated whether metabolic control was associated with anthropometric outcomes. Methods: This retrospective observational study included 177 children aged 3–18 years: 102 with T1DM (60 treated with MDI and 42 with CSII) and 75 healthy controls. Height SDS, BMI SDS, Tanner stage, biochemical parameters, and diabetes-related variables were analyzed. Comparisons, correlations and multiple linear regression analyses were performed to evaluate associations between metabolic control and anthropometric parameters. Results: No significant differences were observed between children with T1DM and healthy controls regarding height SDS, BMI SDS, or pubertal development. Likewise, no anthropometric differences were identified between the MDI and CSII groups. Fasting plasma glucose was significantly lower in the CSII group (p<0.001), whereas HbA1c was comparable between treatment modalities. Neither HbA1c nor other routinely assessed metabolic parameters showed significant associations with height SDS or BMI SDS in correlation or multivariable regression analyses. Conclusions: Children and adolescents with T1DM achieved growth and pubertal development comparable to healthy peers, regardless of insulin treatment modality. Routine markers of metabolic control were not independently associated with anthropometric outcomes, suggesting that contemporary intensive diabetes management is sufficient to preserve normal growth in most pediatric patients with T1DM.
Keywords:
continuous subcutaneous insulin infusion
; glycated hemoglobin
; insulin pump therapy
; linear growth
; metabolic control
; multiple daily injections
; pediatric diabetes
; pubertal development
; type 1 diabetes mellitus
1. Introduction
Type 1 diabetes mellitus (T1DM) is one of the most common chronic diseases of childhood and adolescence, resulting from autoimmune destruction of pancreatic β-cells and subsequent absolute insulin deficiency [1,2,3]. Its incidence has increased steadily worldwide over the past two decades, with recent systematic reviews reporting a continued rise across Europe and other regions, making T1DM an increasingly important public health concern in pediatric populations [4,5,6].
Beyond its effects on glucose metabolism, insulin is a key anabolic hormone required for normal childhood growth and development. Together with growth hormone and insulin-like growth factor-1, insulin regulates longitudinal bone growth, protein synthesis, and normal pubertal maturation. In untreated or poorly controlled T1DM, portal insulin deficiency reduces hepatic IGF-1 production, alters the GH–IGF-1 axis, and may impair growth velocity and pubertal progression [7,8,9,10]. Historically, children with T1DM frequently exhibited delayed puberty, reduced adult height, and, in severe cases, growth failure associated with prolonged metabolic decompensation [10,11,12].
However, the management of pediatric T1DM has changed profoundly over recent decades. Intensive insulin therapy, rapid- and long-acting insulin analogues, continuous glucose monitoring, and continuous subcutaneous insulin infusion (CSII) have substantially improved glycemic control and reduced the burden of chronic hyperglycemia [13,14,15,16,17,18,19,20,21]. Current ISPAD Clinical Practice Consensus Guidelines emphasize that, when adequate metabolic control is achieved, most children and adolescents with T1DM are expected to attain normal linear growth and pubertal development [22]. Nevertheless, the available evidence remains heterogeneous. While older studies consistently reported impaired growth, more recent investigations suggest that these abnormalities have become considerably less frequent in the era of modern diabetes management, although concerns remain regarding the potential influence of persistent hyperglycemia, diabetes duration, and treatment modality on growth outcomes [16,17,22].
In addition, insulin pump therapy has been associated with improved glycemic control, increased time in range, and lower glycemic variability compared with multiple daily injections (MDI), but whether these metabolic advantages translate into measurable differences in growth and pubertal development remains uncertain [14,17,18,19]. Data directly comparing anthropometric outcomes between contemporary MDI- and CSII-treated pediatric cohorts are still limited.
Therefore, the present study aimed to evaluate growth and pubertal development in children and adolescents with T1DM receiving either MDI or CSII compared with healthy controls and to investigate whether metabolic control and diabetes-related clinical characteristics are independently associated with anthropometric outcomes in a contemporary pediatric cohort.
2. Materials and Methods
2.1. Study Design
This retrospective, observational, analytical study performed statistical analysis on a clinical database derived from routine medical practice. The study was conducted at the Department of Pediatrics of "Pius Brînzeu" Emergency Clinical County Hospital, Timișoara, Romania, by retrospectively reviewing the medical records of pediatric patients hospitalized between 2016 and 2025.
The local Research Ethics Committee of the "Pius Brînzeu" Emergency Clinical County Hospital, Timișoara has approved the study in accordance with the Helsinki Declaration (No. 600/12.02.2026).
2.2. Study Population and Inclusion Criteria
A total of 177 children aged 3–18 years were included and divided into three study groups:
- Control group: 75 children without T1DM;
- MDI group: 60 children with T1DM receiving multiple daily insulin injections;
- CSII group: 42 children with T1DM treated with continuous subcutaneous insulin infusion.
Inclusion Criteria:
Children aged between 3 and 18 years were eligible for inclusion.
Patients in the T1DM groups were required to have a confirmed diagnosis of type 1 diabetes for at least one year and to have been treated either with multiple daily insulin injections since diagnosis or with insulin pump therapy for at least six months. Control participants had no diagnosis of T1DM or other chronic diseases. Complete data regarding anthropometric measurements and HbA1c were required for inclusion.
Exclusion criteria included:
- chronic diseases known to affect growth and development (e.g., endocrine or genetic disorders);
- diabetes types other than T1DM;
- incomplete medical records;
- chronic treatments potentially affecting growth (e.g., long-term corticosteroid therapy).
2.3. Data Collection
The following demographic and clinical variables were collected for all participants:
age (years);
- sex;
- place of residence (urban/rural);
- body weight (kg);
- height (cm) and height standard deviation score (height SDS);
- body mass index (BMI, kg/m²) and BMI standard deviation score (BMI SDS);
- pubertal development according to Tanner staging;
- blood parameters: fasting plasma glucose (mg/dL), serum creatinine (mg/dL), estimated glomerular filtration rate (eGFR, mL/min/1.73 m²), aspartate aminotransferase (AST), alanine aminotransferase (ALT).
For children with T1DM, the following diabetes-related variables were additionally recorded:
- diabetes duration (years);
- insulin treatment modality (MDI or CSII);
- glycated hemoglobin (HbA1c %), total cholesterol, HDL cholesterol, LDL cholesterol, and triglycerides (mg/dL);
- diabetes-related comorbidities (overweight/obesity, hepatic steatosis, diabetic nephropathy, and insulin injection-site lipodystrophy) or associated autoimmune diseases (autoimmune thyroiditis, celiac disease).
For patients receiving insulin pump therapy, continuous glucose monitoring derived metrics were also analyzed, including:
- time in range (TIR, 70–180 mg/dL);
- coefficient of variation (CV);
- time spent in level 1 hypoglycemia -54–70 mg/dL;
- time spent in level 2 hypoglycemia -40–54 mg/dL;
- time spent in hyperglycemia - 180–250 mg/dL;
- time spent in hyperglycemia -250–400 mg/dL;
Metabolic variables and diabetes-associated autoimmune diseases were evaluated exclusively in participants with T1DM and were analyzed descriptively rather than as primary study outcomes.
Height SDS and BMI SDS were calculated using the LMS parameters derived from the Centers for Disease Control and Prevention 2000 growth charts, adjusted for age and sex [23].
2.5. Statistical Analysis
Data were entered into Microsoft Excel and analyzed using MedCalc Statistical Software version 20.111 (MedCalc Software Ltd., Ostend, Belgium) and DATAtab: Online Statistics Calculator (Graz, Austria).
Comparisons among the three study groups focused primarily on anthropometric parameters and pubertal development. Statistical analyses also evaluated the influence of insulin treatment modality and metabolic control on growth-related outcomes.
The distribution of continuous variables was assessed using the Shapiro–Wilk test. Normally distributed variables were analyzed using Student's t-test (two-group comparisons) or one-way analysis of variance (ANOVA) (three-group comparisons), while Pearson's correlation coefficient was used to assess associations between continuous variables. Non-normally distributed variables were analyzed using the Mann–Whitney U test (two-group comparisons) or the Kruskal–Wallis test (three-group comparisons), and correlations were evaluated using Spearman's rank correlation coefficient. A two-sided p value < 0.05 was considered statistically significant.
Model assumptions were assessed by examining residual normality, homoscedasticity, multicollinearity (variance inflation factor, VIF), and influential observations before interpretation of the regression results.
3. Results
3.1. Descriptive Analysis
A total of 177 children evaluated between 2016 and 2025 were included in the study. Of these, 102 children were diagnosed with T1DM, including 60 treated MDI and 42 receiving CSII. The control group consisted of 75 children without diabetes mellitus.
The distribution of all continuous variables was assessed using the Shapiro–Wilk test. Most variables showed a non-normal distribution (p<0.05) and were therefore analyzed using non-parametric statistical methods. Variables that followed a normal distribution included height in all three study groups, fasting plasma glucose in the insulin pump group, HbA1c in the insulin pump group, and body weight in the insulin pump group. Accordingly, continuous data is presented as median (Q1-Q3) unless otherwise specified.
The sex distribution was relatively balanced, with a slight predominance of males (52%). The same was true for place of residence, 52% of subjects come from urban areas. Assessment of pubertal development according to Tanner staging demonstrated representation across all three developmental categories, with the highest frequency observed in Tanner stages II–IV (Table 1).
Among children with T1DM, autoimmune thyroiditis was the most frequently associated autoimmune disorder, 21.5%, followed by overweight/obesity and insulin injection-site lipodystrophy in 12% of cases each. Celiac disease was only observed in 3 cases (3%), while diabetic kidney disease in only one diabetic patient (1%) (Table 1).
3.2. Comparison Analysis
The comparison between children with T1DM, regardless of insulin treatment modality, and healthy controls revealed no statistically significant differences in anthropometric parameters or pubertal development. BMI SDS, height SDS, height, age, and Tanner stage distribution were comparable between the two groups.
As expected, fasting plasma glucose levels were significantly higher in children with T1DM than in healthy controls (p<0.001). Estimated GFR was also significantly higher in the T1DM group (p<0.001); however, values remained within the normal range in both groups, indicating no clinically meaningful difference. No significant between-group differences were observed for serum creatinine, AST, or ALT. The results are summarized in Table 2.
Comparison of the three study groups (MDI, CSII, and healthy controls) revealed significant differences in age, fasting plasma glucose, serum creatinine, and eGFR. Fasting plasma glucose was highest in the MDI group (p < 0.001, Figure 1). Although the combined T1DM cohort was age-matched to the healthy controls (p = 0.34, Table 2), the CSII group was significantly older than the other groups (p=0.04). Serum creatinine and eGFR also differed significantly among the three groups (p=0.002 and p<0.001, respectively), although both parameters remained within the normal range across all groups. In contrast, no significant differences were observed for BMI SDS, height, height SDS, Tanner stage, AST, or ALT. The results are summarized in Table 3.
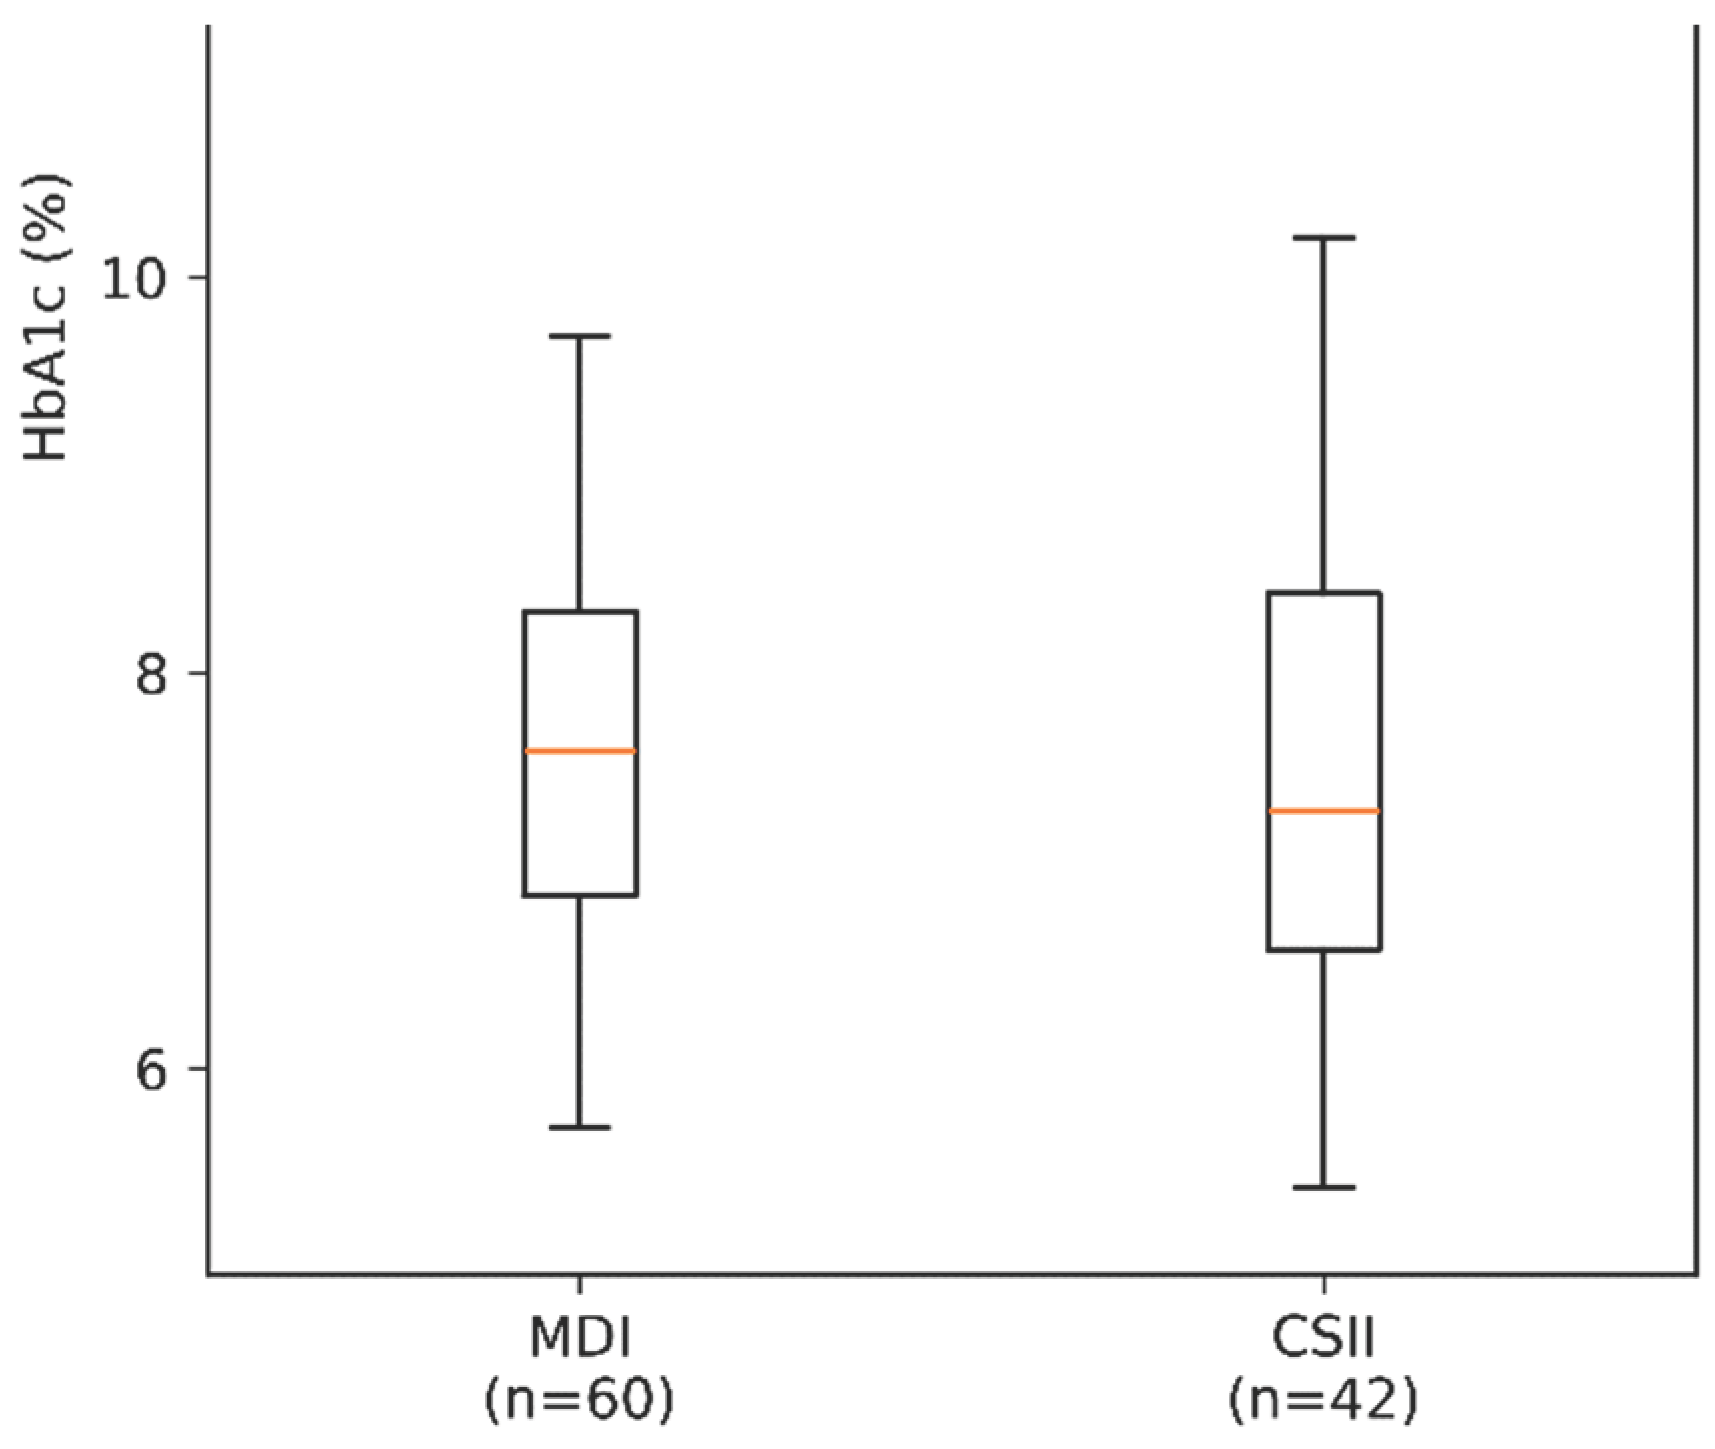
Comparison between children treated with multiple daily injections and those receiving continuous subcutaneous insulin infusion demonstrated significant differences in fasting plasma glucose and serum creatinine levels. Children treated with MDI had significantly higher fasting plasma glucose concentrations than those receiving CSII, whereas serum creatinine values were significantly higher in the CSII group (both p<0.001). No statistically significant differences were identified between treatment groups regarding height SDS, BMI SDS, HbA1c, eGFR, liver enzymes, total cholesterol, triglycerides, HDL cholesterol, or LDL cholesterol. The results are presented in Table 4.
Figure 2.
Fasting glucose (mg/dL) levels in the MDI vs CSII groups (p<0.001).
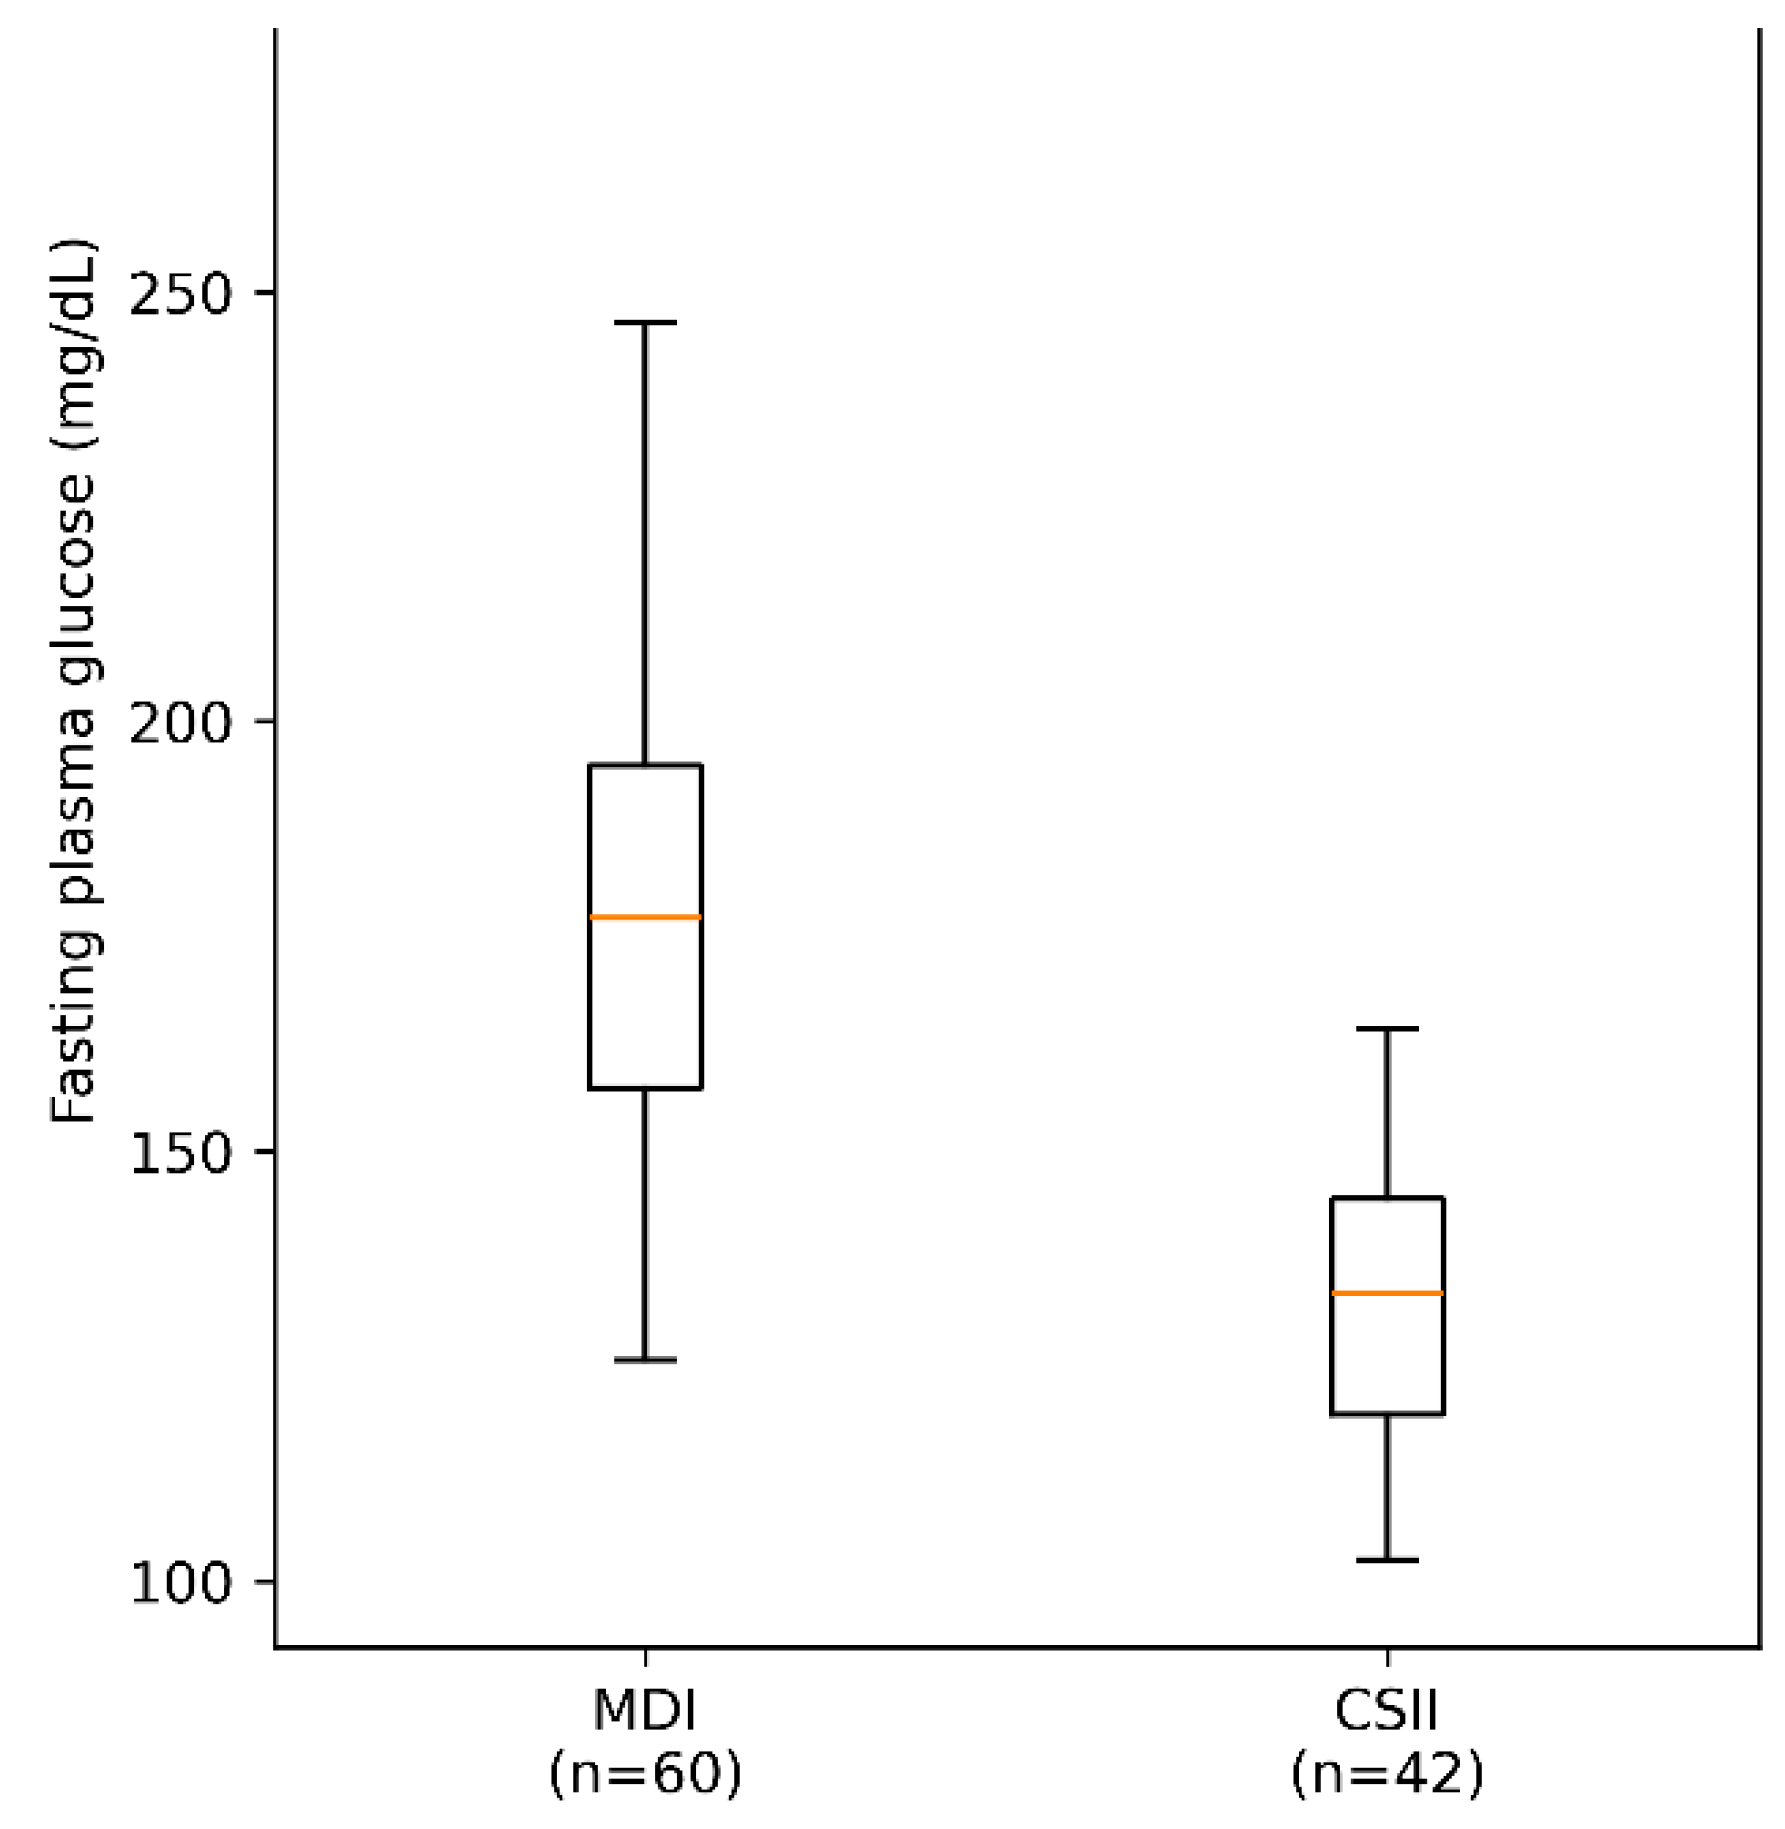
Figure 3.
HbA1c (%) levels in the MDI vs CSII groups (p=0.4).
Continuous glucose monitoring parameters (CGM) were compared among prepubertal (Tanner I), pubertal (Tanner II–IV), and postpubertal (Tanner V) children treated with continuous subcutaneous insulin infusion using the Kruskal–Wallis test. A statistically significant difference was observed only for the percentage of time spent in hyperglycemia within the 180–250 mg/dL range (p=0.03). Prepubertal children exhibited a higher proportion of time in this glycemic range than pubertal and postpubertal participants. Although the percentage of TIR tended to increase with pubertal stage, the difference did not reach statistical significance (p=0.05). Likewise, no statistically significant differences were identified among Tanner stages regarding HbA1c, time spent in hyperglycemia, time spent in hypoglycemia, BMI SDS, or height SDS. The results are presented in Table 5.
3.3. Correlation Analysis
Spearman correlation analysis revealed no statistically significant associations between BMI SDS and age, Tanner stage, fasting plasma glucose, serum creatinine, eGFR, AST, or ALT.
Height SDS showed a weak positive correlation with eGFR (ρ=0.19, p = 0.01). No significant correlations were observed between height SDS and age, Tanner stage, fasting plasma glucose, serum creatinine, AST, or ALT. The results are presented in Table 6.
Spearman correlation analysis performed in the combined T1DM cohort (MDI and CSII groups) demonstrated no statistically significant associations between BMI SDS and age, duration of diabetes, Tanner stage, HbA1c, fasting plasma glucose, serum creatinine, eGFR, liver enzymes, or lipid profile.
Similarly, height SDS was not significantly correlated with any of the evaluated clinical or biochemical parameters. The strongest association was observed between height SDS and eGFR (ρ=0.19, p=0.05), although this did not reach statistical significance. Likewise, duration of diabetes showed a weak inverse correlation with height SDS (ρ=−0.181, p=0.07), but the association was not statistically significant. All remaining correlations were weak and non-significant (Table 7).
Spearman correlation analysis performed in children receiving CSII demonstrated a single statistically significant association. A weak positive correlation was observed between the percentage of time spent in hypoglycemia (54–70 mg/dL) and height SDS (ρ=0.34, p=0.02), indicating that children with a higher height SDS tended to spend a greater proportion of time within this hypoglycemic range, a result which is not necessarily in line with what was expected. No significant correlations were identified between height SDS and HbA1c, Time in Range (TIR), time spent in hypoglycemia below 54 mg/dL, time spent in hyperglycemia (180–250 mg/dL or >250 mg/dL), or coefficient of variation. Similarly, BMI SDS was not significantly associated with any of the evaluated continuous glucose monitoring parameters or HbA1c. The results are presented in Table 8.
3.4. Regression Analysis
To identify factors independently associated with BMI SDS, a multiple linear regression analysis was performed using BMI SDS as the dependent variable. Age, sex, place of residence, Tanner stage, fasting plasma glucose, eGFR, AST, and ALT were included as independent variables. The analysis included all 177 participants. The overall regression model was not statistically significant (R²=0.05, adjusted R²=0.009, F(8,16) = 1.2, p=0.29), indicating that the selected variables explained only a small proportion of the variability in BMI SDS. Among the individual predictors, only place of residence was significantly associated with BMI SDS (p=0.01), whereas age, sex, Tanner stage, fasting plasma glucose, eGFR, AST, and ALT were not independently associated with BMI SDS. Assessment of multicollinearity demonstrated acceptable variance inflation factors, ranging from 1.03 to 6.03, indicating no evidence of problematic multicollinearity among the independent variables (Table 9).
To identify factors independently associated with height SDS, a multiple linear regression analysis was performed using height SDS as the dependent variable. Age, sex, place of residence, BMI SDS, Tanner stage, fasting plasma glucose, eGFR, AST, and ALT were included as independent variables. The overall regression model was not statistically significant (R²=0.07, adjusted R²=0.02, F(9,16) = 1.52, p=0.14), indicating that the included variables explained only a small proportion of the variability in height SDS. Among the individual predictors, BMI SDS (p=0.01) and place of residence (p=0.04) were independently associated with height SDS, whereas age, sex, Tanner stage, fasting plasma glucose, eGFR, AST, and ALT were not significantly associated with height SDS. VIF ranged from 1.06 to 6.03, indicating no evidence of problematic multicollinearity among the independent variables (Table 10).
A multiple linear regression analysis was performed to evaluate the independent associations of metabolic control variables with height SDS in children and adolescents with T1DM. The final model included fasting plasma glucose, HbA1c, eGFR, ALT, LDL-c, HDL-c, triglycerides, and treatment modality (CSII versus MDI) as independent predictors of height SDS. To reduce multicollinearity and improve model stability, total cholesterol and AST were excluded from the final multiple linear regression model. However, the overall regression model was not statistically significant (R²=0.05, adjusted R²=−0.02, F(8,93)=0.66, p=0.72), indicating that these variables explained only a small proportion of the variability in height SDS. None of the evaluated predictors independently predicted height SDS after adjustment for the remaining covariates (Table 11).
To evaluate whether glycemic control, assessed by HbA1c, represents an independent predictor of linear growth in children and adolescents with T1DM, a multiple linear regression model was constructed with height SDS as the dependent variable. The model was adjusted for age, sex, diabetes duration, and insulin therapy modality (CSII vs MDI). The overall regression model was not statistically significant (R²=0.05, adjusted R²=−0.001, F(5,93) = 0.99, p=0.42), indicating that the included variables explained only a small proportion of the variability in height SDS. HbA1c was not independently associated with height SDS after adjustment for potential confounding factors. Likewise, age, sex, diabetes duration, and insulin therapy modality were not significant independent predictors of height SDS, although diabetes duration showed a non-significant trend toward a negative association with height SDS (p=0.08). The results of the regression analysis are presented in Table 12.
4. Discussion
Type 1 diabetes mellitus is one of the most common chronic metabolic diseases of childhood and adolescence and represents a major challenge for patients, their families, and healthcare systems. This condition is characterized by the autoimmune destruction of pancreatic β-cells, resulting in absolute insulin deficiency and disturbances in carbohydrate, lipid, and protein metabolism [1].
Insulin plays an essential role in anabolic processes, being involved in cellular glucose utilization, stimulation of protein synthesis, and the maintenance of normal growth and development [7]. It acts directly on peripheral tissues and indirectly through the insulin-like growth factor-1 pathway, which mediates the effects of growth hormone at the level of the growth plate. Under conditions of adequate glycemic control, these physiological mechanisms remain preserved, allowing normal linear growth. In contrast, poor metabolic control may disrupt IGF-1 production and impair longitudinal growth. In the absence of adequate treatment, insulin deficiency may impair nutritional status and linear growth [24,25].
The present study aimed to evaluate the impact of T1DM on the growth and development of children and adolescents, based on the hypothesis that the metabolic imbalance associated with this disease could negatively influence anthropometric development and pubertal maturation. Contrary to our initial hypothesis, our results did not demonstrate significant differences between children with T1DM and healthy controls regarding height SDS, BMI SDS, or pubertal development. Furthermore, no independent associations were identified between markers of metabolic control and the anthropometric parameters evaluated.
Although these findings may initially appear inconsistent with classical literature [26,27], they agree with the evolution of T1DM management over the last two decades. Studies performed during the 1980s and 1990s frequently reported reduced final height and delayed pubertal development in children with T1DM. However, these cohorts consisted mainly of patients treated before the introduction of intensive insulin therapy and modern glucose monitoring technologies [26,27]. More recent studies have reported findings that are much closer to those observed in our cohort, suggesting that the impact of T1DM on growth has markedly diminished with improvements in diabetes management [22,28]. An important aspect of the present study is that all children included in the T1DM cohort were diagnosed and treated between 2016 and 2025, a period during which the management of pediatric T1DM was based predominantly on intensive insulin therapy, modern insulin analogues, continuous glucose monitoring, and, in a substantial proportion of patients, insulin pump therapy. Within this clinical context, it is plausible that exposure to severe and prolonged hyperglycemia was insufficient to produce measurable alterations in growth and development, thereby explaining the absence of significant differences between children with T1DM and healthy controls. Our findings are further supported by the current ISPAD Clinical Practice Consensus Guidelines, which emphasize that most children and adolescents with T1DM treated with contemporary intensive insulin regimens, including multiple daily injections or continuous subcutaneous infusion, achieve normal linear growth [16]. According to these recommendations, reduced growth velocity is observed mainly in patients with persistent poor metabolic control, in whom prolonged insulin deficiency disrupts the growth hormone–IGF-1 axis and decreases circulating IGF-1 concentrations. Furthermore, the adverse effects of chronic hyperglycemia on growth become more evident during puberty and in patients who develop albuminuria or Mauriac syndrome [16].
One of the most important findings of the present study was the absence of an independent association between markers of metabolic control and anthropometric parameters. Both the correlation analyses and the multiple linear regression models failed to demonstrate significant associations between HbA1c or other routinely assessed metabolic parameters and either height SDS or BMI SDS. These findings should not be interpreted as evidence that glycemic control has no influence on growth. Rather, they suggest that the level of metabolic control achieved in our cohort was sufficient to prevent the growth impairment described in historical studies. In other words, the degree and duration of metabolic imbalance in our patients were likely insufficient to produce measurable alterations in growth and development.
Comparison between patients treated with multiple daily injections and those receiving insulin pump therapy revealed differences in some metabolic parameters but not in anthropometric outcomes. HbA1c values were comparable between the two treatment groups, suggesting that both therapeutic strategies allowed similar overall metabolic control in routine clinical practice. Although fasting plasma glucose was lower in patients treated with insulin pump therapy, this finding was not accompanied by differences in height SDS, BMI SDS, or pubertal development. These results should be interpreted with caution because the two treatment groups were not fully comparable with respect to age and pubertal status, factors that may independently influence several of the metabolic and biological parameters evaluated.
Current evidence indicates that insulin pump therapy is generally associated with improved glycemic control, increased time in range, lower HbA1c levels, and a reduced risk of severe hypoglycemia compared with multiple daily injections []. However, its benefits with respect to linear growth are considerably less evident. Most studies have shown that both continuous subcutaneous insulin infusion and basal-bolus therapy support normal growth and development when accompanied by adequate metabolic control [19,29,30]. The findings of our study are consistent with these observations. The absence of anthropometric differences between the two treatment groups suggests that, in contemporary clinical practice, both multiple daily injections and insulin pump therapy can provide the conditions necessary for normal physical development when treatment is appropriately implemented and accompanied by regular metabolic monitoring.
In the present study, no significant differences in BMI SDS were observed between children with T1DM and healthy controls. This finding is particularly relevant because recent studies have reported an increasing prevalence of obesity among children and adolescents with T1DM, a phenomenon attributed both to intensive insulin therapy and to behavioral and lifestyle factors [31,32]. The fact that this trend was not evident in our cohort may suggest an appropriate balance between insulin therapy, nutritional follow-up, and diabetes education. Furthermore, the absence of significant associations between routinely assessed metabolic parameters and BMI SDS in our multivariable analyses indicates that body weight in children with T1DM is likely influenced by a broader range of factors than glycemic control alone, including dietary habits, physical activity, genetic predisposition, and overall lifestyle.
In our study, pubertal development assessed according to Tanner staging did not differ significantly between children with T1DM and healthy controls. This finding supports the conclusion that, within our cohort, T1DM was not associated with measurable delays in pubertal maturation. Earlier studies frequently reported delayed puberty and reduced adult height in children with T1DM, particularly in patients managed with conventional insulin regimens and suboptimal metabolic control. For example, Elamin and colleagues described impaired linear growth and delayed sexual maturation in children receiving conventional insulin therapy [27]. In contrast, more recent evidence indicates that pubertal development is generally preserved in children with T1DM when intensive insulin therapy and satisfactory metabolic control are achieved. Although T1DM may influence the growth hormone–IGF-1 axis and pubertal progression, contemporary studies consistently demonstrate that most children treated with modern intensive therapeutic strategies achieve normal adult height and timely puberty [25]. Our findings agree with this evidence, as the absence of differences in Tanner stage between the study groups suggests that the standard of diabetes care provided was sufficient to prevent clinically relevant delays in pubertal development.
The multiple linear regression analyses confirmed the results of the univariate analyses, as no independent clinical or metabolic predictors of anthropometric parameters were identified. In all regression models, the low coefficients of determination indicate that only a small proportion of the variability in height SDS and BMI SDS could be explained by the clinical and metabolic variables included in the analyses. Neither HbA1c nor the other routinely assessed metabolic parameters independently predicted height SDS after adjustment for the selected covariates. These findings are consistent with the current understanding that growth and development are multifactorial processes influenced by the complex interaction of genetic, endocrine, nutritional, environmental, and metabolic factors. Therefore, under conditions of appropriate T1DM management, routinely measured metabolic markers such as HbA1c, fasting plasma glucose, lipid profile, renal function, or liver enzymes should not be considered the sole determinants of linear growth or nutritional status [16,22].
The prevalence of autoimmune thyroiditis in our cohort (21.6%) was comparable to that reported in the literature, where it represents the most common autoimmune disorder associated with childhood T1DM. As most patients were diagnosed and monitored according to current recommendations, early detection and appropriate thyroid hormone replacement therapy in those who developed hypothyroidism likely minimized the impact of this comorbidity on growth and development, which may explain the absence of anthropometric differences observed in our study [33,34]. Celiac disease was identified in 2.9% of children with T1DM, a lower prevalence than that reported in international pediatric registries, which goes up to over 10%, depending on ethnicities and geographic regions [33,35]. Although untreated celiac disease may impair growth velocity and nutritional status, the small number of affected patients and the timely initiation of a gluten-free diet did not allow the identification of a measurable impact on anthropometric parameters within our cohort [33]. The proportion of children with overweight or obesity (12.7%) was lower than that reported in many contemporary pediatric cohorts, where the prevalence of excess body weight in children with T1DM frequently exceeds 20% [31,37]. This finding may reflect the characteristics of the study population as well as the regular nutritional counselling and follow-up provided at our center. Diabetic kidney disease was identified in only one patient, a frequency too low to permit evaluation of its potential influence on growth and development [38]. Injection-site lipodystrophy was observed in approximately 13% of patients, a prevalence lower than that reported in many pediatric studies [39]. This finding may reflect the effectiveness of diabetes education regarding injection-site rotation and the regular clinical follow-up performed at our institution.
From a clinical perspective, the findings of the present study provide an encouraging message for both healthcare professionals and families of children diagnosed with T1DM. Whereas in the past this diagnosis was frequently associated with concerns regarding impaired linear growth and delayed pubertal development, our data suggest that these complications can largely be prevented through contemporary diabetes management. Intensive insulin therapy, careful metabolic monitoring, structured diabetes education, and regular follow-up in a specialized pediatric diabetes center allow most children and adolescents with T1DM to achieve growth and development comparable to that of their healthy peers. These findings have important implications for patient and family counselling from the time of diagnosis and reinforce the importance of maintaining high standards of diabetes care throughout childhood and adolescence.
The main strength of the present study is the inclusion of a cohort of children managed exclusively during the era of intensive insulin therapy and modern glucose monitoring technologies, allowing the evaluation of the current impact of T1DM on growth and development. Furthermore, the study assessed not only anthropometric outcomes but also their relationship with a broad range of routinely evaluated metabolic parameters using multivariable regression analyses. This approach enabled the investigation of the independent contribution of metabolic control while accounting for the potential influence of other clinical variables.
Nevertheless, several limitations should be acknowledged. First, the retrospective design precludes the establishment of causal relationships between metabolic control and anthropometric outcomes. Second, the study was conducted at a single tertiary pediatric center, which may limit the generalizability of the findings. In addition, the MDI and CSII groups were not fully comparable regarding age and pubertal development, factors that may have influenced some of the observed metabolic and biological differences. Finally, metabolic control was evaluated primarily using HbA1c together with routinely available laboratory parameters collected at the time of assessment, without quantifying cumulative long-term exposure to hyperglycemia or incorporating continuous glucose monitoring metrics such as time in range.
5. Conclusions
The present study evaluated the impact of type 1 diabetes mellitus on the growth and development of children and adolescents, as well as the relationship between metabolic control and anthropometric parameters. No significant differences were identified between children with T1DM and healthy controls regarding height SDS, BMI SDS, or pubertal development. No anthropometric differences were observed between patients treated with multiple daily injections and those receiving insulin pump therapy, suggesting that both therapeutic strategies support normal growth when accompanied by appropriate diabetes management. Neither the correlation analyses nor the multiple linear regression models identified independent associations between HbA1c or other routinely assessed metabolic parameters and anthropometric outcomes.
These findings suggest that, in the era of contemporary intensive insulin therapy, the level of metabolic control achieved by most children with T1DM is sufficient to preserve normal growth and development.
Overall, our results support the concept that impaired growth is no longer an inevitable consequence of T1DM when modern diabetes management, regular follow-up, and appropriate metabolic monitoring are provided.
Author: Contributions
Conceptualization, M.S.M., D.S. and C.P.; methodology, M.S.M.; software, D.P., M.A.C.; validation, M.S.M., D.S. and C.P.; formal analysis, M.S.M, L.A.A; investigation, A.M.P., J.A.H.; resources, C.P., O.A.V-B..; data curation, L.A.A., D.P, M.A.C.; writing—original draft preparation, M.S.M.; writing—review and editing, D.P., C.P.; visualization, M.A.C., O.A.V-B.; supervision, M.S.M., D.S. project administration, C.P.; All authors have read and agreed to the published version of the manuscript.
Funding
We would like to acknowledge VICTOR BABES UNIVERSITY OF MEDICINE AND PHARMACY TIMIȘOARA for their support in covering the costs of publication for this research paper.
Institutional Review Board Statement
This study adheres to the ethical standards of the Helsinki Declaration and was approved by the the local Research Ethics Committee of the "Pius Brînzeu" Emergency Clinical County Hospital, Timișoara (No. 600/12.02.2026).
Informed Consent Statement
The informed consent to anonymously use retrospective medical records was obtained at first admission in the hospital’s department, in accordance with applicable institutional and national regulations.
Data Availability Statement
Only the corresponding author may provide access to the data reported in this study. Due to privacy limitations, the data are not publicly accessible.
Conflicts of Interest
The authors declare no conflicts of interest.
Acknowledgments
The authors would like to thank their affiliated institutions for their support and assistance in making this study possible.
Abbreviations
| ALT | Alanine aminotransferase |
| AST | Aspartate aminotransferase |
| BMI | Body mass index |
| BMI SDS | Body mass index standard deviation score |
| CGM | Continuous glucose monitoring |
| CSII | Continuous subcutaneous insulin infusion |
| CV | Coefficient of variation |
| eGFR | Estimated glomerular filtration rate |
| GH | Growth hormone |
| HbA1c | Glycated hemoglobin |
| HDL | High-density lipoprotein |
| IGF-1 | Insulin-like growth factor 1 |
| LDL | Low-density lipoprotein |
| MDI | Multiple daily injections |
| SDS | Standard deviation score |
| T1DM | Type 1 diabetes mellitus |
| Tanner stage | Tanner stage of pubertal development |
| TIR | Time in range |
References
- Katsarou, A.; Gudbjörnsdottir, S.; Rawshani, A.; Dabelea, D.; Bonifacio, E.; Anderson, B.J.; Jacobsen, L.M.; Schatz, D.A.; Lernmark, Å. Type 1 diabetes mellitus. Nat. Rev. Dis. Prim. 2017, 3, 17016. [Google Scholar] [CrossRef] [PubMed]
- Steck, A.K.; Rewers, M.J. Genetics of type 1 diabetes. Clin. Chem. 2011, 57, 1041–1049. [Google Scholar] [CrossRef]
- Feather, A.; Randall, D.; Waterhouse, M. Kumar and Clark's Clinical Medicine, 10th ed.; Romanian edition edited by Azamfirei, L.; Buzoianu, A.D.; Gheonea, D.I.; Hipocrate Publishing House: Bucharest, Romania, 2021; p. 707.
- Hormazábal-Aguayo, I.; Ezzatvar, Y.; Huerta-Uribe, N.; Ramírez-Vélez, R.; Izquierdo, M.; García-Hermoso, A.; et al. Incidence of type 1 diabetes mellitus in children and adolescents under 20 years of age across 55 countries from 2000 to 2022: A systematic review with meta-analysis. Diabetes Metab. Res. Rev. 2024, 40, e3749. [Google Scholar] [CrossRef] [PubMed]
- Ruiz-Grao, M.C.; Díez-Fernández, A.; Mesas, A.E.; Martínez-Vizcaíno, V.; Sequí-Domínguez, I.; Sebastián-Valles, F.; Garrido-Miguel, M. Trends in the incidence of type 1 diabetes in European children and adolescents from 1994 to 2022: A systematic review and meta-analysis. Pediatr. Diabetes 2024, 2024, 2338922. [Google Scholar] [CrossRef] [PubMed]
- Vlad, A.; Serban, V.; Timar, R.; Sima, A.; Botea, V.; Albai, O.; Timar, B.; Vlad, M. Increased incidence of type 1 diabetes during the COVID-19 pandemic in Romanian children. Medicina 2021, 57, 973. [Google Scholar] [CrossRef] [PubMed]
- Baron, V.; Van Obberghen, E. Mechanism of insulin action. C. R. Seances Soc. Biol. Fil. 1995, 189, 25–41. [Google Scholar] [PubMed]
- Aghili, Z.S.; Khoshnevisan, G.; Mostoli, R.; Alibaglouei, M.; Zarkesh-Esfahani, S.H. Growth hormone signaling and clinical implications: From molecular to therapeutic perspectives. Mol. Biol. Rep. 2025, 52, 202. [Google Scholar] [CrossRef] [PubMed]
- Jadhav, I.; Chakole, S. Effects of type 1 diabetes mellitus on linear growth: A comprehensive review. Cureus 2023, 15, e45428. [Google Scholar] [CrossRef] [PubMed]
- Dunger, D.B.; Regan, F.M.; Acerini, C.L. Childhood and adolescent diabetes. Endocr. Dev. 2005, 9, 107–120. [Google Scholar] [CrossRef] [PubMed]
- Chowdhury, S. Puberty and type 1 diabetes. Indian J. Endocrinol. Metab. 2015, 19 (Suppl. 1), S51–S54. [Google Scholar] [CrossRef] [PubMed]
- Arrais, R.F.; Dib, S.A. The hypothalamus–pituitary–ovary axis and type 1 diabetes mellitus: A mini review. Hum. Reprod. 2006, 21, 327–337. [Google Scholar] [CrossRef] [PubMed]
- Fröhlich-Reiterer, E.; Elbarbary, N.S.; Simmons, K.; et al. ISPAD Clinical Practice Consensus Guidelines 2022: Other complications and associated conditions in children and adolescents with type 1 diabetes. Pediatr. Diabetes 2022, 23, 1451–1467. [Google Scholar] [CrossRef] [PubMed]
- Qin, Y.; Yang, L.H.; Huang, X.L.; Chen, X.H.; Yao, H. Efficacy and safety of continuous subcutaneous insulin infusion vs. multiple daily injections in children with type 1 diabetes: A meta-analysis of randomized controlled trials. J. Clin. Res. Pediatr. Endocrinol. 2018, 10, 316–323. [Google Scholar] [CrossRef] [PubMed]
- Sundberg, F.; de Beaufort, C.; Krogvold, L.; Patton, S.; Piloya, T.; Smart, C.; Van Name, M.; Weissberg-Benchell, J.; Silva, J.; DiMeglio, L.A. ISPAD Clinical Practice Consensus Guidelines 2022: Managing diabetes in preschoolers. Pediatr. Diabetes 2022, 23, 1496–1511. [Google Scholar] [CrossRef] [PubMed]
- de Bock, M.; Codner, E.; Craig, M.E.; Huynh, T.; Maahs, D.M.; Mahmud, F.H.; Marcovecchio, M.L.; DiMeglio, L.A. ISPAD Clinical Practice Consensus Guidelines 2022: Glycemic targets and glucose monitoring for children, adolescents, and young people with diabetes. Pediatr. Diabetes 2022, 23, 1270–1276. [Google Scholar] [CrossRef] [PubMed]
- Bombaci, B.; Passanisi, S.; Lombardo, F.; Salzano, G. Clinical relevance of short-term glycemic variability in children and adolescents with type 1 diabetes: A narrative review. Transl. Pediatr. 2024, 13, 1231–1241. [Google Scholar] [CrossRef] [PubMed]
- Timmons, J.G.; Boyle, J.G.; Petrie, J.R. Time in range as a research outcome measure. Diabetes Spectr. 2021, 34, 133–138. [Google Scholar] [CrossRef] [PubMed]
- Kamrath, C.; Tittel, S.R.; Kapellen, T.M.; von dem Berge, T.; Heidtmann, B.; Nagl, K.; Menzel, U.; Pötzsch, S.; Konrad, K.; Holl, R.W. Early versus delayed insulin pump therapy in children with newly diagnosed type 1 diabetes: Results from the multicentre, prospective diabetes follow-up DPV registry. Lancet Child Adolesc. Health 2021, 5, 17–25. [Google Scholar] [CrossRef] [PubMed]
- Lindholm Olinder, A.; De Abreu, M.; Greene, S.; Haugstvedt, A.; Lange, K.; Majaliwa, E.S.; Pais, V.; Pelicand, J.; Town, M.; Mahmud, F.H. ISPAD Clinical Practice Consensus Guidelines 2022: Diabetes education in children and adolescents. Pediatr. Diabetes 2022, 23, 1229–1242. [Google Scholar] [CrossRef] [PubMed]
- Absil, H.; Baudet, L.; Robert, A.; Lysy, P.A. Benefits of physical activity in children and adolescents with type 1 diabetes: A systematic review. Diabetes Res. Clin. Pract. 2019, 156, 107810. [Google Scholar] [CrossRef] [PubMed]
- Santi, E.; Tascini, G.; Toni, G.; Berioli, M.G.; Esposito, S. Linear growth in children and adolescents with type 1 diabetes mellitus. Int. J. Environ. Res. Public Health 2019, 16, 3677. [Google Scholar] [CrossRef] [PubMed]
- Kuczmarski, R.J.; Ogden, C.L.; Grummer-Strawn, L.M.; Flegal, K.M.; Guo, S.S.; Wei, R.; Mei, Z.; Curtin, L.R.; Roche, A.F.; Johnson, C.L. CDC Growth Charts: United States. Adv. Data 2000, 314, 1–27. [Google Scholar]
- Murray, P.G.; Clayton, P.E. Endocrine control of growth. Am. J. Med. Genet. C Semin. Med. Genet. 2013, 163C, 76–85. [Google Scholar] [CrossRef] [PubMed]
- Giannini, C.; Mohn, A.; Chiarelli, F. Growth hormone and insulin-like growth factor-I axis in type 1 diabetes. Growth Horm. IGF Res. 2018, 38, 49–52. [Google Scholar] [CrossRef] [PubMed]
- Brown, M.; Ahmed, M.L.; Clayton, K.L.; Dunger, D.B. Growth during childhood and final height in type 1 diabetes. Diabet. Med. 1994, 11, 182–187. [Google Scholar] [CrossRef]
- Elamin, A.; Hussein, O.; Tuvemo, T. Growth, puberty, and final height in children with type 1 diabetes. J. Diabetes Complicat. 2006, 20, 252–256. [Google Scholar] [CrossRef] [PubMed]
- Koren, D. Growth and development in type 1 diabetes. Curr. Opin. Endocrinol. Diabetes Obes. 2022, 29, 57–64. [Google Scholar] [CrossRef] [PubMed]
- Abraham, M.B.; de Bock, M.; Smith, G.J.; Dart, J.; Fairchild, J.M.; King, B.R.; Ambler, G.R.; Cameron, F.J.; McAuley, S.A.; Keech, A.C.; Jenkins, A.; Davis, E.A.; O'Neal, D.N.; Jones, T.W. Australian Juvenile Diabetes Research Foundation Closed-Loop Research Group. Effect of a hybrid closed-loop system on glycemic and psychosocial outcomes in children and adolescents with type 1 diabetes: A randomized clinical trial. JAMA Pediatr. 2021, 175, 1227–1235. [Google Scholar] [CrossRef] [PubMed]
- Danne, T.; de Valk, H.W.; Kordonouri, O.; et al. Long-term study of tubeless insulin pump therapy compared to multiple daily injections in youth with type 1 diabetes: Data from the German/Austrian DPV registry. Pediatr. Diabetes 2018, 19, 941–948. [Google Scholar] [CrossRef] [PubMed]
- Minges, K.E.; Whittemore, R.; Weinzimer, S.A.; Irwin, M.L.; Redeker, N.S.; Grey, M. Correlates of overweight and obesity in 5529 adolescents with type 1 diabetes: The T1D Exchange Clinic Registry. Diabetes Res. Clin. Pract. 2017, 126, 68–78. [Google Scholar] [CrossRef] [PubMed]
- Ciężki, S.; Kurpiewska, E.; Bossowski, A.; Głowińska-Olszewska, B. Multi-faceted influence of obesity on type 1 diabetes in children: From disease pathogenesis to complications. Front. Endocrinol. 2022, 13, 890833. [Google Scholar] [CrossRef] [PubMed]
- Mahmud, F.H.; Elbarbary, N.S.; Fröhlich-Reiterer, E.; Holl, R.W.; Kordonouri, O.; Knip, M.; Simmons, K.; Craig, M.E. ISPAD Clinical Practice Consensus Guidelines 2018: Other complications and associated conditions in children and adolescents with type 1 diabetes. Pediatr. Diabetes 2018, 19 (Suppl. 27), 275–286. [Google Scholar] [CrossRef] [PubMed]
- Popoviciu, M.S.; Kaka, N.; Sethi, Y.; Patel, N.; Chopra, H.; Cavalu, S. Type 1 diabetes mellitus and autoimmune diseases: A critical review of the association and the application of personalized medicine. J. Pers. Med. 2023, 13, 422. [Google Scholar] [CrossRef] [PubMed]
- Karimzadhagh, S.; Abbaspour, E.; Shahriarinamin, M.; Shamsi, P.; Poursadrolah, S.; Khorasani, M.; Daghighi, M.; Malek, A.; Talesh, J.T.; Makharia, G.K.; Rostami-Nejad, M. Meta-analysis: Global prevalence of coeliac disease in type 1 diabetes. Aliment. Pharmacol. Ther. 2025, 61, 8–31. [Google Scholar] [CrossRef] [PubMed]
- Akirov, A.; Pinhas-Hamiel, O. Co-occurrence of type 1 diabetes mellitus and celiac disease. World J. Diabetes 2015, 6, 707–714. [Google Scholar] [CrossRef] [PubMed]
- Osei, E.P.; Ekpor, E.; Osei, G.Y.; Akyirem, S. Global prevalence and factors associated with overweight and obesity in children and adolescents with type 1 diabetes: A systematic review and meta-analysis. J. Diabetes Metab. Disord. 2025, 24, 257. [Google Scholar] [CrossRef] [PubMed]
- Bjornstad, P.; Dart, A.; Donaghue, K.C.; Dost, A.; Feldman, E.L.; Tan, G.S.; Wadwa, R.P.; Zabeen, B.; Marcovecchio, M.L. ISPAD Clinical Practice Consensus Guidelines 2022: Microvascular and macrovascular complications in children and adolescents with diabetes. Pediatr. Diabetes 2022, 23, 1432–1450. [Google Scholar] [CrossRef] [PubMed]
- Lombardo, F.; Bombaci, B.; Alibrandi, A.; Visalli, G.; Salzano, G.; Passanisi, S. The impact of insulin-induced lipodystrophy on glycemic variability in pediatric patients with type 1 diabetes. Children 2022, 9, 1087. [Google Scholar] [CrossRef] [PubMed]
Figure 1.
Fasting glucose (mg/dL) levels across the three study groups (p<0.001).
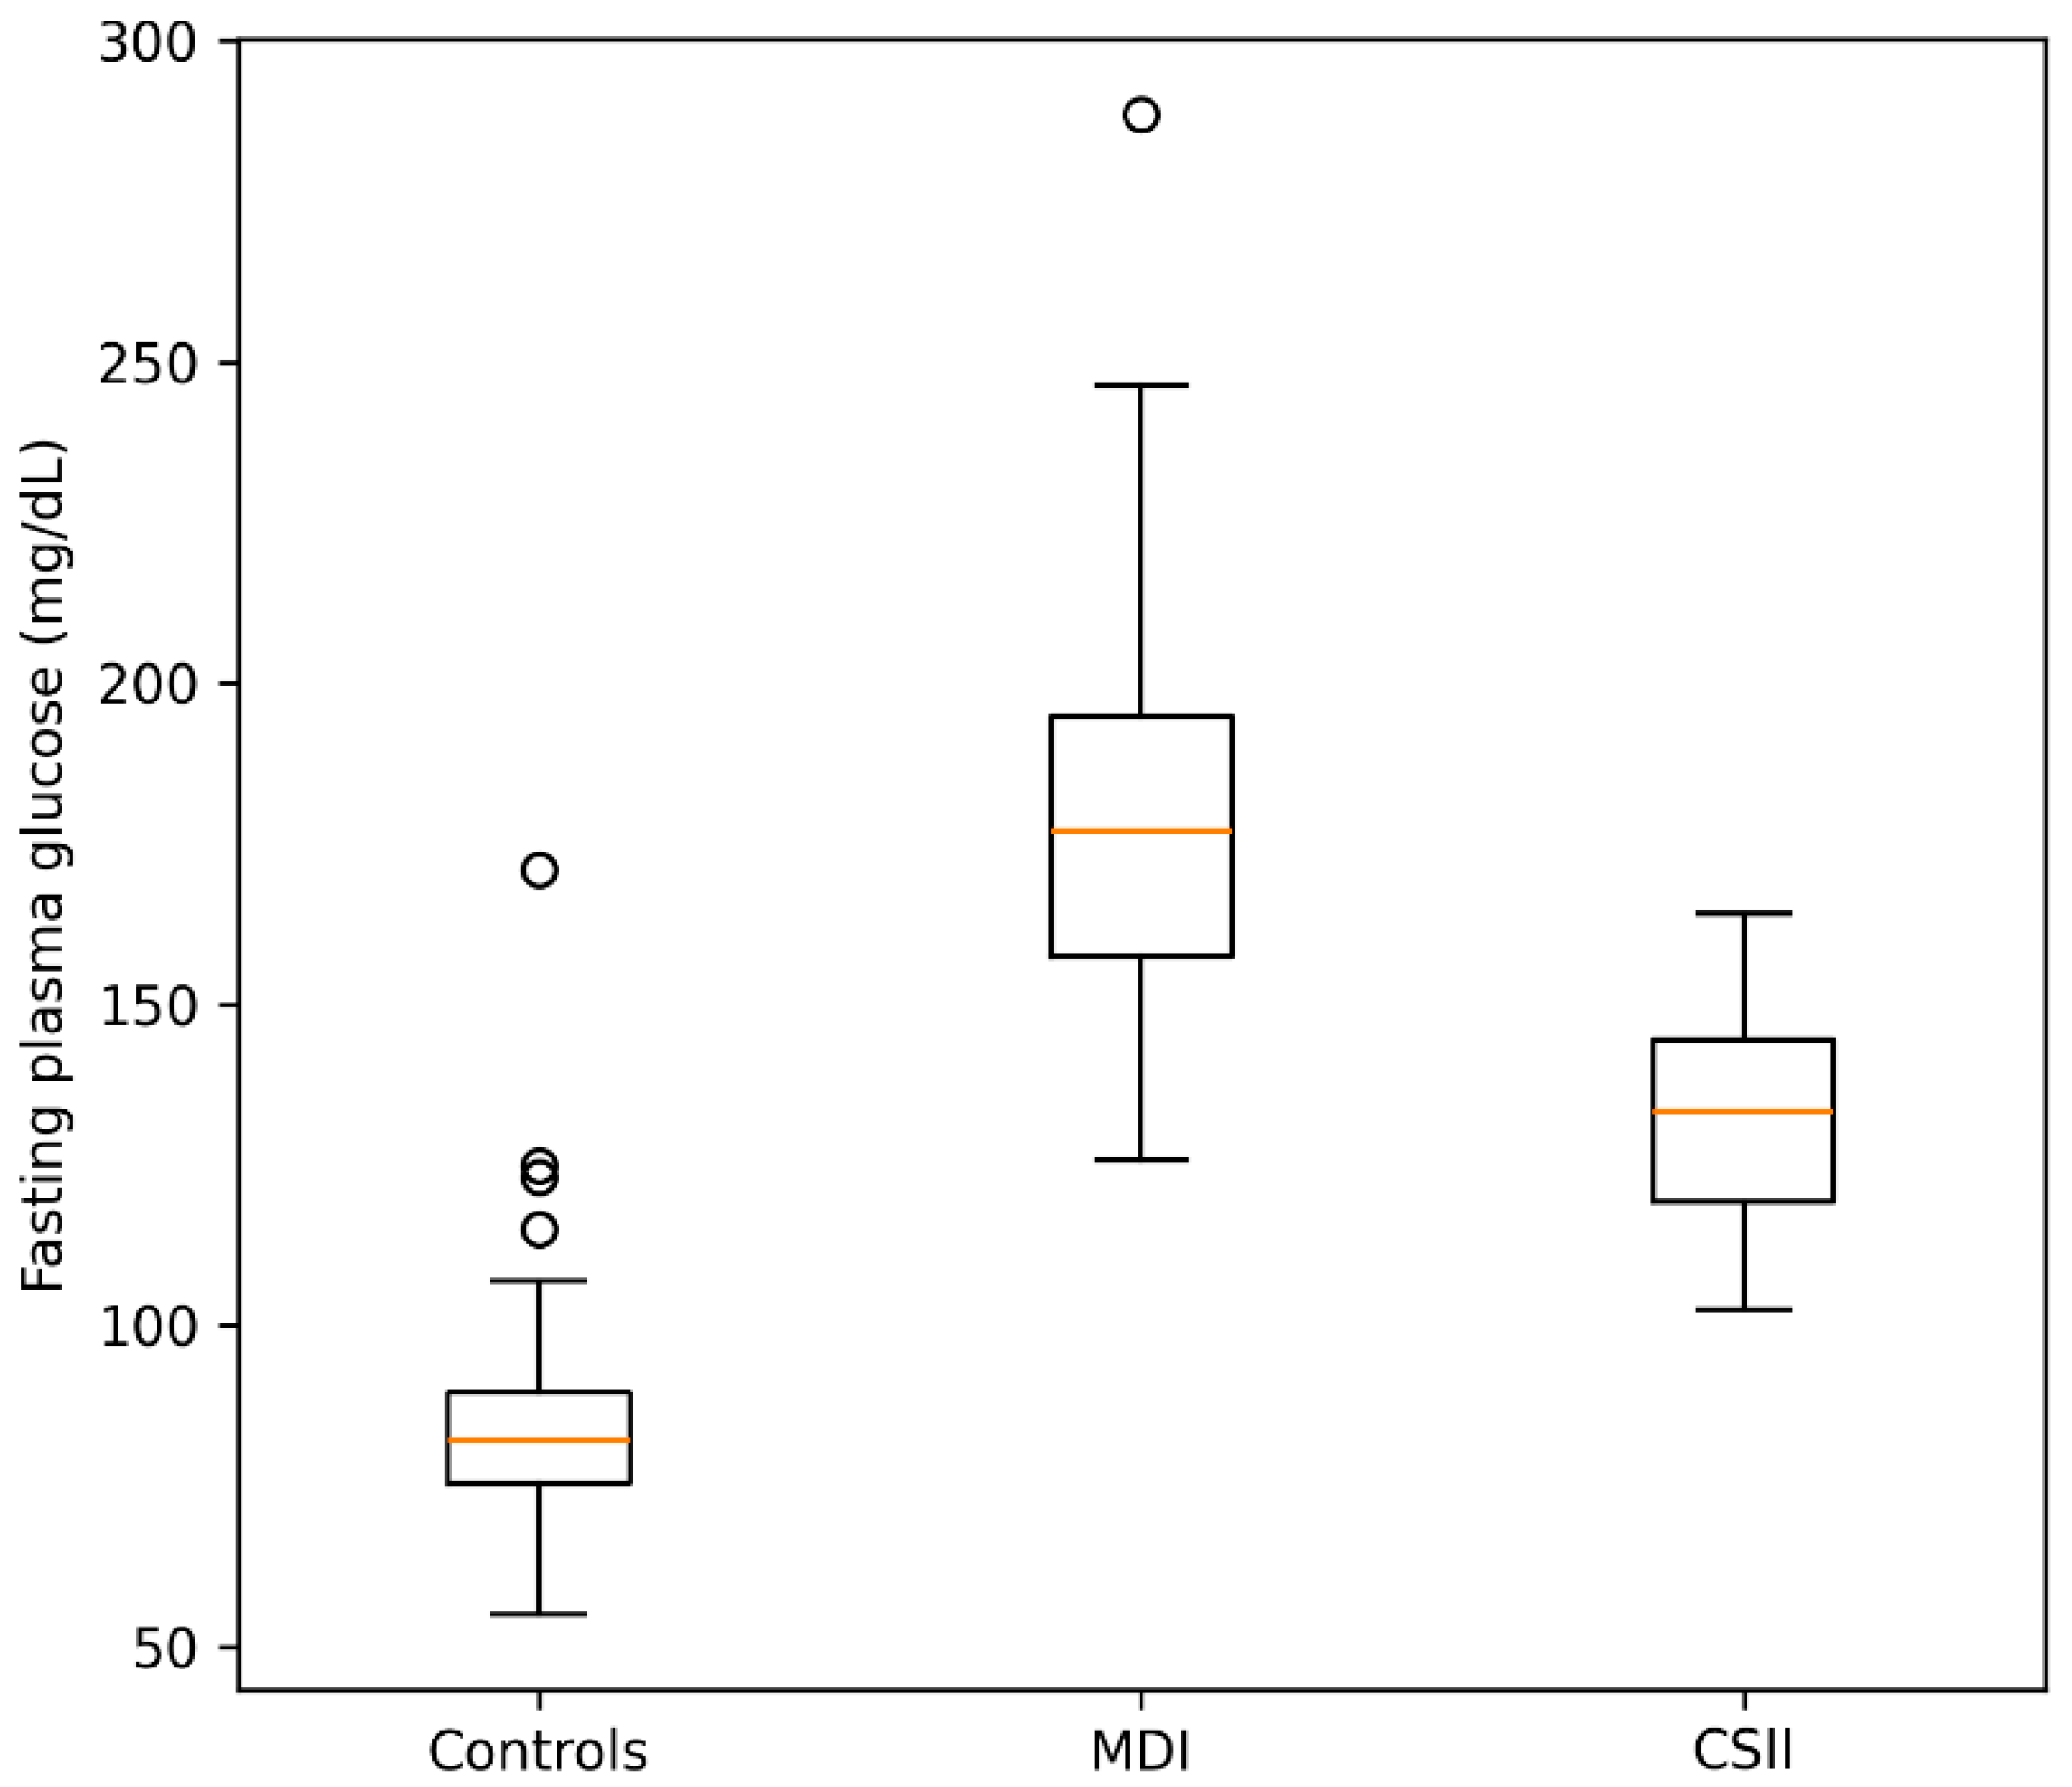

Table 1.
Demographic and clinical characteristics of the study population.
| Parameter |
Total (n) |
MDI | CSII |
Controls |
||||
| n | % | n | % | n | % | |||
| Sex | Feminin | 85 | 25 | 41,66 | 25 | 59.52 | 35 | 46.66 |
| Masculine | 92 | 35 | 58.33 | 17 | 40.47 | 40 | 53.33 | |
| Place of residence | Urban | 93 | 27 | 45 | 27 | 64.28 | 39 | 52 |
| Rural | 84 | 33 | 55 | 15 | 35.71 | 36 | 48 | |
| Tanner Stage | Tanner I | 48 | 15 | 25 | 8 | 19.04 | 25 | 33.33 |
| Tanner II-IV | 67 | 31 | 51.66 | 15 | 35.71 | 21 | 28 | |
| Tanner V | 62 | 14 | 23.33 | 19 | 45.23 | 29 | 38.66 | |
| Autoimmune thyroiditis | Present | 22 | 14 | 23.33 | 8 | 19.04 | - | - |
| Overweight/obesity | Present | 13 | 7 | 11.66 | 6 | 14.28 | - | - |
| Celiac disease | Present | 3 | 0 | 0 | 3 | 7.14 | - | - |
| Diabetic kidney disease | Present | 1 | 1 | 1.66 | 0 | 0 | - | - |
| Insulin injection-site lipodystrophy | Present | 13 | 8 | 13.33 | 5 | 11.9 | - | - |
Table 2.
Comparison of clinical and usual blood tests in T1DM group vs controls.
|
T1DM (n=102) |
Controls (n=75) |
Mann-Whitney-U test | ||
| Parameter | Medians (Q1-Q3) | U | p-value | |
| Age, years | 13.1 (10.5–15.0) | 12.0 (8.54–15.0) | 4145.5 | 0.34 |
| Tanner stage | 3 (2–5) | 3 (1–5) | 3812.0 | 0.96 |
| BMI SDS | 0.71 (−0.08–1.21) | 0.53 (−0.61–1.40) | 3999 | 0.6 |
| Height, cm | 160 (143.25-168.5) | 155 (135-167) | 4145.5 | 0.34 |
| Height SDS | 0.69 (−0.19–1.15) | 0.35 (−0.61–1.42) | 3812 | 0.36 |
| Fasting glucose, mg/dl | 152(134.95–182.85) | 82 (75.5–89.5) | 4132 | <0.001 |
| Creatinine, mg/dl | 0.6 (0.5-0.71) | 0.56 (0.49-0.7) | 7535.5 | 0.39 |
| eGFR, ml/min/1.73 | 118 (102.23–140) | 104 (91.03–113.68) | 4111 | <0.001 |
| AST, U/L | 21 (18–27.75) | 24 (19-31) | 5407 | 0.2 |
| ALT, U/L | 19 (16–22.75) | 17 (13–24.50) | 3396.5 | 0.29 |
Table 3.
Comparison of clinical and usual blood tests in the three study groups.
| MDI | CSII | Controls | Kruskal Wallis test | ||
| Parameter | Medians (Q1-Q3) | H | p-value | ||
| Age, years | 12.85 (9.63–14.05) | 14.35 (11.7–15.95) | 12 (8.54–15) | 6.48 | 0.04 |
| Tanner stage | 2 (2–4) | 4 (2–5) | 3 (1–5) | 3.69 | 0.15 |
| BMI SDS | 0.65 (−0.34–1.19) | 0.77 (0.22–1.21) | 0.53 (−0.61–1.4) | 0.87 | 0.64 |
| Height, cm | 157.45 (139.12–165.73) | 162.9 (149–169.38) | 155 (135–167) | 3.89 | 0.14 |
| Height SDS | 0.65 (−0.39–1.17) | 0.7 (−0.03–1.14) | 0.35 (−0.61–1.42) | 1.009 | 0.6 |
| Fasting glucose, mg/dl | 177.1 (157.38–194.85) | 133.45 (119.32–144.45) | 82 (75.50–89.5) | 140.09 | <0.001 |
| Creatinine (mg/dl) | 0.56 (0.46–0.6) | 0.7 (0.57–0.74) | 0.57 (0.49–0.7) | 12.36 | 0.002 |
| eGFR (ml/min/1,73) | 118 (105.5–140) | 115.5 (98.16–141.25) | 104.56 (91.03–113.68) | 22.31 | <0.001 |
| AST (U/L) | 21 (18–28.25) | 21.5 (17–25.75) | 22 (19–31) | 1.65 | 0.43 |
| ALT (U/L) | 19 (16–23.25) | 18 (15.25–20.75) | 17 (13–24.5) | 1.65 | 0.43 |
Table 4.
Comparison of clinical and usual blood tests in MDI vs CSII groups.
| Parameter | MDI | CSII | Mann-Whitney U test | |
| Mediana (Q1–Q3) | U | p-value | ||
| BMI SDS | 0.65 (−0.34–1.19) | 0.77 (0.22–1.21) | 1138 | 0.4 |
| Height, cm | 157.45 (139.12–165.73) | 162.9 (149–169.38) | 990 | 0.06 |
| Height SDS | 0.65 (−0.39–1.17) | 0.7 (−0.03–1.14) | 1200 | 0.68 |
| Tanner stage | 2 (2–4) | 4 (2–5) | 979.5 | 0.049 |
| Fasting plasma glucose, mg/dL | 177.1 (157.38–194.85) | 133.45 (119.32–144.45) | 2323.5 | <0.001 |
| HbA1c, % | 7.6 (6.88–8.31) | 7.3 (6.6–8.4) | 1369.5 | 0.4 |
| Creatinine, mg/dL | 0.56 (0.46–0.6) | 0.7 (0.57–0.74) | 753 | <0.001 |
| eGFR, mL/min/1.73 m² | 118 (105.5–140) | 115.5 (98.16–141.25) | 1327 | 0.65 |
| AST, U/L | 21 (18–28.25) | 21.5 (17–25.75) | 1296 | 0.8 |
| ALT, U/L | 19 (16–23.25) | 18 (15.25–20.75) | 1387.5 | 0.38 |
| Total cholesterol, mg/dL | 167 (148–198) | 162 (136.5–184.75) | 1393.5 | 0.36 |
| Triglycerides, mg/dL | 65 (47.75–92) | 59.5 (53–68.75) | 1344 | 0.57 |
| HDL cholesterol, mg/dL | 63.9 (54–69.25) | 58.2 (51–67) | 1469 | 0.09 |
| LDL cholesterol, mg/dL | 89 (74.5–106) | 89 (76.5–107.25) | 1224.5 | 0.81 |
Table 5.
Comparison of continuous glucose monitoring parameters according to pubertal stage in children treated with CSII (n=42), Kruskal Wallis test.
Table 5.
Comparison of continuous glucose monitoring parameters according to pubertal stage in children treated with CSII (n=42), Kruskal Wallis test.
| Parameter | Tanner I | Tanner II–IV | Tanner V | H | p-value | |
| HbA1c (%) | 6.9 (6.57–7.58) | 7.4 (6.8–8.2) | 7.8 (6.95–8.45) | 1.21 | 0.54 | |
| Time in Range (%) | 67.5 (60.75–73.75) | 70 (63–78) | 76 (67–81) | 5.91 | 0.05 | |
| Hyperglycemia 180–250 mg/dL (%) | 25 (23–29.25) | 20 (16–28) | 14 (12–23) | 6.7 | 0.03 | |
| Hyperglycemia >250 mg/dL (%) | 3 (2–9.25) | 4 (1–10) | 2 (0–9.5) | 1.79 | 0.4 | |
| Hypoglycemia 54–70 mg/dL (%) | 0 (0–1) | 1 (0–2) | 1 (0–3) | 1.94 | 0.37 | |
| Hypoglycemia <54 mg/dL (%) | 2.5 (0.75–6) | 1 (0–4) | 1 (0.50–3.5) | 0.33 | 0.84 | |
| BMI SDS | 0.59 (0.16–1.26) | 0.76 (0.12–1.09) | 0.73 (−0.11–1) | 1.43 | 0.48 | |
| Height SDS | 0.85 (0.5–1.1) | 0.52 (−0.09–0.92) | 0.7 (−0.36–1.26) | 1.07 | 0.58 |
Table 6.
Correlation analysis for BMI SDS and Height SDS in all subjects (n=177).
| Parameter |
BMI SDS Spearman’s ρ |
p-value |
Height SDS Spearman’s ρ |
p-value |
| Age | −0.01 | 0.872 | −0.13 | 0.07 |
| Tanner stage | 0.02 | 0.769 | −0.13 | 0.07 |
| Fasting plasma glucose | −0.06 | 0.379 | −0.02 | 0.77 |
| Creatinine | 0.07 | 0.357 | −0.04 | 0.54 |
| eGFR | −0.08 | 0.266 | 0.19 | 0.01 |
| AST | −0.13 | 0.068 | 0.01 | 0.81 |
| ALT | 0.1 | 0.17 | 0.02 | 0.7 |
Table 7.
Correlation analysis for BMI SDS and Height SDS in all diabetic subjects (n=102).
| Parameter |
BMI SDS Spearman’s ρ |
p-value |
Height SDS Spearman’s ρ |
p-value |
| Age | -0.07 | 0.46 | -0.09 | 0.35 |
| Duration of diabetes | 0.09 | 0.37 | -0.18 | 0.07 |
| Tanner stage | -0.03 | 0.74 | -0.09 | 0.34 |
| HbA1c | -0.1 | 0.28 | -0.13 | 0.16 |
| Fasting plasma glucose | -0.14 | 0.14 | -0.13 | 0.18 |
| Creatinine | 0.01 | 0.89 | -0.13 | 0.17 |
| eGFR | -0.16 | 0.09 | 0.19 | 0.05 |
| Total cholesterol | 0.1 | 0.3 | -0.03 | 0.74 |
| LDL cholesterol | 0.07 | 0.45 | -0.04 | 0.66 |
| HDL cholesterol* | -0.01 | 0.9 | 0.1 | 0.31 |
| Triglycerides | 0.05 | 0.56 | -0.07 | 0.45 |
| AST | -0.04 | 0.64 | 0.003 | 0.97 |
| ALT | -0.06 | 0.52 | -0.13 | 0.16 |
Table 8.
Correlation analysis for BMI SDS and Height SDS in CSII treated diabetic subjects (n=42).
| Parameter |
BMI SDS Spearman’s ρ |
p-value |
Height SDS Spearman’s ρ |
p-value |
| HbA1c (%) | -0.26 | 0.09 | -0.13 | 0.38 |
| Time in Range (%) | 0.21 | 0.18 | 0.18 | 0.23 |
| Hypoglycemia 40–54 mg/dL (%) | 0.08 | 0.59 | 0.08 | 0.58 |
| Hypoglycemia 54–70 mg/dL (%) | 0.34 | 0.02 | -0.04 | 0.76 |
| Hyperglycemia 180–250 mg/dL (%) | -0.18 | 0.23 | -0.17 | 0.26 |
| Hyperglycemia 250–400 mg/dL (%) | -0.2 | 0.18 | -0.22 | 0.14 |
| Coefficient of variation (%) | -0.13 | 0.38 | -0.07 | 0.66 |
Table 9.
Multiple linear regression analysis for factors associated with BMI SDS (n=177).
| Predictor | B | SE | Standardized β | 95% CI | p-value | VIF |
| Age | 0.007 | 0.06 | 0.01 | −0.12 to 0.13 | 0.91 | 5.76 |
| Sex | 0.02 | 0.22 | 0.01 | −0.41 to 0.47 | 0.89 | 1.09 |
| Residence | −0.52 | 0.21 | −0.18 | −0.95 to −0.09 | 0.01 | 1.02 |
| Tanner stage | 0.020 | 0.16 | 0.02 | −0.3 to 0.33 | 0.9 | 6.03 |
| Fasting plasma glucose | −0.002 | 0.002 | −0.07 | −0.007 to 0.003 | 0.36 | 1.14 |
| eGFR | −0.006 | 0.004 | −0.1 | −0.01 to 0.003 | 0.18 | 1.14 |
| AST | 0.0003 | 0.003 | 0.01 | −0.006 to 0.007 | 0.92 | 3.59 |
| ALT | −0.0005 | 0.005 | −0.01 | −0.01 to 0.009 | 0.91 | 3.51 |
Table 10.
Multiple linear regression analysis for factors associated with height SDS (n = 177).
| Predictor | B | SE | Standardized β | 95% CI | p-value | VIF |
| Age (years) | −0.02 | 0.05 | −0.07 | −0.12 to 0.08 | 0.69 | 5.76 |
| Sex | −0.12 | 0.17 | −0.05 | −0.48 to 0.22 | 0.47 | 1.09 |
| Residence | 0.35 | 0.17 | 0.15 | 0.004 to 0.7 | 0.04 | 1.06 |
| BMI SDS | 0.14 | 0.06 | 0.18 | 0.02 to 0.27 | 0.01 | 1.05 |
| Tanner stage | −0.02 | 0.12 | −0.04 | −0.28 to 0.22 | 0.82 | 6.03 |
| Fasting plasma glucose | 0.0004 | 0.002 | 0.01 | −0.004 to 0.004 | 0.85 | 1.14 |
| eGFR | 0.005 | 0.004 | 0.12 | −0.002 to 0.013 | 0.13 | 1.15 |
| AST | −0.002 | 0.003 | −0.1 | −0.007 to 0.003 | 0.46 | 3.59 |
| ALT | 0.002 | 0.004 | 0.08 | −0.005 to 0.009 | 0.55 | 3.51 |
Table 11.
Multiple linear regression analysis for factors associated with metabolic control and height SDS in subjects with T1DM (n=102).
Table 11.
Multiple linear regression analysis for factors associated with metabolic control and height SDS in subjects with T1DM (n=102).
| Predictor | B | SE | Standardized β | 95% CI | p-value | VIF |
| Fasting plasma glucose | −0.003 | 0.007 | −0.12 | −0.01 to 0.01 | 0.63 | 6.03 |
| HbA1c | 0.01 | 0.15 | 0.01 | −0.29 to 0.31 | 0.94 | 3.38 |
| eGFR | 0.004 | 0.004 | 0.12 | −0.004 to 0.01 | 0.29 | 1.16 |
| ALT | 0.001 | 0.003 | 0.04 | −0.005 to 0.007 | 0.71 | 1.61 |
| LDL-c | −0.001 | 0.004 | −0.05 | −0.01 to 0.007 | 0.68 | 1.38 |
| HDL-c | 0.003 | 0.008 | 0.06 | −0.01 to 0.02 | 0.65 | 1.36 |
| Triglycerides | −0.002 | 0.002 | −0.12 | −0.007 to 0.003 | 0.39 | 1.85 |
| CSII versus MDI* | −0.09 | 0.38 | −0.04 | −0.86 to 0.66 | 0.8 | 3.24 |
Dependent variable: height SDS. MDI was coded as 0 and CSII as 1.
Table 12.
Multiple linear regression analysis evaluating the association between glycemic control and height SDS in subjects with T1DM (n=102).
Table 12.
Multiple linear regression analysis evaluating the association between glycemic control and height SDS in subjects with T1DM (n=102).
| Predictor | B | SE | Standardized β | 95% CI | p | VIF |
| HbA1c (%) | −0.073 | 0.090 | −0.086 | −0.252 to 0.106 | 0.422 | 1.20 |
| Age (years) | 0.020 | 0.030 | 0.087 | −0.040 to 0.080 | 0.506 | 1.43 |
| Sex (female vs. male) | 0.142 | 0.207 | 0.071 | −0.269 to 0.553 | 0.494 | 1.08 |
| Diabetes duration (years) | −0.054 | 0.031 | −0.232 | −0.116 to 0.008 | 0.086 | 1.54 |
| CSII versus MDI | −0.210 | 0.257 | −0.098 | −0.721 to 0.301 | 0.416 | 1.30 |
Dependent variable: height SDS. MDI was coded as 0 and CSII as 1.
Disclaimer/Publisher’s Note: The statements, opinions and data contained in all publications are solely those of the individual author(s) and contributor(s) and not of MDPI and/or the editor(s). MDPI and/or the editor(s) disclaim responsibility for any injury to people or property resulting from any ideas, methods, instructions or products referred to in the content. |
© 2026 by the authors. Licensee MDPI, Basel, Switzerland. This article is an open access article distributed under the terms and conditions of the Creative Commons Attribution (CC BY) license (http://creativecommons.org/licenses/by/4.0/).
Copyright: This open access article is published under a Creative Commons CC BY 4.0 license, which permit the free download, distribution, and reuse, provided that the author and preprint are cited in any reuse.