

Submitted:
03 August 2026
Posted:
04 August 2026
You are already at the latest version
Abstract
Accurate crop mapping provides spatially explicit information for agricultural planning, monitoring and resource allocation, while supporting agribusiness decisions related to supply chains and risk management. However, mapping crops in smallholder landscapes remains difficult because fields are often fragmented, small, and irregularly shaped, with varying planting dates. This study evaluated Sentinel-2 Normalised Difference Vegetation Index (NDVI) time series and Dynamic Time Warping (DTW) for maize identification and multi-crop field-boundary classification in a smallholder farming area. A maize reference trajectory was developed from known maize fields and tested using an independent set of maize fields. The maize reference fields showed low DTW distances (0.106 - 0.281) to the reference trajectory, while independent validation fields produced comparable distances (0.074 - 0.325), indicating that maize followed a recognisable NDVI trajectory despite variable planting dates. DTW distances (0.151 to 0.565) of candidate fields suggested that some fields had maize-like phenological behaviour while others were less similar to the maize reference. Days After Planting (DAP) alignment produced a clear maize curve, with NDVI increasing after planting, peaking between 90 and 120 DAP, and later declining. The approach was then extended to multi-crop classification using maize, soybean, potato and tea reference trajectories. The multi-reference DTW classifier achieved an overall validation accuracy of 80.0%, with maize and tea classified most reliably. When applied to 128 unlabelled fields, most were predicted as maize, although DTW confidence varied. The findings show that Sentinel-2 NDVI time series and DTW provide an interpretable and data-efficient approach for maize detection and field-level crop classification in smallholder systems.
Keywords:
sentinel-2
; dynamic time warping
; maize mapping
; smallholder agriculture
1. Introduction
Crop mapping is the process of identifying and categorizing the spatial distribution of cultivated crops across agricultural landscapes (Khosravi, 2025). This process is important because it transforms agriculture from an activity that is largely reported or administratively described into a measurable spatial system (Mathenge et al., 2022; You & Sun, 2022). By showing where specific crops are grown, crop mapping provides the spatial basis for estimating cultivated area, monitoring seasonal crop development, assessing production potential, and linking field-level observations with broader regional or national agricultural statistics (Orynbaikyzy et al., 2019). This information is valuable for policymakers who need reliable evidence to support agricultural planning, food-system monitoring, and resource allocation (Mashaba-Munghemezulu et al., 2021; Schmedtmann & Campagnolo, 2015; Tang et al., 2024). It is also important for agribusinesses, which rely on spatially explicit crop information to optimise supply chains, identify investment opportunities, and manage production and market-related risks (Ainali & Tsiligiridis, 2018). The need for accurate crop mapping has become even more pressing under changing climatic conditions, which affect crop growth, planting calendars, and yield stability, and in the context of a growing human population that places increasing demands on agricultural land and production systems (Choukri et al., 2024; Farooq et al., 2023).
Nevertheless, the mapping and monitoring of crops in smallholder farming areas remains difficult. This is mainly due to fragmented, small and irregularly shaped fields (Debats et al., 2016; Masiza et al., 2020; Sidike et al., 2019), varying planting dates (Black et al., 2023; Masiza et al., 2026; Prudente et al., 2025), and cloud cover, which limits the availability of usable optical satellite imagery during the growing season (Whitcraft et al., 2015). Since smallholder farmers often plant at different times, even within the same locality, crop identification cannot rely only on single-date satellite imagery or simple comparisons between fields observed on the same date. For instance, two maize fields may be at different growth stages on the same image acquisition date, while different crops may appear similar during certain parts of the season. This temporal variability complicates crop classification and motivates the use of time-series methods that can compare the overall shape of crop development trajectories rather than only their values at fixed dates (Pluto-Kossakowska, 2021).
Dynamic time warping (DTW) is a time series similarity method that can compare temporal sequences even when similar patterns occur at different times or progress at different rates (Keogh & Pazzani, 2001; Qiu et al., 2024). This makes DTW more appealing for agricultural applications where planting dates, crop growth rates, and senescence timing differ among fields. Vegetation indices such as the Normalised Difference Vegetation Index (NDVI) are widely used to describe crop growth because they respond to changes in green biomass, canopy cover and phenological development (Huang et al., 2021; Rouse et al., 1974). By extracting NDVI observations across the growing season, it is possible to construct temporal trajectories that describe crop establishment, canopy expansion, peak greenness and senescence (Pan et al., 2015; Seo et al., 2019). Instead of requiring two NDVI curves to match point by point on the same calendar dates, DTW allows local stretching and compression of the time axis to identify similarity in the overall temporal pattern (Keogh & Pazzani, 2001; Qiu et al., 2024). This is particularly relevant for crop mapping in smallholder systems where planting-date variability is common and large training datasets are often unavailable (Hu et al., 2026; Salas et al., 2019; Xiao et al., 2023).
Despite growing interest in DTW-based crop classification, its application to maize detection in fragmented African smallholder landscapes remains limited. Existing studies from Asia, Europe and North America have demonstrated that DTW and its variants can support crop mapping under variable crop calendars, limited training data and complex phenological patterns (Belgiu & Csillik, 2018; Dong et al., 2020; Gella et al., 2021; Singh et al., 2021; Xiao et al., 2023). Much of the existing DTW-based crop mapping literature has focused on rice systems, wheat mapping, crop-intensity mapping, broad cropland extraction, or commercial and intensively managed agricultural landscapes (Csillik et al., 2019; Guo et al., 2020; Hu et al., 2026; Li et al., 2025; Rafif et al., 2021). Less attention has been given to maize detection in fragmented African smallholder systems, where fields are small, planting dates vary and ground-reference data are limited.
This study therefore evaluates Sentinel-2 NDVI time series and DTW for maize identification and multi-crop field-boundary classification in the O.R. Tambo District Municipality, South Africa. Specifically, it asks: (i) can DTW identify maize fields despite variable planting dates? (ii) does Days After Planting (DAP) alignment provide a meaningful representation of maize phenology? and (iii) can a calendar-date multi-reference DTW approach classify field polygons into maize and other crop classes in a smallholder landscape?
2. Materials and Methods
2.1. Study Area
The study was conducted in the O.R. Tambo District Municipality located in the Eastern Cape Province of South Africa (Figure 1). The area has five local municipalities, namely: Mhlontlo, Ngquza Hill, Nyandeni, Port St Johns, and King Sabata Dalindyebo. The most practiced agricultural activity is smallholder crop farming dominated by maize, followed by soybean, potato, tea, and leafy vegetables grown in smaller fields often less than one hectare (Masiza et al., 2026). Maize, potato, and soybean are planted in communal lands with farm sizes ranging from just below one hectare to a few 100 hectares, often planted between August and January, while tea is a perennial crop grown in the well-known Magwa Tea Estate (Hajdu et al., 2020; Kepe, 2005; Masiza et al., 2020). The tea plantations consist of the evergreen plant, Camellia sinensis, which is a perennial shrub that is continually harvested and can live and produce for decades. Potatoes are harvested between December and April, while maize and soybean are harvested between May and July.
Driven by its coastal positioning, diverse terrain, and distinct climatic shifts, the district supports a varied ecological landscape. While the coastal fringe is characterized by dense thickets and woody vegetation, the interior transitions into a landscape dominated by grasslands and savannas (Mucina & Rutherford, 2006). Climatically, the region shifts from a humid, subtropical coastal zone to a more temperate, semi-dry inland plateau (Beck et al., 2018). Rainfall is highly seasonal, concentrated between October and March, yielding 800-1200 mm annually near the sea and dropping to 600-900 mm further inland. Temperatures near the coast remain moderate throughout the year, averaging summer highs of 24-30 °C and winter lows of 8-12 °C. Conversely, the interior experiences sharper seasonal fluctuations, with summer temperatures reaching 30 °C and winter nights dropping to between 3-5 °C.
The Eastern Cape Province, particularly the O.R. Tambo District Municipality is an ideal study area for small-scale crop mapping because it contains South Africa’s largest concentrations of smallholder farmers, who cultivate maize under highly fragmented and rainfed conditions (National Department of Agriculture, 2025). Furthermore, it is characterized by variable planting dates and frequent cloud-related observation challenges. It is hoped that the methods and findings generated from this research have strong potential for broader application in other smallholder crop farming areas.
2.2. Field and Training Data
The data consisted of 342 field polygons representing known and unknown crop fields for the 2025/26 summer season, identified through field-visits and records obtained from extension officers. Field polygons were used as the basic spatial unit of analysis because they represent agricultural management units and allow satellite-derived NDVI values to be summarised at field level. Two related datasets were used to support the maize reference-trajectory analysis and the multi-crop field-boundary classification.
2.2.1. Maize Reference-Trajectory and DAP Field Dataset
The maize reference-trajectory analysis used 28 known maize fields with recorded planting dates. These fields were distributed across the district representing different cultivation areas, cultivars, and planting dates. The planting dates ranged from October to January, capturing the planting-time variability commonly observed among smallholder farms in South Africa (De Villiers et al., 2024; Dlamini et al., 2026; Masiza et al., 2021; Masupha & Moeletsi, 2017, 2020). The maize cultivars were varieties of Pannar, Dekalb, Lima Green, and unbranded open pollinated seeds.
The 28 known maize fields were divided into two groups. The first group consisted of 19 maize fields used to develop the representative maize NDVI reference trajectory for the DTW analysis. The second group consisted of nine independent maize fields reserved for validation. These validation fields provided an independent test of whether the maize reference trajectory could generalise to unseen maize fields. Since DAP analysis requires known planting dates, the 28 known maize fields were used to construct the crop-age-aligned maize phenology curve (Table 1).
In addition to the known maize fields, 31 candidate fields of unknown crop type were digitised from Sentinel-2 imagery. These fields were selected because they showed visual and seasonal vegetation characteristics similar to known maize fields, including field shape, texture and seasonal greening patterns. The candidate fields were not used to develop the maize reference trajectory. Instead, they were used to test whether the maize reference trajectory could identify additional fields with maize-like phenological behaviour (Table 1). Since their true crop labels were unknown, these candidate fields were interpreted using DTW similarity values rather than formal classification accuracy.
2.2.2. Multi-Crop Field-Boundary Classification Dataset
The multi-crop field-boundary classification used a larger dataset of 342 field polygons. This datset included 93 maize fields, 42 soybean fields, 28 potato fields, 51 tea fields and 128 fields of unknown crop type. The known fields were used for reference-trajectory development and validation, while the unknown fields were reserved for prediction and mapping (Table 2).
The known fields were divided into reference and validation groups. The reference group consisted of 144 fields, including 63 maize, 28 soybean, 18 potato and 35 tea fields. These fields were used to develop crop-specific NDVI reference trajectories. The validation group consisted of 70 independent fields, including 30 maize, 14 soybean, 10 potato and 16 tea fields. These validation fields were excluded from reference-trajectory development and were used only to assess the performance of the multi-reference DTW classifier (Table 3).
The 128 unknown fields had no confirmed crop labels and were therefore excluded from accuracy assessment. They were used to evaluate the operational application of the multi-reference DTW approach. Each unknown field was compared with the maize, soybean, potato and tea reference trajectories, and the crop class with the lowest DTW distance was assigned as the predicted crop. These outputs were interpreted as field-level predictions rather than validation results. The 128 unknown fields were located within an intensely cultivated sub-area of the ORTDM, covering approximately 10 km × 10 km. This sub-area was selected because it contained a high concentration of digitised crop fields and provided a practical test area for applying the multi-reference DTW classifier to unlabelled field polygons. The resulting predictions should therefore be interpreted as field-level classifications within this selected cultivated zone, rather than as a wall-to-wall crop map for the entire district.
2.3. Sentinel-2 NDVI Time-Series Extraction Using Google Earth Engine
Sentinel-2 Level-2A Surface Reflectance imagery was used to generate field-level NDVI time series for all field polygons. The imagery was obtained from the Copernicus Sentinel-2 Harmonized archive in Google Earth Engine (Gorelick et al., 2017). Sentinel-2 was selected because its 10 m red and near-infrared bands are suitable for monitoring seasonal vegetation development in smallholder agricultural fields (Drusch et al., 2012; Segarra et al., 2020).
Two temporal windows were used to match the analytical requirements of the study. For the maize reference-trajectory and DAP analysis, imagery from October 2025 to May 2026 was used, corresponding to the main period of maize establishment, canopy development, peak greenness and senescence. For the multi-crop field-boundary classification, the extraction period was extended from 1 August 2025 to 31 May 2026 to include the seasonal development of maize, soybean, potato and tea.
Cloud-affected and invalid pixels were removed using the Sentinel-2 Scene Classification Layer. Pixels classified as no-data, saturated or defective, cloud shadow, medium-probability cloud, high-probability cloud, cirrus, snow or ice were excluded. A relatively relaxed scene-level cloud threshold of 70% was used to maximise temporal coverage during the cloudy summer growing season, while the pixel-level SCL mask was relied upon to remove cloud-contaminated pixels within each image.
NDVI was calculated for each valid Sentinel-2 observation using the red (B4) and near-infrared (B8) bands (Huang et al., 2021; Rouse et al., 1974):
The image collection was then aggregated into consecutive 10-day composite periods. For each 10-day interval, the median NDVI value was calculated from all valid observations available within that period. Median compositing was used to reduce the influence of residual cloud contamination, atmospheric noise and anomalous observations while preserving the seasonal pattern of crop development.
Field-level NDVI values were extracted by calculating the mean NDVI within each field polygon for every 10-day composite period. This converted the satellite imagery into a field-by-date time-series matrix, where each row represented a field polygon and each column represented a 10-day NDVI composite. The maize reference-trajectory analysis produced a 22-period NDVI trajectory for each field, while the multi-crop classification produced a 31-period trajectory for each field because of the longer extraction window.
2.4. Data Preparation, Interpolation and Smoothing in Python
Data preparation and analysis were conducted in Python using Jupyter Notebook. The main packages used were pandas for data handling, NumPy for numerical operations, matplotlib for plotting, whittaker-eilers for Whittaker smoothing, dtaidistance for DTW distance calculation, and scikit-learn for accuracy assessment. The scipy clustering functions were used only for exploratory assessment of pairwise DTW distances among maize fields and were not used in the final classification.
Missing values in the field-level NDVI time series were filled using linear interpolation (Lepot et al., 2017) along each field’s temporal profile. For the maize reference-trajectory and DAP analysis, the interpolated NDVI trajectories were further smoothed using a Whittaker filter (Atkinson et al., 2012). The smoothed trajectories were then used for maize reference-trajectory development, DTW similarity analysis and DAP-aligned phenology assessment. For the multi-crop field-boundary DTW classification, interpolated calendar-date NDVI trajectories were used directly 10-day median compositing and field-level averaging. No additional smoothing filter was applied in this phase. This phase was intended as an interpretable NDVI-DTW baseline in which temporal noise was reduced mainly through median compositing, field-level averaging, and crop-reference averaging. The effect of explicit smoothing in the multi-crop DTW stage was not tested and is therefore acknowledged as a methodological sensitivity issue.
2.5. Maize Reference-Trajectory Development and DTW Similarity Analysis
A maize reference trajectory was developed to test whether known maize fields shared a sufficiently consistent Sentinel-2 NDVI temporal pattern to support DTW-based maize identification. The smoothed NDVI trajectories of the 19 maize reference fields were averaged at each 10-day composite period to produce a representative calendar-date maize NDVI trajectory. This reference curve represented the typical seasonal development of maize in the study area, from establishment and canopy expansion to peak greenness and senescence.
Dynamic Time Warping was then used to compare each field-level NDVI trajectory with the maize reference trajectory. DTW allows local stretching and compression of the time axis, making it suitable for comparing fields that follow similar phenological patterns but differ in the timing or rate of development (Chaves et al., 2021; Keogh & Pazzani, 2001; Qiu et al., 2024; Xiao et al., 2023). Let represent the NDVI time series of a field and represent the maize reference trajectory. DTW calculates the minimum cumulative distance between X and Y by allowing observations in the two sequences to be matched flexibly through time. The cumulative DTW cost is defined as:
where is the local distance between two NDVI observations. The final DTW distance is representing the minimum cumulative cost required to align the two trajectories. Lower DTW distances indicate greater similarity to the maize reference trajectory, while higher distances indicate greater phenological divergence. The maize reference trajectory was first evaluated using the same 19 maize fields from which it was developed to examine the internal consistency of the reference group. It was then tested against nine independent maize validation fields that were not used during reference-trajectory development. This provided an independent assessment of whether the maize reference could generalise to unseen maize fields.
After validation, the same reference trajectory was applied to 31 candidate fields of unknown crop type to identify fields with maize-like phenological behaviour. Candidate fields with low DTW distances were interpreted as more similar to the maize reference, while fields with larger distances were interpreted as less similar and requiring further investigation. These DTW distances were used as relative indicators of maize similarity rather than definitive crop labels.
2.5.1. DAP Alignment and Maize Phenology Assessment
Although DTW can accommodate temporal shifts in crop trajectories, it does not explicitly express crop development according to crop age. A DAP analysis was therefore conducted to assess whether maize phenology could be described more meaningfully by aligning NDVI observations according to the number of days elapsed since planting rather than calendar date. Planting dates were available for all 28 known maize fields, allowing each NDVI observation to be converted from acquisition date to DAP. For each NDVI observation, DAP was calculated as:
Observations with negative DAP values were excluded because they occurred before planting and therefore did not represent maize growth. The remaining observations were grouped into 10-day DAP intervals by assigning each observation to the nearest multiple of ten days. This binning reduced noise associated with small differences in image acquisition timing and increased the number of observations contributing to each crop-age interval. For each DAP interval, mean and median NDVI values were calculated across all contributing maize fields to produce a crop-age-aligned maize phenology curve.
The reliability of the DAP-aligned curve was assessed by counting the number of observations contributing to each DAP interval. This helped identify parts of the maize growth cycle with strong or limited data support. To examine whether planting month influenced maize development, separate DAP-aligned trajectories were also generated for fields planted in October, November, December and January. These planting-month trajectories were compared in terms of the timing and magnitude of peak NDVI. Finally, individual field trajectories were visually compared with their corresponding planting-month averages to assess residual field-to-field variability after crop-age alignment.
2.6. Multi-Crop Reference-Trajectory Development
To extend the analysis from maize-only similarity assessment to multi-crop classification, crop-specific NDVI reference trajectories were developed for maize, soybean, potato and tea. Only fields assigned to the reference group were used for this step. For each crop class, the interpolated field-level NDVI trajectories of all reference fields were averaged at each 10-day composite period. This produced four calendar-date reference trajectories representing the typical seasonal NDVI behaviour of maize, soybean, potato and tea during the 2025/26 growing season. The maize reference trajectory was developed from 63 maize reference fields, the soybean trajectory from 28 soybean fields, the potato trajectory from 18 potato fields and the tea trajectory from 35 tea fields. These four crop reference trajectories were used as the basis for multi-reference DTW classification.
2.6.1. Multi-Reference DTW Classification, Validation and Mapping
Each validation and unknown field was compared with the four crop reference trajectories using DTW. For every field, four DTW distances were calculated: distance to the maize reference, distance to the soybean reference, distance to the potato reference and distance to the tea reference. The field was assigned to the crop class with the lowest DTW distance, based on the assumption that the closest reference trajectory represented the most phenologically similar crop. In addition to the predicted crop class, the minimum DTW distance and the difference between the smallest and second-smallest DTW distances were recorded. This difference was used as the DTW margin. Larger margins indicated clearer separation between the best-matching crop reference and the next-best alternative, while smaller margins indicated greater classification uncertainty. Confidence classes were assigned using practical margin thresholds: high confidence for margins of 0.15 or greater, moderate confidence for margins between 0.07 and 0.15, and low confidence or uncertainty for margins below 0.07.
The multi-reference DTW classifier was first evaluated using the 70 independent validation fields. These fields had known crop labels but were not used to develop the crop reference trajectories. Predicted crop labels were compared with the known labels to generate a confusion matrix, from which overall accuracy, precision, recall and F1-score (Naidu et al., 2023; Sathyanarayanan, 2024) were calculated for maize, soybean, potato and tea. To assess whether the classification results represented meaningful agreement beyond chance, Cohen’s kappa was calculated. A 95% confidence interval was also calculated for overall accuracy to indicate uncertainty associated with the validation sample size. Practical significance was assessed by comparing the observed overall accuracy with the no-information rate, defined as the accuracy that would be obtained by assigning all validation fields to the majority crop class.
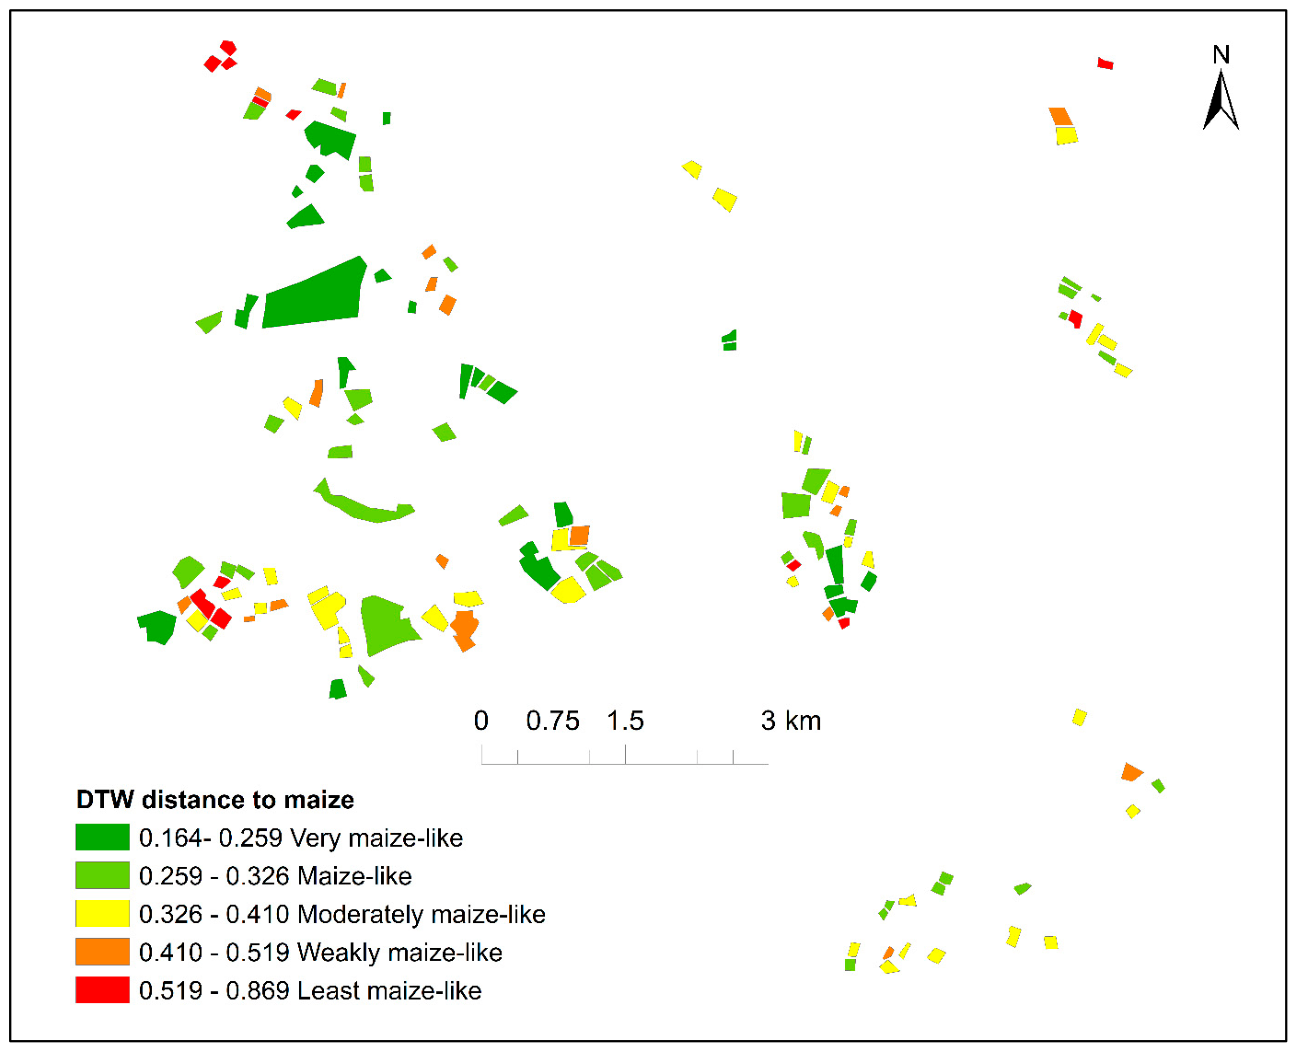
After validation, the multi-reference DTW framework was applied to the 128 unknown field polygons. Each unknown field was assigned to the crop class whose reference trajectory produced the lowest DTW distance. The prediction results were joined back to the original field-boundary layer using the FieldID attribute. Three map products were generated: a predicted crop type map, a DTW confidence map based on the DTW margin, and a maize-likeness map based on the DTW distance to the maize reference trajectory.
3. Results
3.1. Maize Reference Trajectory and DTW-Based Maize Similarity
The maize reference trajectory developed from the known maize fields captured the expected seasonal pattern of maize growth, with NDVI increasing from early crop establishment through canopy expansion, reaching a period of high greenness, and declining during senescence (Figure 2). This curve was used as the reference against which both validation and candidate field trajectories were compared.
DTW distances for the reference fields ranged from 0.106 to 0.281 (Table 4). The independent maize validation fields also produced comparable DTW distances, ranging from 0.074 to 0.325, indicating that the reference trajectory generalised well to maize fields not used during reference development. The independent maize validation fields provided an empirical maize-similarity envelope for interpreting candidate fields. Since the maximum DTW distance among independent maize validation fields was 0.325, candidate fields with DTW distances at or below this value were considered to fall within the validated maize-like range. Using this benchmark, 14 of the 31 candidate fields (45.2%) fell within the validated maize-like range, while 17 fields (54.8%) exceeded it and were therefore interpreted as less similar to the maize reference or requiring further field verification. This threshold should not be interpreted as a definitive classification boundary, but as a practical similarity benchmark derived from known maize fields (Table 4).
3.1.1. DAP-Aligned Maize Phenology
The DAP-aligned maize trajectory showed a clear and interpretable maize growth pattern. Mean NDVI was low immediately after planting, at approximately 0.22 during the first 10 days after planting, increased during vegetative development, peaked between approximately 90 and 120 DAP, and declined thereafter. This pattern shows that maize fields followed a common developmental pathway when observations were expressed according to crop age rather than calendar date (Figure 3).
Observation support was strongest during the main maize growth period and declined towards the late season as fewer fields remained within the observation window (Supplementary Figure S1). This means that the DAP curve is most reliable for the early, vegetative and peak-growth stages, while late-season values should be interpreted more cautiously. Planting-month trajectories showed broadly similar maize development patterns after DAP alignment, despite fields being planted between October and January (Supplementary Figure S2). This indicates that crop-age alignment reduced part of the variability caused by different planting dates. Observation support refers to the number of field-date NDVI observations contributing to each 10-day DAP interval, rather than the number of unique fields.
3.2. Multi-Crop Reference Trajectories
The crop-specific reference trajectories for maize, soybean, potato and tea showed clear differences in seasonal NDVI behaviour (Figure 4). Tea was the most distinct class because it maintained high NDVI values through most of the season, reflecting its perennial growth habit. Among the annual crops, potato developed earlier, soybean reached high greenness later, and maize showed a later and more sustained high-NDVI period extending into March and early April. These differences in timing and seasonal trajectory formed the basis for the multi-reference DTW classification.
3.2.1. Validation of the Multi-Reference DTW Classifier
The multi-reference DTW classifier was evaluated using 70 independent validation fields, consisting of 30 maize, 10 potato, 14 soybean and 16 tea fields. The classifier correctly classified 56 of the 70 fields, producing an overall validation accuracy of 80.0% (Table 5). Maize and tea were classified most reliably, while soybean and potato showed greater confusion with the other annual crops. Maize classification was relatively strong, with 25 of 30 maize fields correctly classified. Tea was perfectly separated, with all 16 tea fields correctly classified. Soybean showed moderate performance, with 11 of 14 fields correctly classified, while potato was the weakest class, with 4 of 10 fields correctly classified.
The class-level accuracy metrics confirm this pattern: maize achieved precision, recall and F1-score values of 0.83, while tea achieved 1.00 for all three metrics. Potato had the lowest recall and F1-score (Table 6).
The classifier achieved a Cohen’s kappa value of 0.71, indicating substantial agreement beyond chance. The Wilson 95% confidence interval for overall accuracy was 69.2-87.7%. The no-information rate, based on assigning all validation fields to the majority class, was 42.9%. The multi-reference DTW classifier therefore improved on this simple baseline by 37.1 percentage points, indicating practical classification value beyond majority-class prediction.
3.2.2. Prediction of Unknown Fields and DTW Confidence
After validation, the multi-reference DTW classifier was applied to the 128 unknown field polygons within the selected 10 km × 10 km cultivated sub-area. Most unknown fields were predicted as maize. Of the 128 fields, 110 were classified as maize, 15 as soybean, and 3 as potato (Table 7).
Figure 5 shows the distribution of the predicted crop types for the 128 unknown field polygons.
Prediction confidence varied across the unknown fields (Table 8). Based on the DTW margin, 28 fields were classified as high-confidence predictions, 52 as moderate-confidence predictions and 48 as low-confidence or uncertain predictions (Supplementary Figure S3). This indicates that the predicted crop map should not be interpreted as uniformly reliable; low-confidence fields should be prioritised for field verification or further analysis.
Figure 6.
Maize-likeness of unknown field polygons based on DTW distance to the maize reference trajectory.
Figure 6.
Maize-likeness of unknown field polygons based on DTW distance to the maize reference trajectory.
3.2.3. Effect of DAP Alignment on Multi-Crop Classification
The DAP-aligned DTW test was conducted to determine whether aligning crop trajectories by crop age improved multi-crop classification. This test included maize, soybean and potato fields with known planting dates. Tea and unknown fields were excluded because planting dates were not available. The full DAP-DTW approach produced a validation accuracy of 49.1%, which was substantially lower than the 80.0% achieved by the calendar-date multi-reference DTW classifier. A restricted DAP-DTW test using only the 0-160 DAP period performed even worse, with an accuracy of 32.1%. These results show that DAP alignment was useful for describing maize phenology, but not for separating maize, soybean and potato in this dataset. When annual crops were aligned by crop age, their trajectories became more similar because they all followed a general pattern of early low NDVI, canopy expansion, peak greenness and decline. Calendar-date trajectories were therefore more informative for multi-crop classification because they preserved differences in seasonal timing.
4. Discussion
4.1. DTW-Based Maize Identification in Smallholder Fields
The results show that a representative maize NDVI trajectory could be developed from a relatively small number of known maize fields and used to identify fields with similar phenological behaviour. The low DTW distances observed for both the maize reference fields and the independent maize validation fields indicate that maize followed a recognisable seasonal NDVI pattern despite differences in planting dates. This is important in smallholder systems, where farmers do not plant simultaneously and where maize fields may therefore appear at different growth stages on the same satellite acquisition date. The finding supports the value of DTW as a shape-based time-series similarity method for crop mapping under temporal displacement, as also reported in previous DTW-based crop classification studies (Belgiu & Csillik, 2018; Dong et al., 2020; Singh et al., 2021; Xiao et al., 2023).
The application of the maize reference trajectory to candidate fields further demonstrated the practical value of DTW as a maize-likeness screening tool. Some candidate fields had DTW distances comparable to those of known maize fields, suggesting that the method can identify additional fields with maize-like phenological behaviour. However, the wider DTW range among candidate fields also shows that not all visually selected candidate fields were equally similar to maize. This confirms that DTW should be interpreted as a similarity measure rather than as an automatic definitive crop label. Fields with low DTW distances can be treated as strong maize candidates, while fields with higher distances should be prioritised for further verification.
4.2. Value and Limits of DAP Alignment
The DAP analysis provided a meaningful description of maize development. When observations were expressed according to crop age, the maize trajectory followed the expected sequence of low NDVI after planting, increasing greenness during vegetative growth, peak canopy development, and decline during senescence. This confirms that DAP alignment is useful for understanding maize phenology because it reduces the effect of different planting dates when the comparison is restricted to one crop. However, the results also show that DAP alignment is not automatically better for all classification tasks. In the multi-crop test, DAP-DTW performed worse than calendar-date DTW. This is an important methodological finding. DAP alignment helped describe maize growth, but when maize, soybean and potato were aligned by crop age, their trajectories became more similar because all three annual crops followed the same general growth pattern: establishment, canopy expansion, peak greenness and decline. In contrast, calendar-date trajectories preserved seasonal timing differences among crops, which helped separate maize, soybean and potato. DAP was valuable for characterising maize phenology, while calendar-date trajectories were more informative for multi-crop separation in this dataset.
4.3. Multi-Crop DTW Classification and Crop Separability
The calendar-date multi-reference DTW classifier achieved useful field-level crop separation, with an overall validation accuracy of 80%. This indicates that Sentinel-2 NDVI trajectories contained sufficient temporal information to distinguish maize, soybean, potato and tea at field-boundary scale. Tea was the easiest class to separate because it is a perennial crop with a consistently different NDVI profile from the annual crops. Maize was also classified reliably, suggesting that its seasonal NDVI trajectory was sufficiently distinct from the other reference crops for most validation fields.
The main classification challenge occurred among the annual crops, especially soybean and potato. This is expected because annual summer crops can share similar NDVI behaviour during parts of the growing season. Similar confusion has been reported in other DTW studies where crop separability depended strongly on how distinct the temporal profiles were. For example, a study found that maize and potato had similar SAR temporal profile shapes, which increased confusion between the two crops (Gella et al., 2021). Another study showed that DTW may underperform when classes have similar temporal patterns, even when high-resolution time-series data are available (Rafif et al., 2021). The confusion among maize, soybean and potato also reflects a limitation of using NDVI alone. NDVI captures greenness and canopy development, but it may not fully represent crop structural differences, red-edge behaviour, soil background effects or moisture-related variation. Additional spectral indices may therefore improve separation among annual crops with similar NDVI trajectories.
4.4. Importance of Field-Boundary Classification and Confidence Outputs
The field-boundary approach was important because each polygon represented a meaningful agricultural management unit. Averaging NDVI within field boundaries reduced pixel-level noise, field-edge effects and residual cloud contamination. This is particularly relevant in fragmented smallholder landscapes, where individual pixels may contain mixed signals from crop canopy, bare soil, weeds, field margins or neighbouring vegetation. The value of object- or parcel-based DTW has also been demonstrated in previous studies, where object-based methods reduced noise and improved classification compared with pixel-based classification (Csillik et al., 2019; Dong et al., 2020; Xiao et al., 2023). Field-boundary classification, therefore, provided a practical way to classify crop type at the same scale at which agricultural decisions are made.
The use of DTW margin and maize-likeness also strengthened interpretation of the predictions. The unknown-field map showed that most unknown fields were closest to maize, but the confidence analysis revealed that not all predictions were equally reliable. This distinction is important for operational use. A categorical crop map gives a single class label, while the DTW distance and margin provide information about how strongly a field matches the assigned crop and how close it was to the next-best alternative. Similar ideas have been used in DTW studies where dissimilarity values were treated as useful indicators of uncertainty, outliers or classification confidence (Csillik et al., 2019; Moola et al., 2021).
4.5. Implications for Maize Mapping in South African Smallholder Systems
The study contributes to DTW-based crop mapping by focusing on maize detection in a fragmented African smallholder landscape. Most previous DTW crop-mapping studies have focused on rice, wheat, crop intensity, broad cropland extraction or commercial farming systems. In contrast, this study tested whether Sentinel-2 NDVI time series and DTW can support maize identification and multi-crop field-boundary classification in a smallholder context where field sizes, planting dates and crop calendars vary. The findings suggest that DTW can provide an interpretable and data-efficient framework for smallholder maize monitoring. It does not require very large training datasets, and its outputs are easy to interpret because each field is compared with reference crop trajectories. This makes it useful where field observations are limited but some reliable crop reference fields are available. The approach is also operationally attractive because it can produce both crop labels and confidence indicators, allowing uncertain fields to be targeted for additional ground verification.
5. Limitations and Future Work
Several limitations should be noted. First, the analysis relied on field-boundary polygons. This is useful where boundaries are available, but the approach cannot yet produce wall-to-wall maize maps without a field-boundary layer or a pixel-wise extension. Second, the analysis used NDVI only. Although NDVI captured the main seasonal growth pattern, additional indices such as red-edge or soil-background indices may improve separation between crops with similar NDVI trajectories. Third, the number of validation fields was limited for some classes, especially potato, which means that class-level accuracy estimates should be interpreted cautiously.
Future work should test the approach across additional seasons and areas to evaluate temporal and spatial transferability. It should also explore multi-index DTW, Sentinel-1 SAR integration, and hybrid DTW-machine learning methods. These extensions may improve robustness under cloud cover and increase separability between maize and other seasonal crops. Finally, the maize-likeness and DTW confidence outputs should be linked to targeted field verification so that the system can improve over time through iterative learning.
Supplementary Materials
The following supporting information can be downloaded at the website of this paper posted on Preprints.org. Figure S1: Observation support across DAP intervals for the maize phenology analysis; Figure S2: DAP-aligned maize NDVI trajectories by planting month; Figure S3: Confidence of DTW crop predictions based on DTW margin.
Author Contributions
Conceptualization: Wonga Masiza, Pitso Walter Khoboko, Johannes George Chirima. Data curation: Wonga Masiza. Formal analysis: Wonga Masiza. Funding acquisition: Wonga Masiza, Pitso Walter Khoboko, Johannes George Chirima. Investigation: Wonga Masiza, Pitso Walter Khoboko. Methodology: Wonga Masiza, Pitso Walter Khoboko. Project administration: Wonga Masiza, Johannes George Chirima, Pitso Walter Khoboko. Validation: Johannes George Chirima, Pitso Walter Khoboko. Writing – original draft: Wonga Masiza. Writing – review and editing: Johannes George Chirima, Pitso Walter Khoboko.
Funding
This work was supported by the National Earth Observation and Space Secretariat (NEOSS) under the Agricultural Research Council’s project number: ISC012601000001.
Data Availability Statement
The satellite data used in this study is publicly available. Shapefiles and farm boundaries are available upon reasonable request through the first author.
Acknowledgments
The authors wish to thank South Africa’s Agricultural Research Council (ARC) for supporting this work, and the National Earth Observation and Space Secretariat (NEOSS) for funding the research activities that enabled the writing of this paper. We thank Advocate Lulekwa Makapela, Ms Christelle Taylor, and Kwanele Ngongoma for project coordination. We also thank farmers and officials from the Eastern Cape’s Department of Agriculture for providing cropping information.
Conflicts of Interest
The authors declare no conflicts of interest.
References
- Ainali, K.; Tsiligiridis, T. Remote Sens. Big AgriData Food Availab. 2018. [CrossRef]
- Atkinson, P.M.; Jeganathan, C.; Dash, J.; Atzberger, C. Inter-comparison of four models for smoothing satellite sensor time-series data to estimate vegetation phenology. Remote Sens. Environ. 2012, 123. [Google Scholar] [CrossRef]
- Beck, H.E.; Zimmermann, N.E.; McVicar, T.R.; Vergopolan, N.; Berg, A.; Wood, E.F. Present and future köppen-geiger climate classification maps at 1-km resolution. Sci. Data 2018, 5, 1–12. [Google Scholar] [CrossRef] [PubMed]
- Belgiu, M.; Csillik, O. Sentinel-2 cropland mapping using pixel-based and object-based time-weighted dynamic time warping analysis. Remote Sens. Environ. 2018, 204. [Google Scholar] [CrossRef]
- Black, E.; Asfaw, D.T.; Sananka, A.; Aston, S.; Boult, V.L.; Maidment, R.I. Application of TAMSAT-ALERT soil moisture forecasts for planting date decision support in Africa. Front. Clim. 2023, 4. [Google Scholar] [CrossRef]
- Chaves, M.E.D.; Alves, M.d.C.; Sáfadi, T.; de Oliveira, M.S.; Picoli, M.C.A.; Simoes, R.E.O.; Mataveli, G.A.V. Time-weighted dynamic time warping analysis for mapping interannual cropping practices changes in large-scale agro-industrial farms in Brazilian Cerrado. Sci. Remote Sens. 2021, 3, 100021. [Google Scholar] [CrossRef]
- Choukri, M.; Laamrani, A.; Chehbouni, A. Use of Optical and Radar Imagery for Crop Type Classification in Africa: A Review. In Sensors; 2024; Vol. 24. [Google Scholar] [CrossRef] [PubMed]
- Csillik, O.; Belgiu, M.; Asner, G.; Kelly, M. Object-Based Time-Constrained Dynamic Time Warping Classification of Crops Using Sentinel-2. Remote Sens. 2019, 11(10), 1257. [Google Scholar] [CrossRef]
- De Villiers, C.; Munghemezulu, C.; Tesfamichael, S.G.; Mashaba-Munghemezulu, Z.; Chirima, G.J. Mapping smallholder maize farm distribution using multi-temporal Sentinel-1 data integrated with Sentinel-2, DEM and CHIRPS precipitation data in Google Earth Engine. South Afr. J. Geomat. 2024, 13(2), 321–351. [Google Scholar] [CrossRef]
- Debats, S.R.; Luo, D.; Estes, L.D.; Fuchs, T.J.; Caylor, K. A generalized computer vision approach to mapping crop fields in heterogeneous agricultural landscapes. Remote Sens. Environ. 2016, 179, 210–221. [Google Scholar] [CrossRef]
- Dlamini, L.; Crespo, O.; van Dam, J.; Gaso, D.V.; de Wit, A. Climate change impacts on rainfed maize production of small-scale cropping systems in Eastern Cape, South Africa. Agric. Syst. 2026, 233. [Google Scholar] [CrossRef]
- Dong, Q.; Chen, X.; Chen, J.; Zhang, C.; Liu, L.; Cao, X.; Zang, Y.; Zhu, X.; Cui, X. Mapping Winter Wheat in North China Using Sentinel 2A/B Data: A Method Based on Phenology-Time Weighted Dynamic Time Warping. Remote Sens. 2020, 12(8), 1274. [Google Scholar] [CrossRef]
- Drusch, M.; Del Bello, U.; Carlier, S.; Colin, O.; Fernandez, V.; Gascon, F.; Hoersch, B.; Isola, C.; Laberinti, P.; Martimort, P.; et al. Sentinel-2: ESA’s optical high-resolution mission for GMES operational services. Remote Sens. Environ. 2012, 120, 25–36. [Google Scholar] [CrossRef]
- Farooq, A.; Farooq, N.; Akbar, H.; Hassan, Z.U.; Gheewala, S.H. A Critical Review of Climate Change Impact at a Global Scale on Cereal Crop Production. In Agronomy; 2023; Vol. 13. [Google Scholar] [CrossRef]
- Gella, G.W.; Bijker, W.; Belgiu, M. Mapping crop types in complex farming areas using SAR imagery with dynamic time warping. ISPRS J. Photogramm. Remote Sens. 2021, 175, 171–183. [Google Scholar] [CrossRef]
- Gorelick, N.; Hancher, M.; Dixon, M.; Ilyushchenko, S.; Thau, D.; Moore, R. Google Earth Engine: Planetary-scale geospatial analysis for everyone. Remote Sens. Environ. 2017, 202, 18–27. [Google Scholar] [CrossRef]
- Guo, Z.; Yang, K.; Liu, C.; Lu, X.; Cheng, L.; Li, M. Mapping national-scale croplands in Pakistan by combining dynamic time warping algorithm and density-based spatial clustering of applications with noise. Remote Sens. 2020, 12(21). [Google Scholar] [CrossRef]
- Hajdu, F.; Neves, D.; Granlund, S. Changing Livelihoods in Rural Eastern Cape, South Africa (2002–2016): Diminishing Employment and Expanding Social Protection. J. South. Afr. Stud. 2020. [Google Scholar] [CrossRef]
- Hu, J.; Liu, Z.; Luo, Z.; Ma, H.; Chen, P.; Song, Q.; Xu, B.; Zhan, Y.; Cai, Z. Mapping diverse rice cropping patterns with limited samples by learning phenology-aligned temporal similarity from multi-source remote sensing data. J. Integr. Agric. 2026. [Google Scholar]
- Huang, S.; Tang, L.; Hupy, J.P.; Wang, Y.; Shao, G. A commentary review on the use of normalized difference vegetation index (NDVI) in the era of popular remote sensing. In Journal of Forestry Research; Northeast Forestry University, 2021; Vol. 32, p. Number 1. [Google Scholar] [CrossRef]
- Keogh, E.J.; Pazzani, M.J. Derivative dynamic time warping. In Proceedings of the 2001 SIAM International Conference on Data Mining (SDM), 2001. [Google Scholar]
- Kepe, T. Magwa Tea Venture in South Africa: Politics, Land and Economics. Soc. Dyn. 2005, 31(1). [Google Scholar] [CrossRef]
- Khosravi, I. Advancements in crop mapping through remote sensing: A comprehensive review of concept, data sources, and procedures over four decades. In Remote Sensing Applications: Society and Environment; 2025; Vol. 38. [Google Scholar] [CrossRef]
- Lepot, M.; Aubin, J.B.; Clemens, F.H.L.R. Interpolation in time series: An introductive overview of existing methods, their performance criteria and uncertainty assessment. In Water; 2017; Volume 9. [Google Scholar] [CrossRef]
- Li, H.Y.; Lawarence, J.A.; Mason, P.J.; Ghail, R.C. Fast Dynamic Time Warping and Hierarchical Clustering with Multispectral and Synthetic Aperture Radar Temporal Analysis for Unsupervised Winter Food Crop Mapping. Agriculture 2025, 15(1). [Google Scholar] [CrossRef]
- Mashaba-Munghemezulu, Z.; Chirima, G.J.; Munghemezulu, C. Mapping smallholder maize farms using multi-temporal sentinel-1 data in support of the sustainable development goals. Remote Sens. 2021, 13(9). [Google Scholar] [CrossRef]
- Masiza, W.; Chirima, J.G.; Hamandawana, H.; Kalumba, A.M.; Magagula, H.B. Linking agricultural index insurance with factors that influence maize yield in rain-fed smallholder farming systems. Sustainability 2021, 13(9), 5176. [Google Scholar]
- Masiza, W.; Chirima, J.; Hamandawana, H.; Pillay, R. Enhanced mapping of a smallholder crop farming landscape through image fusion and model stacking. Int. J. Remote Sens. 2020, 41(22), 8739–8756. [Google Scholar]
- Masiza, W.; Nkuna, B.L.; Ratshiedana, P.E.; Madasa, A.; Nduku, L.; Shwatja, T.; Chirima, J.G.; Nyamugama, A.; Abutaleb, K.; Khoboko, P.W.; et al. Predicting smallholder maize yield using sentinel-2-derived phenological metrics. Smart Agric. Technol. 2026, 13, 101870. [Google Scholar] [CrossRef]
- Masupha, T.E.; Moeletsi, M.E. Use of standardized precipitation evapotranspiration index to investigate drought relative to maize, in the Luvuvhu River catchment area, South Africa. Phys. Chem. Earth 2017, 102, 1–9. [Google Scholar] [CrossRef]
- Masupha, T.E.; Moeletsi, M.E. The use of Water Requirement Satisfaction Index for assessing agricultural drought on rain-fed maize, in the Luvuvhu River catchment, South Africa. Agric. Water Manag. 2020, 237(March), 106142. [Google Scholar] [CrossRef]
- Mathenge, M.; Sonneveld, B.G.J.S.; Broerse, J.E.W. Application of GIS in Agriculture in Promoting Evidence-Informed Decision Making for Improving Agriculture Sustainability: A Systematic Review. In Sustainability (Switzerland); 2022; Vol. 14. [Google Scholar] [CrossRef]
- Moola, W.S.; Bijker, W.; Belgiu, M.; Li, M. Vegetable mapping using fuzzy classification of Dynamic Time Warping distances from time series of Sentinel-1A images. Int. J. Appl. Earth Obs. Geoinf. 2021, 102. [Google Scholar] [CrossRef]
- Mucina, L.; Rutherford, M.C. The vegetation of South Africa, Lesotho and Swaziland. In South African National Biodiversity Institute; 2006. [Google Scholar]
- Naidu, G.; Zuva, T.; Sibanda, E.M. A Review of Evaluation Metrics in Machine Learning Algorithms. In Lecture Notes in Networks and Systems; 2023; Volume 724 LNNS. [Google Scholar] [CrossRef]
- National Department of Agriculture. Trends in the Agricultural Sector 2025 . 2025. Available online: https://www.nda.gov.za/index.php/pub.
- Orynbaikyzy, A.; Gessner, U.; Conrad, C. Crop type classification using a combination of optical and radar remote sensing data: A review. Int. J. Remote Sens. 2019, Vol. 40, Number 17. [Google Scholar] [CrossRef]
- Pan, Z.; Huang, J.; Zhou, Q.; Wang, L.; Cheng, Y.; Zhang, H.; Blackburn, G.A.; Yan, J.; Liu, J. Mapping crop phenology using NDVI time-series derived from HJ-1 A/B data. Int. J. Appl. Earth Obs. Geoinf. 2015, 34(1). [Google Scholar] [CrossRef]
- Pluto-Kossakowska, J. Review on multitemporal classification methods of satellite images for crop and arable land recognition. Agriculture 2021, 11(10). [Google Scholar] [CrossRef]
- Prudente, V.H.R.; Garcia-Medina, M.; Krishna, V.; Euler, M.; Bhattarai, N.; Lerner, A.M.; McDonald, A.J.; Sherpa, S.; Rajan, H.; Urfels, A.; et al. Mapping grain crop sowing date in smallholder systems using optical imagery. Remote Sens. Appl. Soc. Environ. 2025, 39. [Google Scholar] [CrossRef]
- Qiu, L.; Qiu, C.; Song, C. ESDTW: Extrema-based shape dynamic time warping. Expert Syst. With Appl. 2024, 239. [Google Scholar] [CrossRef]
- Rafif, R.; Kusuma, S.S.; Saringatin, S.; Nanda, G.I.; Wicaksono, P.; Arjasakusuma, S. Crop intensity mapping using dynamic time warping and machine learning from multi-temporal planetscope data. Land 2021, 10(12). [Google Scholar] [CrossRef]
- Rouse, J.; Haas, R.; Schell, J.; Deering, D. Monitoring vegetation systems in the Great Plains with ERTS. In Proceedings of the Third ERTS-1 Symposium, NASA SP-351, 1974; Available online: https://ntrs.nasa.gov/api/citations/19740022614/downloads/19740022614.pdf.
- Salas, E.A.L.; Subburayalu, S.K.; Slater, B.; Zhao, K.; Bhattacharya, B.; Tripathy, R.; Das, A.; Nigam, R.; Dave, R.; Parekh, P. Mapping crop types in fragmented arable landscapes using AVIRIS-NG imagery and limited field data. Int. J. Image Data Fusion 2019, 11(1), 33–56. [Google Scholar] [CrossRef]
- Sathyanarayanan, S. Confusion Matrix-Based Performance Evaluation Metrics. Afr. J. Biomed. Res. 2024. [Google Scholar] [CrossRef]
- Schmedtmann, J.; Campagnolo, M.L. Reliable crop identification with satellite imagery in the context of Common Agriculture Policy subsidy control. Remote Sens. 2015, 7(7). [Google Scholar] [CrossRef]
- Segarra, J.; Buchaillot, M.L.; Araus, J.L.; Kefauver, S.C. Remote sensing for precision agriculture: Sentinel-2 improved features and applications. In Agronomy; 2020; Vol. 10. [Google Scholar] [CrossRef]
- Seo, B.; Lee, J.; Lee; Do, K.; Hong, S.; Kang, S. Improving remotely-sensed crop monitoring by NDVI-based crop phenology estimators for corn and soybeans in Iowa and Illinois, USA. Field Crops Res. 2019, 238. [Google Scholar] [CrossRef]
- Sidike, P.; Sagan, V.; Maimaitijiang, M.; Maimaitiyiming, M.; Shakoor, N.; Burken, J.; Mockler, T.; Fritschi, F.B. dPEN: Deep Progressively Expanded Network for mapping heterogeneous agricultural landscape using WorldView-3 satellite imagery. Remote Sens. Environ. 2019, 221, 756–772. [Google Scholar] [CrossRef]
- Singh, R.K.; Rizvi, J.; Behera, M.D.; Biradar, C. Automated crop type mapping using time-weighted dynamic time warping-A basis to derive inputs for enhanced food and Nutritional Security. Curr. Res. Environ. Sustain. 2021, 3, 100032. [Google Scholar] [CrossRef]
- Tang, F.H.M.; Nguyen, T.H.; Conchedda, G.; Casse, L.; Tubiello, F.N.; Maggi, F. CROPGRIDS: A global geo-referenced dataset of 173 crops. Sci. Data 2024, 11(1), 413. [Google Scholar] [CrossRef] [PubMed]
- Whitcraft, A.K.; Vermote, E.F.; Becker-Reshef, I.; Justice, C.O. Cloud cover throughout the agricultural growing season: Impacts on passive optical earth observations. Remote Sens. Environ. 2015, 156. [Google Scholar] [CrossRef]
- Xiao, X.; Jiang, L.; Liu, Y.; Ren, G. Limited-Samples-Based Crop Classification Using a Time-Weighted Dynamic Time Warping Method, Sentinel-1 Imagery, and Google Earth Engine. Remote Sens. 2023, 15(4), 1112. [Google Scholar] [CrossRef]
- You, L.; Sun, Z. Mapping global cropping system: Challenges, opportunities, and future perspectives. In Crop and Environment; 2022; Vol. 1, p. Number 1. [Google Scholar] [CrossRef]
Figure 1.
Study area map showing the location of ORTDM.
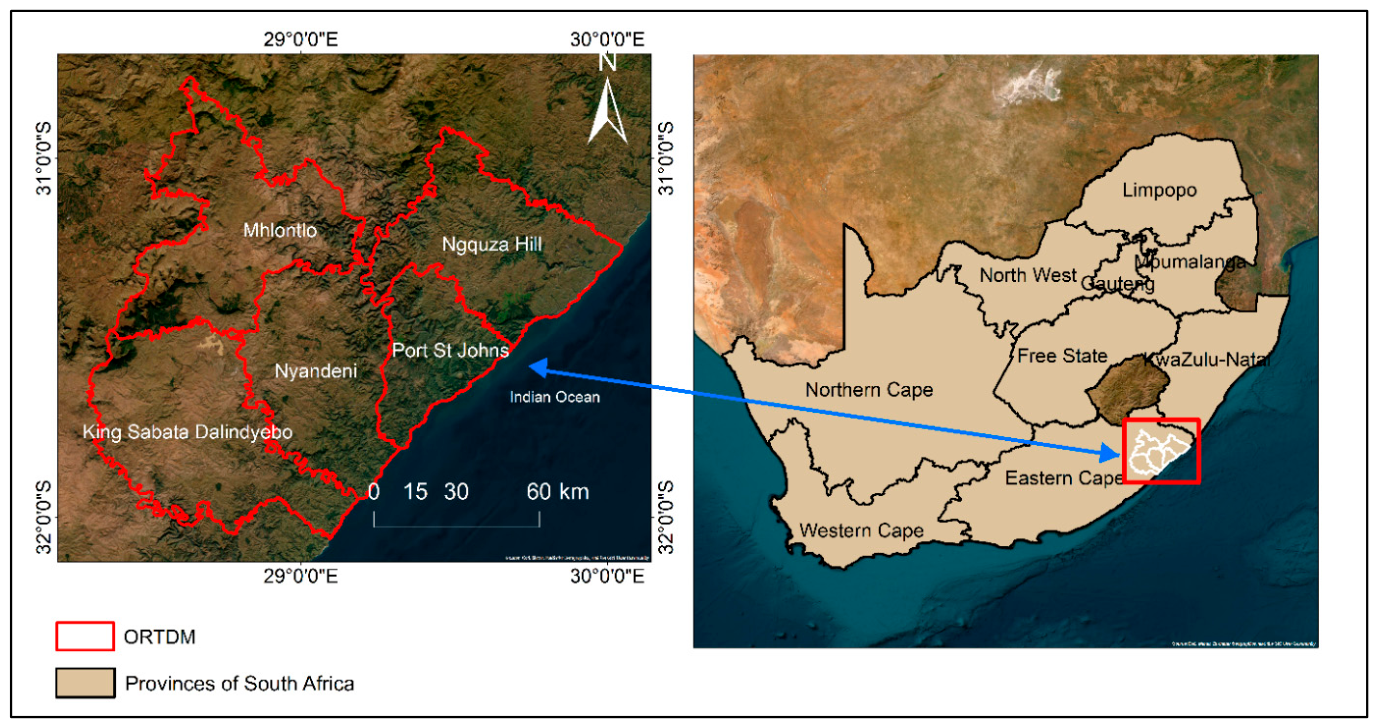
Figure 2.
Smoothed Sentinel-2 NDVI trajectories of the maize reference fields and the mean maize reference trajectory used for DTW analysis.
Figure 2.
Smoothed Sentinel-2 NDVI trajectories of the maize reference fields and the mean maize reference trajectory used for DTW analysis.
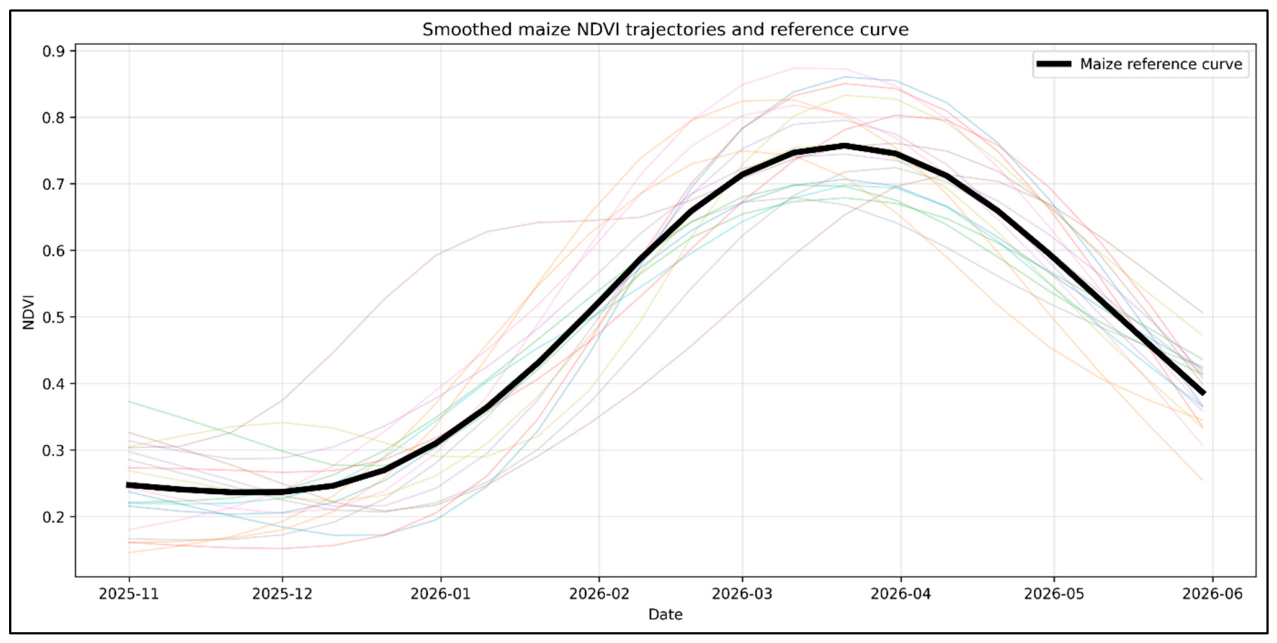
Figure 3.
DAP-aligned maize phenology curve derived from known maize fields.
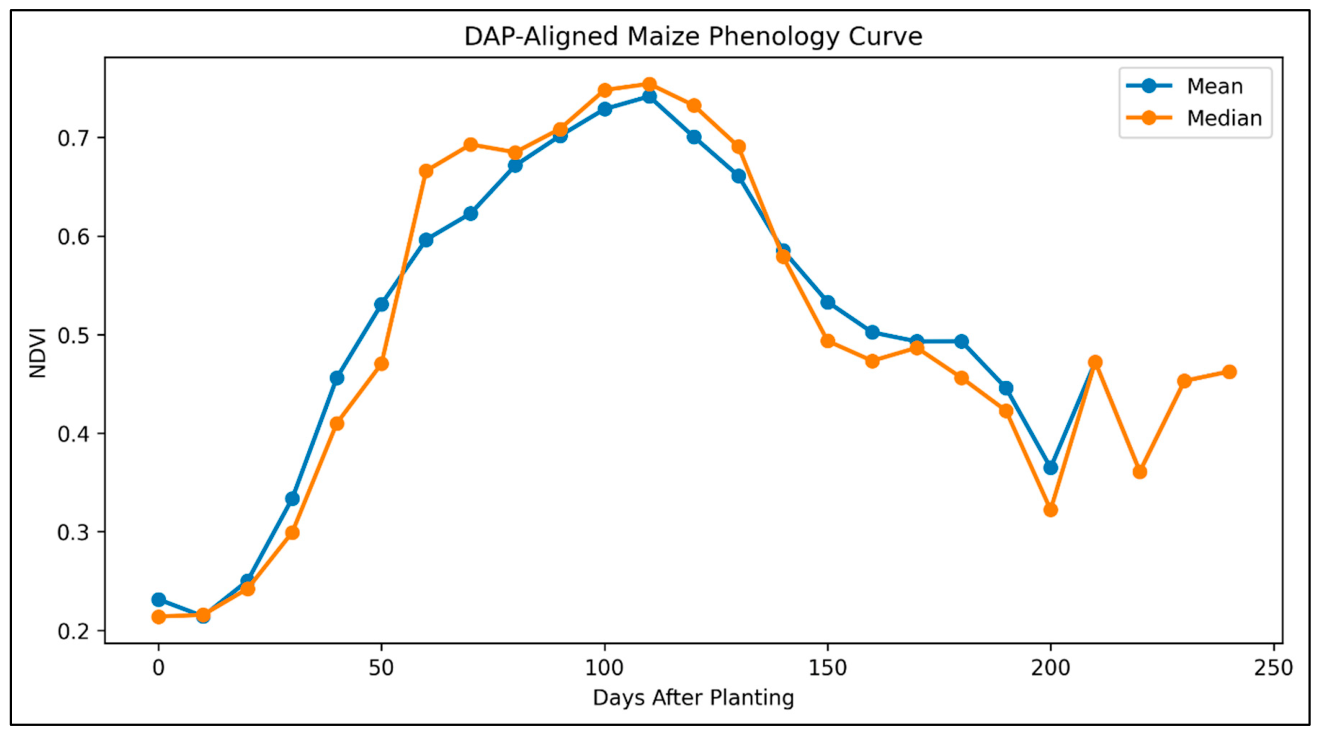
Figure 4.
Calendar-date NDVI reference trajectories for maize, soybean, potato and tea.
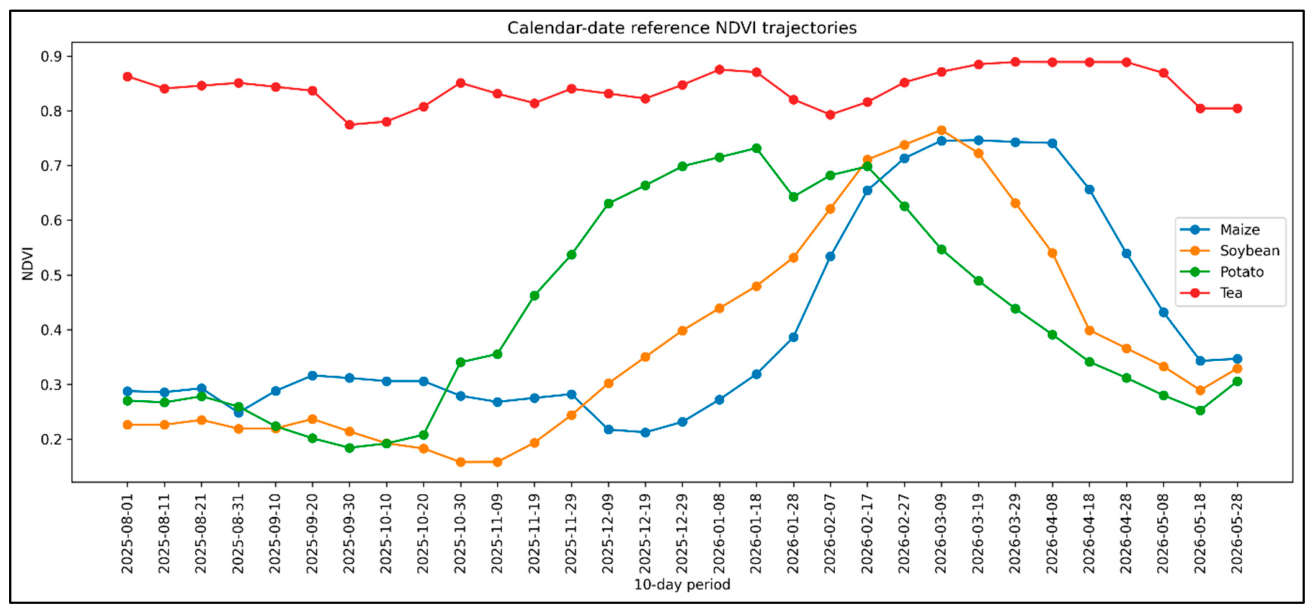
Figure 5.
DTW-predicted crop type for unknown field polygons.
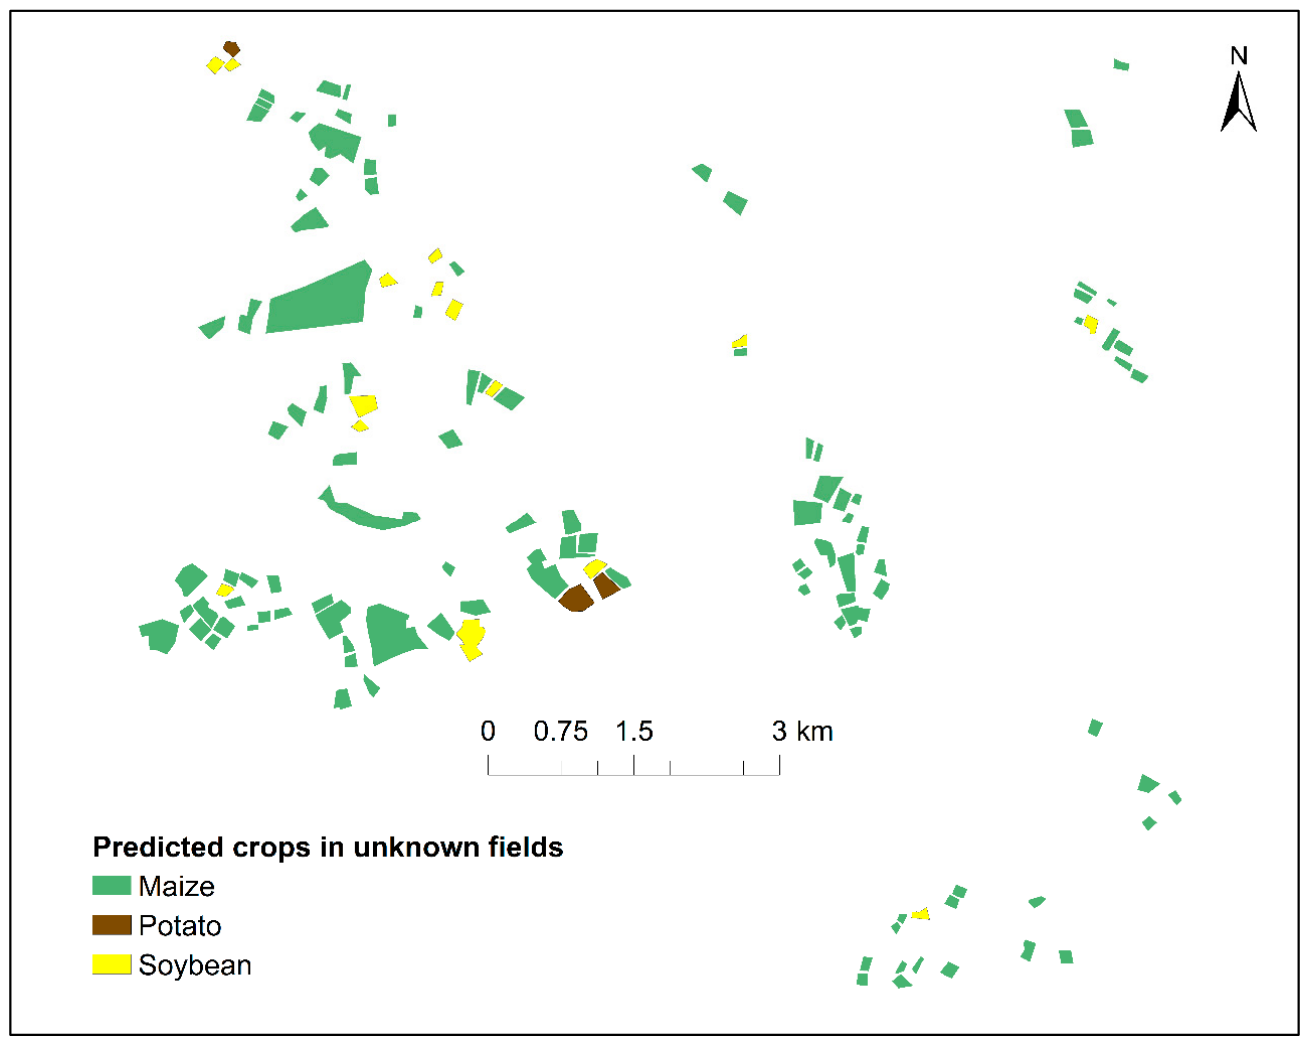

Table 1.
Summary of field dataset used for developing the maize reference trajectory.
| Dataset | Fields | Purpose |
| Maize reference fields | 19 | Develop maize reference trajectory |
| Independent maize validation fields | 9 | Test maize reference trajectory |
| Candidate unknown fields | 31 | Test maize-like phenological behaviour |
Table 2.
Field dataset used for developing and validating the multi-crop reference trajectories.
| Dataset | Fields | Purpose |
| Multi-crop reference fields | 144 | Develop maize, soybean, potato, and tea reference trajectories |
| Multi-crop validation fields | 70 | Assess multi-reference DTW classification accuracy |
| Unknown prediction fields | 128 | Predict crop type using multi-reference DTW |
Table 3.
Class distribution of fields used for multi-crop DTW classification.
| Use group | Maize | Soybean | Potato | Tea | Total |
| Reference | 63 | 28 | 18 | 35 | 144 |
| Validation | 30 | 14 | 10 | 16 | 70 |
Table 4.
DTW distances for maize reference, independent validation and candidate fields.
| Field group | Number of fields | DTW distance | Interpretation |
| Maize training fields | 19 | 0.106 - 0.281 | Known maize fields were similar to the maize reference |
| Maize validation fields | 9 | 0.074 - 0.325 | Independent maize fields were also similar to the reference |
| Candidate fields | 31 | 0.151 - 0.565 | Some candidates were maize-like; others were less similar |
Table 5.
Confusion matrix for calendar-date multi-reference DTW validation.
| Observed | Predicted | ||||
| Maize | Potato | Soybean | Tea | Total | |
| Maize | 25 | 1 | 4 | 0 | 30 |
| Potato | 2 | 4 | 4 | 0 | 10 |
| Soybean | 3 | 0 | 11 | 0 | 14 |
| Tea | 0 | 0 | 0 | 16 | 16 |
| Total | 30 | 5 | 19 | 16 | 70 |
Table 6.
Class-level performance of the calendar-date multi-reference DTW classifier.
| Class | Precision | Recall | F-1 score | Support |
| Maize | 0.83 | 0.83 | 0.83 | 30 |
| Potato | 0.80 | 0.40 | 0.53 | 10 |
| Soybean | 0.58 | 0.79 | 0.67 | 14 |
| Tea | 1.00 | 1.00 | 1.00 | 16 |
| Overall accuracy | 0.80 | 70 | ||
| Macro average | 0.80 | 0.75 | 0.76 | 70 |
| Weighted average | 0.82 | 0.80 | 0.80 | 70 |
Table 7.
Predicted crop distribution for unknown field polygons.
| Predicted crop | Number of fields | Percentage (%) |
| Maize | 110 | 85.9 |
| Soybean | 15 | 11.7 |
| Potato | 3 | 2.3 |
| Tea | 0 | 0.0 |
| Total | 128 | 100 |
Table 8.
DTW prediction confidence distribution for unknown field polygons.
| DTW confidence class | Number of fields | Percentage (%) |
| High confidence | 28 | 21.9 |
| Moderate confidence | 52 | 40.6 |
| Low confidence/ uncertain | 48 | 37.5 |
| Total | 128 | 100 |
Disclaimer/Publisher’s Note: The statements, opinions and data contained in all publications are solely those of the individual author(s) and contributor(s) and not of MDPI and/or the editor(s). MDPI and/or the editor(s) disclaim responsibility for any injury to people or property resulting from any ideas, methods, instructions or products referred to in the content. |
© 2026 by the authors. Licensee MDPI, Basel, Switzerland. This article is an open access article distributed under the terms and conditions of the Creative Commons Attribution (CC BY) license.
Copyright: This open access article is published under a Creative Commons CC BY 4.0 license, which permit the free download, distribution, and reuse, provided that the author and preprint are cited in any reuse.