

Submitted:
03 August 2026
Posted:
04 August 2026
You are already at the latest version
Abstract
Automatic incident detection (AID) can significantly decrease the time to detect incidents and better identify incident locations to allow faster response. The deployment of traffic surveillance cameras has motivated transportation agencies to investigate computer vi-sion technologies for AID using live video streams from these cameras. This paper evaluated three commercially available computer vision-based AID systems.
The evaluated AID systems were able to use video streams from six existing Pan-Tilt-Zoom (PTZ) surveillance cameras for incident detection when these cameras were on predefined presets. The three systems with the selected settings performed differently. For example, the system with the highest number of true stopped vehicle incident detections also had a relatively high number of false alerts. The AID system accuracy also varied by study site, likely due to traffic patterns, roadway geometry, and camera angles. Two major factors contributed to false alerts: stop-and-go traffic during non-incident conditions and other highway objects, including light reflection and glare, that were falsely detected as incidents. The three systems also detected additional incidents not reported in existing incident management databases, but these were mainly shoulder incidents and work zone vehicles.
Keywords:
automated incident detection
; computer vision
; freeway incidents
1. Introduction
A critical task for transportation agencies is incident management, including detecting, responding to, and clearing traffic incidents. An effective incident management system is expected to restore traffic flow as safely and quickly as possible and improve the safety of road users and crash victims [1]. The adverse impacts of traffic incidents (e.g., congestion, delays, and secondary crashes) depend on two key characteristics: the reduction in facility capacity and the duration of the incident and lane blockages [2]. Automatic incident detection (AID) can significantly decrease the time to detect incidents and to better identify the incident locations to allow faster response. The developments and implementations of AID have focused for many years on using traffic sensor data (volume, speed, and occupancy) [3]. Several AID algorithms have been proposed and used to detect incidents based on sensor data. These algorithms use comparative analysis, traffic modeling, statistical analysis, and machine learning/artificial intelligence approaches.
Closed television surveillance (CCTV) cameras have long been used by traffic management center (TMC) operators for incident verification. CCTV cameras are typically installed along roadways with typical spacings of about one mile on urban freeways. These cameras are equipped with pan-tilt-zoom (PTZ) functionality, allowing TMC operators to monitor real-time traffic conditions over a broad field of view.
Transportation agencies have used CCTV cameras mainly for the verification of incidents and for gathering of additional information about these incidents after the incidents are detected by other manual or automated means. The availability of the CCTV cameras and the associated infrastructure has motivated transportation agencies to investigate solutions that utilize video analytics of the camera video feeds received at the TMC to detect and better locate incidents. The potential of using video analytics in combination with the already available video surveillance infrastructure can be very powerful and cost effective, if the performance of the video analytics solution can be verified.
Video analytics products are becoming available from commercial vendors. These vendors report that their products can process CCTV surveillance camera feeds automatically through computer vision technologies in real-time and apply incident detection algorithms to identify abnormal traffic conditions. However, these vendors admit that better incident detection results are expected with the use of fixed cameras installed specifically for the purpose of incident detection based on CCTV camera video feeds. This is particularly because the TMC operators usually change the field of view of these cameras as needed in their traffic monitoring and incident verification processes. The effort summarized in this paper evaluated three commercially available computer vision-based AIDs systems for incident detection based on CCTV camera video feeds.
2. Review of Computer Vision-Based AID
The core components of computer vision-based incident detection systems include the Video Image Processing (VIP) module, which extracts features from video footage, and the incident detection algorithm, which analyzes these features to identify abnormal traffic conditions [4].
2.1. Video Image Processing
Kastrinaki et al. [5] conducted a thorough review, description, and classification of methods and technologies of VIP used in traffic applications. VIP for traffic monitoring normally involves two major tasks of perception: (a) recognition of the road geometry that constitutes the image background, and (b) detection or tracking of vehicles in the image. This allows the acquisition and analysis of traffic measures, such as presence and numbers of vehicles, speed measurements, queue-lengths, occupancy, and so on. A VIP system detects vehicles by analyzing changes between successive video frames examining the variations across pixel groups to differentiate moving objects from the background [6]. To improve accuracy, the algorithms filter out visual disturbances caused by weather, shadows, and lighting transitions from day to night.
VIP systems can be categorized into three types based on the method used to detect and monitor vehicles within the camera’s field of view: tripline, closed-loop tracking, and data association tracking methods [4]. The tripline systems function similarly to point traffic detectors like inductive loops or microwave detectors by defining fixed detection zones where changes to pixels are used to signal vehicle presence. Closed-loop tracking systems expand the monitoring area by continuously tracking vehicles across the field of view, confirming detections through multiple observations. Data association tracking systems represent a more advanced framework that identifies and tracks individual vehicles by matching moving objects across frames, allowing for continuous and accurate tracking over time. Coifman et al. [7] identified and described four VIP vehicle tracking methods.
2.2. Incident Detection Algorithms
The extracted features using VIP are analyzed to determine whether an incident has occurred using an incident detection algorithm. These algorithms evaluate traffic parameters and/or individual vehicle measures in real-time to detect deviations from normal conditions. A wide variety of incident detection algorithms have been developed, ranging from threshold-based models to advanced artificial intelligence approaches. These approaches can involves simply detecting a stopped vehicle Parkany [8] classified the detection algorithms into comparative algorithms such as the California algorithms, statistical algorithms that use statistical measures such as standard deviation or Bayesian inference, time series algorithms such as ARIMA models or exponential smoothing, traffic modeling algorithms such as the McMaster algorithm, and artificial intelligence (AI) algorithms such as neural networks, fuzzy logic, and hybrid approaches.
2.3. Factors Influencing Performance
Previous studies have evaluated the performance of computer vision technologies for traffic detection under various environmental and operational conditions. Wan et al. [9] developed a system of detecting stopped vehicles and collecting traffic data such as speed and volume. Field experiments demonstrated speed accuracy of 91% and volume accuracy between 90–94%. Grant et al. [10] assessed the use of computer vision for planning applications and found that the accuracy was sensitive to detection distance, lighting glare, weather, and camera vibration. They recommended quality control procedures and optimal detector placement to ensure reliable data.
Prevedouros et al. [4] tested three video detection systems in freeway tunnels using staged incidents. Detection rates varied widely from 40% to 100%, and the false alerts were found to be influenced by lighting effects, tunnel curvature, and camera angle. The study concluded that system configuration and calibration were crucial for reliable detection. Preisen and Deeter [11] confirmed that 72% of 81 alerts from video detection systems were true alerts. Martin [12] found an average incident detection accuracy based on video of 87% in daytime and dusk, 73% at night, and 81% in snow. False or missed detections occurred in 17% of the cases, often due to glare, snow, vibration, or occlusion. The study emphasized proper camera angle, stability, and maintenance to improve reliability.
Kim et al. [13] conducted a study on how video quality impacts detection rates. Using three video settings (low to high), the detection improved from 25.0% to 80.4%, and the false alerts dropped from 27.7% to 12.5%. Weather and lighting significantly affected performance. Camera height had mixed effects, while preset deviation consistently reduced accuracy.
Stevens et al. [14] tested a commercial vendor software over 12 weeks using 24 PTZ cameras. Of 974 stopped vehicle alerts, 56% were relevant, 24% false, and 20% operationally irrelevant. Compared to the regional incident management system, the system detected 34 incidents on average seven minutes earlier but missed many others, detecting only 14% of the manually observed events. The study suggested fixed cameras and stable presets are essential for effective deployment.
Collectively, these evaluations underscore the potential of video analytics for incident detection, while also highlighting the critical importance of video quality, camera setup, lighting, weather, and calibration in ensuring reliable and accurate system performance. In addition, there is still a lot to be learned about the potential of existing products to be used with video footage from PTZ cameras, without the need to install fixed cameras that increase the installation and maintenance costs of the system.
3. Deployed Systems and Evaluation Method
This section presents a review of the deployment of the three AID systems evaluated in this study and the method used in their evaluation.
3.1. Aid System Deployment
Three commercial AID systems were selected for the evaluation of this study. The system utilizes object tracking computer vision technologies for event detection. They continuously monitor video streams from the CCTV cameras and send alerts via emails, if an incident is detected. Incident log data, including video clips or snapshots, are recorded in this study for evaluation purposes. The three systems—referred to in the rest of this paper as System 1, System 2, and System 3—process live video streams (1920×1080 pixels at 30 frames per second) from cameras to identify incidents using computer vision technologies. The study leverages video streams from six existing PTZ cameras of Florida Department of Transportation (FDOT) District 4 in Broward County, FL. The AID systems require the cameras to be fixed at one position with a constant view angle and zoom setting to effectively detect the incidents. The CCTV cameras were set at a fixed view (Preset) unless TMC operators move them to another position to confirm and validate incidents. If there is no camera operation in 15 minutes after moving a camera from its preset, the camera will return to its Preset. The AID systems were installed and run on local computers located in FDOT District 4 TMC to meet the FDOT requirements and operating procedures. Each vendor defined the detection zones for their system. These zones represent the spatial limits for incident detection for each CCTV camera. An example of the detection zone is shown in Figure 1.
The three AID systems detect incidents based on a minimum time threshold that the vehicles can be stationary before incident alerts are issued. The vendors were asked to calibrate the computer vision algorithms and set the thresholds of their systems to ensure the best performance of the systems.
3.2. Deployed System Exploration
The research team conducted an initial exploration of the three systems to understand and verify their functions. This exploration included:
- Verifying the functions and capabilities of each system
- Understanding the user interfaces and parameter settings of the systems
- Checking and verifying the existence of detection log data
- Verifying the incident detections and the logged videos associated with detected incidents
Two of the three AID systems were tested from January 14th to February 28th 2025. The third system was tested from January 14th to March 14th since it had a period during which it was not functioning correctly, as explained later. The analysis focused on the ability of the systems to detect stopped vehicles and pedestrian presence in the peak period (6:30 am to 9:30 am, and 4:00 pm to 7:00 PM) and the off-peak period. In addition to doing the analysis for different congestion levels (peak vs. off-peak periods), the analysis was done under different lighting conditions (daylight vs. nightlight) and weather conditions (dry versus rain). The detections were filtered to retain only those captured while the CCTV were on the predefined presets. During the test period, the research team collected detection events data generated by the systems including the identification of the source camera, detection timestamp, detection type (stopped vehicle, pedestrian presence, or congestion events), and video clips/images to verify the events. The research team also retrieved FDOT incident records from the Regional Integrated Transportation Information System (RITIS) system that acts as the data warehouse for the FDOT traffic and incident operations and management systems.
The performance measures used in the evaluation include:
- False Alert Rate (FAR): This is the proportion of false alerts compared to the total number of alerts generated by each vendor. A false alert is defined as an incident detection that could not be verified based on the video footage.
- Matching Rate: This is the number of detected incidents that could be matched with the incidents archived in the FDOT database. The Matching Rate was evaluated as the number of alerts that matched RITIS-recorded incidents within a 0.5-mile radius of the camera location and ±30 minutes from the time the incident was detected by the evaluated AID systems. The incidents archived in the FDOT database are detected by two sources. The two sources are “Waze Provided”, which is based on real-time data stream received by FDOT from a third-party vendor (Waze), and “FDOT Recorded,” which is recorded by TMC operators based on information from highway patrol, service patrol and other sources. This study matched the AID detected data with the data of both sources. The matching rate is calculated as follows:
- Latency of Detection: This is the time difference between the timestamp of a matched AID-detected incident and the corresponding time stamp in the existing FDOT database.
- Hypothesis Testing for Detection Timeliness: A statistical analysis was conducted to determine whether the AID system detection time was significantly earlier than the FDOT recorded time for the matched incidents. The null hypothesis is that the AID detection is not earlier than the reported incident start time in the FDOT archived database. A one-tailed permutation test, which is a non-parametric test was used to assess the mean difference in the detection times.
In addition, this study developed a binary logit model to identify the factors contributing to false alerts in stopped vehicle detections. The features investigated for inclusion in the model were the specific investigated system, the camera providing video feed for detection, travel lane vs. shoulder detection, rain versus dry conditions, peak vs. off-peak hours, and nightlight vs. daylight conditions.
4. Results
This section discusses the results obtained from the evaluation of the computer vision-based AID systems in this study. The discussion addresses the number of detected incidents, false alert rates, causes of these false alerts, matching of the incidents detected by the AID systems with the recorded incidents in the FDOT database, and latency analysis that estimate the difference between the AID system detection and the timestamps of the incident start time in the FDOT database.
4.1. Number of Detections
Table 1 indicates that, when considering both true and false detections, System 2 detects the highest number of stopped vehicle incidents, both in the total number of incidents and the incidents detected while the cameras are on presets. The number of pedestrian detections per day for System 2 and System 3 were close and higher than what was detected by System 1. There were a large number of incidents detected when the cameras were not on preset, particularly in the case of System 2. These incidents were not considered in this study since a large proportion of them were either false alerts or alerts issued when the operators moved the camera to zoom on incident sites after the incidents are detected by other means.
4.2. False Alerts
The FAR analysis revealed notable differences in detection performance across different systems. For the stopped vehicle incidents during the off-peak period, System 1 had the lowest FAR (29%), followed by System 3 (41%), and then System 2 (56%). During the peak periods, System 1 again had the lowest FAR of 44%, followed by System 2 (59%), and then System 3 (81%). Further examination of the results indicates that the detection of one of the cameras (Camera 0389-CCTV) contributed to a large proportion of the false alerts of System 2. Thus, the FAR values are reported in Figure 2 with and without the detection using that camera video. By excluding detections generated by System 2 with the 0389-CCTV camera, its FAR during the off-peak decreased significantly from 56% to 44%, while its FAR during the peak hours did not change significantly (59% vs. 60%).
For pedestrian incident detection during the off-peak period, System 3 had a FAR of 0%, while the FARs for System 1 and System 2 were 23% and 4%, respectively. During the peak periods, System 3 maintained a 0% FAR. However, the FARs for System 1 system and System 2 were 80% and 78%, respectively, again showing significantly higher FARs in the peak periods compared to the off-peak periods.
The research team examined the attributes associated with the true and false alerts generated by the three systems. It found that the major contributors to the false alerts were the stop-and-go operations and the presence of other objects, as described below. During the peak period, due to the stop and go operations, the systems may identify a stopped vehicle due to congestion as an incident. In this regard, there is a trade-off in setting the thresholds of the minimum vehicle stop time that is considered as an incident. Lower time thresholds cause higher numbers of detection but higher numbers of false alerts. As stated earlier, the system vendors were given the freedom of setting their systems thresholds. In addition to the stop and go operations in the congested period, another major contributor to the FAR is the identification of the presence of other objects as stopped vehicles or pedestrians including objects like shadows, roadside features, vehicle light reflection and glare, traffic signs, and/or construction barrels. These false detections can be reduced by enhancing the object classification algorithms of the utilized computer vision technologies and refining the detection zone configurations.
All false alerts of pedestrian presence generated by System 1 and System 2 were caused by the presence of other objects. System 3 did not generate any false alerts for the pedestrians.
For stopped vehicle detection, Table 2 indicates that the main cause of the false alerts for System 1 was the stop and go operations in both the off-peak and peak periods. The false alerts were much higher for Systems 2 and 3 compared to System 1. In the off-peak, the presence of other objects was the main contributor to the false alerts for Systems 2 and 3. Further examination of the results indicates that the detection of one of the cameras (0389-CCTV) contributed to about half of the false alerts of System 2, mainly due to other objects in the off-peak (including a large proportion of false detection due to light reflection and glare at night). The results without that camera are also presented for System 2 in Table 2. In the peak periods, the contribution of the stop and go operations to false detection was higher than in the off-peak for System 2 and 3. The number of false detections due to fixed objects is much lower in the peak periods compared to the off-peak period for these two systems. Further examination indicates that this is because the off-peak period includes night conditions with light reflections and glares that were falsely identified as incidents.
4.3. Composition of True Alerts
System 2 had the highest number of detections of true incidents followed by System 1, as show in Figure 3. Figure 3 summarizes the composition of the true detected alerts for the three systems. Large proportions of the detected incidents were shoulder incidents, followed by work zone activities, followed by pedestrian presence detection. Only a few lane blockage incidents were detected by the systems. This could be in part because of the short length of the detection zone that ranges from 200 ft to 700 ft, depending on the system and camera locations. Since lane blockage events have much lower frequencies than shoulder incidents, the expected number of lane blockage events in the detection zone is low.
4.4. Impact of Lighting and Weather Conditions
The research team examined the impact of lighting and weather conditions on the detection rate and FAR.
Table 3 shows that the number of pedestrian detections at night was lower for all systems. It is not clear if this is due to less pedestrian activities at night or to technological capabilities. There was a reduction in the number of stopped vehicles detected by System 1 and System 2, but this may also be due to less activity at night. However, there was a much higher drop in the number of detected stopped vehicles by System 3 at night compared to the other two systems.
Table 3 indicates that the FAR for pedestrian presence was not significantly different between the day and night. For stopped vehicle detection, the FARs of Systems 1 and 3 decreased, while the FAR for system 2 increased significantly at night, particularly when including Camera CCTV 389 in the analysis, because of light reflection and glare.
The research team also compared the detection counts and FAR under clear and rainy conditions. No pedestrian detections were recorded during rainy conditions. For stopped vehicles, System 3 provided no alerts and System 1 provided only one alert that was false. The small number of detections could be due at least in major part to the shorter monitored periods with rainy conditions. However, System 2 provided 45 alerts, with 42 of them identified as false, resulting in a FAR of 93% under rainy conditions versus 48% under dry conditions.
4.5. Statistical Model of Contributing Factors to FAR
A binary logit model was developed to examine the factors contributing to false alerts in stopped vehicle detections. Table 4 shows the parameters of the estimated model that use all data except System 2’s detections using the video stream from the 0389-CCTV camera, due to the high number of false alerts for this camera detection that may bias the results. The dependent (predicted) variable of the model is whether an alert is false or not (1 = False Alert, 0 = True Alert). The odds ratio (OR) quantifies how a one-unit increase in an independent variable affects the odds of false alert (odds = the likelihood of a false alert relative to a true alert) with OR = 1 represents no effect, OR > 1 represents the factor increases the risk of false alert, and OR < 1 represents factor decreases the risk of false alert.
The modeling results show the following findings:
- Utilized System: The coefficients and odds ratios indicate that Systems 2 and 3 generate more false alerts than System 1, with System 3 having the highest FAR that was 2.01 times greater than that of System 1 when the data from the 0389-CCTV camera was excluded. Another model was developed with the data from that camera included (this model is not included in this paper due to space limitation) and the coefficient and odds ratio from that model showed that the highest FAR was with System 2 followed by System 3.
- Study Sites: The model indicates that different cameras exhibit varying likelihoods of generating false alerts. These differences may be attributed to site-specific traffic patterns, roadway geometry, and/or camera viewing angles.
- Detection Location: The coefficient for "on travel lanes" is positive and statistically significant, indicating that detections occurring on travel lanes are more likely to result in false alerts compared to those on other areas, such as the shoulder. This finding may be attributed to the frequent stop-and-go traffic patterns observed on travel lanes.
- Rain: The model indicates that rainy conditions increase the likelihood of false alerts.
- Peak Hours: Peak hours are associated with an increased risk of false alerts.
- Night: No significant impact of night conditions on false detections was found, as the corresponding model coefficient was not statistically significant.
4.6. Incident Matching Rate
The next step was to calculate the matching rate by comparing the true alerts from each system with the incident recorded by existing incident detection sources and archived in the FDOT database (FDOT Recorded and Waze Provided). This comparison focused on AID of stopped vehicles and aimed at determining the additional detection capabilities provided by the AID systems. Figure 4 indicates that the matching rate ranged between 23% to 27% for the three systems, except System 2, which had 12% matching in the off-peak period.
As shown in Figure 5a, the unmatched alerts are mainly associated with stopped vehicles on shoulder and work zone vehicles. A large proportion of unmatched incidents occurred during the off-peak period. Some of the unmatched incidents were possibly minor incidents that do not meet the severity or duration thresholds required for logging them by the TMC operator in the management software. These could include for example disabled vehicles temporarily stopped on the shoulder. Since the length of the video recordings is only 30 seconds after incident detection, it was not possible to verify the durations of the unmatched events. The high number of unmatched events for the off-peak period, that includes the nighttime, may indicate a lower level of TMC operations in this period pointing to potential benefits of AID at off-peak.
4.7. Latency of Detection
The latency of detection was assessed by comparing the time difference between the AID detection of true alerts and the corresponding matched incidents in the FDOT database. A negative difference indicates that the evaluated system detected the incident earlier than the incident time reported in the existing database (Waze Provided or FDOT Recorded). It should be mentioned here that most of the matched incidents are shoulder incidents and may be minor incidents with lower priority, which may increase the time from their occurrence until their recording in the FDOT central software.
Table 5 summarizes the descriptive statistics of AID detection latencies compared to the timestamps in the existing database. The distribution of the latencies appears to be left-skewed since the mean is significantly smaller than the median. Due to the presence of extreme values, the median rather than the means was used in the comparison because the median is less affected by extreme values. The differences in the median between the AID system recording and Waze Provided timestamps were small ranging from -55 seconds to 71 seconds, depending on the system. However, the differences in the median between the Aid detected and the FDOT Recorded timestamps were much higher ranging from -113 seconds -739 seconds. These results indicate that at least in terms of the median latency, the tested systems could provide comparable detection time to Waze Provided and earlier detection than FDOT Recorded time. The earlier detection compared to FDOT may be in part because some of the detected incidents were low priority incidents, leading to reduced urgency to input them into the management software by the TMC operators. However, the results showed considerable variations in the latencies between incidents. This makes it difficult to draw definitive conclusions about the reduction in detection time, particularly with small sample sizes. One-tailed hypothesis testing was used to determine if there is a significant difference in the median. Because the sample size was small and the distribution was skewed, this study used the one-tailed permutation test, a non-parametric method. The hypothesis states that:
H0:
No difference between AID detection time and existing reporting time
Ha:
AID detection time is earlier than the existing reporting time
The testing results in Table 5 show that the difference is significant only in the case of System 2.
5. Discussion and Conclusions
The three tested systems were able to use video streams from six PTZ CCTV cameras for incident detection when these cameras were on predefined presets. To reduce the false alerts, there should be a parameter setting in the AID systems to detect when the cameras are not on preset and stop issuing alerts then. While some (but not all) of the tested systems were reported to have this capability, this functionality was not tested during the pilot study.
The AID systems had limited detection zone, ranging from 200 to 700 feet in length in the field of view of the camera preset. The average distance between two CCTV cameras in urban areas is approximately one mile and can be significantly longer in rural areas. As a result, it is challenging to achieve full corridor coverage with the AID systems but they could be used to cover selected high incident locations.
This study evaluated AID systems to detect stopped vehicles and pedestrian presence. The frequency of alerts and false alarms are functions of vehicle stoppage time thresholds. Only one of the three systems allows the user to change these thresholds. It is recommended that all systems provide this capability to optimize system performance.
The AID system accuracy varies by study site, likely due to traffic patterns, roadway geometry, and camera angles. Two major factors contribute to AID false alerts: stop-and-go traffic and other object presence including light reflection and glare.
The three tested systems performed differently. System 2 had the highest number of true stopped vehicle incident detections, generating more detections than the other two systems but also high number of alerts, particularly with one of the camera locations in the off-peak period. System 1 produced the second highest number of true alerts and the lowest number of false alerts. System 3 produced the lowest detection rate and had a relatively high number of false alerts in the peak period. In terms of detecting pedestrian presence, System 3 demonstrated the best performance across different scenarios with zero false alerts for this type of detection and System 2 producing the same number of pedestrian presence alerts of System 3 but with higher false alert rates.
It appears that the impact of night conditions varies depending on the system with System 3 seemingly experiencing higher reduction in detection counts of stopped vehicles and System 2 having the highest impact in terms of FAR due to detecting other objects such as light reflections and glares as incidents. Rainy conditions also increased the false alerts for System 2. Due to the small sample size, it may be difficult to give a conclusion about the impact of weather on AID.
The three systems were able to detect additional incidents not reported in the databases of the existing incident management system of the TMC. These incidents appear to be mainly shoulder incidents and work zones. Some of these incidents could be considered as minor incidents such as disabled vehicles.
Author Contributions
Conceptualization, M.H. and Z.W.; methodology, C.J., T.S., M.H. and Z.H.; formal analysis, C.J., T.S., M.H. and Z.H.; investigation, M.H. and Z.H.; data curation, C.J.; writing—original draft preparation, C.J. and T.S.; writing—review and editing, C.J., T.S, M.H. and Z.W.; supervision, M.H. and Z.W.; project administration, M.H. and Z.W.; funding acquisition, M.H. and Z.W. All authors have read and agreed to the published version of the manuscript.
Funding
This research was funded by FDOT Research Center, grant number BED25 977-13.
Institutional Review Board Statement
Not applicable.
Informed Consent Statement
Not applicable.
Data Availability Statement
The original contributions presented in this study are included in the article. Further inquiries can be directed to the corresponding author.
Acknowledgments
The authors express their gratitude to Alyssa Klein, Ryan Drendel, Aaron Rapp, and Denelia Edwards from FDOT District Four, Ronald Chin from FDOT District Seven, and James Landini from the FDOT Central Office for their valuable guidance and support in the deployment of detection systems and data collection. Special thanks go to Catalina Echeverri from Gannett Fleming Inc. for her coordination and assistance during the pilot study. The authors also thank the VID vendors for volunteering to participate in the pilot study and for providing technical support throughout the project.
Conflicts of Interest
The authors declare no conflicts of interest.
References
- FHWA. Traffic Incident Management (TIM). 2025. Available online: https://ops.fhwa.dot.gov/tim/.
- Mahmassain, H.S.; et al. Eval. Incid. Detect. Methodol. 1999. [CrossRef]
- ElSahly, O.; Abdelfatah, A. A systematic review of traffic incident detection algorithms. Sustainability 2022, 14(22), 14859. [Google Scholar] [CrossRef]
- Prevedouros, P.D.; et al. Video incident detection tests in freeway tunnels. Transp. Res. Rec. 2006, 1959(1), 130–139. [Google Scholar] [CrossRef]
- Kastrinaki, V.; Zervakis, M.; Kalaitzakis, K. A survey of video processing techniques for traffic applications. Image Vis. Comput. 2003, 21(4), 359–381. [Google Scholar] [CrossRef]
- Mimbela, L.-E.Y.; Klein, L.A. Summ. Veh. Detect. Surveill. Technol. Used Intell. Transp. Syst. 2007. [CrossRef]
- Coifman, B.; et al. A real-time computer vision system for vehicle tracking and traffic surveillance. Transp. Res. Part C Emerg. Technol. 1998, 6(4), 271–288. [Google Scholar] [CrossRef]
- Parkany, E.; Xie, C. A complete review of incident detection algorithms & their deployment: what works and what doesn't 2005. [CrossRef]
- Wan, Y.; Huang, Y.; Buckles, B. Camera calibration and vehicle tracking: Highway traffic video analytics. Transp. Res. Part C Emerg. Technol. 2014, 44, 202–213. [Google Scholar] [CrossRef]
- Grant, C.; Gillis, B.; Guensler, R. Collection of vehicle activity data by video detection for use in transportation planning. J. Intell. Transp. Syst. 2000, 5(4), 343–361. [Google Scholar] [CrossRef]
- Preisen, L.; Deeter, D. Next Gener. Traffic Data Incid. Detect. From Video 2014. [CrossRef]
- Martin, P.T.; Dharmavaram, G.; Stevanovic, A. Eval. UDOT'S Video Detect. Syst. Syst. Perform. Var. Test. Cond. 2004. [CrossRef] [PubMed]
- Kim, K.; et al. Performance evaluation of video analytics for traffic incident detection and vehicle counts collection, in Recent advances in intelligent image search and video retrieval; Springer, 2017; pp. 213–231. [Google Scholar]
- Stevens, R.G.; Voigt, A.P.; Manak, B. Evaluation of Video Analytics for Incident Detection – Pilot Demonstration; Texas A&M Transportation Institute, 2016. [Google Scholar]
Figure 1.
An example of detection zones for one of the systems.
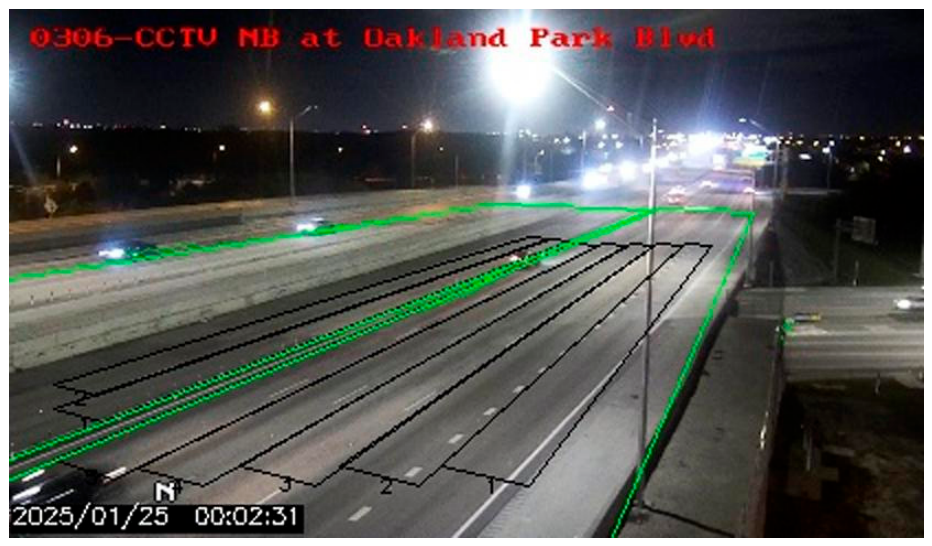
Figure 2.
False alert rates by system, time period, and incident type.
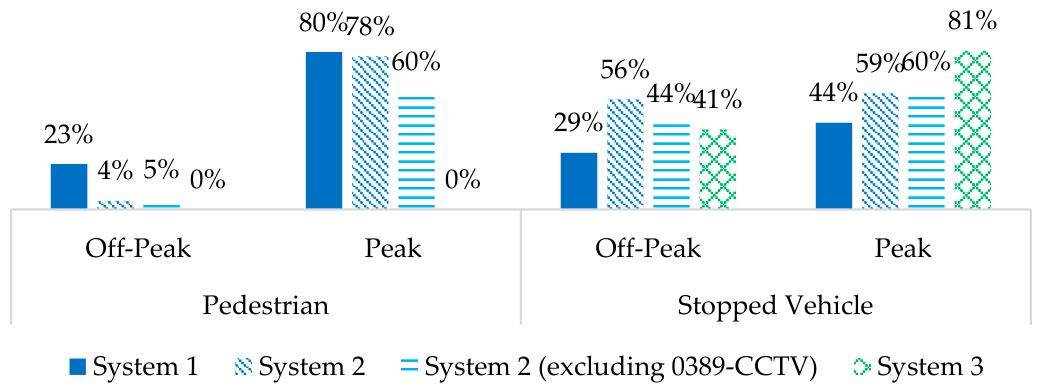
Figure 3.
Verification of the composition of “true” detections.
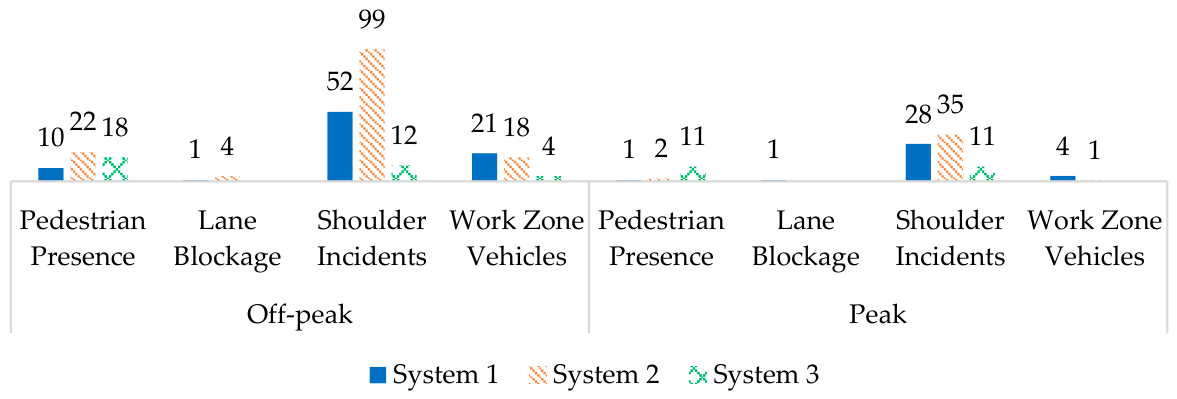
Figure 4.
Matching rate for stopped vehicle incidents.
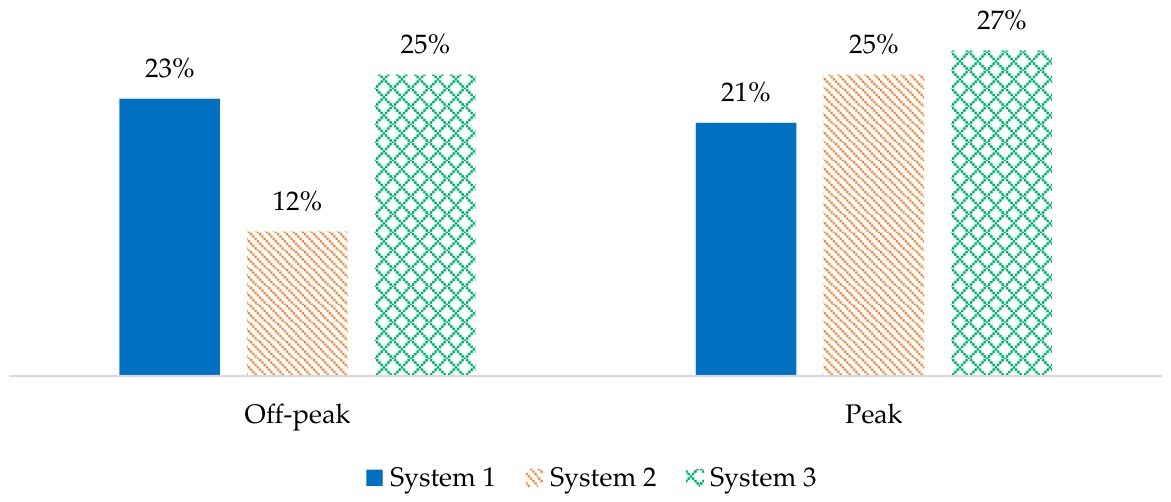
Figure 5.
Matching context for stopped vehicle incidents.
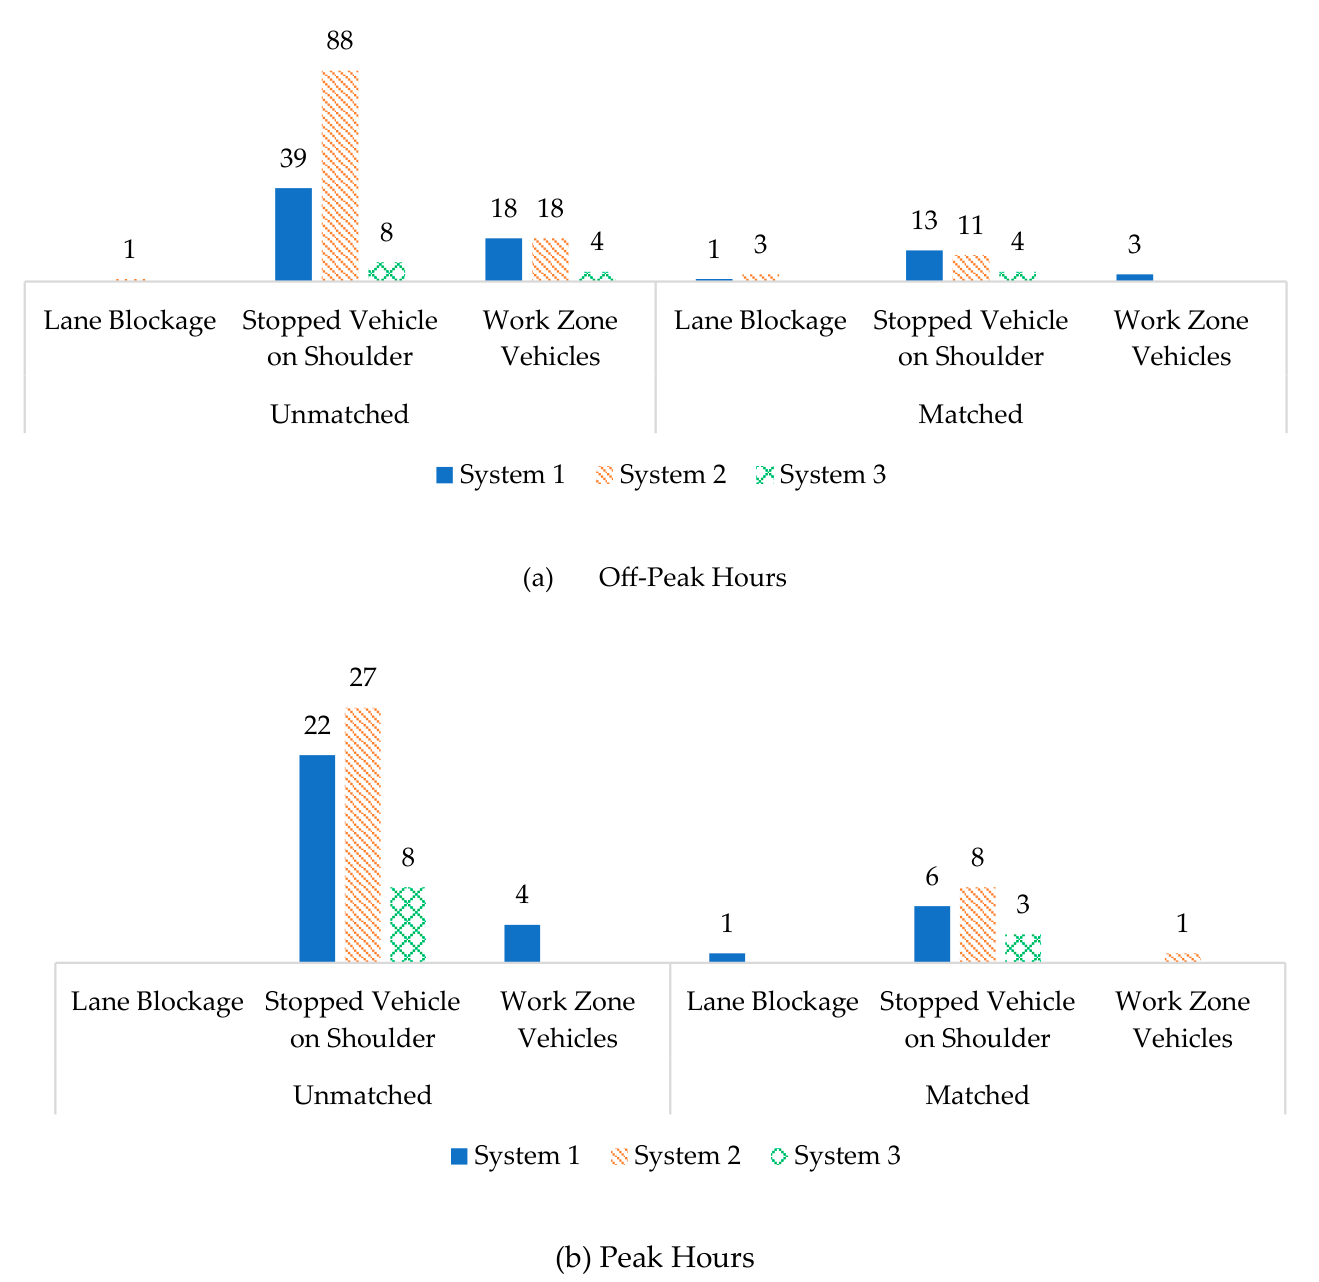

Table 1.
Number of Detected Incidents.
| VID System | Observation Days | Total No. of Incidents | On-Preset Detected Incidents | ||
|---|---|---|---|---|---|
| Stopped Vehicle | Pedestrian | Stopped Vehicle | Pedestrian | ||
| System 1 | 46 | 352 | 22 | 163 (3.5 per day) | 18 (0.4 per day) |
| System 2 | 46 | 978 | 127 | 341 (7.4 per day) | 32 (0.7 per day) |
| System 3 | 431 | 308 | 105 | 84 (2.0 per day) | 29 (0.7 per day) |
1Excluding days and data for February 15 to 24, 2025 during which System 3 was upgraded and February 27 to March, 5, 2025 during the backup process.
Table 2.
Verified Causes of False Detections of Stopped Vehicles.
| Period | Verified Cause | System 1 | System 2 | System 2 (excluding 0389-CCTV) | System 3 | ||||
|---|---|---|---|---|---|---|---|---|---|
| Obs.1 | Rate2 | Obs.1 | Rate2 | Obs.1 | Rate2 | Obs.1 | Rate2 | ||
| Off-Peak | Other Objects | 4 | 13% | 113 | 85% | 58 | 44% | 8 | 73% |
| Stop-n-Go | 26 | 87% | 20 | 15% | 20 | 15% | 3 | 27% | |
| Peak | Other Objects | 4 | 15% | 33 | 65% | 21 | 41% | 5 | 11% |
| Stop-n-Go | 22 | 85% | 18 | 35% | 17 | 33% | 41 | 89% | |
1Obs. = Number of False detections), 2Rate = number of false detections associated with a verified context divided by the total number of false detections.
Table 3.
Detection Counts and FAR by Environmental Conditions.
| Incident Type | Environment Condition | System 1 | System 2 | System 2 (excluding 0389-CCTV) | System 3 | |||||
|---|---|---|---|---|---|---|---|---|---|---|
| Obs.1 | FAR | Obs.1 | FAR | Obs.1 | FAR | Obs.1 | FAR | |||
| Pedestrian | Lighting | Day | 9 | 22% | 31 | 26% | 24 | 17% | 24 | 0% |
| Night | 4 | 25% | 1 | 0% | 1 | 0% | 5 | 0% | ||
| Weather | Dry | 18 | 39% | 32 | 25% | 25 | 16% | 29 | 0% | |
| Rain | 0 | NA | 0 | NA | 0 | NA | 0 | NA | ||
| Stopped Vehicle | Lighting | Day | 59 | 32% | 173 | 49% | 126 | 41% | 73 | 71% |
| Night | 45 | 24% | 123 | 80% | 116 | 55% | 11 | 45% | ||
| Weather | Dry | 162 | 34% | 296 | 48% | 207 | 40% | 84 | 68% | |
| Rain | 1 | 100% | 45 | 93% | 35 | 97% | 0 | NA | ||
1 Obs. = Count of VID False Detections.
Table 4.
Estimated Binary Logit Model for Stopped Vehicle False Alert*.
| Variable | Coefficient | Odds Ratio | Standard Error | z-statistics | p-value |
|---|---|---|---|---|---|
| System 1 | Baseline | ||||
| System 2 | 1.37 | 3.95 | 0.43 | 0.46 | 0.001 |
| System 3 | 2.01 | 7.49 | 0.50 | 1.07 | <0.001 |
| 0286-CCTV | Baseline | ||||
| 0225-CCTV | -0.40 | 0.67 | 0.51 | -0.79 | 0.43 |
| 0306-CCTV | -2.33 | 0.10 | 1.00 | -2.33 | 0.02 |
| 0376-CCTV | 0.91 | 2.48 | 0.47 | 1.95 | 0.05 |
| 0389-CCTV* | -0.15 | 0.86 | 0.60 | -0.25 | 0.80 |
| 0440-CCTV | 1.47 | 4.35 | 0.43 | 3.44 | 0.001 |
| On travel lanes | 4.65 | 104.92 | 0.46 | 10.11 | <0.001 |
| Rain | 4.57 | 96.81 | 1.07 | 4.26 | <0.001 |
| Peak hours | 0.89 | 2.43 | 0.32 | 2.75 | 0.006 |
| Night | -0.07 | 0.93 | 0.34 | -0.2 | 0.84 |
| Constant | -3.36 | 0.53 | -6.28 | 0.00 | |
*Excluding System 2’s Detections on 0389-CCTV.
Table 5.
Statistics of VID Detection Latency and Hypothesis Test.
| VID System | Item | FDOT | WAZE | |
|---|---|---|---|---|
| System 1 | Statistics | Sample Size | 11 | 22 |
| Min/Max (sec) | -1,659/1,351 | -1,599/1,411 | ||
| 1st Quartile | -561.5 | -610.5 | ||
| 3rd Quartile | 845.5 | 580.75 | ||
| Mean (sec) | 15.4 | 14.5 | ||
| Std. Deviation (sec) | 967.9 | 826.3 | ||
| Median difference (sec) | -113 | 71 | ||
| One-tailed Permutation Test | p-value | 0.37 | 0.47 | |
| Significant? | No | No | ||
| System 2 | Statistics | Sample Size | 13 | 18 |
| Min/Max (sec) | -1,707/1,156 | -1,793/636 | ||
| 1st Quartile | -931.0 | -793.0 | ||
| 3rd Quartile | -203.0 | 96.0 | ||
| Mean (sec) | -582 | -358 | ||
| Std. Deviation (sec) | 742 | 685 | ||
| Median difference (sec) | -739 | -37 | ||
| One-tailed Permutation Test | p-value | <0.001 | <0.001 | |
| Significant? | Yes | Yes | ||
| System 3 | Statistics | Sample Size | 3 | 7 |
| Min/Max (sec) | -649/425 | -1,305/845 | ||
| 1st Quartile | -606.5 | -636.5 | ||
| 3rd Quartile | -69.5 | 357.0 | ||
| Mean (sec) | -262.7 | -153.4 | ||
| Std. Deviation (sec) | 755.1 | 597 | ||
| Median difference (sec) | -564 | -55 | ||
| One-tailed Permutation Test | p-value | 0.25 | 0.49 | |
| Significant? | No | No | ||
Disclaimer/Publisher’s Note: The statements, opinions and data contained in all publications are solely those of the individual author(s) and contributor(s) and not of MDPI and/or the editor(s). MDPI and/or the editor(s) disclaim responsibility for any injury to people or property resulting from any ideas, methods, instructions or products referred to in the content. |
© 2026 by the authors. Licensee MDPI, Basel, Switzerland. This article is an open access article distributed under the terms and conditions of the Creative Commons Attribution (CC BY) license (http://creativecommons.org/licenses/by/4.0/).
Copyright: This open access article is published under a Creative Commons CC BY 4.0 license, which permit the free download, distribution, and reuse, provided that the author and preprint are cited in any reuse.