
Submitted:
03 August 2026
Posted:
04 August 2026
You are already at the latest version
Abstract
The growing scientific interest for natural bioactive ingredients with applications in functional foods, dietary supplements, and nutraceuticals has increased the demand in goat milk products and especially in its fermented ones, particularly kefir. The aim of this study was to evaluate the antioxidant capacity and the anti-inflammatory and antithrombotic activities of amphiphilic (TAC) bioactives from goat milk and its fermented kefir yogurt-type product. The isolation of bioactive fractions was performed using conventional extraction and counter current distribution methodologies by utilizing appropriate combinations of polar and nonpolar solvent systems. The functional chemical groups and main classes of the amphiphilic bioactives present in the TAC extracts were elucidated by ATR–FTIR spectroscopy and by utilizing standard molecules of amphiphilic molecules (polar lipids, carotenoids, phenolics and flavonoids), while the fatty acid composition of the polar lipid bioactives was analyzed and quantified by liquid chromatography–mass spectrometry (LC–MS). The antioxidant activity was assessed in vitro by the DPPH- and ABTS-based assays, while the anti-inflammatory and antiplatelet activities were assessed ex vivo in human platelet rich plasma. All extracts exhibited remarkable free radical scavenging ability in both assays, with amphiphilic fractions exhibiting statistically higher bioactivity. Despite the higher extraction yield of the lipophilic fractions, the amphiphilic extracts exhibited stronger anti-inflammatory biological activity against the thrombo-inflammatory stimuli of platelet activating factor (PAF) in human platelets and antithrombotic efficacy against the classic platelet agonist, ADP. FTIR and LC–MS analyses confirmed the presence of phenolic compounds, carotenoids, and polar lipids, with the last being rich in unsaturated fatty acids. More specifically, the polar lipids present in the TAC fractions contain high content of monounsaturated fatty acids (especially omega-9) like oleic acid (18:1 ω-9) and a favorable low omega-6/omega-3 ratio, which are associated with beneficial anti-inflammatory and cardioprotective potential. Overall, goat milk and its kefir-based fermented products emerge as important functional foods containing bioactive amphiphilic molecules with high antioxidant but mainly anti-inflammatory and antithrombotic efficacy for cardio-protection and overall health promotion.
Keywords:
goat milk
; kefir
; yogurt
; antioxidant
; anti-inflammatory
; antithrombotic
; amphiphilic bioactives
; functional foods
; fermented foods
1. Introduction
Fermented dairy products play a central role in modern functional nutrition, owing to their complex microbiological composition and the diverse array of bioactive metabolites generated during fermentation [1]. Among them, kefir is one of the most extensively studied fermented foods due to its probiotic microorganisms, unique sensory properties, and reported health-promoting effects [2,3]. Kefir grains contain a symbiotic community of lactic acid bacteria, yeasts, and acetic acid bacteria embedded in a polysaccharide matrix, enabling the production of a wide range of metabolites, including organic acids, peptides, vitamins, and lipids with several biological activities [2,3,4]. Recent studies have highlighted antioxidant, anti-inflammatory, antithrombotic, hypolipidemic, and immunomodulatory properties of kefir, supporting its classification as a functional food [4].
Goat milk has attracted increasing interest both for its bio-functionality and health related benefits, but also as a substrate for kefir production due to its distinct biochemical profile [5]. Compared with cow milk, goat milk contains smaller fat globules, a more favorable fatty acid distribution, higher digestibility, and greater bioavailability of minerals [6]. These characteristics influence fermentation processes, microbial activity, and the formation of bioactive compounds [6]. Previous work has shown that goat milk kefir may improve metabolic syndrome parameters, modulate inflammation, and contribute to better lipid regulation in animal models [5,6,7]. However, the specific molecular components responsible for these effects—particularly lipids and amphiphilic compounds—remain insufficiently characterized.
The bioconversion of milk constituents during fermentation generates not only hydrophilic metabolites but also amphiphilic and lipophilic bioactives, including polar lipid bioactives and unsaturation of their fatty acid content, carotenoids, phenolics and other lipid-derived signaling molecules [7]. Polar lipids, such as phospholipids and glycolipids, are of particular interest due to their emerging roles in antioxidant defense, cell membrane protection, anti-inflammatory improvement of leukocytes and endothelial function and antithrombotic activities against platelet activation [5,8]. Although studies have examined milk polar lipids from various species, there is a lack of systematic characterization of the amphiphilic (TAC) and lipophilic (TLC) extracts specifically derived from goat kefir.
In addition, different fermentation matrices—such as milk kefir versus yogurt kefir—may yield distinct bioactive profiles due to variations in microbial populations and fermentation dynamics [9]. Yogurt-type kefir is typically denser and undergoes more intense proteolysis and lipolysis, which may enhance the release of bioactive amphiphilic molecules. Despite these potential differences, comparative analyses between goat milk kefir and goat yogurt kefir remain limited, particularly regarding: antioxidant capacity, total phenolic and carotenoid contents, fatty acid and polar lipid composition, and antithrombotic and anti-inflammatory activity related to platelet function.
To date, most available studies have evaluated total kefir extracts without distinguishing between amphiphilic and lipophilic fractions. This limits mechanistic interpretation, as amphiphilic bioactives—including polar lipids—are considered key contributors to antioxidant and physiological activities. Furthermore, the combined use of FTIR spectroscopy and LC–MS analysis for structural elucidation, along with evaluation of biolofical activities, including antioxidant capacity and platelet aggregation assays to characterize goat kefir extracts has not yet been comprehensively reported.
Therefore, this study aims to address these gaps by systematically investigating the bioactive components of goat milk and goat yogurt kefir through parallel analysis of their amphiphilic (TAC) and lipophilic (TLC) fractions and their bioactives’ profile and biological activities, both by quantifying the quantify total phenolic and carotenoid contents and fatty acids composition, along with structural analysis with ATR–FTIR and LC–MS, and with assays evaluating antioxidant capacity (DPPH and ABTS assays) and assess their antithrombotic and anti-inflammatory effects by platelet aggregometry based bioassay.
2. Materials and Methods
2.1. Materials
All solvents used for extraction and analytical procedures (methanol, ethanol, hexane and chloroform), as well as the reagents Tris(hydroxymethyl)aminomethane (Tris), hydrochloric acid (HCl), sodium carbonate (Na2CO3), 2,2-diphenyl-1-picrylhydrazyl (DPPH), 2,2′-azino-bis(3-ethylbenzothiazoline-6-sulfonic acid) (ABTS), sodium persulfate, acetic acid, and sodium acetate were obtained from standard commercial suppliers. Phenolic standards—including gallic acid, catechin, and quercetin—as well as β-carotene, polar lipids from soy, and 6-hydroxy-2,5,7,8-tetramethylchroman-2-carboxylic acid (Trolox), standards were purchased from Sigma-Aldrich (St. Louis, MO, USA). Spectrophotometric measurements were performed on a uniSPEC 2 UV–VIS spectrophotometer (LLG Labware, Meckenheim, Germany). Structural characterization of both samples and reference standards was carried out using attenuated total reflectance Fourier-transform infrared (ATR-FTIR) spectroscopy with a Perkin Elmer Frontier ATR/FT-NIR/MIR system (PerkinElmer, Waltham, MA, USA), while LC-MS analysis was carried out in an Agilent 1260 HPLC system equipped with an Agilent 6520 Q-TOF mass spectrometer operating in negative electrospray ionization (ESI) mode [4].
2.2. Extraction and Separation of Amphiphilic Bioactive Compounds from Goat Milk and Its Kefir Yogurt Type Fermented Product
Amphiphilic bioactive compounds were extracted from 30 mL of goat milk and 30 g of kefir-based goat yogurt type fermented products by a modified Bligh and Dyer protocol for fermented dairy, using chloroform/methanol/water (1:2:0.8, v/v/v) as described by Papadopoulou et al. [4]. Addition of the solvent mixture created a monophasic system that was vigorously shaken to ensure efficient solubilization of extractable components. After such a mixing/blundering of the samples in this solvents’ system, then they were placed in separatory funnels, in which appropriate volumes of both chloroform and water were added to modify the solvents’ system to a new ratio of chloroform/methanol/water (1:1:0.1, v/v/v), and after the whole system was left to rest for 10-20 min a biphasic separation occurred. The chloroform-rich lower phase, containing the more amphiphilic and lipophilic compounds, was collected from each funnel in a round bottom flask. This procedure was repeated thrice for the goat milk samples and thrice for the kefir-based goat yogurt-type fermented product, in order to achieve reproducibility.
From all these (six in total) collected extracts the organic phases’ solvents were evaporated in a flash rotary evaporator and the extracted compounds remained within the round bottom flasks. All total extracts were separately transferred from the round bottom flasks to separate for each extract small pre-weighted glass tubes by using small volumes of a chloroform/methanol (1:1, v/v) mixture for several times and washouts to reach 5-10 mL volume in total, within each glass tube. This amount of solvent was then evaporated under a gentle nitrogen stream until dry. The resulting extracts were weighed to determine total extraction yield and then fractionated into: total lipophilic content (TLC), and total amphiphilic content (TAC) by a counter-current distribution based on pre-equilibrated hexane (as the lipophilic solvent) and 87% ethanol-water solution (as the polar lipid system), as previously described by Koutis et al [10]. Within this approach, hexane was used as the non-polar solvent instead of other conventional lipophilic solvents like petroleum ether, in order to comply as much as possible with current European recommendations regarding the selection and use of food grade solvents for food-related applications. This procedure allowed the separation from the initial extract of a fraction containing the amphiphilic compounds, such as bioactive polar lipids, including phospholipids and glycolipids, as well as other amphiphilic bioactives like carotenoids and phenolics, which is characterized as the fraction containing the total amphiphilic content (TAC). The more lipophilic compounds of the initial extracts remained in another separate fraction characterized as the fraction containing the total lipophilic content (TLC), which is mainly constituted from neutral lipids and highly hydrophobic and lipophilic compounds. Following separation, both TAC and TLC fractions were transferred to round bottozm glasses from where the solvents were evaporated again by a flash rotary evaporation system. The TLC lipophilic fractions were dissolved in small volumes of hexane and then transferred in pre-weighted small glass tubes, whereas the TAC amphiphilic fractions were dissolved in ethanol and also transferred in separate small pre-weighted glass tubes. These small volumes of solvents were then evaporated through a nitrogen stream. All the total extracts, and the TAC and TLC fractions were then weighted when dried in their small glass tubes. For subsequent analyses, dried TAC samples were reconstituted in 1 mL ethanol, while TLC samples were dissolved in 1 mL hexane. Each solution was subdivided into aliquots, and in each aliquot the solvents were again dried in nitrogen stream and then stored at -20 oC until further analyses.
2.3. Yield of Extraction
The % yield of extraction for the total extracts (TL), and the TAC and TLC fractions, for each sample assessed, was gravitationally quantified by calculating the net weight of each extract and fraction just after the solvents were evaporated in a nitrogen stream and just before aliquoting them. Then the yield of extraction in each case were expressed as g of extract per 100 mL of goat milk or per 100 g of kefir-based goat yogurt-type fermented product, as per the equation:
Extraction Yield (%) = [mass of dry extract (g)/mass of initial sample (g)] × 100
2.4. Assessment of Total Phenolic Content, Carotenoid Content, and Antioxidant Activ
2.4.1. Total Phenolic Content Quantification
The Total Phenolic Content (TPC) of each extract/fraction was determined using the Folin–Ciocalteu method, as previously described [4,10]. Each sample received 1 mL deionized water and 1 mL Folin–Ciocalteu reagent. After 7 min, 3 mL Na2CO3 solution was added, followed by a 2 h incubation in the dark with intermittent vortexing. Absorbance was measured at 765 nm. TPC was calculated from a gallic acid calibration curve and expressed as mg gallic acid equivalents (GAE) per g dry weight (DW) of each extract/fraction assessed.
2.4.2. Total Carotenoid Content Quantification
The Total Carotenoid Content (TCC] of each extract/fraction was quantified by a spectrophotometric analysis, as previously described [10]. Each sample was dissolved in 2 mL of hexane, and absorbance was measured at 450 nm. Carotenoid concentration was calculated using a β-carotene standard curve, with results expressed in mg β-carotene equivalents (CE) per gram of DW of each extract/fraction assessed.
2.4.3. Total Antioxidant Activity (TAA) Evaluation
The antioxidant activity of each sample was assessed using three different and distinct assays for evaluating antioxidant activities, the DPPH- and the ABTS-based assays, as previously described [4,10].
The DPPH-based Assay
An aliquot of each sample (extract/fraction) was mixed with 0.2 mL ethanol, 0.8 mL Tris-HCl buffer (pH 7.4), and 1 mL of DPPH solution. After each reagent addition, samples were vortexed and incubated at room temperature for 30 min. Absorbance was recorded at 517 nm, and inhibition (%) was calculated as follows:
where A1 is the control absorbance and A2 is the test sample absorbance.
Inhibition (%) = (A1 − A2)/A1) × 100,
The IC50 concentration required to inhibit DPPH radicals by 50% was calculated and expressed in Trolox equivalent antioxidant capacity (TEAC values), as follows.
TEAC = IC50 of Trolox (µg/L)/IC50 of the sample (µg/L).
The ABTS-based Assay:
2 mL of ABTS solution was added in an aliquot of each extract/fraction, vortexed, and incubated in darkness for 7 min before measuring absorbance at 734 nm. Trolox served as the standard, with results expressed as µmol of Trolox equivalents (TE) per g of dry weight (DW) of each extract/fraction, using the equation:
where c is the Trolox concentration from the standard curve, V the sample volume (mL), t the dilution factor, and m the sample dry weight (g).
ABTS (µmolTE/gDW) = (c × V × t)/m
2.5. Quantification of the Anti-Inflammatory and Antithrombotic Efficacy by the Platelet Aggregometry Assay
The anti-inflammatory activities of all extracts/fractions against the thrombo-inflammatory mediator, platelet activating factor (PAF) and their antiplatelet antithrombotic effects against a classic platelet agonist, adenosine diphosphate (ADP), were evaluated by platelet aggregometry, in human platelet-rich plasma (hPRP) from healthy donors, as previously described by Kosidou et al 11]. More specifically, the anti-inflammatory and antiplatelet inhibitory capacity of each extract was assessed against platelet aggregation induced either by PAF, a key inflammatory and thrombotic mediator, as well as by the classic platelet agonist, ADP. Platelet aggregation was monitored as changes in light transmittance: resting hPRP exhibits low light transmission, whereas the thrombo-inflammatory stimuli by PAF or the ADP platelet agonist-induced platelet aggregation that increases light permeability proportionally due to platelets starting to aggregate and depended to the extent of aggregation.
Different hPRP preparations were pre-incubated in the presence of several different extracts’ concentrations and then the appropriate concentration of the agonist was added, which could induce maximum reversible platelet aggregation process in the absence of the extracts (positive control of the 100% of platelet aggregation), and the changes in the platelet functionality and aggregation were monitored when different platelet aggregation curves with lower heights were observed that differ from the positive control sample that showed the maximum height of reversible platelet aggregation curve. Baseline hPRP without agonist stimulation or the presence of extract was used as the negative control, representing 0% aggregation. Extracts were tested at multiple concentrations to generate concentration–response curves within the linear range of 20–80% of maximum reversible aggregation. Subsequently, a concentration–response curve of reduced/inhibited platelet aggregation was produced for each extract/fraction, within the linear range of 20–80% of maximum reversible aggregation for all the different concentrations of the sample assessed. The half-maximal inhibitory concentration (IC50) of each extract/fraction against PAF or against ADP induced platelet aggregation was calculated from the linear regression of percent inhibition versus extract concentration, as the mass (μg) of dry extract required to inhibit 50% of agonist-induced platelet aggregation. Lower IC50 values indicate greater inhibitory potency against the specific aggregation pathway.
All experiments were performed in independent replicates using platelets from different donors (n = 6 different blood donors’ samples for each extract/fraction, thus 3 × 6 = 18 different IC50 values for the triplicate fractions from a goat milk or kefir-based sample) to ensure reproducibility. Inclusion criteria, including healthy adult donors with no history of cardiovascular disease or medication affecting platelet function, along with clarifications that blood donors served as biological sources for platelet-rich plasma, while the experimental comparisons were performed between the tested extracts and the platelet agonists used as controls, are embedded in the Informed Consent Form, which was provided to all healthy blood donors involved in the study prior to their participation; the signed form was obtained from all these participants for being allowed to participate, according to the Ethics Statement from the Ethics Committee of Democritus University of Thrace (protocol code: ΔΠΘ/EHΔE/7690/70, approval date: 27 September 2024).
2.6. ATR FT-IR Based Structural Analysis of TAC Extracts from Goat Milk Kefir and Goat Yogurt Kefir
Structural characterization of the functional groups from compounds present in extracts/fractions was performed using attenuated total reflection Fourier-transform infrared spectroscopy (ATR–FTIR), as previously described [4,10]. The ATR–FTIR technique was selected due to its minimal sample preparation requirements, low sample volume demand, and non-destructive nature.
More specifically, in this technique, infrared radiation is directed through an internal reflection crystal of high refractive index. When the sample is placed in direct contact with the crystal surface, an evanescent wave penetrates a few micrometers into the material. Absorption of specific wavelengths induces vibrational transitions in molecular bonds, generating a characteristic infrared spectrum that reflects functional groups and overall molecular structure.
ATR–FTIR analysis was conducted using a PerkinElmer Frontier ATR/FT-NIR/MIR spectrophotometer (PerkinElmer, Shelton, CT, USA) within the spectral range of 600–4000 cm−1. A small quantity of each extract was applied directly onto the crystal surface to ensure full coverage and optimal contact. Spectra were recorded once stable signal acquisition was achieved.
All TAC and TLC extracts were analyzed under identical conditions and each spectrum acquired was compared with reference spectra obtained under the same conditions from analytical standards, such as flavonoids like quercetin and catechin, simple phenolics like gallic acid, carotenoids like β-carotene, and polar lipids soybean, to facilitate peak assignment and comparative interpretation. Isopropanol, used for crystal cleaning between measurements, was additionally analyzed to identify and exclude potential solvent-related spectral interference.
2.7. Determination and Quantification of Fatty Acid Composition by Liquid Chromatography-Mass Spectrometry
Fatty acid composition and of the bioactive TAC extracts were analyzed using liquid chromatography–mass spectrometry (LC–MS), as previously described [4,10]. Briefly, dried TAC samples were dissolved in 500 µL of dichloromethane/methanol (1:2, v/v) and centrifuged at 13,000 rpm for 6 min. Supernatants were filtered through 3 kDa ultrafiltration membranes (Amicon Ultra 3k, Merck Millipore, Darmstadt, Germany) to remove high-molecular-weight impurities.
For fatty acid profiling, 10 µL of filtrate was injected into an Agilent 1260 HPLC system equipped with an Agilent 6520 Q-TOF mass spectrometer operating in negative electrospray ionization (ESI) mode. Separation was achieved on an Agilent Poroshell 120 EC-C18 column (2.7 µm, 3.0 × 150 mm) under gradient elution using Phase A (2 mM ammonium acetate in water) and Phase B (2 mM ammonium acetate in 95% acetonitrile). The flow rate was 0.3 mL/min for the first 5 min and increased to 0.6 mL/min thereafter.
Mass spectra were recorded from m/z 50–1100. Instrument parameters included a capillary voltage of 3500 V, skimmer voltage of 65 V, fragmentor voltage of 175 V, drying gas flow of 5 L/min, nebulizer pressure of 30 psi, and a drying gas temperature of 325 °C. Identification of fatty acids was validated using external standards (e.g., C12:0, C14:0, C16:0, C18:0, C18:1n-9, C18:2n-6, C18:3n-3). Relative abundances were estimated based on peak areas across triplicate runs.
2.8. Statistical Analysis
All analyses were performed in triplicate (n = 3). Antiplatelet assays were conducted in blood samples from multiple healthy donors (N = 9 measurements per extract). Normality was assessed using the Kolmogorov–Smirnov test. Parametric datasets (IC50 values and fatty acid data) were analyzed using one-way ANOVA with LSD post hoc tests. Non-parametric datasets (phenolic content, carotenoid content, and antioxidant assays) were analyzed using the Kruskal–Wallis test, with results reported as median, minimum, and maximum values. Statistical significance was defined as p < 0.05.
3. Results
3.1. Yield of Extraction
Some differences were observed between the extraction yield of the different fractions, but with not statistically significant levels (one-way ANOVA, p = 0.137). The average yields were 6.29 g for the TAC fraction of the Kefir-based goat yogurt type fermented product (yTAC)/100g sample, 5.18 for goat milk TAC (mTAC)/100g sample, 7.33 for yogurt TLC (yTLC)/100g sample, and 9.98 for milk TLC (mTLC)/100g sample. Overall, the lipophilic fractions (TLC) in both goat dairy sources tended to show higher yields than the corresponding amphiphilic fractions (TAC), with mTLC showing the highest average extraction yield among all groups. Nevertheless, the Tukey post-hoc test revealed no significant differences between pairs (all p > 0.05). Despite the absence of statistically significant differences, the extraction yield pattern clearly showed that lipophilic fractions recovered more material mass than amphiphilic fractions, particularly in milk (mTLC > mTAC). This finding is consistent with previous reports showing that the majority of the lipids present in dairy products are mainly the more lipophilic (more neutral) lipids, while amphiphilic extracts mainly contain the more amphiphilic polar lipids [12], as well as other minor amphiphilic bioactive components, including some carotenoids and phenolic bioactives [13,14]. For example, it has been previously reported that cow milk shows a greater association with lipophilic lipid compounds like triglycerides and low-unsaturation neutral lipid features, whereas milk from other animals like mare’s milk showed a greater contribution of polar-lipid and membrane-related lipid features [15]. Goat’s milk seems to follow cow’s milk trend of containing mainly neutral lipids (95-99%) and with a lower content in polar lipids (1-5%) [12]. Nevertheless, in the present study, yogurt TAC showed equal to slightly higher yields than milk TAC, suggesting that fermentation may promote the release of polar and amphiphilic molecules into the extractable pool, in line with previous observations on fermented dairy matrices [16]. It is important to note that when these fractions are examined in conjunction with biological activity tests, it becomes apparent that bioactivity is mainly determined by the qualitative composition of the extracts rather than the total mass recovered, as the TAC fractions – despite their lower yield – consistently exhibited superior antioxidant activity compared to TLC in several dairy products [17].
3.2. Total Phenolic and Carotenoid Content of Kefir Milk and Yogurt
3.2.1. Carotenoid Content
The concentration of total carotenoids, expressed as total carotenoid content (TCC) in mg CE/g DW of extract, showed significant variation between the four groups (Table 1), as confirmed by the Kruskal–Wallis test (H = 8.744, df = 3, p = 0.033). This statistically significant difference indicates that goat milk TAC extracts differ substantially from the others in terms of carotenoid content. More specifically, at a descriptive level, goat milk amphiphilic extracts (mTAC) had the highest carotenoid concentrations, with a median value of 3,137 mg CE/g and a range of 1,887–7,060 mg CE/g, values that indicate significant intra-group variability. In contrast, the amphiphilic yogurt extracts (yTAC) showed much lower levels, with a median value of 0.873 mg CE/g and a range of 0.545–2,214 mg CE/g. Lipophilic yogurt fractions (yTLC) showed also low values, with a median of 0.846 mg CE/g and a range of 0.628–1,075 mg CE/g, while the lipophilic fractions of milk (mTLC) showed the lowest total concentrations (median value = 0.153 mg CE/g, range 0.088–0.202 mg CE/g). These patterns indicate that carotenoids preferentially localize in amphiphilic fractions, particularly in goat milk TAC, and that fermentation reduces TCC—consistent with carotenoid degradation during lactic fermentation [13].
3.2.2. Phenolic Content
Total phenolic content (TPC) in unsapon ified TAC fractions (mTAC and yTAC) was extremely low or undetectable, which matches literature reports that dairy amphiphilic lipids generally lack significant phenolic content [18]. Phenolics in dairy products are usually water-soluble, protein-bound, or metabolized during fermentation. In contrast, lipophilic fractions (yTLC, mTLC) exhibited measurable TPC values (0.06–0.48 mg GAE/g). A marginally significant difference was detected across groups (Kruskal–Wallis, p = 0.050), with yTLC showing higher medians than mTLC, indicating that fermentation may promote the transfer of oxidized phenolic-like lipid derivatives into the lipophilic phase. The median, max and min values of both amphiphilic and lipophilic extracts are summarized in Table 2. These phenolics are likely derived from oxidative products of polyunsaturated fatty acids rather than plant-origin phenolics, consistent with prior studies describing aldehydic, ketonic, and aromatic oxidation products contributing to fermented dairy aroma profiles [18].
3.3. Antioxidant Activities
The antioxidant potential of TAC, TLC, and TL extracts from goat milk and goat yogurt kefir was assessed using ABTS and DPPH assays. Results were expressed as Trolox equivalents (µmol TE/g DW) for the ABTS values and as Trolox equivalent antioxidant capacity (TEAC values) for the DPPH assay, and statistical comparisons were performed using one-way ANOVA or Kruskal–Wallis tests, depending on the normal distribution or not of the data, respectively, along with appropriate post hoc analyses in each case.
3.3.1. ABTS Radical Scavenging Activity
The ABTS+• scavenging results exhibited statistically significant differences among the amphiphilic and lipophilic extract types (Kruskal–Wallis: H = 8.436, df = 3, p = 0.038), indicating that both extract polarity and product type (milk or yogurt) influence antioxidant capacity, with the TAC fractions showing the higher activity. More specifically, amphiphilic extracts produced the highest ABTS values as we can see in Table 3. Milk TAC (mTAC) showed a wide range (0.413–3.736 μmol TE/g DW; median = 1.943 μmol TE/g), indicating notable intra-group variation. Yogurt TAC (yTAC) displayed a narrower, more stable range (0.562–2.191 μmol TE/g DW; median = 1.746 μmol TE/g). Differences between mTAC and yTAC were not statistically significant (p = 0.910), suggesting that fermentation type does not markedly affect the ABTS activity of amphiphilic fractions.
Lipophilic fractions exhibited significantly lower ABTS activity. Yogurt TLC (yTLC) ranged from 0.068–0.147 μmol TE/g (median = 0.127), whereas milk TLC (mTLC) displayed the smallest range (0.089–0.099 μmol TE/g; median = 0.089), making mTLC the lowest-performing group. These findings are consistent with prior reports showing superior antioxidant properties in amphiphilic fractions [19].
3.3.2. DPPH Radical Scavenging Activity
The antioxidant activity of the extracts was evaluated using the DPPH radical scavenging assay, calculating the TEAC values (TEAC = IC50 of Trolox (µg/L)/IC50 of sample (µg/L)) for all sample sets: mTAC, yTAC, yTLC, and mTLC. Table 4 shows the results of the DPPH test as antioxidant capacity values in yogurt and milk extracts. The amphiphilic extracts showed the highest TEAC values. Specifically, mTAC had a median value of 0.62 TEAC, with low variability, as values ranged from 0.26 to 0.90 TEAC, while the yTAC extracts showed similar mean values of 0.40 TEAC, but with higher variability, with a minimum value of 0.22 and a maximum value of 5.34 TEAC. Nevertheless, both TAC extracts showed statistically significantly higher TEAC values and thus antioxidant capacity compared to those of the TLC extracts, as the lipophilic yTLC showed a mean value of 0.02 TEAC, with a minimum value of 0.017 and a maximum value of 0.024, while mTLC showed a mean value of 0.016 TEAC, with a minimum value of 0.014 and a maximum value of 0.016 TEAC. The yTLC–yTAC and mTLC–mTAC comparisons showed unadjusted p-values of 0.013 and 0.009, respectively, according to the nonparametric Kruskal–Wallis test. The remaining comparisons showed non-statistically significant results with adjusted p-values greater than 0.3. These data demonstrate the existence of differentiation between groups, as recorded by the Kruskal–Wallis test, with the final statistical significance of pairwise comparisons depending on the correction for multiple comparisons. Finally, the results observed for the higher TEAC values of the TAC extracts from both goat milk and its kefir-based yogurt are consistent with the literature [20], while the relative TEAC values of the TLC fractions were lower than what has previously been recorded.
3.4. FT-IR Spectrum Analysis (TAC Goat Milk Kefir and Yogurt Extracts)
The ATR–FTIR analysis of the amphiphilic fractions (TAC) obtained from goat milk kefir and goat yogurt kefir revealed a consistent series of characteristic absorption bands corresponding to phenolic-type structures, carotenoid chromophores, and polar lipid functional groups. All six recorded spectra (three from the kefir-based goat yogurt TAC and three from the goat milk TAC) displayed highly similar overall profiles, with only minor differences in band intensities between the two product types. A broad absorption band extending across 3200–3600 cm−1 was observed in all samples, corresponding to O–H stretching vibrations. This region is generally associated with hydroxyl groups present in phenolic structures, but it can also arise from hydrogen-bonded hydroxyl groups of fatty acids. Its presence aligns with previous descriptions of hydroxyl-rich polar molecules in amphiphilic dairy extracts.
In the 2850–3000 cm−1 range, distinct asymmetric and symmetric C–H stretching bands of –CH2 and –CH3 groups were evident. These vibrations are indicative of aliphatic chains typical of fatty acids and carotenoids and represent the lipid components of the extracts, particularly phospholipids and other polar lipids common in fermented dairy matrices. A prominent absorption band at 1700–1750 cm−1 corresponded to C=O stretching vibrations of ester and carboxylic acid groups, characteristic of esterified fatty acids such as those present in glycolipids and phospholipids. This confirms the presence of polar lipids contributing to the amphiphilic composition of TAC.
Within the 1600–1500 cm−1 region, bands associated with aromatic C=C stretching vibrations were detected, indicating contributions from aromatic rings, which are usually present in phenolic structures. Additional bands at 1450–1410 cm−1 were attributed to CH2/CH3 bending modes, representing aliphatic chain deformation typical of fatty acid moieties and/or some carotenoids. A clearly distinguishable band around 1230–1210 cm−1 was assigned to P=O and P–O stretching vibrations from phospholipid phosphate headgroups, providing direct evidence of phospholipid-type polar lipids in the amphiphilic fraction. Strong absorptions in the 1100–1000 cm−1 region corresponded to C–O and C–O–P vibrations associated with alcohols and esters in phospholipid structures.
Overall, the fingerprint region (600–1500 cm−1) presented a complex combination of overlapping bands consistent with a mixture of phenolic-like molecules, polar lipids, carotenoids, and other amphiphilic components typical of fermented dairy products. Yogurt TAC spectra displayed slightly stronger intensities in the O–H and C–O regions compared to milk TAC, implying a somewhat higher abundance of polar bioactive constituents, in agreement with trends observed in antioxidant assays. Collectively, these spectral features confirm that goat kefir TAC extracts contain a diverse mixture of phenolic-associated structures, carotenoids and polar lipids, and other amphiphilic compounds with potential biological relevance [18,21]. These findings are presented in detail in Table 5.
3.5. LC-MS Analysis of the TAC Extracts from Goat Milk Kefir and Goat Yogurt
The analysis of fatty acids in the amphiphilic fraction (TAC) of goat milk and its kefir-based yogurt type fermented product showed that saturated fatty acids dominate in both the non-saponified and saponified fractions, with a significant contribution from selected monounsaturated and polyunsaturated fatty acids, especially omega-3.
The fatty acid content of the saponified TAC fractions for both products (mTAC2(L): milk, yTAC2(L): yogurt), reflects the composition of the fatty acids that were esterified to the TAC polar lipids (phospholipids and glycolipids) prior to the saponification treatment. In these fatty acids, a wide range of saturated fatty acids, from caprylic (C8:0) to arachidic (C20:0), was identified in the saponified fraction of both mTAC and yTAC. The lower members of the series (C8:0, C9:0, C10:0, C11:0, C12:0, C13:0) were found in small but considerable concentrations, in the range of 0.02–1.3%, with no significant differences between milk and yogurt. The two dominant SFAs in the saponified fraction were palmitic and stearic acids, with C16:0 occurring at ~ 33.5–34.0% and C18:0 reaching 50–51%, percentages, suggesting the incorporation of long-chain SFAs into the polar/phospholipid skeleton. Of the monounsaturated fatty acids, palmitoleic acid (C16:1 n-7) ranged from 0.23–0.29%, while oleic acid (C18:1 n-9) showed values of approximately 2.8–3.0%, highlighting that a considerable portion of MUFA participates structurally in polar lipids. In polyunsaturated fatty acids, both linoleic acid (C18:2 n-6) and linolenic acid (C18:3 n-3) were found in lower but considerable concentrations, approximately 0.23–0.24% and 0.16% respectively, with no significant differences between mTAC and yTAC. In terms of totals, the saponified fraction of both products was extremely rich in SFA, with median values of ~96.4% and a range of 96.3–96.6% for both milk and yogurt, while MUFA ranged around 3.2–3.3% and PUFA only 0.39–0.40%. Total UFAs were 3.5–3.6% (Table 6), and statistical analysis showed that there was no statistically significant difference between mTAC and yTAC for all SFA, MUFA, PUFA, and UFA (Mann–Whitney, p>0.05 for all categories).
The n6 PUFAs were almost exclusively linoleic acid, with values of ~0.23% in both products, while n3-PUFA corresponded essentially to α-linolenic acid with ~0.16%. The n6/n3 ratio in the saponified fraction was favorably low, ranging between 1.45 and 1.5 for both mTAC and yTAC, reflecting a strong anti-inflammatory potential for polar lipids carrying such PUFA, even in small quantities, since the lower the values for this ratio the better the anti-inflammatory potential of the source of these fatty acids [22]. For most individual fatty acids in the saponified fraction, the differences between milk and yogurt were small and statistically insignificant, confirming that microbial fermentation did not substantially alter the fatty acid composition of the polar/phospholipid molecular classes of TAC. Nevertheless, fermentation in yogurt does not dramatically change the fatty acid categories, but is accompanied by selective, statistically marginal changes in certain SFAs and a significant reduction in all UFAs of polar lipids, probably due to their consumption during lactic fermentation, and consequently with a low but calculable presence of alpha-linolenic acid and, by extension, favorable anti-inflammatory low n6/n3 values, which favor its anti-inflammatory action.
In the non-saponified fraction (free fatty acids: FFA) for both products (mTAC2(L): milk, yTAC2(L): yogurt), the profile was again characterized by high percentages of palmitic and stearic acid, with palmitic (C16:0) ranging from approximately 28–29% and stearic (C18:0) around 41–45% of the total relative surface area. Minor but stable percentages were observed for myristic (C14:0 ~2–2.5%), pentadecanoic (C15:0 ~1.9–2.0%), margaric (C17:0 ~2.0–2.2%), and pelargonic (C9:0 ~0.7–0.8%) acids, while tridecanoic and other intermediate chains were detected in much lower concentrations. Moreover, higher concentrations of monounsaturated fatty acids, oleic acid (C18:1 n-9) were detected in FFA compared to the saponified ones, with values around 8.5–8.9% in mTAC and 7.4–8.3% in yTAC, while palmitoleic acid (C16:1 n-7) showed lower percentages (~1.4–1.8%). Of particular importance were the polyunsaturated acids, where linoleic acid (C18:2 n-6) was found at levels of approximately 1.3–1.7% and the sum of the isomers of linolenic acid (C18:3 n-3, α) at much higher levels, around 11% for mTAC and 9.5–10.7% for yTAC, making the non-saponified fraction of TAC particularly rich in ω-3 PUFA. Statistical analysis of individual fatty acids using Kruskal–Wallis/Mann–Whitney showed that for pelargonic and myristic acids, the differences between the TAC from milk and yogurt were not significant (p>0.05), while for pentadecanoic acid a difference of marginal significance was observed (p≈0.05), with yogurt’s TAC FFA showing slightly lower values. More pronounced differences were observed for palmitic and stearic acids, where yTAC showed a tendency to be richer compared to mTAC, and the corresponding tests yielded p-values approximately equal to or less than 0.05, indicating that fermentation is accompanied by a redistribution of long-chain SFAs towards heavier members (C17:0, C18:0). In contrast, no statistically significant change was confirmed for palmitic acid, indicating that the basic C16:0 distribution remains stable regardless of the fermentation stage. In monounsaturated and polyunsaturated acids, significant (p<0.05) or marginal differences (p≈0.05) were observed for oleic, linoleic, and linolenic acids: milk’s TAC FFA showed higher mean values for oleic and especially linolenic acids (C18:3 n-3), while yogurt TAC FFA had a slightly lower content of these UFAs, consistent with the slight decrease in the total UFA pool calculated in yTAC. At the category sum level, mTAC showed an average SFA percentage of ~77.4%, MUFA ~10.4%, and PUFA ~12.9%, with total unsaturated (UFA) ~23.3% and n3PUFA ~11.3%, while yTAC ranged from ~79–81% SFA, 9–9.7% MUFA, ~11% PUFA, UFA ~20–21.8%, and n3PUFA ~9.6–10.7%. The n6/n3 ratio of the FFA in the non-saponified TAC fraction is considered particularly favorable, which was around 0.15 for mTAC and 0.14 for yTAC, indicating a clear predominance of omega-3 (n3) PUFA over omega-6 (n6) and supporting the functional nature of kefir's amphiphilic lipids. The statistical outcomes supporting these observations before, as well as after saponification, appear in Table 6 and Table 7 respectively.
3.6. Evaluation of Antithrombotic and Anti-Inflammatory Activity in Human Platelets
Figure 1 and Figure 2 present the results of the anti-inflammatory and antithrombotic properties of the TAC and TLC extracts from both goat milk and its yogurt-type kefir-based fermented product based on the platelet aggregation assays using the thrombo-inflammatory mediator, platelet-activating factor (PAF), and a classic platelet agonist, adenosine-5’-diphosphate (ADP), as inducers of aggregation of human platelet rich plasma (hPRP), respectively.
Platelet aggregometry assessment in hPRP is one of the golden standard methodologies to evaluate the induction or inhibition of platelet aggregation by a specific compound/extract against either a thrombo-inflammatory mediator that promote platelet activation and aggregation, or against a classic platelet agonist that induce platelet aggregation. More specifically, this methodology has been successfully applied not only for pharmaceuticals with potent anti-platelet, antithrombotic and anti-inflammatory properties [11,23], but also for natural compounds and extracts that can inhibit platelet aggregation induced by classic platelet agonists like ADP or by thrombo-inflammatory mediators like PAF, such as those present in fermented products [4,10,24]. Inhibition of PAF reflects not only antithrombotic activity but also anti-inflammatory potential, given PAF’s central role in inflammatory signaling cascades in platelets, but also in several other cells that express in their membranes PAF-receptor, suggesting that the studied in platelets anti-PAF potency of a bioactive compound also reflects its more general anti-inflammatory potency [25]. Overall, assessing anti-PAF effects on platelets is crucial because PAF is a potent lipid mediator driving inflammation and thrombosis, causing platelets to aggregate and release inflammatory signals, making anti-PAF agents as potential treatments for cardiovascular diseases (like atherosclerosis), asthma, sepsis, and other inflammatory conditions by blocking these harmful pro-thrombotic and inflammatory pathways.
In contrast, ADP is one of the well-established platelet agonists acting on platelets through a specific for ADP receptor, by which classic platelet aggregation and thrombotic stimulation is induced [26]. Assessing anti-ADP effects on platelets is crucial for managing cardiovascular risk, as ADP is vital for platelet aggregation (clotting), but also a target for antiplatelet drugs like clopidogrel, allowing clinicians to personalize therapy, check drug efficacy, predict thrombosis risk, and diagnose platelet disorders, ensuring patients get the right dose to prevent clots without excessive bleeding [23]. Subsequently, assessing the anti-ADP effects of natural bioactives, especially from fermented products, on platelets is also crucial because, as aforementioned, ADP is a key signal for platelet activation, central to blood clot formation (thrombosis) in cardiovascular diseases like heart attacks and strokes, so finding natural compounds that block this pathway offers a way to develop safer, effective antiplatelet drugs that could reduce bleeding risks associated with current medications while preventing dangerous clots [4,10,24].
In the present study, the obtained results shown in Figure 1 and Figure 2 express the inhibitory potential of the extracts against PAF- and ADP-induced platelet aggregation in terms of IC50 (half-maximal inhibitory concentration), which equals to the mass in μg of the sample that when present in the aggregometer cuvette with the 250 μL of hPRP, it can cause 50% of inhibition of the PAF-/ADP-induced aggregation of hPRP. It is important to state that the lower the IC50 values for a sample against either PAF or ADP induced platelet aggregation the greater its inhibitory potency against the specific thrombo-inflammatory pathway.
It was found that the TAC extracts from both the Goat Milk and its fermented Yogurt-Style kefir Product showed statistically significantly lower IC50 values against both pathways of platelet aggregation than those of their respective TLC fractions (ANOVA p<0.05 in both cases, respectively), suggesting stronger anti-inflammatory and antiplatelet potency for the amphiphilic compounds of these two dairy sources against both PAF and ADP (Figure 1 and Figure 2).
Moreover, from all the samples assessed the TAC extracts of the Yogurt-Style kefir Product derived from fermenting goat milk showed the lowest IC50 values against the PAF pathway, which was statistically significantly lower than the IC50 value for this sample against the ADP pathway and from the anti-PAF and anti-ADP effects of all the other samples assessed, suggesting a higher specificity for the anti-inflammatory observed for the kefir TAC extracts against the PAF pathway specifically (Figure 1 and Figure 2).
In contrast, in the TAC from the Goat Milk both the anti-PAF and anti-ADP effects of the TAC fractions were almost equal, as TAC from each source showed similar IC50 values against each platelet agonist, suggesting that the anti-platelet effects of the amphiphilic natural bioactives that are present in these sources is not related to any specificity between these compounds for any of the two pathways assessed in this study, rather than a general anti-platelet effect by their interaction with platelets, when incubated in the hPRP for 2 minutes, prior to the addition of the platelet agonist.
TAC extracts from other kefir products and individual microbiota from kefir have previously been reported to exert PAF-inhibitory effects [4]. Moreover, TAC extracts from several dairy fermented products have also shown strong anti-PAF activities and specificity against the PAF-pathway both in vitro and in vivo, which were found to be higher than the anti-PAF effects of the TAC from the unfermented dairy milks, suggesting that fermentations mediate for an improvement of the polar lipid profile present in the final fermented product, in such a way as to enhance the anti-inflammatory potency of the product [5,10,17,24,27]. Thus, the potent anti-PAF activity of the amphiphilic extracts (TAC) from the fermented kafir product can be attributed to such bioactive polar lipids, acting either independently or synergistically with other amphiphilic bioactives (phenolics, carotenoids and FFA) that were identified to be present in these TAC extracts that also exert strong anti-PAF effects.
Nevertheless, it should not be neglected that the amphiphilic TAC extracts from the unfermented goat milk also demonstrated considerably potent PAF inhibition, lower but in the same order of magnitude to that observed in TAC from its fermented kefir product, likely due again to the presence of polar lipids, FFA and bioactive phenolics in the goat milk too.
The strong anti-PAF effects observed in both TAC extracts from goat milk and especially from its fermented kefir product, compared to the much lower anti-PAF effects of their TLC extracts, seems to be originated by the fact that during the counter current distribution methodology applied in this study the bioactive polar lipid content and some FFA co-migrated to the TAC extracts as usual, along with the other amphiphilic bioactives, like FFA, phenolics and carotenoids.
Apart from the well-established preferential anti-PAF effects of dietary polar lipids, including dairy polar lipids [5,10,17,24,27], several FFA (mostly cis monounsaturated fatty acids – MUFA - like oleic acid, but also omega-3 polyunsaturated fatty acids – ω-3 PUFA - like alpha linolenic acid - ALA) have shown some anti-PAF efficacy [28,29,30,31]. Several bioactive phenolics on the other hand have also shown strong anti-PAF activities in vitro and in vivo [32], while in silico molecular docking analysis have revealed that they possess strong binding affinity on PAF-receptor (PAF-R) and thus inhibiting PAF by an antagonistic effect on the binding of PAF on PAF-R [33,34]. Moreover, the presence of carotenoids in these fractions, not only provide antioxidant stability to all the other bioactives (i.e. phenolics and PUFA or MUFA of the polar lipids) and thus to the whole extract itself, they can also indirectly affect PAF-related inflammatory manifestations, since carotenoids interact with PAF metabolism, to help prevent cardiovascular damage by modulating oxidative stress and inflammation, often by inhibiting PAF synthesis pathways and enhancing the body's own defenses. While PAF is a pro-inflammatory mediator, carotenoids' combined action with the other kefir derived bioactive compounds helps balance its effects, reducing tissue damage and promoting heart health, especially when co-present with vitamins like vitamin E [35,36].
Overall, the high phenolic content and the polar lipids and FFA being present in the TAC extracts seem to be the main bioactives with anti-PAF effects, while carotenoids provide antioxidant stability and indirect anti-PAF effects through reducing PAF synthesis.
The neutral TLC fractions in both Goat milk and its fermented kefir product likely owe their limited yet detectable antiplatelet effect and at some extent an anti-PAF inhibition due to some lightly bioactive lipophilic compounds of lower polarity from the classic amphiphilic bioactives, which usually co-migrate to petroleum ether phase during CCD, such as FFA, and at some extents tocopherols, among others, which have been reported to modulate platelet aggregation and oxidative pathways at some extent, while some of them interact directly with the PAF-pathway [28,29,30,31].
With respect to the effects of all extracts against ADP-induced aggregation, previous studies have identified several polar lipids to possess also a general anti-ADP effect [4,10,24], while specific phenolic bioactives like quercetin, luteolin, and gallic acid have been reported to act as natural inhibitors of the ADP induced aggregation of platelets [37,38,39], which further supports the potent anti-ADP effect observed for the TAC extracts of both the Goat Milk and its fermented kefir product . In addition, the carotenoids present in both these goat derived dairy sources seem also to contribute directly to the anti-ADP effect of all extracts on platelets, since differently from their indirect effects on PAF (inhibition of PAF-synthesis rather than inhibition of PAF-induced platelet aggregation), these dairy carotenoids have been reported to exhibit a concentration-dependently inhibition of platelet aggregation and the ATP-release reaction stimulated by ADP, or other platelet agonists (i.e. collagen or arachidonic acid) in both washed human platelets and PRP [35,36].
Overall, the TAC extracts exhibited the strongest inhibitory activity against both PAF and ADP, consistent with their composition rich in amphiphilic bioactives, including several PL bioactives containing unsaturated fatty acids as parts of their structures, but also due to their phenolics’ and carotenoids’ contents. Despite having moderate phenolic content, their bioactivity appears to stem primarily from bioactive phospholipids and glycolipids, including specific cerebrosides, which act synergistically with the co-present amphiphilic antioxidants (phenolics and carotenoids).
Finally, the anti-PAF activities of the TAC extracts from the fermented goat kefir product showed the highest anti-inflammatory potency and specificity against the PAF pathway compared to all the other extracts assessed form these goat derived dairy products, while in the goat milk the TAC extracts the anti-PAF activity was of similar potency (IC50 values) with their ant-ADP effects, which further suggest a general and non-specific potency of these extracts to inhibit platelet aggregation, independently from the signaling pathway. These findings highlight not only the health benefits of TAC from kefir, but mainly the potential of valorizing fermented products from goat milk in such a way as they become functional foods with strong anti-inflammatory and considerable antiplatelet cardioprotective effects.
4. Discussion
This study provides a detailed characterization of the bioactive components generated during the fermentation of goat milk and its goat yogurt kefir, highlighting clear differences between amphiphilic (TAC) and lipophilic (TLC) fractions. Overall, the findings demonstrate that the amphiphilic extracts are the primary contributors to the antioxidant, antithrombotic, and anti-inflammatory properties of goat kefir, aligning with previous work showing that polar lipids and amphiphilic metabolites play central roles in the biological activity of fermented products [4,5,10,24,27].
A key observation is the consistently higher antioxidant capacity of TAC compared to TLC in all assays. This pattern is well supported by the molecular composition revealed in the FT-IR analyses. TAC fractions contained abundant carotenoid-type chromophores, all of which are recognized contributors to radical scavenging and redox-modulating activity. The absence of plant-derived flavonoids such as catechin or quercetin was expected, since such phytochemicals are not typical constituents of dairy matrices. In addition, the antioxidant activity of kefir appears to derive from carotenoids-associated chromophores too, reported previously in goat and bovine kefir.
The comparison between milk and yogurt kefir reveals that yogurt-derived extracts often showed slightly higher extraction yields and, in some assays, more stable antioxidant and anti-inflammatory and antiplatelet performance. These differences may reflect the intensified fermentation in yogurt-type kefir, which promotes greater proteolysis and lipolysis, leading to increased release of amphiphilic molecules and microbial metabolites. This trend is consistent with earlier findings showing that thicker or more extensively fermented kefir products like curd contain higher concentrations of bioactive lipids and peptides than whey fractions [40]. However, while yogurt TAC tended to perform better in some assays, the two products were not statistically different across some analytical endpoints, underscoring that both fermentation products retain strong bioactive potential, except in the case of their anti-inflammatory efficacy against PAF, highlighting once more the cardioprotective health promoting properties of fermented dairy TAC extracts [10,17,24,27].
The platelet aggregation assays further confirm the biological relevance of these lipid species. TAC extracts displayed markedly lower IC50 values against PAF- and ADP-induced platelet activation, indicating potent antithrombotic and anti-inflammatory effects. These results align with previous studies demonstrating that polar lipids from fermented dairy and plant sources can inhibit platelet activation pathways and modulate inflammatory signaling. The strong activity of kefir TAC may be attributable to the combination of polar lipids, unsaturated fatty acids, and fermentation-derived bioactives.
The LC–MS data provide further mechanistic insight into the functional activity observed. The saponified TAC, representing the fatty acids present in the polar lipids of the TAC fraction, contained MUFA and PUFA, with a favorable notably low ω-6/ω-3 ratio that support anti-inflammatory health promoting properties. Even at low concentrations, these UFA provide anti-inflammatory and antiplatelet efficacy to the whole polar lipid structure against both the PAF and ADP pathways, with higher specificity against the PAF-related thrombo-inflammatory pathway. The non-saponified TAC fractions contained considerable higher levels of oleic acid (ω-9) and α-linolenic acid (ω-3), resulting in a synergistic effect on these pathways. Such fatty acid distributions are associated with anti-inflammatory and cardioprotective effects, and are consistent with established nutritional characteristics of goat milk and its fermented products.
Taken together, the findings support the concept that goat kefir is a valuable source of amphiphilic bioactive compounds with multifunctional properties, and that fermentation enhances the generation and release of these molecules. While the study provides comprehensive in vitro profiling, further work is needed to evaluate bioavailability, stability during digestion, and in vivo efficacy. Future studies should also examine how fermentation parameters, microbial populations, and storage conditions influence the composition and activity of kefir bioactives.
5. Conclusions
This study investigated the chemical composition and biological activity of extracts derived from goat milk and its yogurt-type kefir fermented product, aiming to elucidate the relationship between their antioxidant, anti-inflammatory, and antithrombotic properties and the nature of their bioactive constituents. The integration of experimental evidence with current literature supports the characterization of goat milk and its kefir product as a complex functional food matrix, whose bioactivity cannot be attributed to a single class of compounds. Instead, the observed biological effects appear to result from the synergistic interplay among amphiphilic lipids, carotenoids, and other polar bioactive molecules.
Several limitations should be considered when interpreting these findings. The relatively limited sample size and the exclusive use of in vitro assays preclude direct extrapolation to in vivo conditions. Moreover, analyses of phenolics and carotenoids were performed at the level of total fractions rather than isolated pure compounds, thereby limiting the precise identification of the molecules primarily responsible for the recorded bioactivities. The inherent complexity of the dairy matrix, along with potential variability associated with fermentation conditions, microbial composition, and production parameters, was not systematically addressed and may influence the bioactive profile of the final product.
Future investigations should prioritize the isolation, structural characterization, and quantitative profiling of specific polar lipids and amphiphilic molecules exhibiting anti-PAF and antiplatelet activity. Mechanistic studies employing cellular and in vivo models are warranted to clarify the molecular pathways underlying their biological effects. Additionally, correlating bioactivity with fermentation-associated microbial profiles and evaluating alternative fermentation protocols may provide valuable insights into optimizing the functional properties of kefir. Collectively, the present findings provide a robust foundation for the further exploration of goat milk and its kefir-based yogurt type fermented product as a functional food and underscore the relevance of amphiphilic bioactive constituents in nutritional strategies aimed at mitigating oxidative stress and inflammatory responses.
Author Contributions
“Conceptualization, A.T.; methodology, A.T. K.S.; software, all authors; validation, A.T.; formal analysis, A.Th., V.P. A.O., K.S. and A.T.; investigation, A.T.; resources, A.T. and K.S.; data curation, A.Th., K.S. and A.T.; writing—original draft preparation, A.Th. and A.T.; writing—review and editing, A.T.; visualization, A.T.; supervision, A.T.; project administration, A.T. All authors have read and agreed to the published version of the manuscript”.
Funding
This research was funded by the “Action RSO1.1a: Support for enterprises of the Region of Eastern Macedonia and Thrace for research and innovation" under the Program "Eastern Macedonia, Thrace 2021-2027" (MIS Code 14726)”.
Institutional Review Board Statement
The anti-inflammatory and antithrombotic properties of water kefir bioactives (natural bioactives) of this study were conducted in platelets from healthy volunteers, in accordance with the Declaration of Helsinki and approved by the Ethics Committee of DEMOCRITUS UNIVERSITY OF THRACE (protocol code ΔΠΘ/EHΔE/73216/640 at the 24th June 2026).
Informed Consent Statement
Informed consent was obtained from all healthy blood donors involved in the study.
Data Availability Statement
The raw data supporting the conclusions of this article will be made available by the PI of the project and the corresponding author (A.T.) upon request.
Conflicts of Interest
The authors declare no conflicts of interest.
Acknowledgments
The Authors would like to thank the School of Chemistry of the Faculty of Sciences of the Democritus University of Thrace, the General Hospital of Kavala in Greece and the Technological University of the Shannon in Ireland for their continuous support, and especially in the memory of its former member, esteemed colleague and best friend, Dr Sushanta Kumar Saha.
References
- Granato, D.; Carocho, M.; Barros, L.; Zabetakis, I.; Mocon, A.; Tsoupras, A.; Cruz, A.G.; Pimentel, T.C. Implementation of Sustainable Development Goals in the dairy sector: Perspectives on the use of agro-industrial side-streams to design functional foods. Trends Food Sci. Technol. 2022, 124, 128–139. [Google Scholar] [CrossRef]
- Papadopoulou, D.; Chrysikopoulou, V.; Rampaouni, A.; Tsoupras, A. Antioxidant and anti-inflammatory properties of water kefir microbiota and its bioactive metabolites for health promoting bio-functional products and applications. AIMS Microbiol. 2024, 10, 756–811. [Google Scholar] [CrossRef] [PubMed]
- Buran, İ.; Akal, H. C.; Ozturkoğlu-Budak, S.; Yetisemiyen, A. Effect of milk kind on the physicochemical and sensorial properties of synbiotic kefirs containing Lactobacillus acidophilus LA-5 and Bifidobacterium bifidum BB-11 accompanied with inulin. Food Sci. Technol. 2022, vol. 42, e08421. [Google Scholar] [CrossRef]
- Papadopoulou, D.; Chrysikopoulou, V.; Rampaouni, A.; Plakidis, C.; Ofrydopoulou, A.; Shiels, K.; Saha, S.K.; Tsoupras, A. Antioxidant, Antithrombotic and Anti-Inflammatory Properties of Amphiphilic Bioactives from Water Kefir Grains and Its Apple Pomace-Based Fermented Beverage. Antioxidants 2025, 14, 164. [Google Scholar] [CrossRef] [PubMed]
- Poutzalis, S.; Anastasiadou, A.; Nasopoulou; Megalemou, C.; Sioriki, K.; Zabetakis, E.I. Evaluation of the in vitro anti-atherogenic activities of goat milk and goat dairy products. Dairy Sci. Technol. 2016, 96, 317–327. [Google Scholar] [CrossRef]
- dos Santos, W.M.; Gomes, A.C.G.; de Caldas Nobre, M.S.; de Souza Pereira, A.M.; dos Santos Pereira, E.V.; dos Santos, K.M.O.; Florentino, E.R.; Buriti, F.C.A. Goat milk as a natural source of bioactive compounds and strategies to enhance the amount of these beneficial components. Int. Dairy J. 2023, 137, 105515. [Google Scholar] [CrossRef]
- Paszczyk, B.; Czarnowska-Kujawska, M.; Klepacka, J.; Tońska, E. Health-Promoting Ingredients in Goat’s Milk and Fermented Goat’s Milk Drinks. Animals 2023, 13, 907. [Google Scholar] [CrossRef] [PubMed]
- Anto, L.; Warykas, S.W.; Torres-Gonzalez, M.; Blesso, C.N. Milk Polar Lipids: Underappreciated Lipids with Emerging Health Benefits. Nutrients 2020, 12, 1001. [Google Scholar] [CrossRef] [PubMed]
- Uzkuç, H.; Sarıtaş, S.; Çelebi Uzkuç, N.M.; Karagül Yüceer, Y.; Esatbeyoglu, T. Comparison of in vitro antioxidant activities of kefir, yogurt, and cheese produced from goat milk. Food Chem. X 2025, 33, 103394. [Google Scholar] [CrossRef] [PubMed]
- Koutis, N.; Liepouris, G.; Moysidou, I.; Vogiatzaki, L.; Shiels, K.; Saha, S.K.; Ofrydopoulou, A.; Tsoupras, A. Fermentation Enhances Antioxidant, Antiplatelet, and Anti-Inflammatory Properties of Oat- and Soy-Derived Dairy Alternatives. Nutrients 2026, 18, 1260. [Google Scholar] [CrossRef] [PubMed]
- Kosidou, S.; Zannas, Z.; Ofrydopoulou, A.; Lambropoulou, D. A.; Tsoupras, A. Psychotropic and neurodegenerative drugs modulate platelet activity via the PAF pathway. Neurochem. Int. 2025, vol. 191, 106073. [Google Scholar] [CrossRef] [PubMed]
- Castro-Gómez, M.P.; Rodriguez-Alcalá, L.M.; Calvo, M.V.; Romero, J.; Mendiola, J.A.; Ibañez, E.; Fontecha, J. Total milk fat extraction and quantification of polar and neutral lipids of cow, goat, and ewe milk by using a pressurized liquid system and chromatographic techniques. J. Dairy Sci. Epub. 2014, 97(11), 6719–28. [Google Scholar] [CrossRef] [PubMed]
- Conboy Stephenson, R.; Ross, R.P.; Stanton, C. Carotenoids in Milk and the Potential for Dairy Based Functional Foods. Foods 2021, 10(6), 1263. [Google Scholar] [CrossRef] [PubMed] [PubMed Central]
- Zeb, A. Phenolic Antioxidants in Dairy Products. In Phenolic Antioxidants in Foods: Chemistry, Biochemistry and Analysis; Springer: Cham, 2021. [Google Scholar] [CrossRef]
- Wen, D.; Chen, H.; Zhu, L.; Chen, Y.; Zang, C.; Li, F. Exploratory Lipidomic Comparison of Neutral and Polar Lipid Profiles Between Mare and Cow Milk Under a Shared Grazing Environment. Agriculture 2026, 16, 1540. [Google Scholar] [CrossRef]
- Żbik, Klara; Pogorzelska-Nowicka, Ewelina; Brodowska-Trębacz, Marta; Górska-Horczyczak, Elżbieta; Kurek, Marcin; Szymańska-Czerwińska, Monika; Zalewska, Magdalena; Wierzbicka, Agnieszka. Potential of milk polar lipids as ingredients for functional dairy products - a review. LWT Vol. 254 2026, 119748. [Google Scholar] [CrossRef]
- Lordan, R.; Tsoupras, A.; Mitra, B.; Zabetakis, I. Dairy Fats and Cardiovascular Disease: Do We Really Need to Be Concerned? Foods 2018, 7, 29. [Google Scholar] [CrossRef] [PubMed]
- Thummajitsakul, S.; Paensanit, P.; Saeieo, T.; Sirirat, J.; Silprasit, K. FTIR and multivariate analysis of total phenolic content, antioxidant and anti-amylase activities of extracts and milk of Glycine max L. and Phaseolus vulgaris L. Electron. J. Biotechnol. 2023, vol. 64, 69–75. [Google Scholar] [CrossRef]
- Biadała; Adzahan, N. M. Storage Stability of Antioxidant in Milk Products Fermented with Selected Kefir Grain Microflora. Molecules 2021, vol. 26(no. 11), 3307. [Google Scholar] [CrossRef] [PubMed]
- Aresta, A.; De Santis, S.; Carocci, A.; Barbarossa, A.; Ragusa, A.; De Vietro, N.; Clodoveo, M.L.; Corbo, F.; Zambonin, C. Determination of Commercial Animal and Vegetable Milks’ Lipid Profile and Its Correlation with Cell Viability and Antioxidant Activity on Human Intestinal Caco-2 Cells. Molecules 2021, 26, 5645. [Google Scholar] [CrossRef] [PubMed]
- Saji, R.; Ramani, A.; Gandhi, K.; Seth, R.; Sharma, R. Application of FTIR spectroscopy in dairy products: A systematic review. Food Humanit. 2024, vol. 2, 100239. [Google Scholar] [CrossRef]
- Simopoulos, A.P. The Importance of the Omega-6/Omega-3 Fatty Acid Ratio in Cardiovascular Disease and Other Chronic Diseases. Exp. Biol. Med. 2008, 233, 674–688. [Google Scholar] [CrossRef] [PubMed]
- Katsanopoulou, M.; Zannas, Z.; Ofrydopoulou, A.; Maria, C.; Krokidis, X.; Lambropoulou, D.A.; Tsoupras, A. Anti-Inflammatory and Antiplatelet Interactions on PAF and ADP Pathways of NSAIDs, Analgesic and Antihypertensive Drugs for Cardioprotection—In Vitro Assessment in Human Platelets. Medicina 2025, 61, 1413. [Google Scholar] [CrossRef] [PubMed]
- Glenn-Davi, K.; Hurley, A.; Brennan, E.; Coughlan, J.; Shiels, K.; Moran, D.; Saha, S.K.; Zabetakis, I.; Tsoupras, A. Fermentation Enhances the Anti-Inflammatory and Anti-Platelet Properties of Both Bovine Dairy and Plant-Derived Dairy Alternatives. Fermentation 2022, 8, 292. [Google Scholar] [CrossRef]
- Ashraf, M.A.; Nookala, V. Biochemistry of Platelet Activating Factor. In StatPearls [Internet]; StatPearls Publishing: Treasure Island (FL), 10 Apr 2023; Available online: https://www.ncbi.nlm.nih.gov/books/NBK557392/.
- Murugappa, S.; Kunapuli, S.P. The role of ADP receptors in platelet function. Front Biosci. 2006, 11, 1977–86. [Google Scholar] [CrossRef] [PubMed]
- Lordan, R.; Vidal, N.P.; Huong Pham, T.; Tsoupras, A.; Thomas, R.H.; Zabetakis, I. Yoghurt fermentation alters the composition and antiplatelet properties of milk polar lipids. Food Chem. 2020, 332, 127384. [Google Scholar] [CrossRef] [PubMed]
- Nunez, D.; Randon, J.; Gandhi, C.; Siafaka-Kapadai, A.; Olson, M.S.; Hanahan, D.J. The inhibition of platelet-activating factor-induced platelet activation by oleic acid is associated with a decrease in polyphosphoinositide metabolism. J. Biol. Chem. 1990. [Google Scholar] [CrossRef]
- Holy, E.W.; Forestier, M.; Richter, E.K.; Akhmedov, A.; Leiber, F.; Camici, G.C.; Mocharla, P.; Lüscher, T.F.; Beer, J.H.; Tanner, F.C. Dietary α-linolenic acid inhibits arterial thrombus formation, tissue factor expression, and platelet activation. Arterioscler. Thromb. Vasc. Biol. 2011, 31, 1772–1780. [Google Scholar] [CrossRef] [PubMed]
- Bazán-Salinas, I.L.; Matías-Pérez, D.; Pérez-Campos, E.; Pérez-Campos Mayoral, L.; García-Montalvo, I.A. Reduction of platelet aggregation from ingestion of oleic and linoleic acids found in Vitis vinifera and Arachis hypogaea Oils. Am. J. Ther. 2016, 23, e1315–e1319. [Google Scholar] [CrossRef] [PubMed]
- Freese, R.; Mutanen, M. Alpha-linolenic acid and marine long-chain n-3 fatty acids differ only slightly in their effects on hemostatic factors in healthy subjects. Am. J. Clin. Nutr. 1997, 66, 591–598. [Google Scholar] [CrossRef] [PubMed]
- Chrysikopoulou, V.; Rampaouni, A.; Koutsia, E.; Ofrydopoulou, A.; Mittas, N.; Tsoupras, A. Anti-Inflammatory, Antithrombotic and Antioxidant Efficacy and Synergy of a High-Dose Vitamin C Supplement Enriched with a Low Dose of Bioflavonoids; In Vitro Assessment and In Vivo Evaluation Through a Clinical Study in Healthy Subjects. Nutrients 2025, 17, 2643. [Google Scholar] [CrossRef] [PubMed]
- Letsiou, S.; Kyratzi, K.; Tsakni, A.; Kranas, D.; Pavlidis, K.; Ofrydopoulou, A.; Halvatsiotis, P.; Houhoula, D.; Tsoupras, A. Rosa rubiginosa L. Extract Rich in Bioactive Phenolics Possess Potent Anti-Inflammatory, Antioxidant, Photoprotective, and Antimicrobial Biofunctional Activities. Chem. Biodivers. 2026, 23(no. 6), e71418. [Google Scholar] [CrossRef] [PubMed]
- Tsiapali, O.I.; Kontaxi, N.-I.; Pavlidis, K.; Ofrydopoulou, A.; Prokopiou, V.; Letsiou, S.; Kosheleva, R.I.; Mitropoulos, A.; Tsoupras, A. Anti-Inflammatory and Antioxidant Properties of Anti-UV Creams Enriched with Natural Extracts from Avocado, Apple, and Kiwi By-Products, with and Without Nanobubbles. Cosmetics 2025, 12, 231. [Google Scholar] [CrossRef]
- Kun, Y.; Ssonko Lule, U.; Xiao-Lin, D. Lycopene: Its Properties and Relationship to Human Health. Food Rev. Int. 2006, vol. 22(no. 4), 309–333. [Google Scholar] [CrossRef]
- Balestrieri, M.L.; De Prisco, R.; Nicolaus, B.; Pari, P.; Schiano Moriello, V.; Strazzullo, G.; Iorio, E.L.; Servillo, L.; Balestrieri, C. Lycopene in association with α-tocopherol or tomato lipophilic extracts enhances acyl-platelet-activating factor biosynthesis in endothelial cells during oxidative stress. Free Radic. Biol. Med. 2004, Volume 36(Issue 8), 1058–1067. [Google Scholar] [CrossRef] [PubMed]
- Shoshan, V.; MacLennan, D. H. Quercetin interaction with the (Ca2+ + Mg2+)-ATPase of sarcoplasmic reticulum. J. Biol. Chem. 1981, vol. 256(no. 2), 887–892. [Google Scholar] [CrossRef]
- Pereira, da S.; et al. Effect of gallic acid on purinergic signaling in lymphocytes, platelets, and serum of diabetic rats. Biomed. Pharmacother. 2018, vol. 101, 30–36. [Google Scholar] [CrossRef] [PubMed]
- Xu, H.; et al. Inhibitory effects of luteolin-4’-O-β-D-glucopyranoside on P2Y12 and thromboxane A2 receptor-mediated amplification of platelet activation in vitro. Int. J. Mol. Med. 2018, vol. 42(no. 1), 615–624. [Google Scholar] [CrossRef] [PubMed]
- Sadewi, S. M.; Nurhasanah, N.; Sudibyo, S.; Windayani, N.; Kiswandono, A. A.; Satria, H. Antioxidant and Antibacterial Activities of Curd and Whey Kefir Produced from Etawa Goat Milk. J. Multidiscip. Appl. Nat. Sci. 2023, vol. 4(no. 1), 139–145. [Google Scholar] [CrossRef]
Figure 1.
Anti-inflammatory effects of the TAC and TLC fractions from Goat Milk and its Yogurt-style Kefir product against the PAF pathway. Results are expressed as the IC50 value for each sample (compound/extract/fraction), which equals to the mass in μg of the sample that when present in the aggregometer cuvette with the 250 μL of hPRP, it can cause 50% of inhibition of the PAF-induced inflammatory activation and aggregation of hPRP (The lower the IC50 value the more potent the anti-inflammatory activity for an extract). *Denotes statistically significant difference, according to ANOVA assessment, of the more potent anti-inflammatory activity against PAF (lower IC50 values) of the TAC fractions compared to those of the TLC fractions (p < 0.05 in this comparison according to the ANOVA test assessment in n=6 blood samples from different donors). **Denotes statistically significant difference, according to ANOVA assessment, of the more potent anti-inflammatory activity against PAF (lower IC50 values) of the TAC fraction from the Yogurt style Kefir product derived from goat milk compared to those of the TAC fraction from the Goat Milk (p < 0.05 in this comparison according to the ANOVA test assessment in n=6 blood samples from different donors). Abbreviations: TAC = the fraction with the total amphiphilic compounds; TLC = the fraction with the total lipophilic compounds; hPRP = human plasma rich platelets; IC50 value = half maximum inhibitory concentration.
Figure 1.
Anti-inflammatory effects of the TAC and TLC fractions from Goat Milk and its Yogurt-style Kefir product against the PAF pathway. Results are expressed as the IC50 value for each sample (compound/extract/fraction), which equals to the mass in μg of the sample that when present in the aggregometer cuvette with the 250 μL of hPRP, it can cause 50% of inhibition of the PAF-induced inflammatory activation and aggregation of hPRP (The lower the IC50 value the more potent the anti-inflammatory activity for an extract). *Denotes statistically significant difference, according to ANOVA assessment, of the more potent anti-inflammatory activity against PAF (lower IC50 values) of the TAC fractions compared to those of the TLC fractions (p < 0.05 in this comparison according to the ANOVA test assessment in n=6 blood samples from different donors). **Denotes statistically significant difference, according to ANOVA assessment, of the more potent anti-inflammatory activity against PAF (lower IC50 values) of the TAC fraction from the Yogurt style Kefir product derived from goat milk compared to those of the TAC fraction from the Goat Milk (p < 0.05 in this comparison according to the ANOVA test assessment in n=6 blood samples from different donors). Abbreviations: TAC = the fraction with the total amphiphilic compounds; TLC = the fraction with the total lipophilic compounds; hPRP = human plasma rich platelets; IC50 value = half maximum inhibitory concentration.
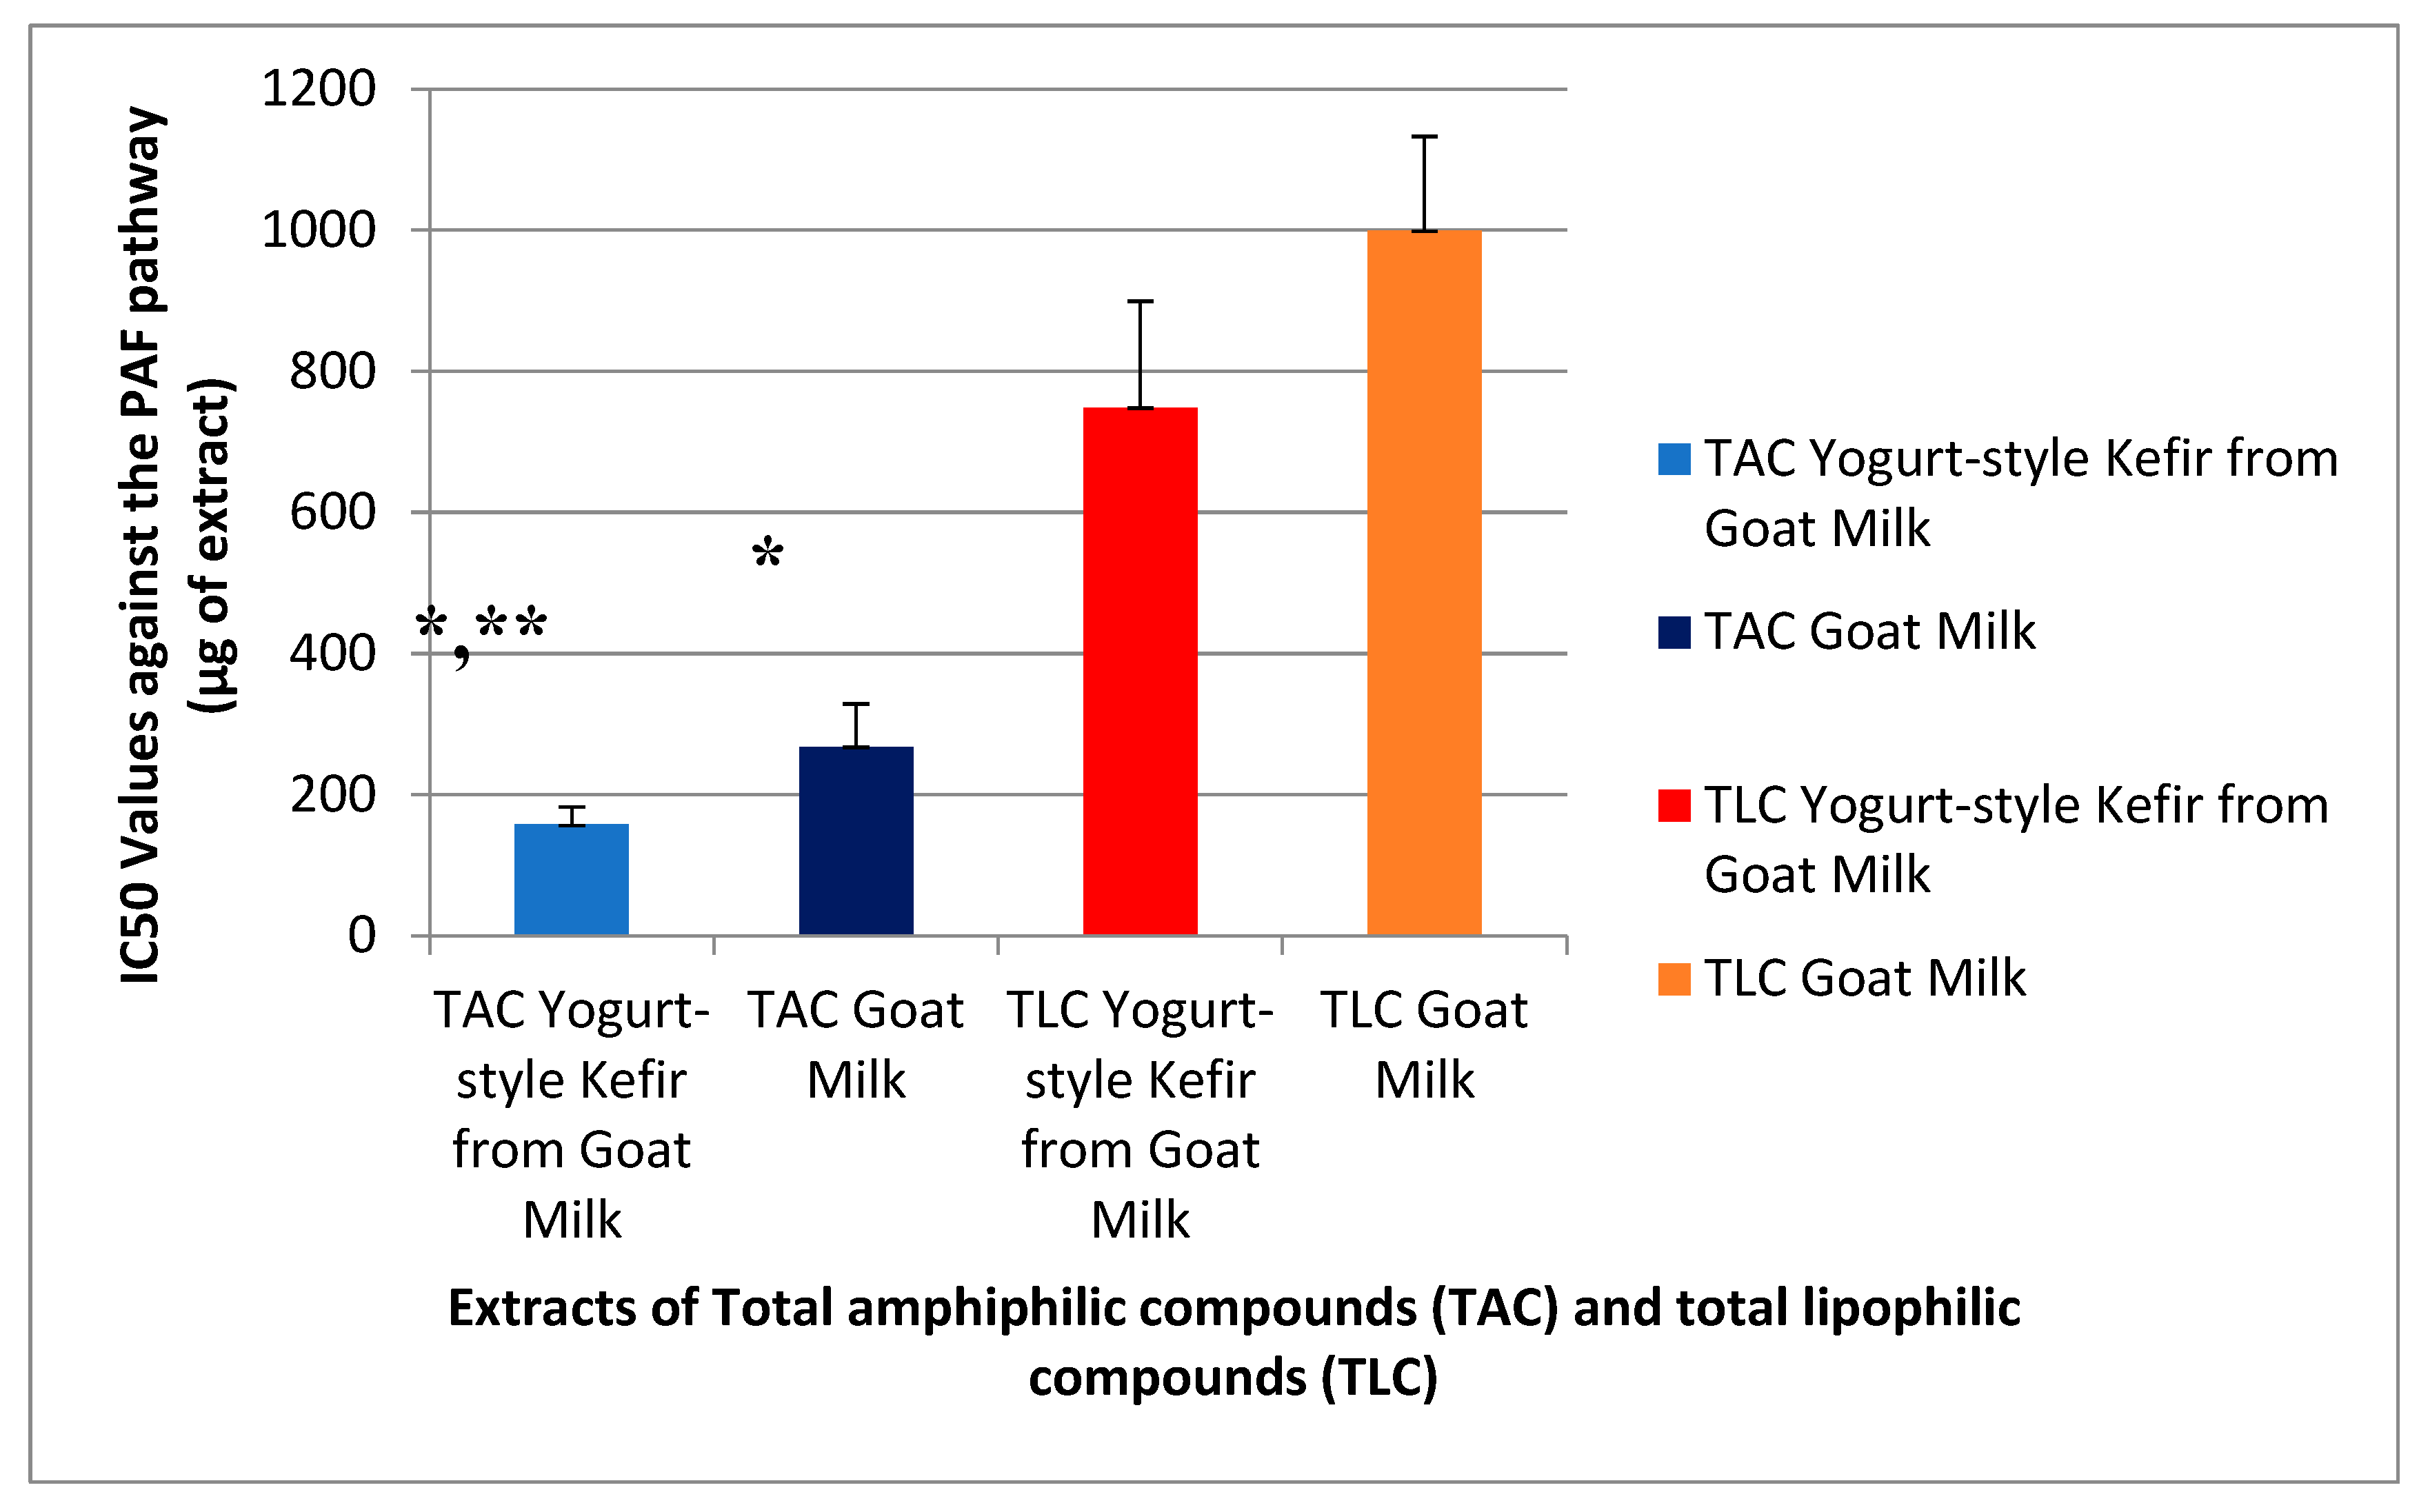
Figure 2.
Anti-platelet effects of the TAC and TLC fractions from Goat Milk and its Yogurt-style Kefir product against the ADP pathway. Results are expressed as the IC50 value for each sample (compound/extract/fraction), which equals to the mass in μg of the sample that when present in the aggregometer cuvette with the 250 μL of hPRP, it can cause 50% of inhibition of the ADP-induced platelet aggregation of hPRP (The lower the IC50 value the more potent the antiplatelet activity for an extract). *Denotes statistically significant difference, according to ANOVA assessment, of the more potent antiplatelet activity against ADP (lower IC50 values) of the TAC fractions compared to those of the TLC fractions (p < 0.05 in this comparison according to the ANOVA test assessment in n=6 blood samples from different donors). Abbreviations: TAC = the fraction with the total amphiphilic compounds; TLC = the fraction with the total lipophilic compounds; hPRP = human plasma rich platelets; IC50 value = half maximum inhibitory concentration.
Figure 2.
Anti-platelet effects of the TAC and TLC fractions from Goat Milk and its Yogurt-style Kefir product against the ADP pathway. Results are expressed as the IC50 value for each sample (compound/extract/fraction), which equals to the mass in μg of the sample that when present in the aggregometer cuvette with the 250 μL of hPRP, it can cause 50% of inhibition of the ADP-induced platelet aggregation of hPRP (The lower the IC50 value the more potent the antiplatelet activity for an extract). *Denotes statistically significant difference, according to ANOVA assessment, of the more potent antiplatelet activity against ADP (lower IC50 values) of the TAC fractions compared to those of the TLC fractions (p < 0.05 in this comparison according to the ANOVA test assessment in n=6 blood samples from different donors). Abbreviations: TAC = the fraction with the total amphiphilic compounds; TLC = the fraction with the total lipophilic compounds; hPRP = human plasma rich platelets; IC50 value = half maximum inhibitory concentration.
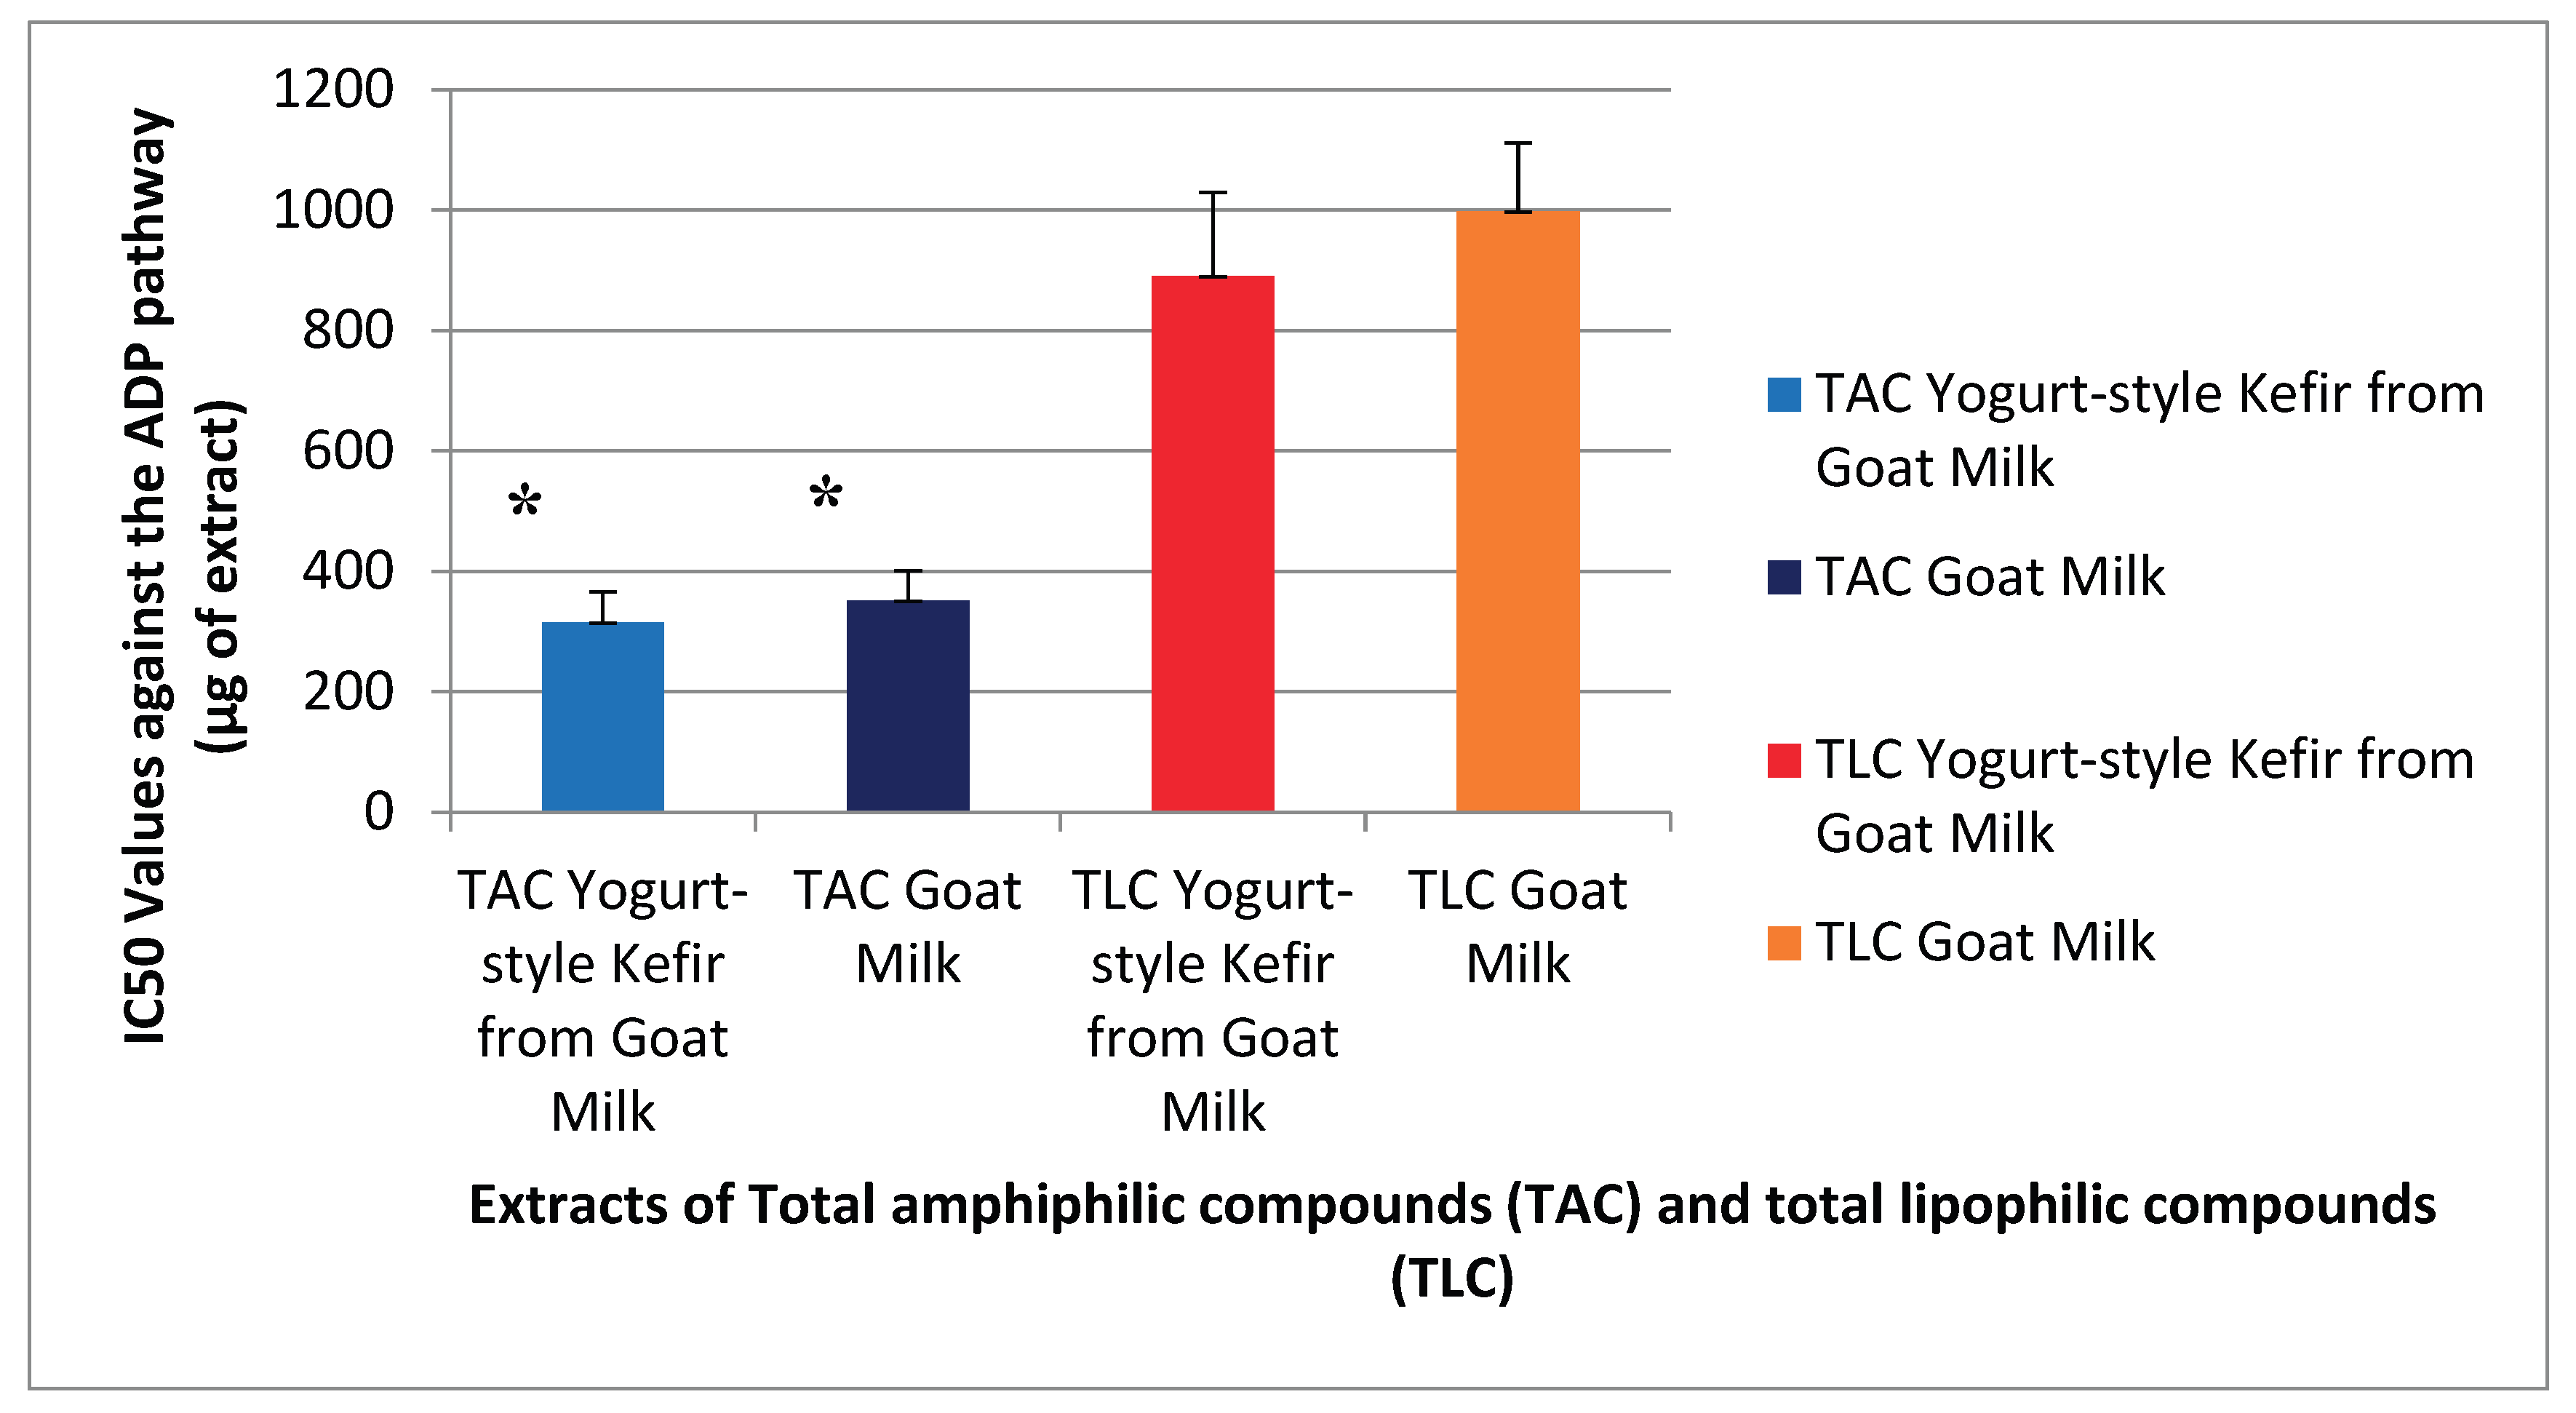

Table 1.
Total carotenoid content of TAC, TLC, and TL extracts from goat milk and its kafir-based yogurt fermented product. Results are expressed as mg of β-carotene equivalent (CE) per g of DW of the extract.
Table 1.
Total carotenoid content of TAC, TLC, and TL extracts from goat milk and its kafir-based yogurt fermented product. Results are expressed as mg of β-carotene equivalent (CE) per g of DW of the extract.
| Milk | Yogurt | ||||
|---|---|---|---|---|---|
| TCC of TAC | TCC of TLC | TCC of TL | TCC of TAC | TCC of TLC | TCC of TL |
| Median | Median | Median | Median | Median | Median |
| 3.14 | 0.15 | 3.29 | 0.87 | 0.84 | 1.71 |
| Max | Max | Max | Max | Max | Max |
| 7.06 | 0.20 | 7.26 | 2.21 | 1.07 | 3.28 |
| Min | Min | Min | Min | Min | Min |
| 1.88 | 0.08 | 1.96 | 0.55 | 0.63 | 1.18 |
TCC = total carotenoid content, TAC = total amphiphilic compounds, TLC = total lipophilic compounds, TL = total lipids, DW = dry weight.
Table 2.
Total Phenolic Content (TPC) of TAC, TLC, and TL extracts from Kefir milk and yogurt (results are expressed as mg of gallic acid equivalent (GAE) per g of DW of the extract).
Table 2.
Total Phenolic Content (TPC) of TAC, TLC, and TL extracts from Kefir milk and yogurt (results are expressed as mg of gallic acid equivalent (GAE) per g of DW of the extract).
| Milk | Yogurt | ||||
|---|---|---|---|---|---|
| TPC of TAC | TPC of TLC | TPC of TL | TPC of TAC | TPC of TLC | TPC of TL |
| Median | Median | Median | Median | Median | Median |
| - | 0.17 | 0.17 | - | 0.37 | 0.37 |
| Max | Max | Max | Max | Max | Max |
| - | 0.20 | 0.20 | - | 0.48 | 0.48 |
| Min | Min | Min | Min | Min | Min |
| - | 0.10 | 0.10 | - | 0.27 | 0.27 |
TAC = total amphiphilic compounds, TLC = total lipophilic compounds, TL = total lipids, DW = dry weight.
Table 3.
Antioxidant capacity (ABTS values) of milk Kefir and yogurt Kefir. Results are expressed as µmol of Trolox Equivalent (TE)/g DW.
Table 3.
Antioxidant capacity (ABTS values) of milk Kefir and yogurt Kefir. Results are expressed as µmol of Trolox Equivalent (TE)/g DW.
| ABTS Values | |||
|---|---|---|---|
| Milk | Median | Max | Min |
| TAC | 1,94 | 3,74 | 0,41 |
| TLC | 0,09 | 0,10 | 0,09 |
| TL | 2,03 | 3,84 | 0,50 |
| Yogurt | Median | Max | Min |
| TAC | 1,74 | 2,19 | 0,56 |
| TLC | 0,13 | 0,15 | 0,07 |
| TL | 1,87 | 2,34 | 0,63 |
TAC = total amphiphilic compounds, TLC = total lipophilic compounds, TL = total lipids, DW = dry weight.
Table 4.
Antioxidant capacity of goat milk and yogurt Kefir. Results are expressed as DPPH-based Trolox Equivalent antioxidant capacity (TEAC) values.
Table 4.
Antioxidant capacity of goat milk and yogurt Kefir. Results are expressed as DPPH-based Trolox Equivalent antioxidant capacity (TEAC) values.
| TEAC Values | |||
|---|---|---|---|
| Milk | Median | Max | Min |
| TAC | 0.62 | 0.90 | 0.26 |
| TLC | 0.02 | 0.02 | 0.01 |
| TL | 0.63 | 0.92 | 0.27 |
| Yogurt | Median | Max | Min |
| TAC | 0.39 | 5.34 | 0.22 |
| TLC | 0.02 | 0.02 | 0.02 |
| TL | 0.42 | 5.36 | 0.23 |
TAC = total amphiphilic compounds, TLC = total lipophilic compounds, TL = total lipids.
Table 5.
Characteristic peaks of goat Kefir (milk and yoghurt) sample in ATR-FTIR and their chemical interpretation in relation to phenolic compounds, carotenoids and protein/peptide structures.
Table 5.
Characteristic peaks of goat Kefir (milk and yoghurt) sample in ATR-FTIR and their chemical interpretation in relation to phenolic compounds, carotenoids and protein/peptide structures.
| Region (cm−1) | Peaks | Characteristic Bonds | Bioactive Components of goat milk Kefir |
|---|---|---|---|
| 3600-3200 | ~3350 | Stretching O-H | Phenolic compounds, alcohols, carbohydrates, peptides, hydrophilic bonds |
| 3000-2850 | ~ | Stretching C-H (-CH2, -CH3) | Alkyl chain, fatty acids, phospholipids, triglycerides |
| 1750-1730 | ~ | C=O of ester groups | Estered fatty acids |
| 1720-1700 | ~ | C=O of carboxyl acids | Free fatty acids, phenolic acids |
| 1680-1630 | ~ | C=O, C=C of proteins | Amide I band (e.g carotenoids) |
| 1560-1515 | ~ | N-H bending, C-N stretching | Amide II band from milk peptides |
| 1610-1500 | ~ | Stretching C=C aromatic ring | Indicative of phenolic and flavonoid structures |
| 1470-1450 | ~ | Bending CH2/CH3 | Alkyl chains of fatty acids |
| 1420-1390 | ~ | Symmetrical stretching COO-/bending CH2 | Organic acids, fatty acids |
| 1260-1220 | ~ | P=O, P-O-C (phosphodiesters) | Polar lipids, phospholipids |
| 1200-1100 | ~ | C-O-C, C-O bending | Esters, alcohols, glycolipids, phospholipids |
| 1100-1000 | ~ | C-O, C-O-P, glycosidic bonds | Unsaturated fatty acids |
| 970-600 | ~ | C-H fingerprint region | Phenolics, lipids, proteins, carbohydrates |
Table 6.
Fatty acids obtained after saponification (PL fraction) of TAC extracts.
| Fatty Acid | Empirical Formula | mTAC2(L) – Milk (Mean ± SD) | yTAC2(L) – Yogurt (Mean ± SD) |
|---|---|---|---|
| Caprylic | C8:0 | ND | 0.06 ± 0.004 |
| Pelargonic | C9:0 | 0.04 ± 0.00 | 0.15 ± 0.013 |
| Capric | C10:0 | ND | ND |
| Lauric | C12:0 | 0.06 ± 0.01 | ND |
| Tridecylic | C13:0 | ND | 0.02 ± 0.002 |
| Myristic | C14:0 | 0.33 ± 0.03 | 0.40 ± 0.041 |
| Pentadecylic | C15:0 | 0.11 ± 0.02 | ND |
| Palmitic | C16:0 | 18.12 ± 0.14 | 23.00 ± 2.097 |
| Palmitoleic | C16:1 n7 | 1.46 ± 0.03 | 0.64 ± 0.075 |
| Margaric | C17:0 | 0.45 ± 0.02 | 0.86 ± 0.136 |
| Stearic | C18:0 | 10.20 ± 0.14 | 20.21 ± 2.065 |
| Oleic | C18:1 n9 | 30.00 ± 0.03 | 19.44 ± 0.525 |
| Linoleic | C18:2 n6 | ND | ND |
| a-Linoleic | C18:3 n3 | ND | ND |
| SFA | 96,41 ± 0,08 | 96,47 ± 0,08 | |
| UFA | 3,59 ± 0,08 |
3,53 ± 0,08 |
|
| MUFA | 3,21 ± 0,08 | 3,21 ± 0,08 | |
| PUFA | 0,39 ± 0,00 | 0,39 ± 0,01 | |
| n6PUFA | 0,23 ± 0,00 | 0,23 ± 0,01 | |
| n3 PUFA | 0,16 ± 0,00 | 0,16 ± 0,00 | |
| n6/n3 | 1,47 ± 0,04 | 1,49 ± 0,04 |
Table 7.
Free Fatty Acids (FFA) content obtained without saponification of TAC extracts (non-saponified fraction).
Table 7.
Free Fatty Acids (FFA) content obtained without saponification of TAC extracts (non-saponified fraction).
| Fatty Acids | Empirical Formula | mTAC2(L) – (Mean ± SD) | yTAC2(L) – (Mean ± SD) |
|---|---|---|---|
| Caprylic | C8:0 | 0.98 ± 0.01 | 1.01 ± 0.02 |
| Pelargonic | C9:0 | 0.07 ± 0.01 | 0.07 ± 0.01 |
| Capric | C10:0 | 1.27 ± 0.01 | 1.29 ± 0.03 |
| Undecylic | C11:0 | 0.02 ± 0.00 | 0.02 ± 0.00 |
| Lauric | C12:0 | 5.13 ± 0.04 | 5.13 ± 0.03 |
| Tridecylic | C13:0 | 0.04 ± 0.01 | 0.04 ± 0.01 |
| Myristic | C14:0 | 1.87 ± 0.03 | 1.84 ± 0.03 |
| Pentadecylic | C15:0 | 0.39 ± 0.01 | 0.37 ± 0.01 |
| Palmitic | C16:0 | 33.73 ± 0.24 | 33.79 ± 0.07 |
| Palmitoleic | C16:1 n7 | 0.28 ± 0.01 | 0.23 ± 0.00 |
| Margaric | C17:0 | 1.06 ± 0.02 | 1.01 ± 0.02 |
| Stearic | C18:0 | 51.05 ± 0.21 | 51.11 ± 0.26 |
| Oleic | C18:1 n9 | 2.92 ± 0.08 | 2.91 ± 0.07 |
| Linoleic | C18:2 n6 | 0.23 ± 0.00 | 0.23 ± 0.01 |
| Linolenic (α+γ) | C18:3 n3 | 0.16 ± 0.00 | 0.16 ± 0.00 |
| Nonadecylic | C19:0 | 0.06 ± 0.00 | 0.05 ± 0.00 |
| Arachidic | C20:0 | 0.74 ± 0.02 | 0.78 ± 0.01 |
|
SFA UFA |
77,44 ± 0,02 23,30 ± 0,01 |
80,22 ± 1,10 20,57 ± 1,06 |
|
| MUFA | 10,41 ± 0,05 | 9,24 ± 0,36 | |
| PUFA | 12,89 ± 0,05 | 11,33 ± 0,70 | |
| n6 PUFA | 1,61 ± 0,08 | 1,39 ± 0,06 | |
| n3 PUFA | 11,28 ± 0,05 | 9,94 ± 0,64 | |
| n6/n3 | 0,14 ± 0,01 | 0,14 ± 0,00 |
Disclaimer/Publisher’s Note: The statements, opinions and data contained in all publications are solely those of the individual author(s) and contributor(s) and not of MDPI and/or the editor(s). MDPI and/or the editor(s) disclaim responsibility for any injury to people or property resulting from any ideas, methods, instructions or products referred to in the content. |
© 2026 by the authors. Licensee MDPI, Basel, Switzerland. This article is an open access article distributed under the terms and conditions of the Creative Commons Attribution (CC BY) license (http://creativecommons.org/licenses/by/4.0/).
Copyright: This open access article is published under a Creative Commons CC BY 4.0 license, which permit the free download, distribution, and reuse, provided that the author and preprint are cited in any reuse.


