
Submitted:
01 August 2026
Posted:
04 August 2026
You are already at the latest version
Abstract
The rate of change of the total electron content index (ROTI) is a widely used proxy for phase fluctuations associated with ionospheric irregularities derived from GNSS total electron content measurements. This study investigates the longitudinal day-to-day variability of ionospheric irregularities over the African Equatorial Ionization Anomaly (EIA) region during 2014 using ROTI from six GNSS stations at low latitudes. Day-to-day variability is quantified through differences between consecutive daily ROTI values (ΔROTI), relative ROTI (RROTI), correlation coefficients, daily deviations from climatology, and variability magnitude. The results reveal clear longitudinal day-to-day variability between East and West African sectors, with larger variability in West Africa. Diurnal ROTI peaks reach about 2 TECU/min in East Africa and about 3 TECU/min in West Africa. Correlation coefficients within the same longitude sector range from 0.678 to 0.848, whereas cross-sector correlations range from 0.476 to 0.689. ΔROTI and RROTI indicate that day-to-day variability is driven mainly by short-period lower-atmospheric forcing rather than slow solar forcing. Relative variations range from about -70% to +150%, with predominantly negative values during solstices and positive values during equinoxes.
Keywords:
ROTI
; ionospheric irregularities
; equatorial ionization anomaly
; GNSS
; African low latitudes
1. Introduction
The low-latitude ionosphere is a highly dynamic plasma environment characterized by the Equatorial Ionization Anomaly (EIA), which exhibits enhanced electron density north and south of the geomagnetic equator at approximately ±20° geomagnetic latitude. This region is strongly variable and frequently affected by ionospheric irregularities [1] that degrade space-based systems by producing phase and amplitude fluctuations and sometimes loss of lock in GNSS receiver tracking. ROTI, derived from GNSS total electron content [2] is one of the most widely used proxies for monitoring the occurrence and intensity of such irregularities. It also correlates well with radio scintillation [3] and therefore provides an efficient basis for regional and temporal studies of irregularity behavior.
Previous studies have used ROTI to investigate ionospheric irregularities in several regions, including Africa, South America, and Asia [4,5,6,7,8,9,10,11,12,13,14,15,16]. These works show that irregularities are most common around the geomagnetic equator, usually after sunset, and that their occurrence depends strongly on longitude and local time. However, relatively few studies have focused specifically on the longitudinal day-to-day variability of ROTI over the African EIA region. The present work addresses that gap by examining daily variability in ROTI during 2014 using six GNSS stations distributed across eastern and western sectors of equatorial Africa.
2. Materials and Methods
2.1. Data Set and Stations
Calibrated TEC data from six GNSS receiver stations in equatorial Africa were obtained from the Abdus Salam International Centre for Theoretical Physics archive. The selected stations represent two longitude sectors: East Africa (MBAR, MOIU, MAL2) and West Africa (YKRO, BJCO, NKLG). Their geographic, geomagnetic, and MODIP coordinates are provided in Table 1, and their distribution relative to the magnetic equator and EIA region is illustrated in Figure 1.
2.2. ROTI Computation
ROTI is derived from slant total electron content using 30-second GNSS observations and a 5-minute sliding window, with an elevation mask of at least 30° to reduce multipath effects [2]. The rate of TEC (ROT) is computed from consecutive slant TEC values. The measurement of ionospheric fluctuations by calculating the rate of TEC (ROT) is defined as follows:
Where i is the visible satellite, k is the epoch time in TECU units, t is the time and STEC is the slant total electron content.
ROTI is defined as the standard deviation of ROT over the selected time interval, as shown in Equation 2:
Where the parentheses <> around ROT denote the mean value. ROT measurements indicate small-scale variations at the peak of the STEC index. This approach captures short-scale TEC fluctuations while minimizing phase bias effects.
2.3. Day-to-Day Variability Metrics
To quantify day-to-day variability, four complementary metrics are used. First, the difference between two consecutive daily ROTI values is calculated as ΔROTI, which isolates short-term changes from slow seasonal variability. The ∆ROTI evaluates the forward first-order difference of the ROTI from one day to the next day. The dynamic interpretation of the ∆ROTI formula is presented as follows in equation 3.
Where x is the current Day of Year (DOY) and x+1 represents the next consecutive day in the yearly dataset.
∆ROTI = ROTI(x+1) - ROTI(x)
Second, relative ROTI (RROTI) expresses the daily variation as a percentage of the annual mean, allowing inter-station comparison despite differences in absolute ROTI magnitude. The dynamic interpretation of the RROTI formula is indicated in Equation 4 below:
Where ROTIdaily is the value of ROTI in each DOY in a yearly dataset and ROTImean presents the yearly mean values of ROTI.
Third, a 27 day moving average is used as a climatological background (ROTIClim), and daily deviations from that background are computed to isolate short-term departures. ROTIClim is defined as the 27 day window moving average corresponding to the solar rotation period as presented in Equation 5:
Where ROTIClim is the daily deviation climatology, x is the DOY in the dataset, ROTI(x) is the ROTI value on day x and the is the climatology calculated ROTI values over 27-day window on day x.
Fourth, a 30 day moving standard deviation (σ) is used to characterize the magnitude of the variability around the detrended series. Variability magnitude (σ) was computed over a 30-day moving daily deviation as illustrated in Equation 6 below:
Where σ(x) is the variability magnitude of the standard deviation for a day x, N is the number of the data within the moving window, x is the DOY, N-1 is the Bessel’s correction used to provide an unbiased calculation of the sample standard deviation, ROTIClim (j) is the daily deviation detrended for each day j in that window, is the mean of the deviations within the 30-day window, the j = x-14 and x+15 is a 30-day window summation running from 14 days before to 15 days after a day x.
2.4. Correlation and Periodicity Analysis
Pearson correlation coefficients between station pairs are used to assess the spatial coherence of daily ROTI variability within and across longitude sectors. In addition, continuous wavelet transform analysis is applied to identify characteristic periodicities in the daily ROTI series over periods from 4 to 32 days.
3. Results
3.1. Diurnal Longitudinal Variations
ROTI remains close to background levels during daytime and increases after sunset at all stations (Figure 2). The strongest irregularity activity occurs between about 19:00 and 23:00 local time, then gradually weakens after midnight. This diurnal behavior is consistent with post-sunset enhancement of the vertical drift and the associated growth of plasma instabilities.
A clear longitudinal contrast is observed. In East Africa, peak ROTI values are generally around 2 TECU/min and remain concentrated before midnight. In West Africa, values are larger overall, with NKLG reaching about 3 TECU/min and preserving strong irregularity activity beyond midnight. This difference is consistent with the lower magnetic field strength in the western sector and with the position of NKLG near the southern EIA crest, where higher background electron density amplifies TEC fluctuations.
3.2. Day-to-Day Longitudinal Variability
Daily ROTI time series show abrupt changes between consecutive days, particularly during the equinoctial periods, rather than smooth seasonal transitions (Figure 3). This confirms the presence of strong day-to-day variability in both African sectors. The effect is more pronounced in West Africa, especially at NKLG, where the amplitude of the daily ROTI series is nearly double that observed at the other stations.
Pearson correlation analysis confirms that daily variability is more coherent within each longitude sector than across sectors (Figure 4). Correlation coefficients within East Africa range from 0.810 to 0.841, while those within West Africa range from 0.678 to 0.848. By contrast, cross-sector correlations are weaker, ranging from 0.476 to 0.689. These results show that the day-to-day variability of ROTI is strongly localized in longitude and likely controlled by regional electrodynamics and localized atmospheric forcing.
3.3. ΔROTI and RROTI Behavior
The ΔROTI series highlights rapid day-to-day transitions in irregularity activity (Figure 5). Positive values indicate abrupt increases from one day to the next, whereas negative values indicate sudden decreases after an active day. The largest oscillations occur during equinoxes, when the instability threshold appears to switch on and off rapidly over consecutive days. During solstices, ΔROTI is generally close to zero, indicating a more stable day-to-day ionospheric state.
RROTI removes the bias introduced by different absolute ROTI magnitudes and reveals relative changes between about -70% and +150% (Figure 6). Negative values are most common during solstices, while equinoctial months show the strongest positive excursions. East African stations reach relative peaks up to +150%, while West African stations typically range up to about +120%. These oscillations confirm that equinoctial irregularity growth is highly sensitive to daily variations in background electrodynamics and atmospheric forcing.
Figure 7 shows the detailed representation of the plasma irregularity day-to-day longitudinal variability of time series. In the left column (Figures 7a-7f), the blue dots present raw daily ROTI values, and the red curved line presents the 27-day running mean climatology, which highlights the slow-moving seasonal trends. While the right column (Figures 7g - 7l) shows the isolated daily deviation climatology (ROTIClim) indicated by the blue line, the red line plotted alongside the climatology running presents the variability magnitude (σ). The variability magnitude (σ) captures the true and high-frequency day-to-day variability from the 30-day window. Figure 7 (left panel) is very important for strengthening the scientific evidence for day-to-day variability of ROTI by separating the seasonal climatology from the short-term variability of plasma irregularity. During equinoxes, the 27-day running mean climatology filters out short-term variability by leaving a clear semiannual pattern maximum. The terminator alignment and seasonal variations in solar zenith angle are the drivers of this smooth baseline climatology [30]. The daily deviation (right panel) also shows the 30-day running mean climatology filters out short-term variability by leaving a clear semi-annual pattern of peaks.
In the East African sector stations of MBAR, MOIU and MAL2 during active periods, the daily deviation and its running variability magnitude (Figures 7g-7i) are highly limited and stay below 0.05 TECU/min. While in West African sector stations, particularly at NKLG (Figure 7l), the daily deviation shows substantially more variability. Its running variability magnitude frequently exceeds 0.05 TECU/min and can reach 0.1 TECU/min. This shows that there are clear longitudinal day-to-day variations across the East and West African sector, as in Figure 7.
3.4. Seasonal Variability
Seasonal mean ROTI and the standard deviation of day-to-day variability both peak during the September equinox, followed by the March equinox, with minima during the June and December solstices (Figure 8). This pattern is consistent with the known seasonal maximization of equatorial plasma irregularities during equinoxes.
A marked longitudinal difference is also present in the seasonal statistics. With the exception of YKRO during the June solstice, the western sector generally exhibits larger seasonal variability than the eastern sector (Figure 8). NKLG consistently shows the highest seasonal means and variability levels. These differences can be explained by longitudinal changes in geomagnetic declination, local magnetic meridian geometry, and alignment with the solar terminator, all of which affect pre-reversal enhancement and instability growth conditions.
3.5. Periodicity of Day-to-Day Variations
Wavelet analysis (Figure 9) identifies recurrent periodicities in the daily ROTI time series, mainly in the 4-8 day, 10-16 day, and 27 day bands. These periodic components are strongest during the equinoctial months, when background ionospheric conditions are favorable for instability growth.
The shorter periodicities are consistent with planetary-wave and tide-related forcing originating in the lower atmosphere and propagating upward into the ionospheric dynamo region. The 27 day component is associated with solar rotation. Together, these periodicities indicate that day-to-day ROTI variability results from the combined influence of lower-atmospheric wave coupling, seasonal instability conditions, and recurrent solar forcing.
4. Discussion
The results demonstrate that day-to-day ROTI variability over equatorial Africa cannot be explained by a spatially uniform forcing mechanism. If slow solar forcing were dominant, similar day-to-day changes would be expected at all longitudes. Instead, the stronger variability in West Africa, the reduced cross-sector correlations, and the larger amplitude at NKLG support a model in which localized electrodynamics, geomagnetic field geometry, and atmospheric wave seeding control daily irregularity development.
The higher variability in the western sector is consistent with weaker geomagnetic field strength and stronger effective vertical plasma drift, while the exceptional activity at NKLG reflects its position near the EIA crest, where enhanced background density increases the response of ROTI to fluctuations. The combined evidence from ΔROTI, RROTI, climatological deviation, and wavelet analysis further suggests that short-period atmospheric forcing is more important than slow global solar forcing in shaping daily irregularity changes.
These findings are important for understanding the forecasting limits of equatorial irregularities over Africa. A climatological expectation alone is insufficient to capture the strong day-to-day changes observed here, especially during equinoxes. Regional monitoring and models that incorporate atmospheric wave coupling and longitudinal electrodynamic differences are therefore essential for improved prediction of GNSS signal degradation in the African EIA region.
5. Conclusions
This study investigated the longitudinal day-to-day variability of ionospheric irregularities over the African EIA region during 2014 using ROTI derived from six GNSS stations. The analysis shows clear east-west differences in both absolute ROTI and short-term variability. West Africa exhibits stronger and more persistent irregularity activity than East Africa, with NKLG showing the largest amplitudes and variability.
Within-sector station pairs show stronger daily correlation than cross-sector pairs, confirming that ROTI variability is strongly localized in longitude. ΔROTI, RROTI, daily deviation, and wavelet analyses all indicate that the dominant drivers of day-to-day irregularity variability are short-period atmospheric and electrodynamic processes rather than slow solar background forcing. Seasonal maxima occur during equinoxes, and the main periodic bands are found at 4-8 days, 10-16 days, and 27 days.
Overall, the results highlight the importance of longitudinal structure and short-term atmospheric forcing in shaping ionospheric irregularities over equatorial Africa. These findings are relevant for regional space-weather characterization and for improving GNSS reliability assessments in low-latitude African sectors.
Author Contributions
Conceptualization, L.E. and S.M.R.; methodology, L.E. and S.M.R.; formal analysis, L.E.; investigation, L.E.; writing—original draft preparation, L.E.; writing—review and editing, L.E. and S.M.R.; supervision, S.M.R.
Funding
This research received no external funding sources from any individuals or organizations.
Institutional Review Board Statement
Not applicable.
Informed Consent Statement
Not applicable.
Data Availability Statement
The TEC data used in this study were obtained from the ICTP calibrated TEC archive available at https://arplsrv.ictp.it.
Acknowledgments
The authors would like to thank the ICTP for allowing access to the GNSS data sources.
Conflicts of Interest
The authors declare no conflict of interest.
References
- Balan, N.; Souza, J.; Bailey, G.J. Recent developments in the understanding of equatorial ionization anomaly: A review. J. Atmos. Sol.-Terr. Phys. 2018, 171, 3–11. [Google Scholar] [CrossRef]
- Pi, X.; Mannucci, A.J.; Lindqwister, U.J.; Ho, C. Monitoring of global ionospheric irregularities using the worldwide GPS network. Geophys. Res. Lett. 1997, 24, 2283–2286. [Google Scholar] [CrossRef]
- Basu, S.; Groves, K.M.; Quinn, J.M.; Doherty, P. A comparison of TEC fluctuation and scintillation at Ascension Island. J. Atmos. Sol.-Terr. Phys. 1999, 61, 1219–1226. [Google Scholar] [CrossRef]
- Oladipo, O.A.; Schuler, T. Equatorial ionospheric irregularities using GPS TEC derived index. Ann. Geophys. 2013, 56, A0565. [Google Scholar] [CrossRef]
- Mungufeni, P.; Habarulema, J.B.; Jurua, E. Trends of ionospheric irregularities over African low latitude region during quiet geomagnetic conditions. J. Atmos. Sol.-Terr. Phys. 2016, 138-139, 261–267. [Google Scholar] [CrossRef]
- Cherniak, I.; Krankowski, A.; Zakharenkova, I. ROTI maps: A new IGS ionospheric product characterizing the ionospheric irregularities occurrence. GPS Solut. 2018, 22, 69. [Google Scholar] [CrossRef]
- Abe, O.E.; Rabiu, A.B.; Radicella, S.M. Longitudinal asymmetry of the occurrence of plasma irregularities ove African low-latitude region. Pure Appl. Geophys. 2018, 175, 4355–4370. [Google Scholar] [CrossRef]
- Li, J.; Ma, G.; Hocke, K.; Wan, Q.; Fan, J.; Wang, X. Characteristics of ionospheric irregularities near the northern equatorial anomaly crest. Ann. Geophys. 2019, 1–17. [Google Scholar] [CrossRef]
- Amaechi, P.; Oyeyemi, E.; Akala, A.; Falayi, E.; Kaab, M.; et al. Quiet-time ionospheric irregularities over the African equatorial ionization anomaly region. Radio Sci. 2020, 55, e2020RS007077. [Google Scholar] [CrossRef]
- Ondede, G.O.; Okoh, D.; Baki, P.; Olwendo, J.; Awuor, A. Occurrence characteristics and East-West African differences of plasma bubbles during solar cycle 24 from GPS observations. Adv. Space Res. 2026, 77, 7324–7335. [Google Scholar] [CrossRef]
- Azzouzi, I.; Migoya-Orue, Y.; Coisson, P.; Amory-Mazaudier, C.; Fleury, R.; Radicella, S.M. Day-to-day variability of VTEC and ROTI in October 2012 with impact of high-speed solar wind stream on 13 October 2012. Sun Geosph. 2016, 11, 7–22. [Google Scholar]
- Li, Q.; Zhu, Y.; Fang, K.; Fang, J. Statistical study of the seasonal variations in TEC depletion and ROTI during 2013-2019 over Hong Kong. Sensors 2020, 20, 6200. [Google Scholar] [CrossRef] [PubMed]
- Wang, C.; Min, X.; Hu, H. An ionospheric disturbed index based on ROTI. Space Weather 2025, 23, e2025SW004445. [Google Scholar] [CrossRef]
- Adebiyi, S.J.; Ikubanni, S.O.; Bolaji, O.S.; Fashae, J.B.; Adebesin, B.O.; Joshua, B.W.; Adekoya, B.J. Equatorial F-region irregularities at different seasons in Africa. Adv. Space Res. 2021, 68, 1850–1863. [Google Scholar] [CrossRef]
- Dias, M.A.L.; Fagundes, P.R.; Venkatesh, K.; Pillat, V.G.; Ribeiro, B.A.G.; Seemala, G.K.; Arcanjo, M.O. Daily and monthly variations of the equatorial ionization anomaly over the Brazilian sector during the descending phase of solar cycle 24. J. Geophys. Res. Space Phys. 2020, 125, e2020JA027906. [Google Scholar] [CrossRef]
- Ikani, O.; Okeke, F.N.; Okpala, K.C.; Okoh, D.; Rabiu, B. Diurnal and seasonal variations of the occurrence of ionospheric irregularities over Nigeria from GNSS data. Front. Astron. Space Sci. 2023, 10, 1125950. [Google Scholar] [CrossRef]
Figure 1.
The geographic and geomagnetic locations of the ground-based GNSS stations used in this study. The solid green line indicates the magnetic equator, while the red dotted lines show the north and south ±15° geomagnetic latitudes.
Figure 1.
The geographic and geomagnetic locations of the ground-based GNSS stations used in this study. The solid green line indicates the magnetic equator, while the red dotted lines show the north and south ±15° geomagnetic latitudes.
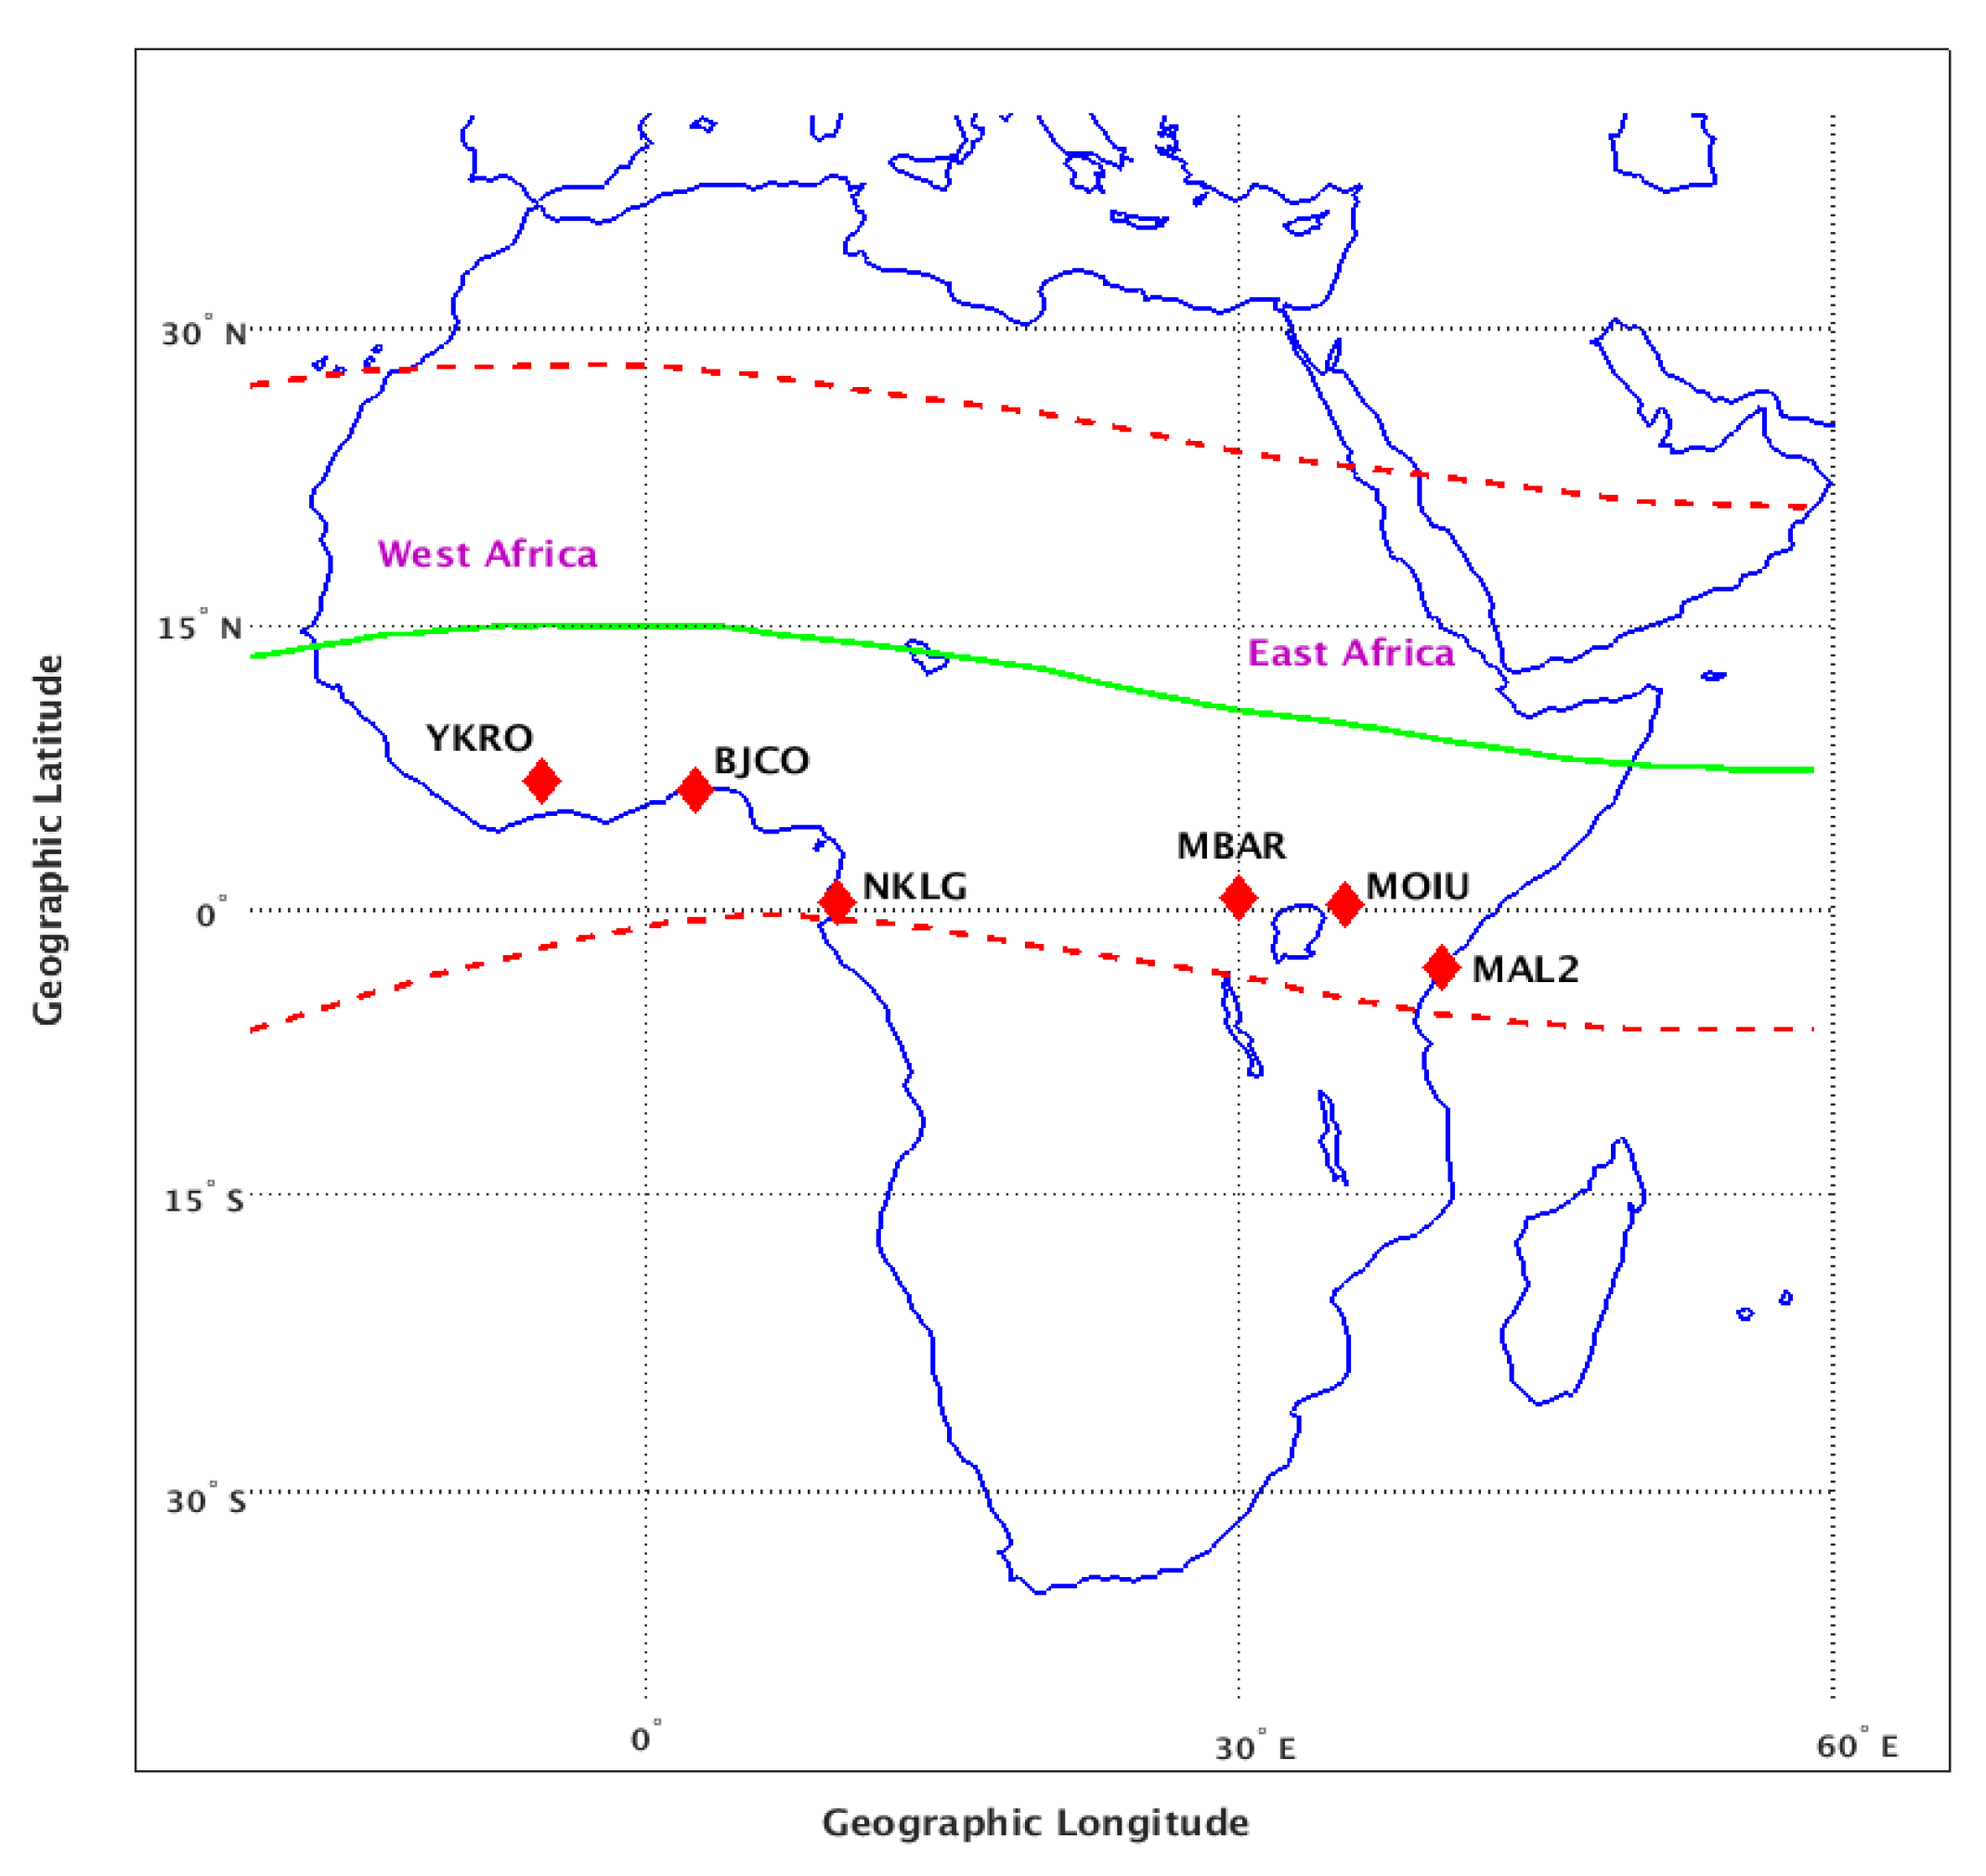
Figure 2.
Contour plots showing the diurnal ROTI values over equatorial African stations in the eastern (the left side three panels (a-c)) and western (the right side three panels (d-f)) longitude sectors in 2014. The color scale indicates the intensity of ROTI in TECU/min, presenting the occurrence and magnitude of ionospheric irregularities.
Figure 2.
Contour plots showing the diurnal ROTI values over equatorial African stations in the eastern (the left side three panels (a-c)) and western (the right side three panels (d-f)) longitude sectors in 2014. The color scale indicates the intensity of ROTI in TECU/min, presenting the occurrence and magnitude of ionospheric irregularities.
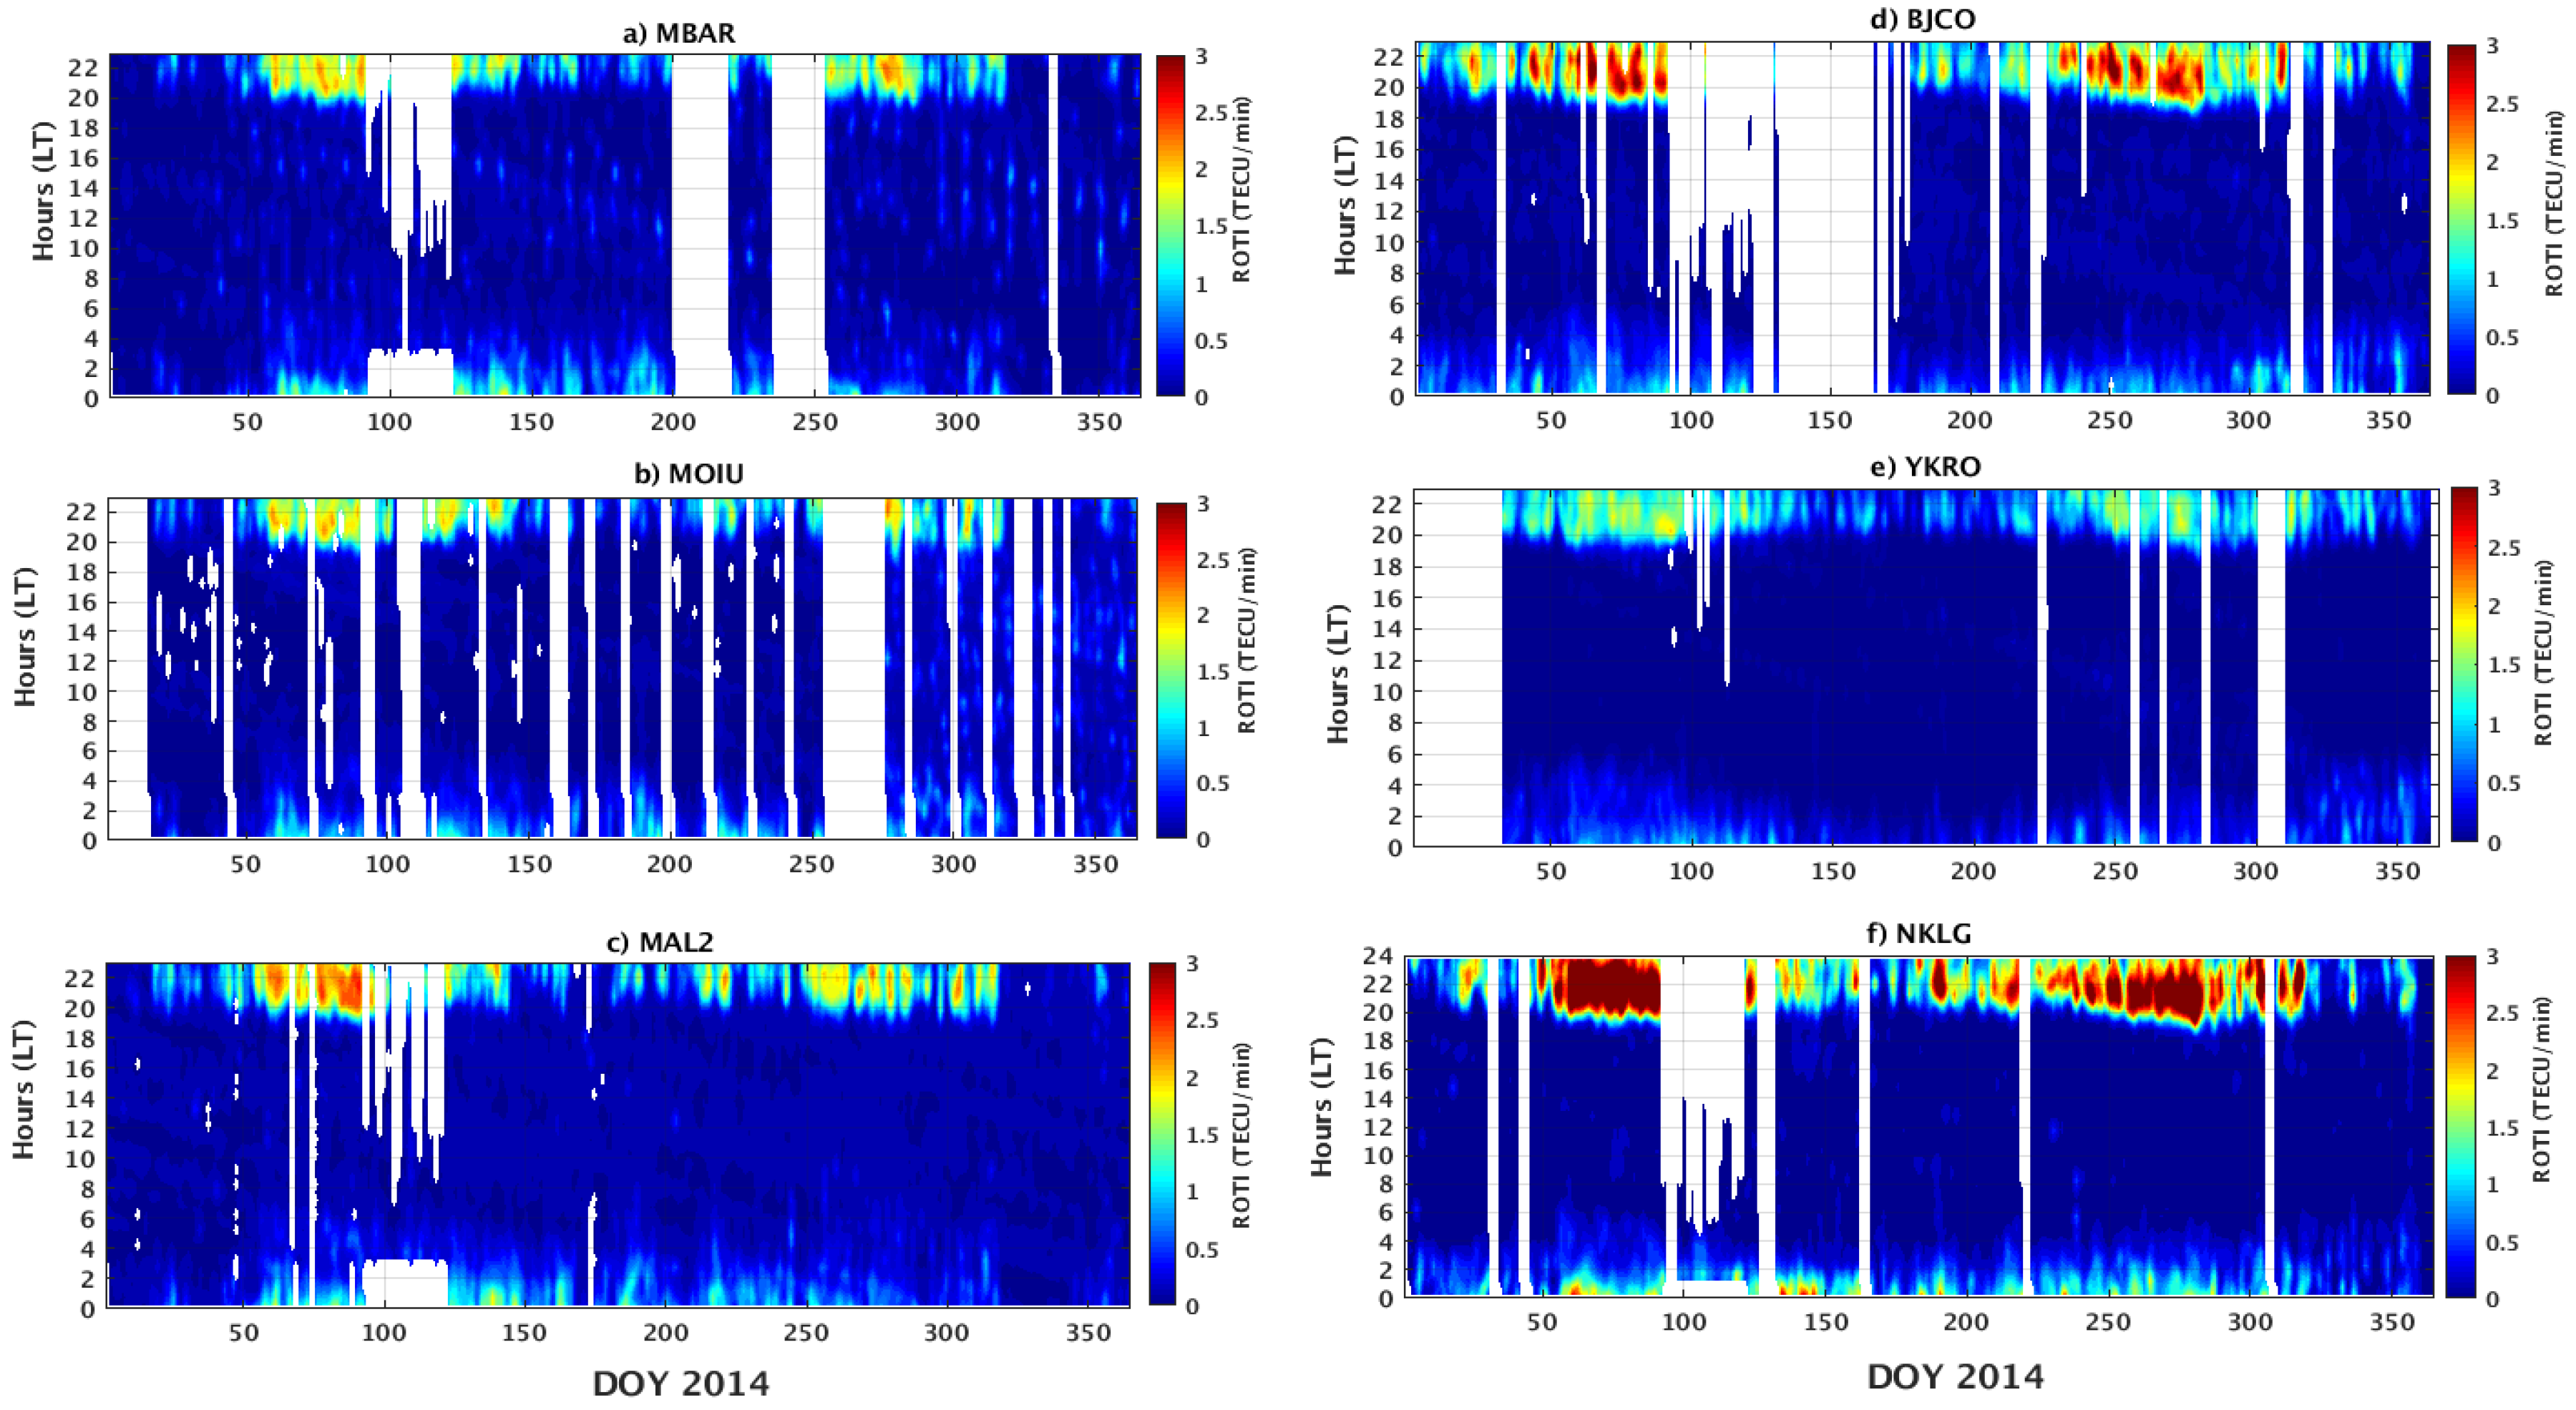
Figure 3.
Daily average longitudinal day-to-day variations of ionospheric ROTI values in the eastern (left side three panels (a-c)) and western (right side three panels (d-f)) over equatorial African regions in the year 2014.
Figure 3.
Daily average longitudinal day-to-day variations of ionospheric ROTI values in the eastern (left side three panels (a-c)) and western (right side three panels (d-f)) over equatorial African regions in the year 2014.
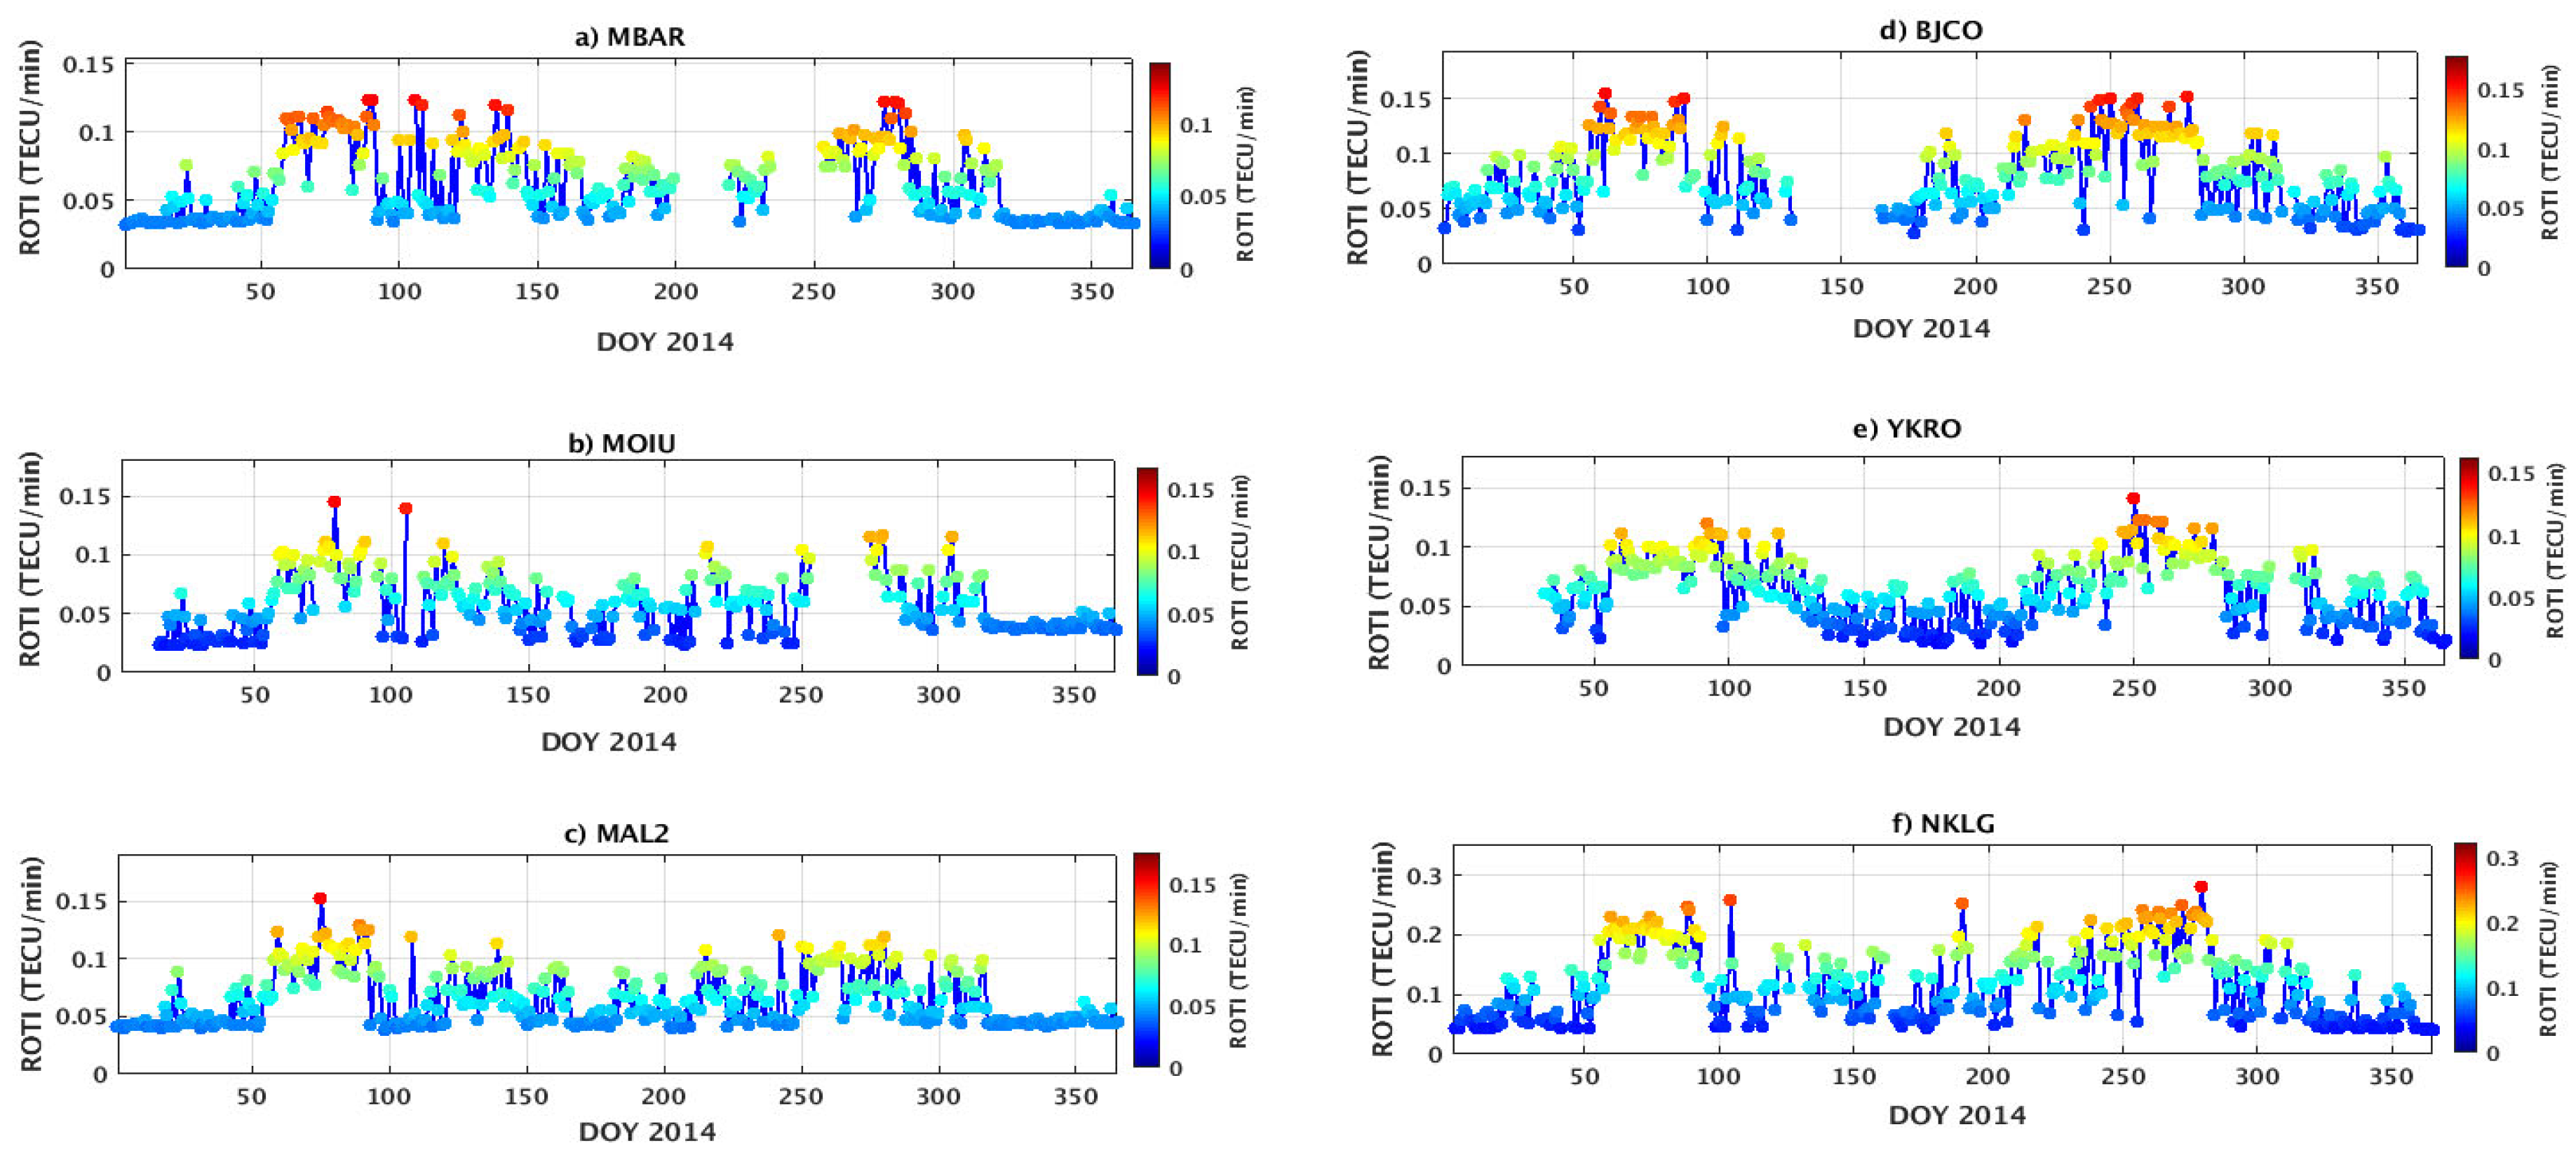
Figure 4.
The correlation coefficient of ionospheric day-to-day ROTI variabilities in the same longitudinal sectors (the two panels a-f) in between East and West African region and in different longitudinal sectors (the lower panels g-i) with East and West African region sectors.
Figure 4.
The correlation coefficient of ionospheric day-to-day ROTI variabilities in the same longitudinal sectors (the two panels a-f) in between East and West African region and in different longitudinal sectors (the lower panels g-i) with East and West African region sectors.
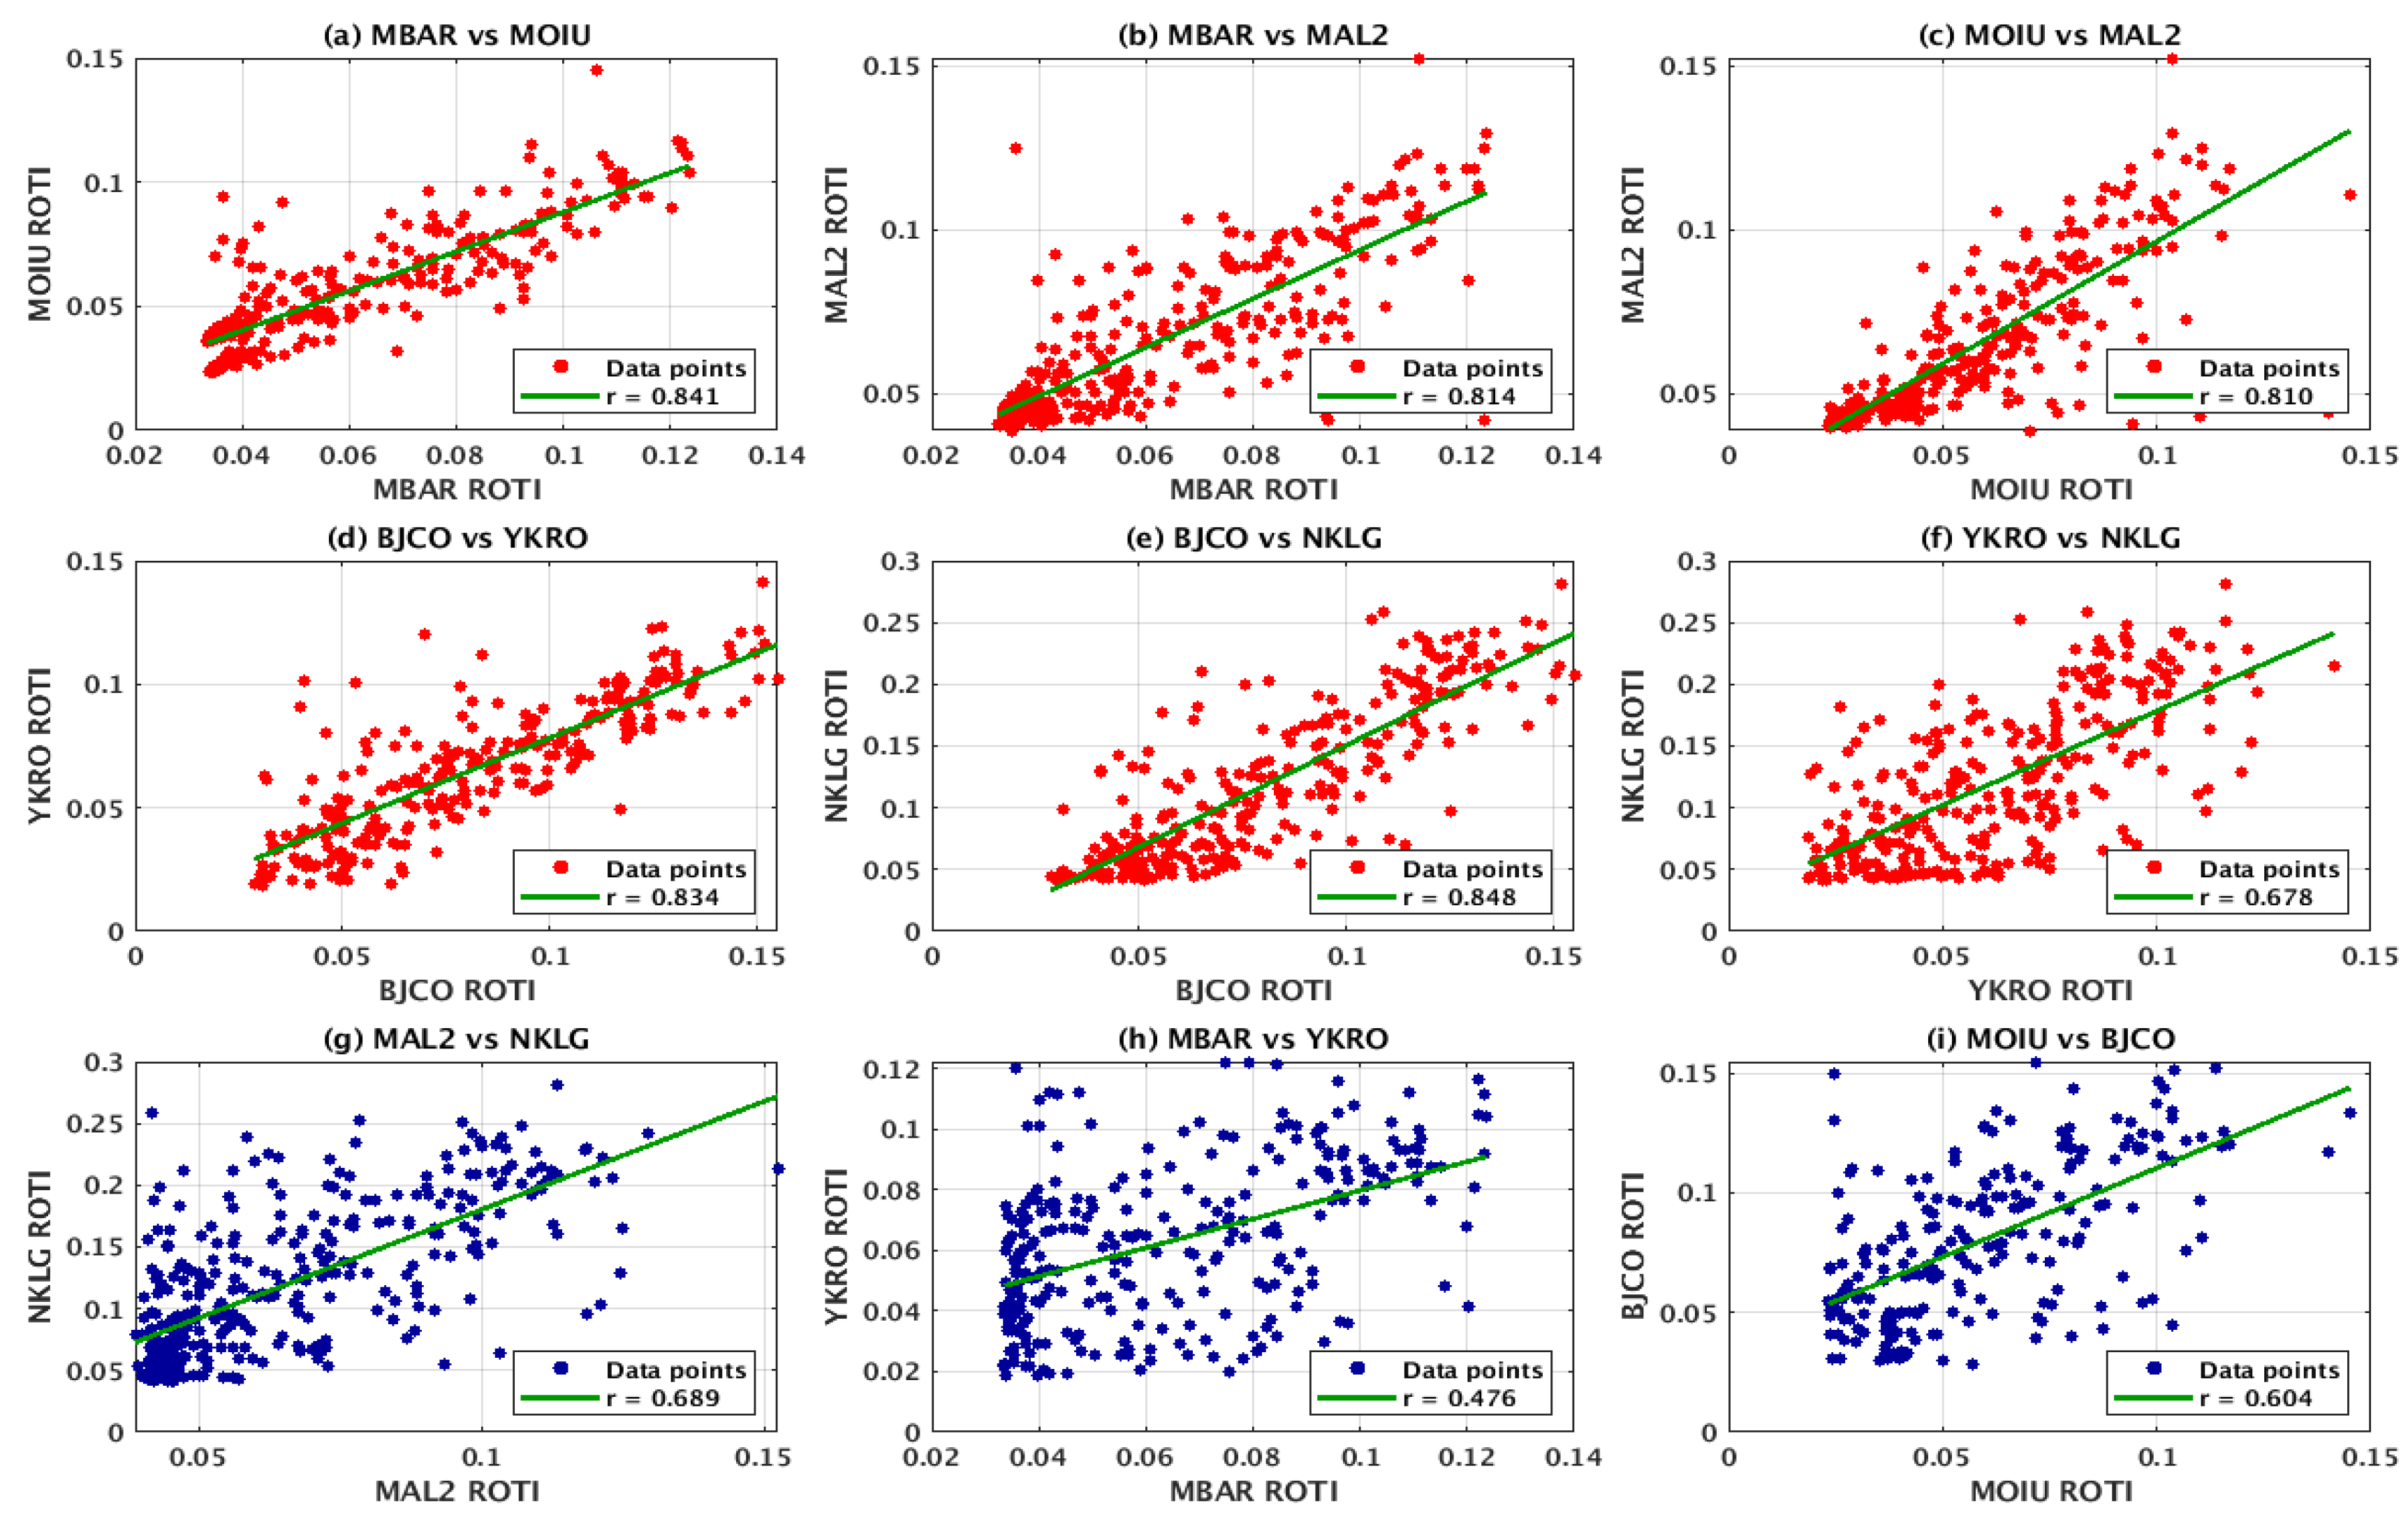
Figure 5.
Differences in longitudinal day-to-day variations of ionospheric ROTI time series values in the eastern (left three panels) and western (right three panels) sectors over equatorial African regions during the year 2014.
Figure 5.
Differences in longitudinal day-to-day variations of ionospheric ROTI time series values in the eastern (left three panels) and western (right three panels) sectors over equatorial African regions during the year 2014.
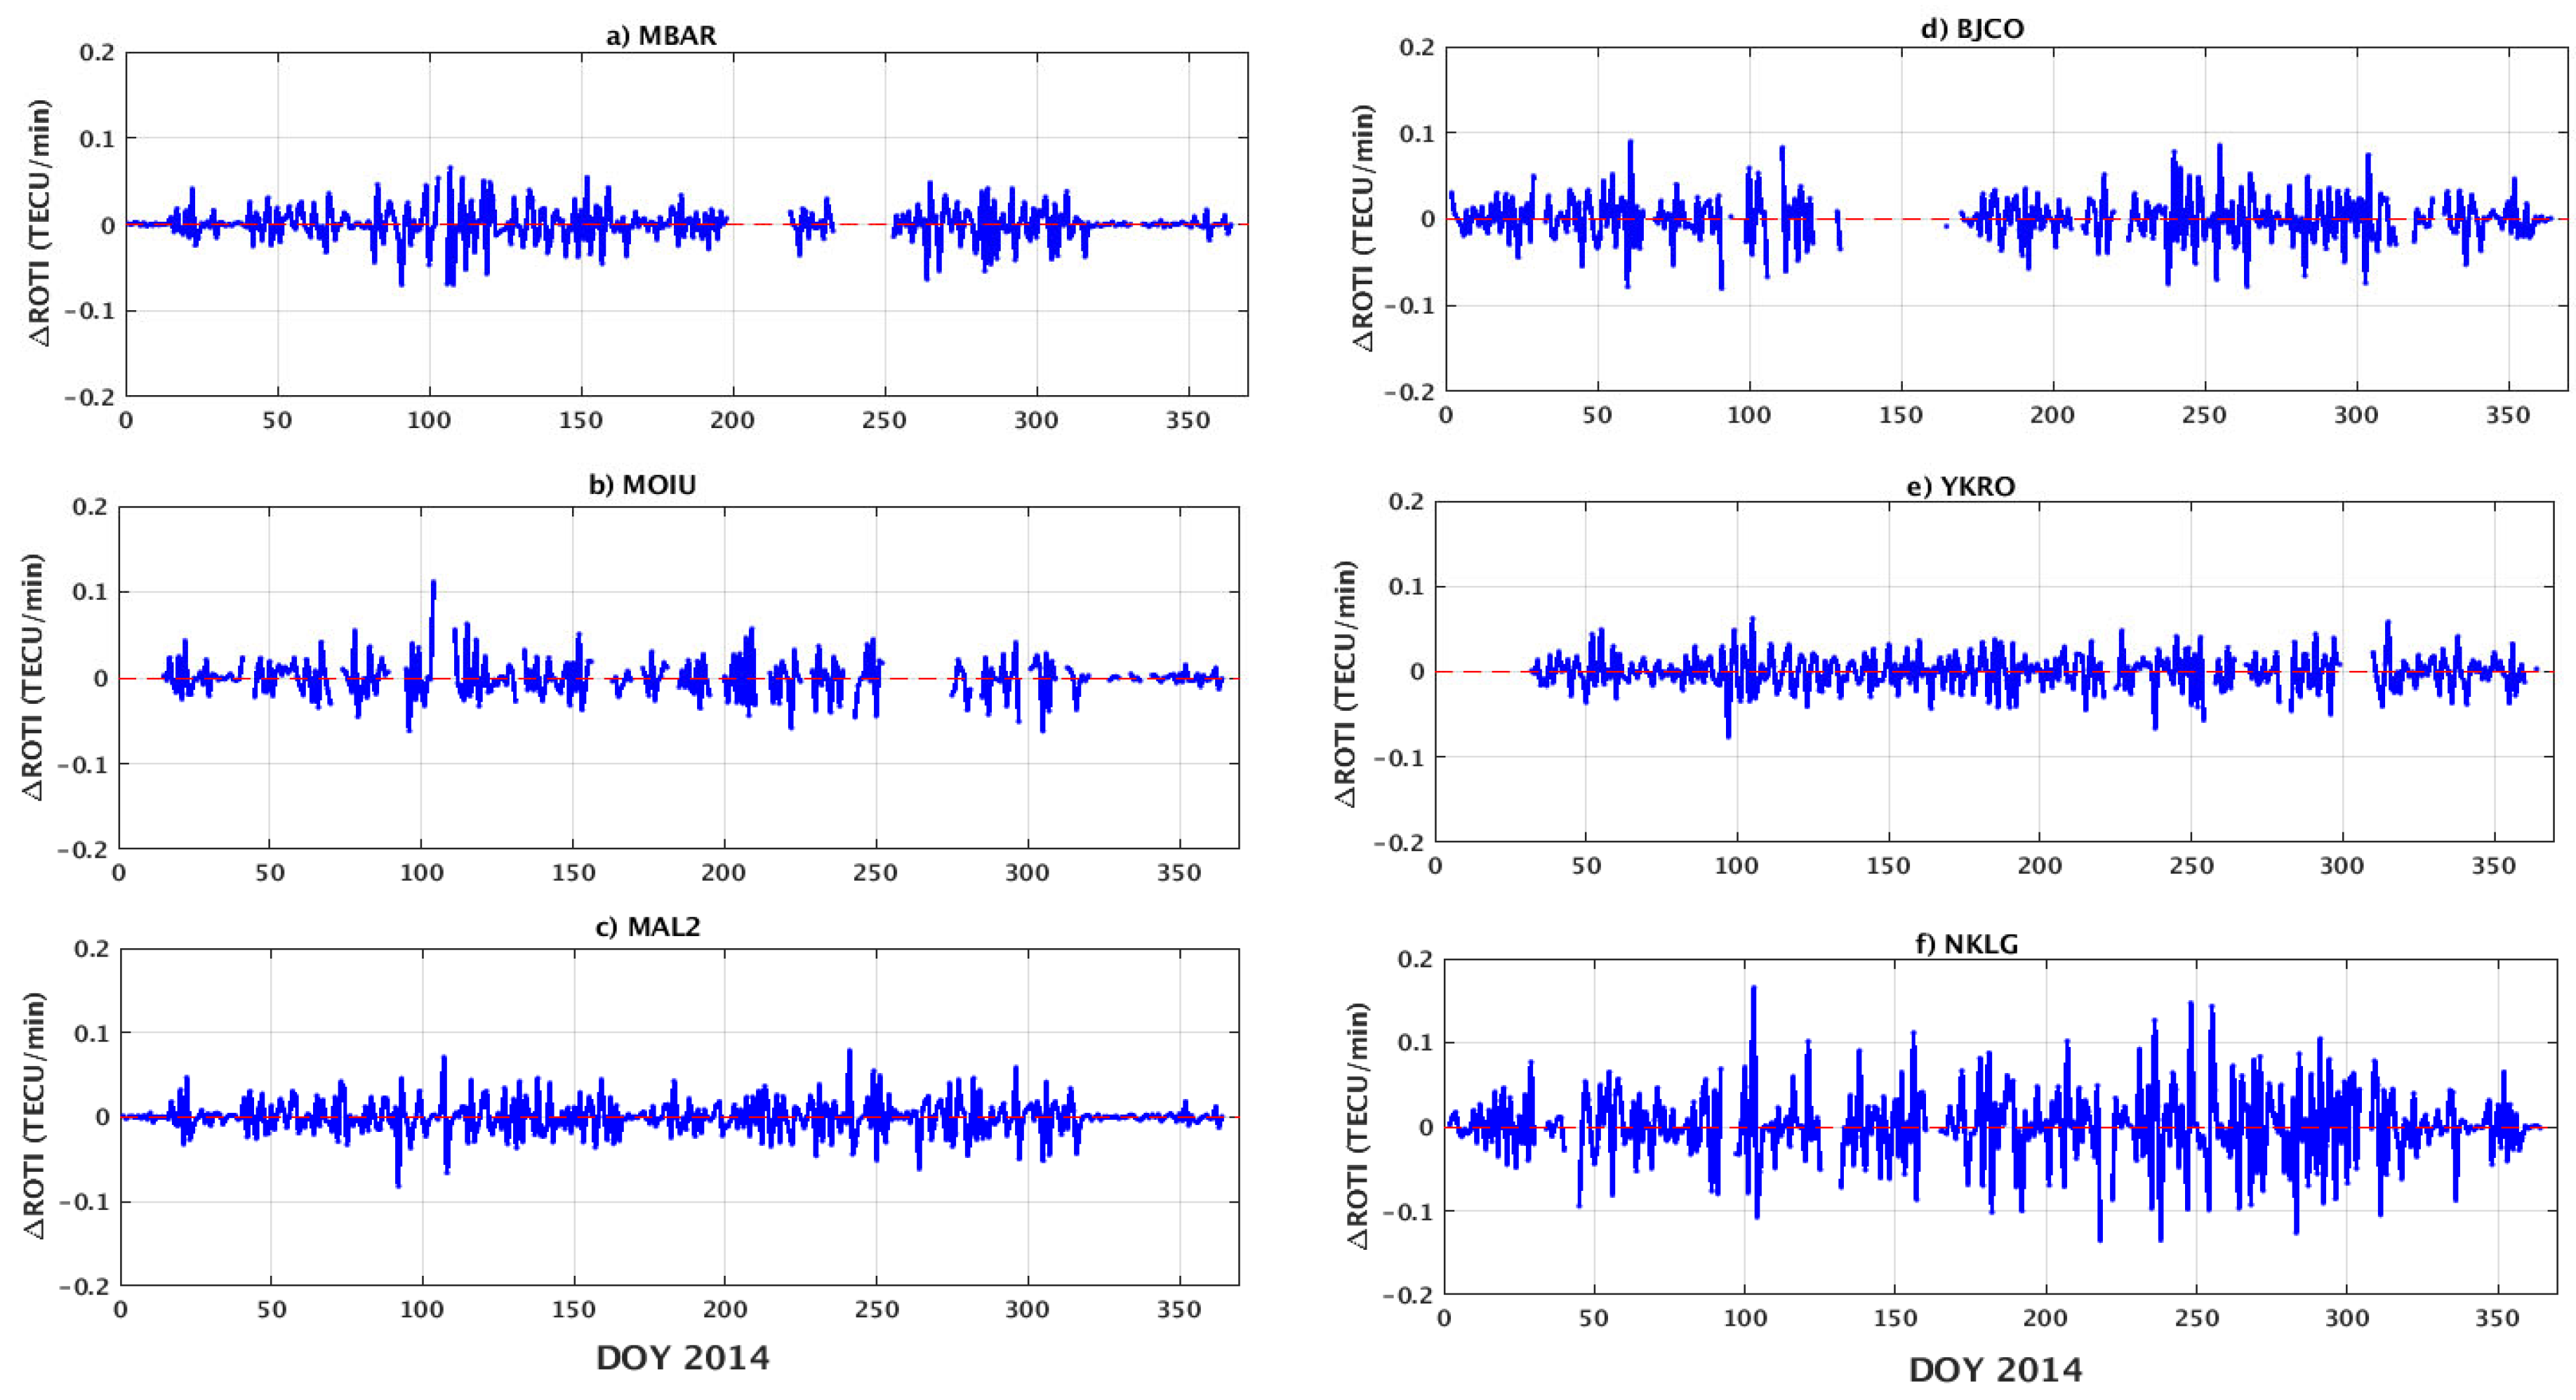
Figure 6.
Longitudinal day-to-day variations of ionospheric ROTI values in the eastern (left three panels) and western (right three panels) using the relative ROTI (RROTI) over equatorial African stations.
Figure 6.
Longitudinal day-to-day variations of ionospheric ROTI values in the eastern (left three panels) and western (right three panels) using the relative ROTI (RROTI) over equatorial African stations.
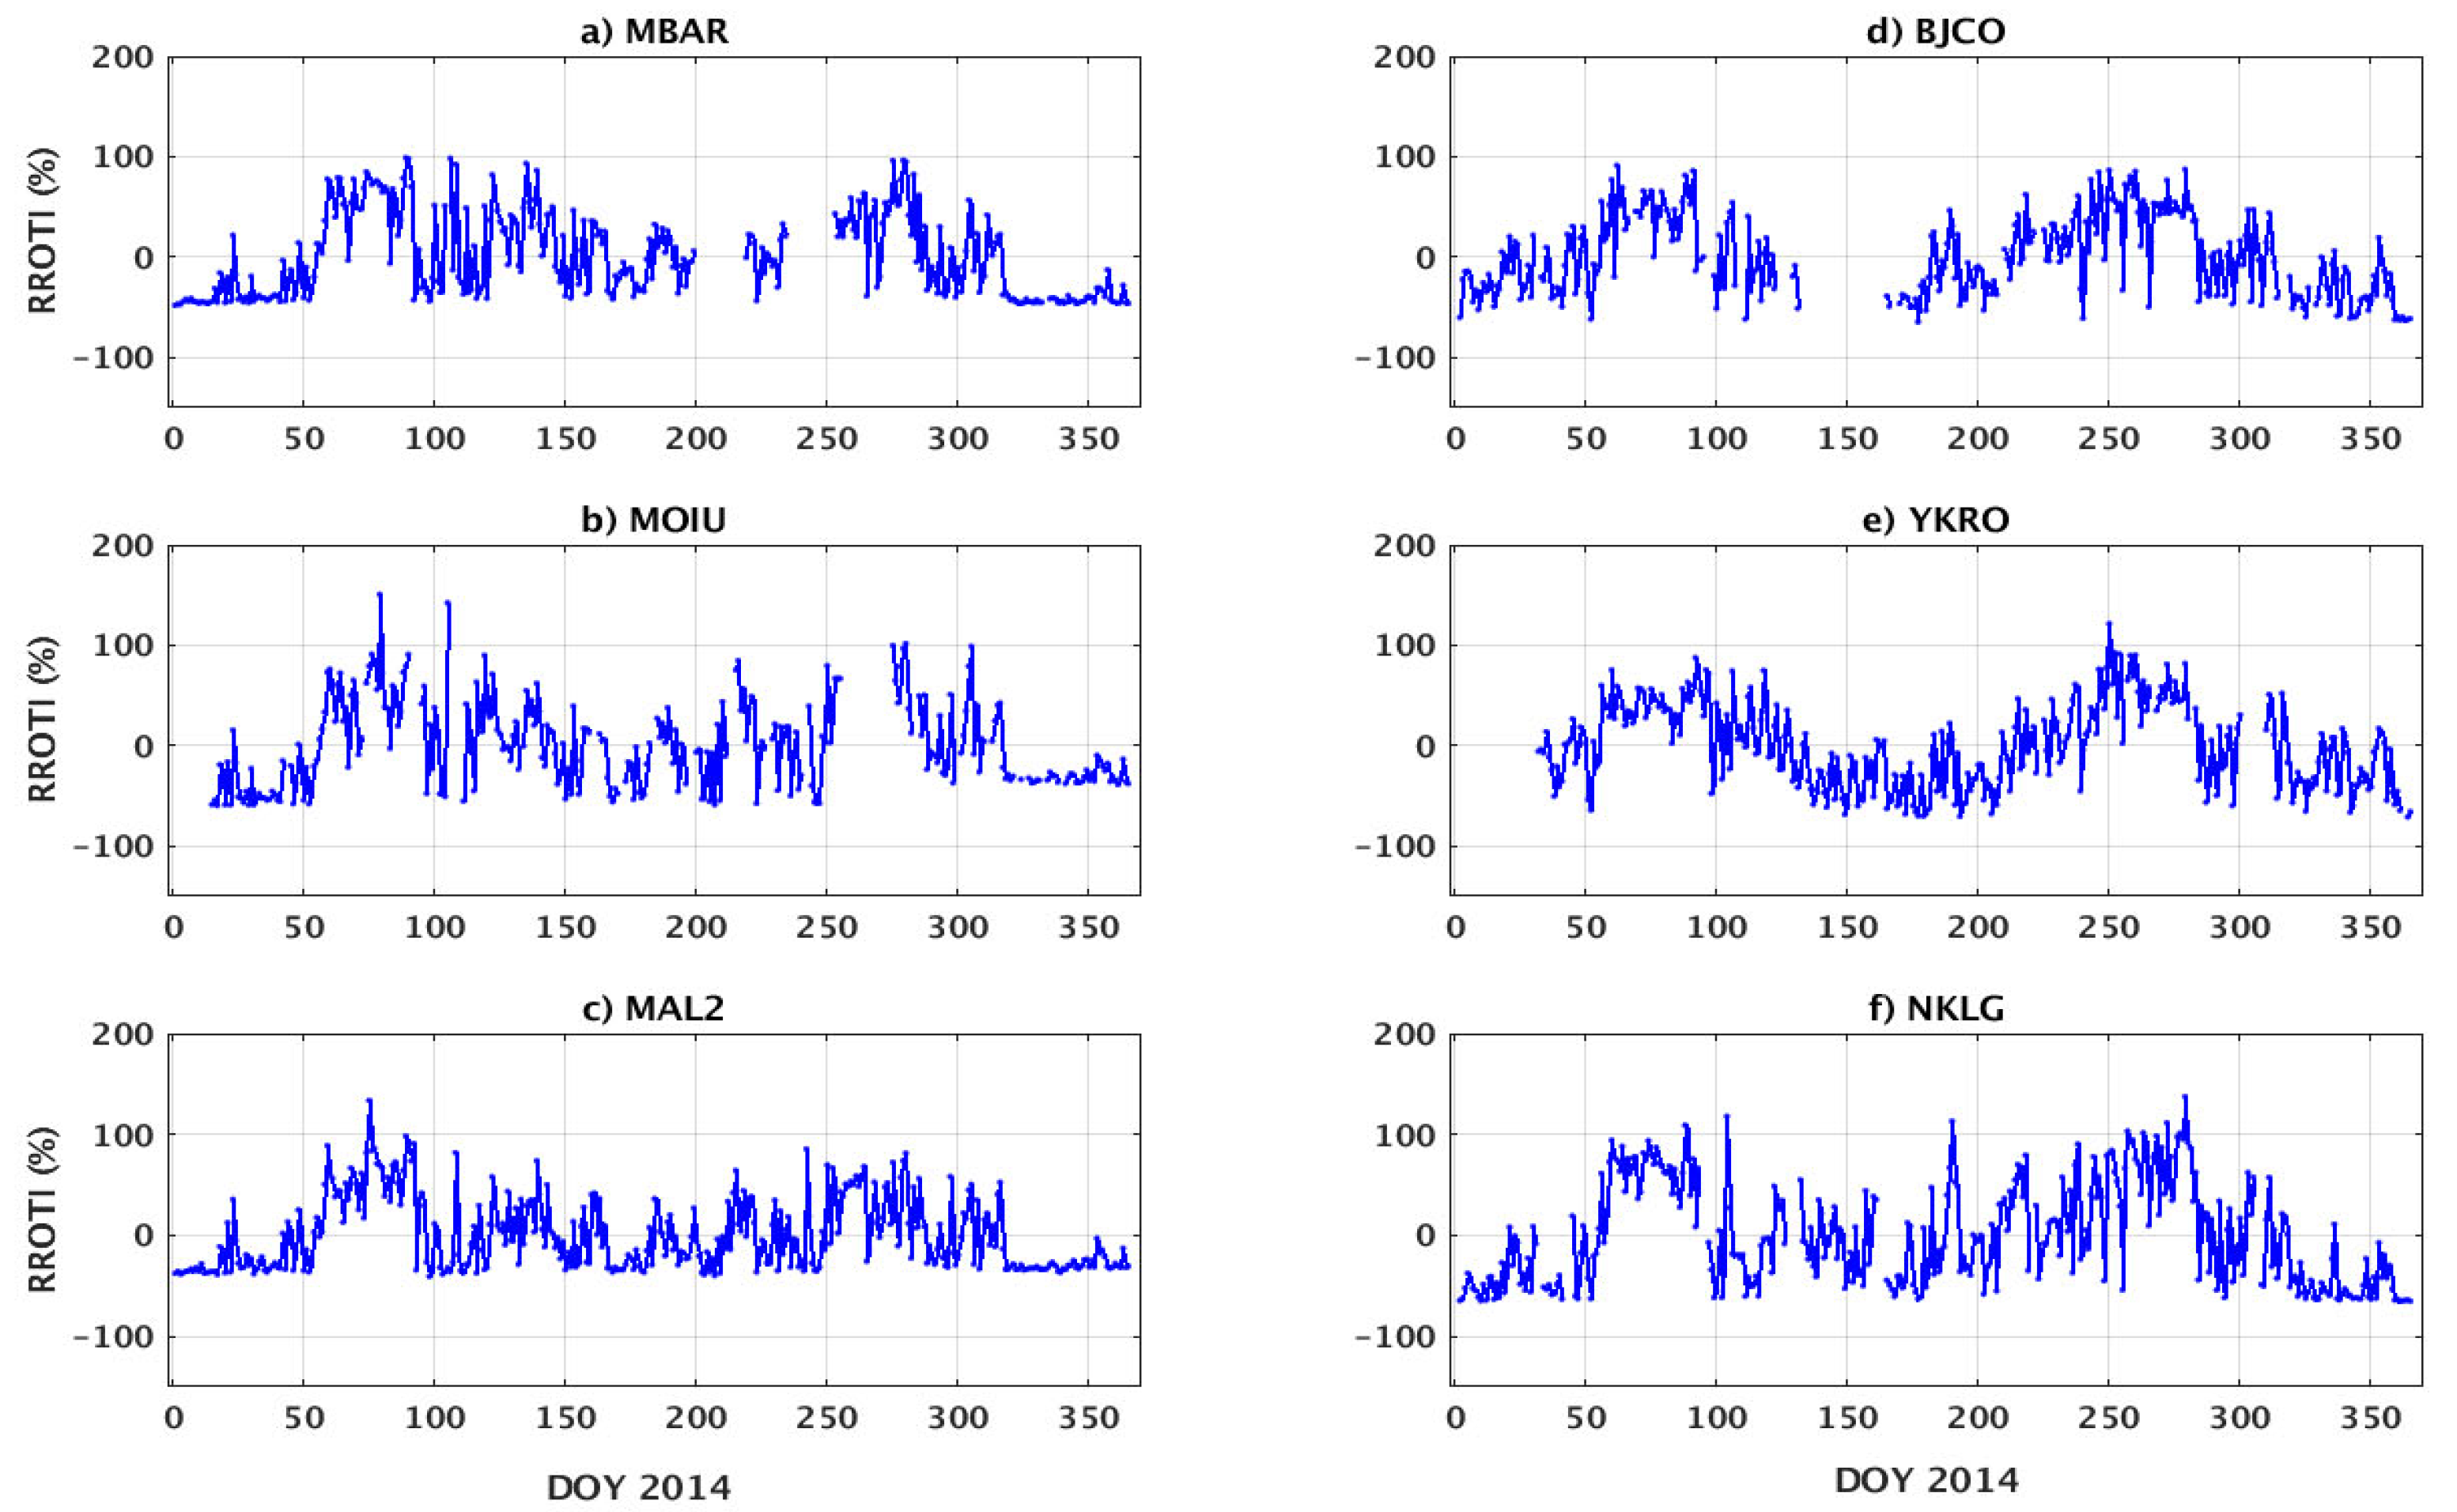
Figure 7.
East-West comparison of day-to-day ROTI variability (blue dots) and 27-day mean climatological trends (red lines) (left side panels a-f) and isolated day-to-day variability (daily deviation) (right side panels g-l) (blue lines) and the variability magnitude (red lines).
Figure 7.
East-West comparison of day-to-day ROTI variability (blue dots) and 27-day mean climatological trends (red lines) (left side panels a-f) and isolated day-to-day variability (daily deviation) (right side panels g-l) (blue lines) and the variability magnitude (red lines).
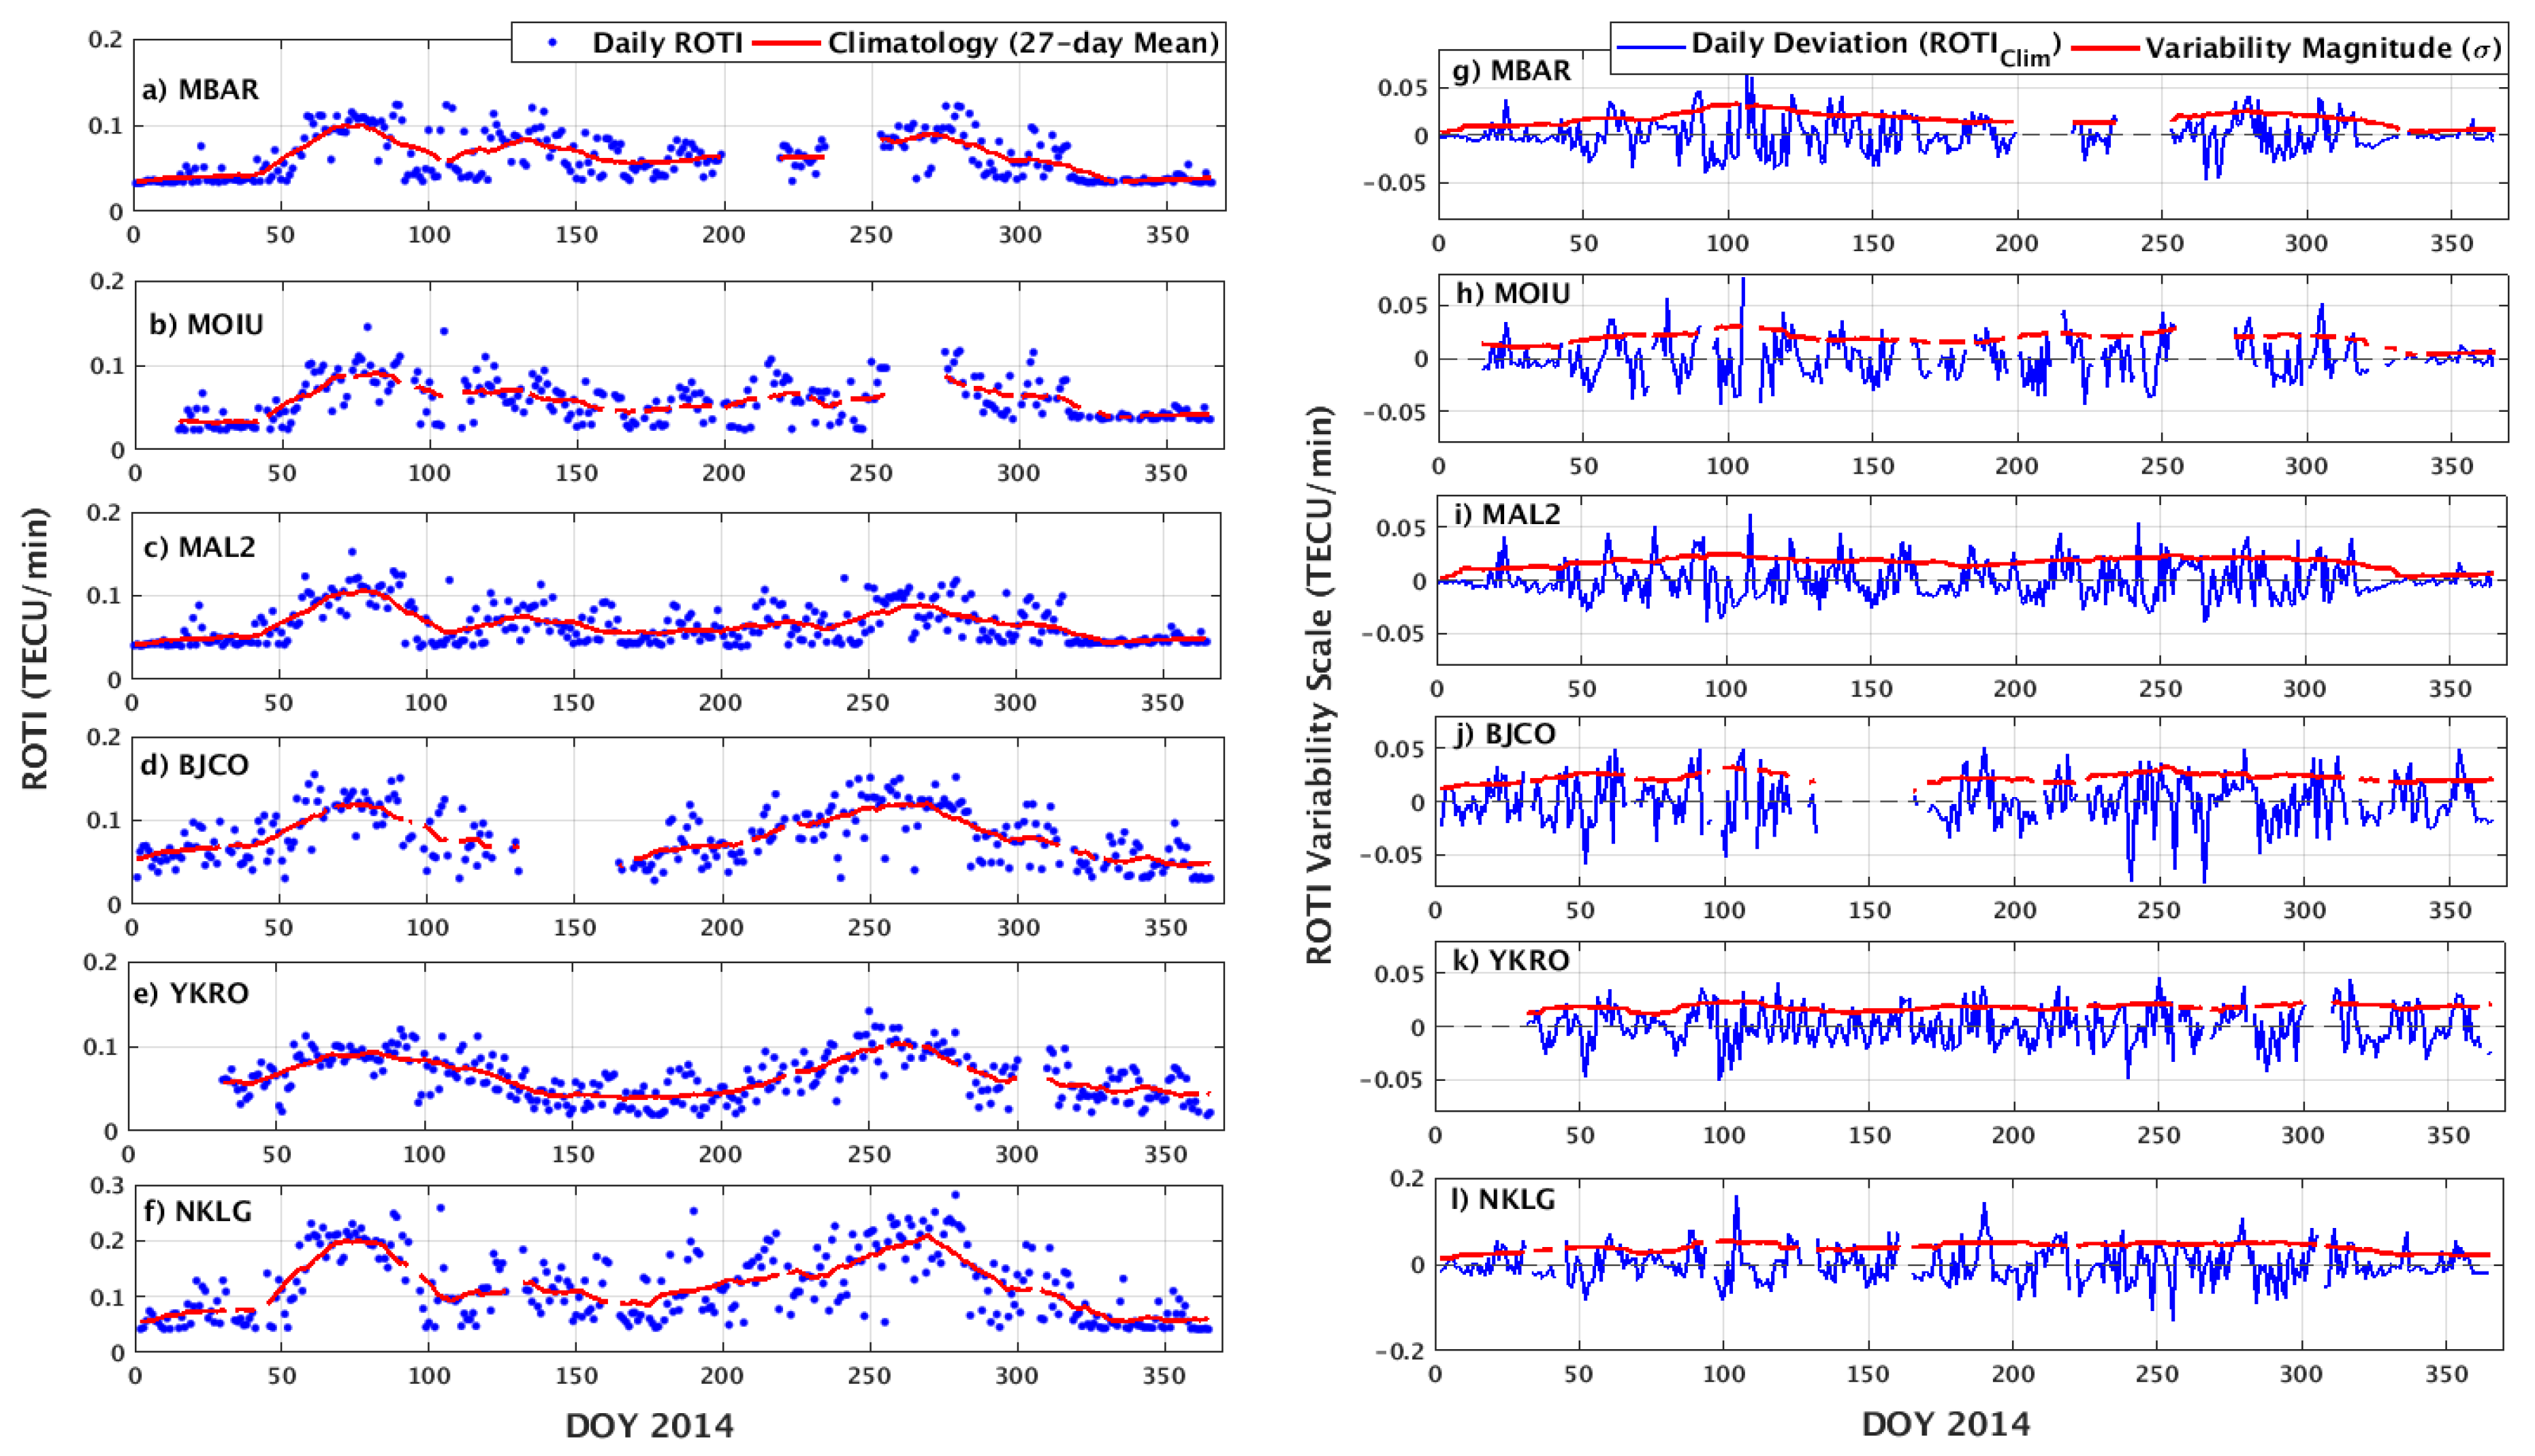
Figure 8.
Seasonal climatology of ROTI variability across six African low-latitude stations during the high solar activity year of 2014. The top panel shows the seasonal mean variation intensity of plasma irregularities. The bottom panel shows the seasonal standard deviation of day-to-day ROTI variability.
Figure 8.
Seasonal climatology of ROTI variability across six African low-latitude stations during the high solar activity year of 2014. The top panel shows the seasonal mean variation intensity of plasma irregularities. The bottom panel shows the seasonal standard deviation of day-to-day ROTI variability.
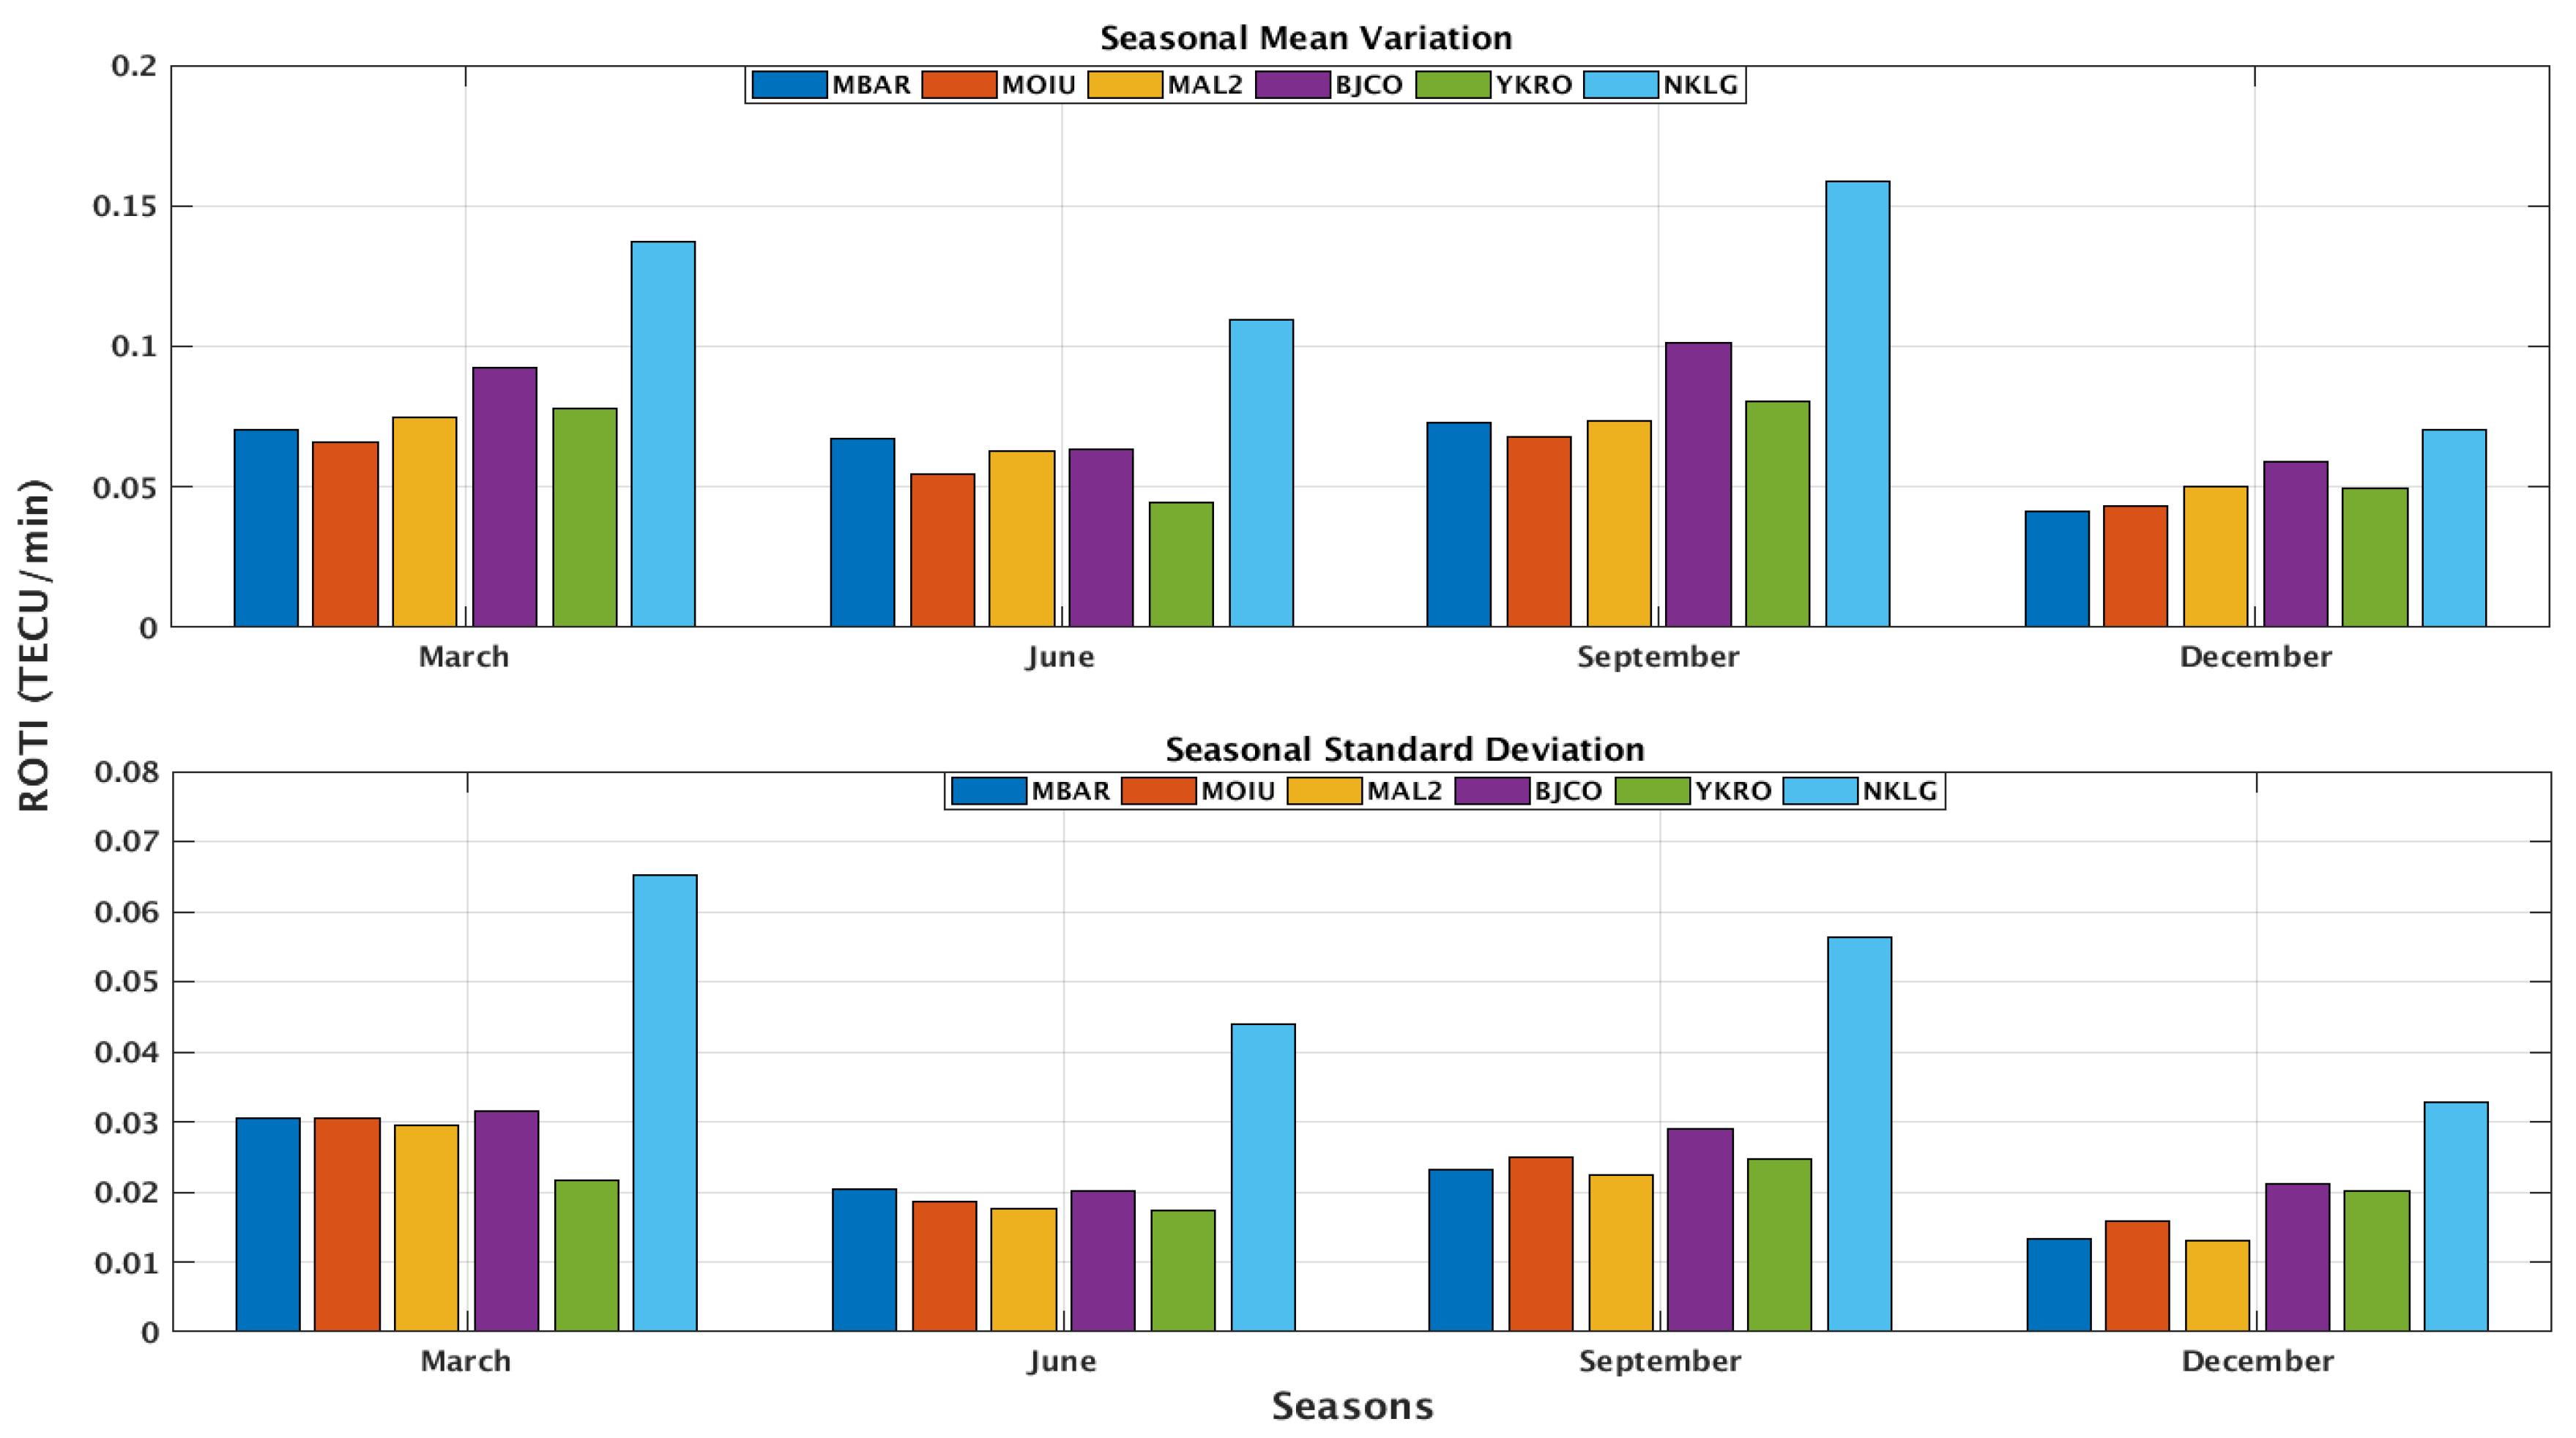
Figure 9.
Continuous wavelet transforms scalograms of day-to-day ROTI variability during the year 2014 over the East African sector (on the left side three panels a-c) and West African sector (on the right side three panels d-f). The color bar represents the magnitude of the power (wavelet coefficients). The red color shows higher spectral energy at a given time and period. The x-axis and y-axis represent the time in day of year and the periodicity in days from 4 to 32, respectively.
Figure 9.
Continuous wavelet transforms scalograms of day-to-day ROTI variability during the year 2014 over the East African sector (on the left side three panels a-c) and West African sector (on the right side three panels d-f). The color bar represents the magnitude of the power (wavelet coefficients). The red color shows higher spectral energy at a given time and period. The x-axis and y-axis represent the time in day of year and the periodicity in days from 4 to 32, respectively.
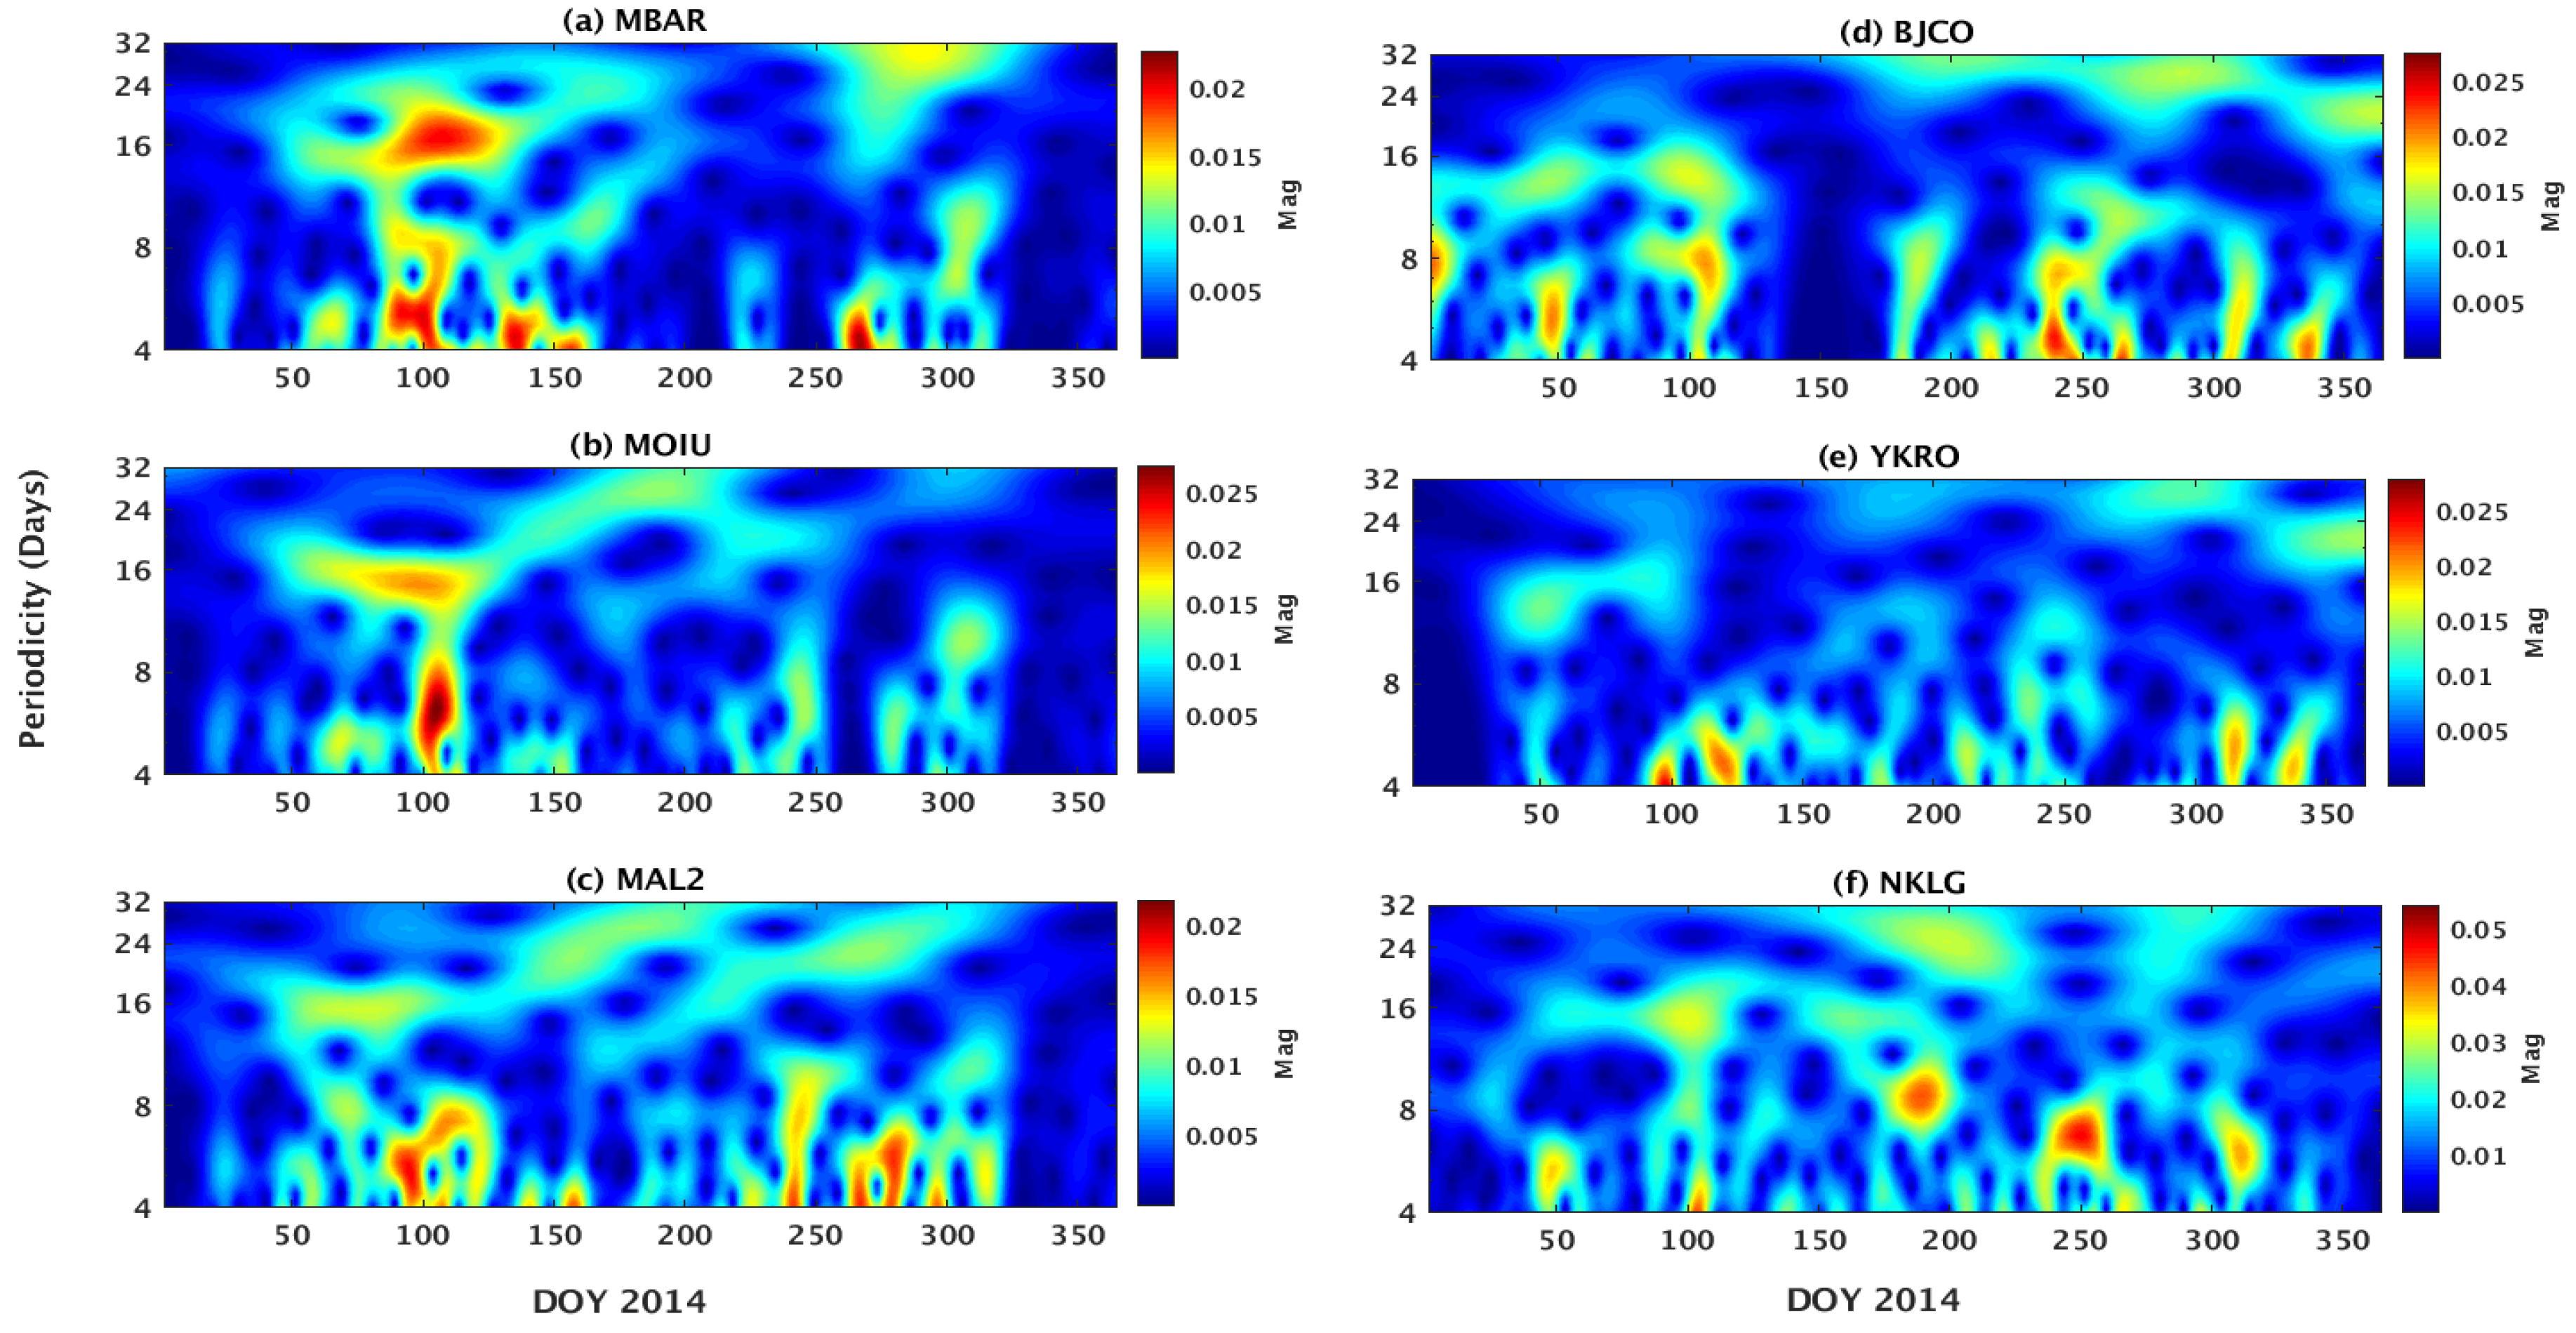

Table 1.
Geographic and geomagnetic coordinates of GNSS stations over the equatorial African region used in this study.
Table 1.
Geographic and geomagnetic coordinates of GNSS stations over the equatorial African region used in this study.
| No | Code | Station | Country | Geog. Lat | Geog. Lon | Geom. Lat | Geom. Lon | Mod(°N) | |
|---|---|---|---|---|---|---|---|---|---|
| East Africa |
1. | MBAR | Mbarara | Uganda | 0.60 | 30.74 | -10.22 | 102.36 | - 20.5 |
| 2. | MOIU | Eldoret | Kenya | 0.29 | 35.29 | -9.17 | 107.00 | -19.9 | |
| 3. | MAL2 | Malindi | Kenya | -2.99 | 40.19 | 12.42 | 111.89 | -24.9 | |
| West Africa |
1. | YKRO | Yamoussoukro | Cote d’Ivoire | 6.87 | -5.24 | -2.84 | 67.41 | -9.8 |
| 2. | BJCO | Cotonou | Benin | 6.38 | 2.45 | -3.08 | 74.54 | -11.1 | |
| 3. | NKLG | Libreville | Gabon | 0.35 | 9.67 | -8.05 | 81.05 | -23.9 |
Disclaimer/Publisher’s Note: The statements, opinions and data contained in all publications are solely those of the individual author(s) and contributor(s) and not of MDPI and/or the editor(s). MDPI and/or the editor(s) disclaim responsibility for any injury to people or property resulting from any ideas, methods, instructions or products referred to in the content. |
© 2026 by the authors. Licensee MDPI, Basel, Switzerland. This article is an open access article distributed under the terms and conditions of the Creative Commons Attribution (CC BY) license (http://creativecommons.org/licenses/by/4.0/).
Copyright: This open access article is published under a Creative Commons CC BY 4.0 license, which permit the free download, distribution, and reuse, provided that the author and preprint are cited in any reuse.