

Submitted:
01 August 2026
Posted:
04 August 2026
You are already at the latest version
Abstract
In summer 2026, record-low Danube water levels twice forced the Paks Nuclear Power Plant to curtail output, prompting public debate about upstream dam operations, drought, and national water security. A companion technical study [1] shows that part of the 2026 record reflects a four-decade, quantifiable shift in the river’s own stage–discharge relationship at Paks: a channel-scale change that was, in principle, statistically detectable for decades before it became an operational constraint. This Perspective argues that the episode is one instance of a recurring pattern in Hungarian water management: risks legible in existing data well in advance surface as institutional surprises, because surface water, groundwater, and the sectors depending on them are governed separately despite being physically one system. The pattern is illustrated with two further cases: on the one hand, the well-documented decline of shallow groundwater across the Hungarian Great Plain since the late 1970s; on the other, the stationary statistics behind the 2014 design-basis low- water criterion of Paks II (the separate expansion project still under construction at the same site), now strained by the 2026 record with no evidence of reassessment. The physical basis for treating Danube surface water and adjacent groundwater as one connected resource is also set out. It is further reported that a dedicated water-balance analysis found no evidence that upstream water management retained water during the drought (if anything the reverse), corroborated by an independent regional water-storage and precipitation record. We close by identifying what an integrated planning instrument would require, and what is currently missing, without prescribing a specific policy response.
Keywords:
Water security
; integrated water resources management
; groundwater decline
; river–aquifer connectivity
; Danube River
; institutional risk perception
; Hungary
1. A Pattern, Not a Standalone Story
Between late June and late July 2026, the Danube at Paks fell to a series of record-low water levels, and the Paks Nuclear Power Plant curtailed output twice: once because the river’s temperature approached the statutory limit on cooling-water discharge, and again, weeks later, because the water level itself fell below what the plant’s cooling-water intake pumps require for safe operation. The two episodes were widely reported as a single undifferentiated “water crisis,” and much of the public discussion that followed focused, understandably, on the immediate trigger: an exceptional regional drought, compounded by questions about how upstream countries were managing their share of the river.
Both of those things are real. But a companion technical analysis of the Paks gauge’s 46-year discharge and water-level record [1] shows something the drought narrative alone does not capture: at a given discharge, the water level at Paks has been declining by roughly 16–17 cm per decade since 1981. This is a channel-scale change, not a discharge-scale one, reconstructed from the river authority’s own periodically revised rating curve and corroborated independently on the one hand by a repeat bathymetric survey at the plant site, and on the other by a broader, spatially coherent pattern across four gauging stations from Austria to Hungary. Applied to the actual 2026 discharge, this shift alone accounts for roughly 65 cm of the record low water level, that is, a large fraction of the margin between the design-basis low-water level later fixed for the site in the Paks II licensing process (Section 2.3) and the level the river actually reached.
The reason this matters beyond the specific numbers is that the shift was, in principle, visible in existing hydrological data for years, using a diagnostic Hungary’s own water authority already applies elsewhere: comparing the direction of discharge and water-level trends at a gauge to detect probable channel change. The country’s current statutory river basin management plan [2] even states this method explicitly, and separately identifies Paks’s cooling-water discharge as a pressure on the river; yet it nowhere addresses the reverse relationship demonstrated here, namely that the river’s own changing state bears on the security of the water supply a piece of critical infrastructure depends on. The 2026 episode was not unforeseeable; it was unaddressed.
This is not, we argue, a story about one river gauge or one power plant. It is one instance of a more general pattern in how Hungary manages water: statistically legible risks that cross the boundary between how surface water and groundwater are separately governed tend to surface as institutional surprises, because the underlying hydrology does not respect the boundary that the institutions do.
2. The Same Pattern, Three Times
Figure 1 previews the structure shared by the three cases developed in this section, before the case-specific detail: in each, a risk was statistically legible in existing data, a diagnostic or institutional mechanism already existed that was capable of catching it, and no institutional step connected the two before 2026.
2.1. The River
The Paks finding, summarized above, is the more immediately consequential of the examples developed in this piece: a specific, dated infrastructure risk, quantified retrospectively from data that existed the whole time.
2.2. The Aquifer
A second, independent instance of the same underlying pattern is considerably older and better established: shallow groundwater levels across parts of the Hungarian Great Plain, most clearly the Danube–Tisza Interfluve (DTK) and the Nyírség, entered a sustained decline beginning in the late 1970s, attributed primarily to a persistent shift in the regional precipitation regime rather than to groundwater extraction, whose cumulative contribution over four decades is an order of magnitude smaller than the climatic swings in recharge [3,4]. By the mid-1980s the decline in the Danube–Tisza Interfluve was already well established. This is not a new or contested finding: it has been documented, attributed, and re-confirmed across multiple independent research groups for decades. Nor is it a phenomenon confined to a single region: the same literature reports a quantified groundwater storage loss of 0.3–0.4 km3 in the Szigetköz floodplain following the 1992 Gabčíkovo Danube diversion, direct evidence that river regulation can affect adjacent aquifers over a scale considerably larger than a casual “rivers only matter within a few kilometers” assumption would suggest, in settings with coarse, high-conductivity substrate [5].
We flag one limit to this parallel explicitly. Hungary’s alluvial and interfluve groundwater sits within gravity-driven, regionally nested flow systems in the sense described by Tóth [6,7], with the Danube–Tisza Interfluve and Nyírség functioning as recharge limbs of that regional structure [3]. It is tempting to read a shared mountain- or upland-recharge driver into both the river-channel and the regional groundwater signal. The sources this piece draws on do not support that specific synthesis: they document that pressure changes originating at a recharge boundary can propagate through a confined system within days to a depth of hundreds of meters [8] (cited in [3]). This, however, is a statement about how fast a pressure signal travels, not about how quickly the fluid volume in a deep regional flow system actually turns over; and the latter, slower timescale is the one relevant to whether a decadal climatic or river-channel signal could plausibly be causally linked to deep flow-system dynamics. That causal claim is not made here. What is established, and sufficient for the argument of this piece, is narrower and more defensible: two independent, well-documented Hungarian water phenomena, one in the river channel, one in the regional aquifer, share the same structural failure mode of being statistically foreseeable well before they were institutionally addressed, whatever their ultimate physical relationship to one another turns out to be.
2.3. The Design Basis
A third, narrower instance of the same pattern sits in the licensing record of the Paks site, and here a distinction the preceding sections did not need becomes essential. Two nuclear facilities share the site and the same river reach. The first is the existing, operating four-unit Paks Nuclear Power Plant: the plant whose two 2026 curtailments opened this piece, and whose gauge record the companion technical study analyzes. The second is Paks II, an administratively and physically separate new-build expansion project, still under construction beside the operating plant, which figures in this piece solely through its licensing record. The design criterion examined in this subsection belongs to Paks II: the 2014 environmental impact study for the Paks II project fixed a 1-in-20,000-year design low-water level for the site, 83.78 m above Baltic datum, from a stationary statistical fit (Gaussian, Gamma, and Gumbel distributions) to the water-level record judged homogeneous at the time, 1965–2012; the Gaussian fit was adopted, in the report’s own words, “to be on the safer side” [9]. The reason a still-unbuilt plant belongs in a piece about the operating plant’s 2026 crisis is that this statistic is a property of the river channel at this location, not of either facility: the same four-decade channel degradation that deepened the operating plant’s 2026 record low (Section 1) is also, independently, eroding the safety margin built into Paks II’s own separate design criterion, and doing so before Paks II is even operational. The companion technical analysis reports that the actual 2026 minimum came within roughly 30 cm of that threshold, and finds no evidence that the underlying statistics have been recomputed in the twelve years since the fit closed [1].
What sharpens this beyond an ordinary case of aging infrastructure statistics is timing: as of 2026, Paks II is still at an early civil-works stage of construction; first concrete for the Unit 5 foundation was poured in February 2026, with commercial operation not expected before the early-to-mid 2030s. The plant this criterion is meant to protect does not yet exist. This is not a case of a decades-old design basis inherited from a plant already decades into service, where recomputing historical statistics competes for attention with the demands of running the facility. The gap identified here sits entirely within the pre-operational period: the record used to justify the design has kept accumulating, and lengthening, for twelve years while construction had not even begun, and no recomputation has been documented in that entire window. If the statistics are already this far out of date before the plant exists, the ordinary institutional excuse for a stale design basis (namely that attention is elsewhere, on an operating facility with more immediate demands) does not apply; there is, if anything, unusually little to compete with fixing it before commissioning.
The companion paper states this descriptively and, correctly, stops there: whether a specific number has or has not been recomputed is a factual question, not a policy recommendation. But the same arithmetic that produced the 83.78 m criterion also shows, as an illustrative order-of-magnitude extension of the same stationary assumptions, what has happened to it since. Under an unchanged 1965–2012 fit, the 2018 minimum registers as roughly a 500-year event and the 2026 minimum as roughly a 10,000-year event: two nominal, multi-century-to-millennial extremes, eight years apart, six and fourteen years respectively after the fit window closed. This is the situation Milly et al. [3,10] describe in arguing that “stationarity is dead” for water-management design: a criterion computed once from a historical record does not stay conservative as the record’s own statistics drift, and outcomes dismissed as vanishingly improbable under the original fit turn out, twice in eight years, not to be.
We want to be precise about what this is not. It is not evidence that the 2014 assessment was performed carelessly: the same report’s own forecast envelope, correctly read, bracketed a range that the subsequent decade tracked reasonably well, and choosing the more conservative of several candidate distributions was a defensible methodological judgment at the time it was made. It is not a claim that Paks II’s discharge design basis is undermined: the 2026 event stayed within the design discharge envelope; this is a stage/geometry finding, not a hydrological-model failure. And it does not require inventing a new institution to fix. Nuclear facilities already operate under a periodic safety review mechanism, built for exactly the situation where an operating assumption needs to be checked against everything learned since it was last set, on a schedule (typically ten-yearly) set independently of any specific triggering event (IAEA Safety Standards Series No. SSG-25, Periodic Safety Review for Nuclear Power Plants) [11]; Hungary’s own regulator applies external safety oversight to the operating Paks plant on a recurring basis, most recently an IAEA Operational Safety Review Team (OSART) mission conducted 4–21 November 2024 [12,13]. The tool that would catch a stale design-basis statistic therefore already exists, on a cycle already embedded in nuclear licensing practice at this site. What the companion study found no evidence of is that this specific hydrological input has been run back through it since 2014. That is a legible, fixable gap, the same shape as the VGT3 omission in Section 1 and the groundwater story in Section 2.2, not a case of negligence.
3. Why These Are Not Two Problems
Even without invoking deep regional flow-system dynamics, there is a direct, local, and well-established physical reason why surface water and groundwater at Paks cannot be planned separately. The Danube at Paks is in hydraulic continuity with the adjacent Quaternary alluvial aquifer, with documented connectivity extending 300–1000 m from the channel and river-to-aquifer infiltration occurring above a specific stage threshold, as characterized in the site investigations performed for the Paks II licensing process [9]. A persistent lowering of the river’s stage at a given discharge (the central finding of the companion technical study) therefore also lowers the riparian groundwater head the river sustains near the channel, and shortens the duration for which floodplain side-arms downstream remain hydraulically connected to the main channel; a companion analysis of the Gemenc floodplain immediately below Paks reports a 25–45% reduction in that connection duration relative to the early twentieth century [1], citing [14]. The consequences of a river-channel change of the kind documented in this reach are, in other words, not confined to the main channel or to the specific infrastructure asset that first made it visible.
Independent, earlier evidence of the same mechanism exists for a different Hungarian river. A 2005–2015 geostatistical reconstruction of shallow groundwater levels across the South Great Plain found that, along the Tisza, an increasingly pronounced groundwater-drawdown effect in adjacent areas tracked the river’s own persistently low water levels, namely fewer and shorter floods than in earlier decades, that is, a river in gradual decline pulling the water table down beside it rather than sustaining it [3]. The Danube-at-Paks mechanism reported here is accordingly not a one-off: the same category of river-to-aquifer coupling, running in the same direction, has already been documented independently on another Hungarian river a decade earlier.
It is worth emphasizing that this connectivity distance (300–1000 m) is specific to the fine, sandy alluvium of the Paks reach, and should not be generalized to coarser-grained settings such as Szigetköz, where the same general principle, namely that Danube regulation can influence adjacent groundwater, operates over a different effective range because of higher hydraulic conductivity. The physical mechanism is the same category of process in both places; the numbers are not interchangeable.
4. The Energy–Water Link, Concretely
The operating Paks plant is the sharpest available illustration of what happens when a long-lived, capital-intensive infrastructure dependency meets a slowly accumulating hydrological trend that institutions were not tracking for that purpose. The plant’s cooling-water requirement is governed by three physically independent constraints: total discharge volume (never the binding constraint, since Danube flow remained orders of magnitude above the plant’s withdrawal even at the 2026 minimum), water temperature (a thermal-discharge limit, triggered in late June–early July 2026), and water level relative to intake pump submergence depth (a hydraulic/geometric limit, triggered separately in late July 2026) [1]. Public discussion of the 2026 episode largely treated these as one undifferentiated water shortage. They are not: the temperature constraint depends on discharge and ambient water temperature and is entirely unaffected by channel change; the pump-submergence constraint depends on the channel’s geometry directly, and is exactly the constraint the companion paper’s rating-curve finding bears on. Disentangling the two matters for anyone assessing how future risk to this or comparable infrastructure should be modeled: a purely climatic (discharge- and temperature-based) risk assessment would materially understate the hydraulic constraint’s exposure to a channel that has itself been changing independently of discharge for four decades.
5. What the Water Balance Actually Shows
A specific question dominated public discussion of the 2026 episode: whether upstream water management, particularly around the Gabčíkovo hydropower scheme on the Slovak–Hungarian border, retained water during the drought, worsening conditions in Hungary. This is a reasonable question to ask, and, unusually for a question of this kind, it turned out to be directly testable with public hydrological data rather than only debatable in the abstract.
The companion technical study investigated it directly, comparing discharge at a gauge genuinely upstream of the Gabčíkovo diversion point against the flow released into the historical river channel below it, across the 2018, 2022, and 2026 low-flow episodes, benchmarked against the historical relationship between the two [1]. The result runs counter to the retention hypothesis: in each episode examined, the share of flow released into the historical channel was at or above (never below) what the historical relationship would predict, and Hungary’s own water authority separately confirmed that the Gabčíkovo plant was operating at sharply reduced capacity (one of eight turbines) during the most acute period of the 2026 drought, with more water passing into the historical channel than into the power canal, a reversal of the typical operating pattern. A further check specifically addressed whether upstream reservoirs had been filled over the preceding winter for later release: winter 2025–2026 inflow at the true upstream reference stations was itself unusually low, among the lowest of the past eight winters, with a flow-conditional z-score of roughly against the historical winter baseline, where a storage-and-release explanation would require the opposite sign. No meaningful surplus, in other words, was available to have been stored in the first place. The elevated flow share observed in the historical channel during spring and summer 2026 is better explained as a reallocation between the two channels within an already-reduced total flow budget than as the release of banked water.
None of this speaks to intent, and it does not rule out every possible upstream management question: reservoir-level data for the Gabčíkovo/Hrušov impoundment itself was not available in any public source consulted, and remains the one piece of direct evidence that could close this question completely. But on the evidence obtainable from public hydrological records, the 2026 shortfall at the Hungarian border already existed at the true upstream reference stations, at a severity Pavla Pekárová of the Slovak Academy of Sciences’ Institute of Hydrology characterized as unprecedented since observations began in 1876 [15], and it propagated to Paks essentially proportionally. The most defensible reading is that 2026 was a genuine, region-wide hydrological deficit, not a downstream-specific or cross-border-management-specific one.
Independent, non-hydrological evidence points the same way, and extends the picture beyond the Danube itself. The same “no surplus to bank” signature found for the Gabčíkovo system also held on the Alpine side of the wider catchment: winter 2025–2026 inflow was anomalously low, not high, on the Salzach (, matched almost exactly by the neighboring Inn), a tributary carrying major seasonal-storage hydropower infrastructure, arguing against reservoir-timing explanations there as well [16]. Satellite gravimetry from the GRACE and GRACE-FO missions shows a persistent Central European terrestrial water-storage deficit that reached roughly 25 billion tonnes by the end of 2025, up from roughly 10 billion tonnes at the end of 2023, alongside 2025 precipitation about 18% below the long-term average [17]. Figure 2 shows this deficit as the instrument itself sees it: a coherent storage deficit centred squarely on the Danube basin and the Carpathian region (Figure 2a), and a regional storage history in near-uninterrupted deficit since 2018, in which September 2025 essentially matched the 2022 record low and the following winter, the season in which storage should recover to its annual maximum, failed to return to baseline (Figure 2b). This confirms the deficit into winter 2025–2026, but not, by itself, through summer 2026: GRACE’s own processing lag means the mission’s mascon data reach only mid-May 2026 as of this writing. The extension through summer 2026 rests instead on a faster, independent, non-GRACE proxy: the Copernicus Climate Change Service’s monthly climate bulletins, which track soil moisture, precipitation, and river flow in near-real time and explicitly name a dry signal over the Danube basin, Hungary, and neighboring countries persisting and intensifying from April through June 2026 [18,19,20]. We flag this distinction because it matters for how much weight the claim can bear: the “through summer 2026” reading is corroborated by a different instrument than GRACE itself, not measured by GRACE directly.
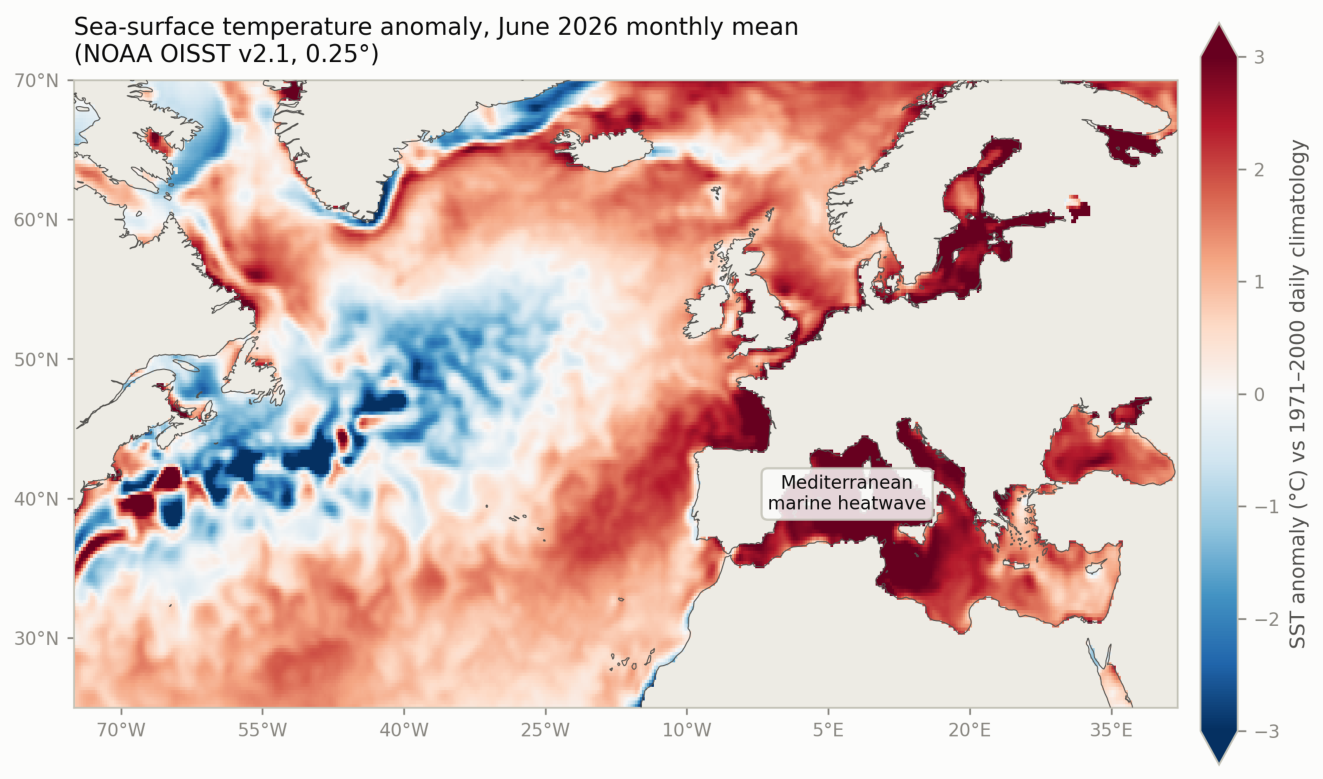
A plausible, though not yet formally attributed, atmospheric mechanism sits behind both signals. Sea-surface temperatures across the North Atlantic and Mediterranean were unusually warm through the same period (Figure 3): more than 1°C above average across large areas in February 2026, and the warmest extra-polar-ocean June on record in 2026 (20.86°C, extra-polar oceans 60°S–60°N) [22,23]. Persistently warm sea-surface temperature of this kind is known to support the anticyclonic blocking patterns that divert the Atlantic storm track away from Central Europe, a mechanism with a documented precedent in the 2022 European drought [24], and Copernicus’s own bulletins independently describe a “persistent anticyclonic pattern centred over the western part of the continent” through spring 2026 [18]. But as of this writing no 2026-specific attribution study linking this year’s sea-surface-temperature anomaly to the Central European drought via blocking had been published: the mechanism is real and precedented, the specific-event attribution is not yet established, and the two should not be conflated. We note also, because the distinction is easy to lose in a paragraph about ocean temperature and European drought, that this warm-water signature is not evidence of a weakening Atlantic Meridional Overturning Circulation (AMOC): the AMOC-weakening fingerprint is a cold subpolar North Atlantic anomaly, the opposite pattern from what was observed here (Figure 3), and we do not invoke that hypothesis.
Together with the discharge evidence above, the satellite and oceanographic record adds an independent line of support for the same conclusion, that is, that 2026 was a genuine, widespread hydrological deficit, from an instrument that depends on no gauge, reservoir operator, or national reporting system. That independence is itself an illustration of this piece’s argument: the clearest confirmation of a regional water-balance question came from outside the institutional structures whose job it nominally is to answer it.
We report this finding not to close the cross-border conversation, but because it illustrates the same institutional pattern from a different angle: in the absence of routine, shared, cross-border hydrological monitoring and reporting, a plausible but, on the available evidence, unsupported narrative filled the space where verified information should have been, in both directions. Integrated water management is consequently not solely a domestic governance question; it also has a transboundary information dimension that a purely national planning framework cannot supply.
6. What Integrated Management Would Require
None of the individual pieces of institutional infrastructure needed to have avoided treating the 2026 episode as a surprise are missing by accident; they are missing because the planning instruments that exist were built for narrower purposes. Hungary’s river basin management plans are, by design and by EU Water Framework Directive structure, surface-water instruments; they are not required to, and do not, incorporate a joint surface-water/groundwater risk assessment for a specific piece of energy infrastructure, let alone a cross-border hydrological monitoring and reporting framework of the kind that would have made Section 5’s water-balance question a matter of routine public record rather than something requiring a dedicated retrospective analysis. Groundwater monitoring, separately, is not typically evaluated jointly with surface-water infrastructure risk. Neither instrument, on its own, was the wrong tool; neither was ever the right tool for this specific, cross-cutting question.
Building the right tool is beyond the scope of this Perspective, and we deliberately do not prescribe a specific institutional design. We will note, because it bears directly on whether any such instrument gets built rather than merely proposed, that integrated planning of this kind requires sustained institutional investment and cross-agency (and in this specific case, cross-border) coordination over a period of years; that is, it requires a degree of policy continuity and institutional stability that is itself a precondition for the outcome, not a detail of implementation. We raise this once, plainly, and leave it there.
7. Conclusion
The 2026 Paks episode is best understood not as an isolated infrastructure incident but as a legible instance of a broader and recurring pattern in Hungarian water management: physically connected risks, tracked by separate institutions using separate instruments, that surface as surprises precisely at the boundary those institutions do not share. A river-channel change that an already-available diagnostic could have detected years earlier, a regional groundwater decline documented since the late 1970s, and a decade-old design-basis statistic for the separate Paks II project left unrevised while the plant it protects has not yet been built, are three expressions of the same underlying gap: a statistically legible risk, an existing diagnostic capable of catching it, and no institutional step that actually applied the one to the other. Closing it does not require resolving every open scientific question. In particular, the relationship, if any, between the specific river-channel finding reported here and the region’s broader groundwater trend remains genuinely open, and should stay that way until it is actually established rather than assumed. It does require treating Hungary’s surface water and groundwater, and the infrastructure and agriculture that depend on both, as the one connected system the underlying hydrology already shows them to be.
Author Contributions
For this single-author Perspective, the following CRediT statement applies: Conceptualization, Z.Z.F.; Writing—Original Draft Preparation, Z.Z.F.; Writing—Review and Editing, Z.Z.F.; Visualization, Z.Z.F. Specifically, the author conceived the institutional-gap framing developed across Section 2–6; synthesized findings from the companion technical article [1] together with the independent groundwater, satellite-gravimetry, and climate-monitoring literature cited throughout; designed and produced Figure 1, Figure 2 and Figure 3; and wrote and revised the manuscript in full. The author has read and agreed to the published version of the manuscript.
Data Availability Statement
This Perspective is a synthesis piece and generates no new primary data of its own. It draws on: (i) the companion technical article [1], whose underlying discharge and water-level records and analysis scripts are described in that article’s own Data Availability Statement and will be archived on Zenodo; (ii) publicly available reports and statements cited throughout (the Paks II environmental impact study [9]; Hungary’s river basin management plan [2]; IAEA safety-standard and press-release material [11,12,13]; and the satellite-gravimetry and climate-bulletin sources [17,18,19,20,22,23]). Figure 1 is an original schematic (not a reproduction of any source figure). Figure 2 and Figure 3 are original maps computed from publicly available datasets: the GravIS GFZ RL06 Level-3 terrestrial water storage grid, version 0006 [21] (https://isdc-data.gfz.de/grace/GravIS/GFZ/Level-3/TWS/), and the NOAA/NCEI 0.25° daily Optimum Interpolation SST analysis, version 2.1 [25] (https://www.ncei.noaa.gov/data/sea-surface-temperature-optimum-interpolation/v2.1/), with public-domain Natural Earth basemap layers. The scripts used to generate all three figures are archived alongside the companion article’s analysis code on Zenodo (see [16]).
Acknowledgments
The author gratefully acknowledges the following institutions for making the hydrological, satellite, and climate-monitoring records that inform this Perspective publicly available: the German Research Centre for Geosciences (GFZ Potsdam), for GRACE/GRACE-FO satellite gravimetry on Central European terrestrial water storage; the Copernicus Climate Change Service (C3S), implemented by ECMWF, for near-real-time precipitation, soil-moisture, and river-flow climate bulletins; the International Atomic Energy Agency (IAEA), for safety-standard guidance and Operational Safety Review Team reporting on periodic safety review; Mercator Ocean International, for ocean-temperature bulletins; NOAA’s National Centers for Environmental Information, for the daily Optimum Interpolation SST analysis used in Figure 3; and MVM Paks II Zrt. and MVM Paksi Atomeromu, for the publicly available environmental impact study and operational notices cited throughout. The author further acknowledges the Slovak Academy of Sciences’ Institute of Hydrology for the public statement on the 2026 Danube low-flow record cited in Section 5.
Conflicts of Interest
The author declares no conflicts of interest.
References
- Fehér, Z.Z. Riverbed Degradation Compounds Low-Flow Risk to Nuclear Cooling-Water Availability: A Four-Decade Stage–Discharge Analysis at Paks, Danube River, Hungary, forthcoming. Companion Tech. Artic. Cite With Final Venue/status Once Submitt.
- VGT3. Magyarország 2021. évi vízgyujto-gazdálkodási terve [Hungary’s 2021 River Basin Management Plan]. Technical report, Adopted by Government Resolution 1242/2022 (IV. 28.). 2022.
- Fehér, Z.Z. Large-scale geostatistical modeling of shallow groundwater time series in the Southern Great Plain. PhD thesis, University of Szeged, 2019. [Google Scholar]
- Tran, H.Q.; Fehér, Z.Z.; Túri, N.; Rakonczai, J. Climate Change as an Environmental Threat on the Central Plains of the Carpathian Basin Based on Regional Water Balances. Geogr. Pannonica 2022, 26, 184–199. [Google Scholar] [CrossRef]
- Zsuffa, I.; Szollosi-Nagy, A.; Bogárdi, J. Insula Insolita – Szigetköz és Bos-Nagymaros párhuzamos története [Insula Insolita – Parallel history of the Szigetköz area and the Gabčíkovo-Nagymaros Barrage Scheme]. Hidrológiai Közlöny 2023, 103, 4–23. [Google Scholar] [CrossRef]
- Tóth, J. A theoretical analysis of groundwater flow in small drainage basins. J. Geophys. Res. 1963, 68, 4795–4812. [Google Scholar] [CrossRef]
- Tóth, J. Gravitational Systems of Groundwater Flow: Theory, Evaluation, Utilization; Cambridge University Press, 2009. [Google Scholar]
- Rónai, A. The Quaternary of the Great Hungarian Plain. Geologica Hungarica 1985, 21, 426–436. [Google Scholar]
- MVM Paks II Zrt. Environmental Impact Study, Chapter 11: Modelling of the Danube River Morphology and Danube Heat Load (PAKSII_KHT_11_Dunamodell_EN). Technical report, Prepared for the Paks II site licensing process; environmental impact assessment study compiled by MVM ERBE Zrt. on behalf of MVM Paks II Zrt.; English translation published for the Espoo Convention transboundary consultation via Austria’s Umweltbundesamt; 2014. [Google Scholar]
- Milly, P.C.D.; Betancourt, J.; Falkenmark, M.; Hirsch, R.M.; Kundzewicz, Z.W.; Lettenmaier, D.P.; Stouffer, R.J. Stationarity Is Dead: Whither Water Management? Science 2008, 319, 573–574. [Google Scholar] [CrossRef] [PubMed]
- International Atomic Energy Agency (IAEA). Periodic Safety Review for Nuclear Power Plants. Technical report. IAEA IAEA Safety Standards Series No. SSG-25, Vienna, 2013. [Google Scholar]
- International Atomic Energy Agency (IAEA). IAEA Mission Says Hungary’s Paks Nuclear Power Plant Has Strengthened Safety, Recommends Continued Improvement, 2024. Press release on the Operational Safety Review Team (OSART) mission conducted 4–21 November 2024. [CrossRef]
- Paksi Atomeromu, M.V.M. Several good practices identified by international review at Paks NPP, 2024. 2024. [Google Scholar] [CrossRef]
- Molnár, S.; Baranya, S.; Török, G.T. A medersüllyedés okai és hidrológiai következményei a magyarországi Duna-szakaszon [Causes and hydrological consequences of riverbed subsidence on the Hungarian Danube reach]. In Proceedings of the Proceedings of the 43rd Vándorgyulés of the Hungarian Hydrological Society, 2026. [Google Scholar]
- Pekárová, P. Statement (Slovak Academy of Sciences, Institute of Hydrology) on the 2026 Danube low-flow record at Bratislava/Devín. Distributed via TASR, 30 July 2026, 2026. Available online: https://sav.sk/?doc=services-news&lang=sk&news_no=13825&source_no=20.
- Fehér, Z.Z. Analysis scripts and supplementary data: Paks Danube rating-curve provenance and companion analyses Includes the Bratislava/Nóvý Most 1900–2024 changepoint analysis, the Tisza provenance and trend check, and the Bavarian Danube, Salzach, and Inn discharge and GRACE/Copernicus/SST corroboration. Insert DOI. Zenodo, 2026. [Google Scholar]
- GFZ Potsdam (German Research Centre for Geosciences). Press release: Long-term changes in global water storage [Weltwassertag: langfristige Veränderungen der globalen Wasserspeicherung], 2026. Published 21 March 2026. [PubMed]
- Copernicus Climate Change Service (C3S). Precipitation, relative humidity, and soil moisture for April 2026. Implemented by ECMWF, 2026. [Google Scholar]
- Copernicus Climate Change Service (C3S). Precipitation, relative humidity, soil moisture and river flow for May 2026. Implemented by ECMWF, 2026. [Google Scholar]
- Copernicus Climate Change Service (C3S). Precipitation, relative humidity, soil moisture and river flow for June 2026. Implemented by ECMWF, 2026. [Google Scholar]
- Boergens, E.; Dobslaw, H.; Dill, R. GFZ GravIS RL06 Continental Water Storage Anomalies. V. 0006. GFZ Data Services, 2019. Gridded Level-3 product; the version 0006 grid used here extends through April 2026. [CrossRef]
- Mercator Ocean International. Ocean Temperature Bulletin, February 2026, 2026. [CrossRef]
- Copernicus Climate Change Service (C3S). Copernicus: Record heatwave brings hottest June for western Europe during second-warmest June globally, 2026. Published 9 July 2026. [PubMed]
- Faranda, D.; Pascale, S.; Bulut, B. Persistent anticyclonic conditions and climate change exacerbated the exceptional 2022 European-Mediterranean drought. Environ. Res. Lett. 2023, 18, 034030. [Google Scholar] [CrossRef]
- Huang, B.; Liu, C.; Banzon, V.; Freeman, E.; Graham, G.; Hankins, B.; Smith, T.; Zhang, H.M. Improvements of the Daily Optimum Interpolation Sea Surface Temperature (DOISST) Version 2.1. J. Clim. 2021, 34, 2923–2939. [Google Scholar] [CrossRef]
Figure 1.
The same institutional-gap pattern recurs across three independent cases: an already-declining river channel at Paks (Section 2.1), a regionally documented aquifer decline (Section 2.2), and a decade-old, unrevised design-basis statistic computed for the separate, still-under-construction Paks II project (Section 2.3). In each, a risk legible in existing data met a diagnostic or mechanism already capable of catching it, without an institutional step connecting the two before the 2026 episode.
Figure 1.
The same institutional-gap pattern recurs across three independent cases: an already-declining river channel at Paks (Section 2.1), a regionally documented aquifer decline (Section 2.2), and a decade-old, unrevised design-basis statistic computed for the separate, still-under-construction Paks II project (Section 2.3). In each, a risk legible in existing data met a diagnostic or mechanism already capable of catching it, without an institutional step connecting the two before the 2026 episode.
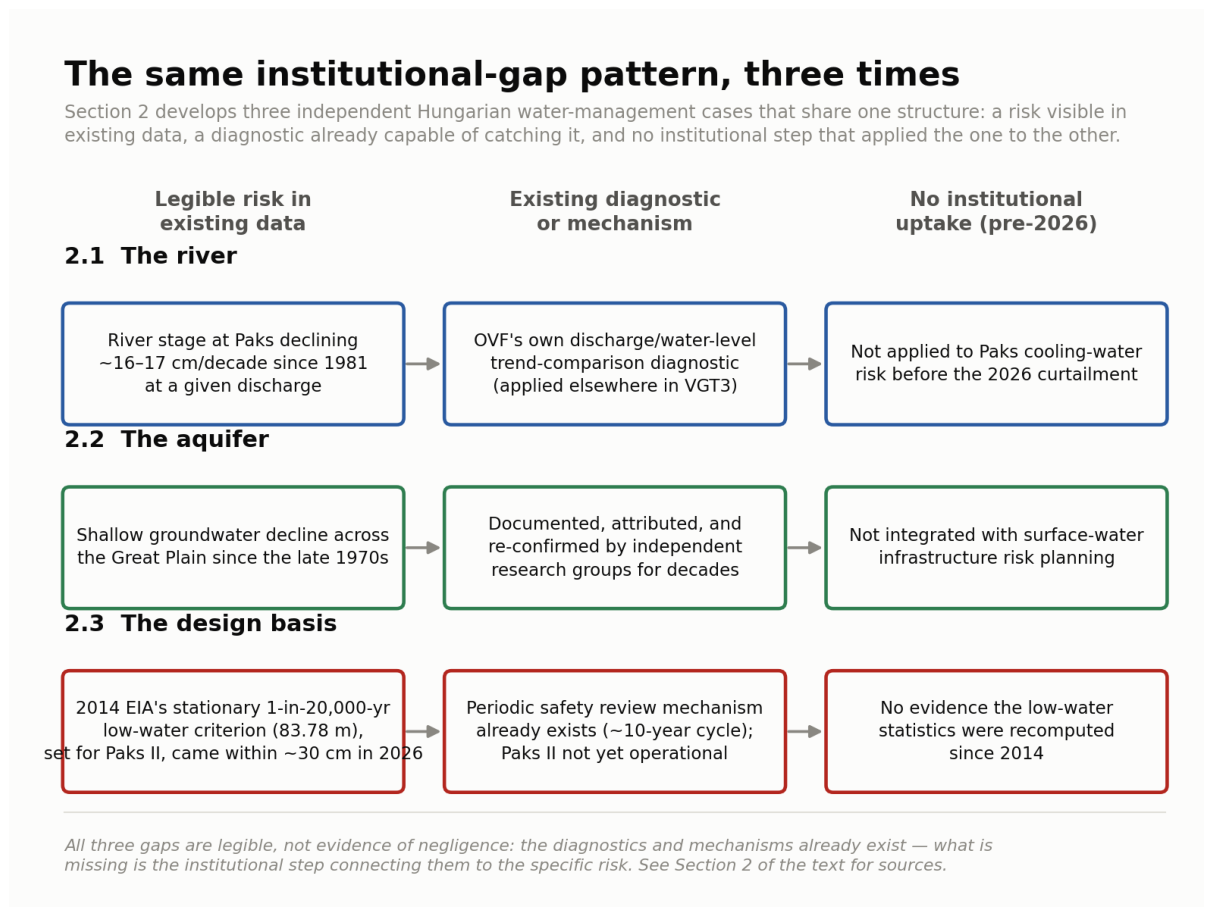
Figure 2.
The 2025–2026 Central European water deficit as seen by satellite gravimetry. (a) GRACE-FO terrestrial water storage (TWS) anomaly, mean of the November 2025–April 2026 monthly solutions (the last six available as of this writing) relative to the 2002–2020 product baseline (GravIS GFZ RL06 Level-3 grid, version 0006) [21]; the Danube course and Paks are marked. (b) Area-weighted mean TWS anomaly over the dashed box in (a) (8–23°E, 44–51°N), 2002–2026. The region has been in near-uninterrupted storage deficit since 2018; September 2025 ( cm equivalent water height) essentially matched the 2022 record low of the series ( cm), and the following winter, the season in which storage should recover to its annual maximum, remained 10–15 cm below baseline, the same persistent deficit GFZ reported as roughly 25 billion tonnes for Germany/Central Europe by end-2025 [17]. The record ends at April 2026 because of the mission’s processing lag; the extension through summer 2026 rests on the independent Copernicus record discussed in the text.
Figure 2.
The 2025–2026 Central European water deficit as seen by satellite gravimetry. (a) GRACE-FO terrestrial water storage (TWS) anomaly, mean of the November 2025–April 2026 monthly solutions (the last six available as of this writing) relative to the 2002–2020 product baseline (GravIS GFZ RL06 Level-3 grid, version 0006) [21]; the Danube course and Paks are marked. (b) Area-weighted mean TWS anomaly over the dashed box in (a) (8–23°E, 44–51°N), 2002–2026. The region has been in near-uninterrupted storage deficit since 2018; September 2025 ( cm equivalent water height) essentially matched the 2022 record low of the series ( cm), and the following winter, the season in which storage should recover to its annual maximum, remained 10–15 cm below baseline, the same persistent deficit GFZ reported as roughly 25 billion tonnes for Germany/Central Europe by end-2025 [17]. The record ends at April 2026 because of the mission’s processing lag; the extension through summer 2026 rests on the independent Copernicus record discussed in the text.
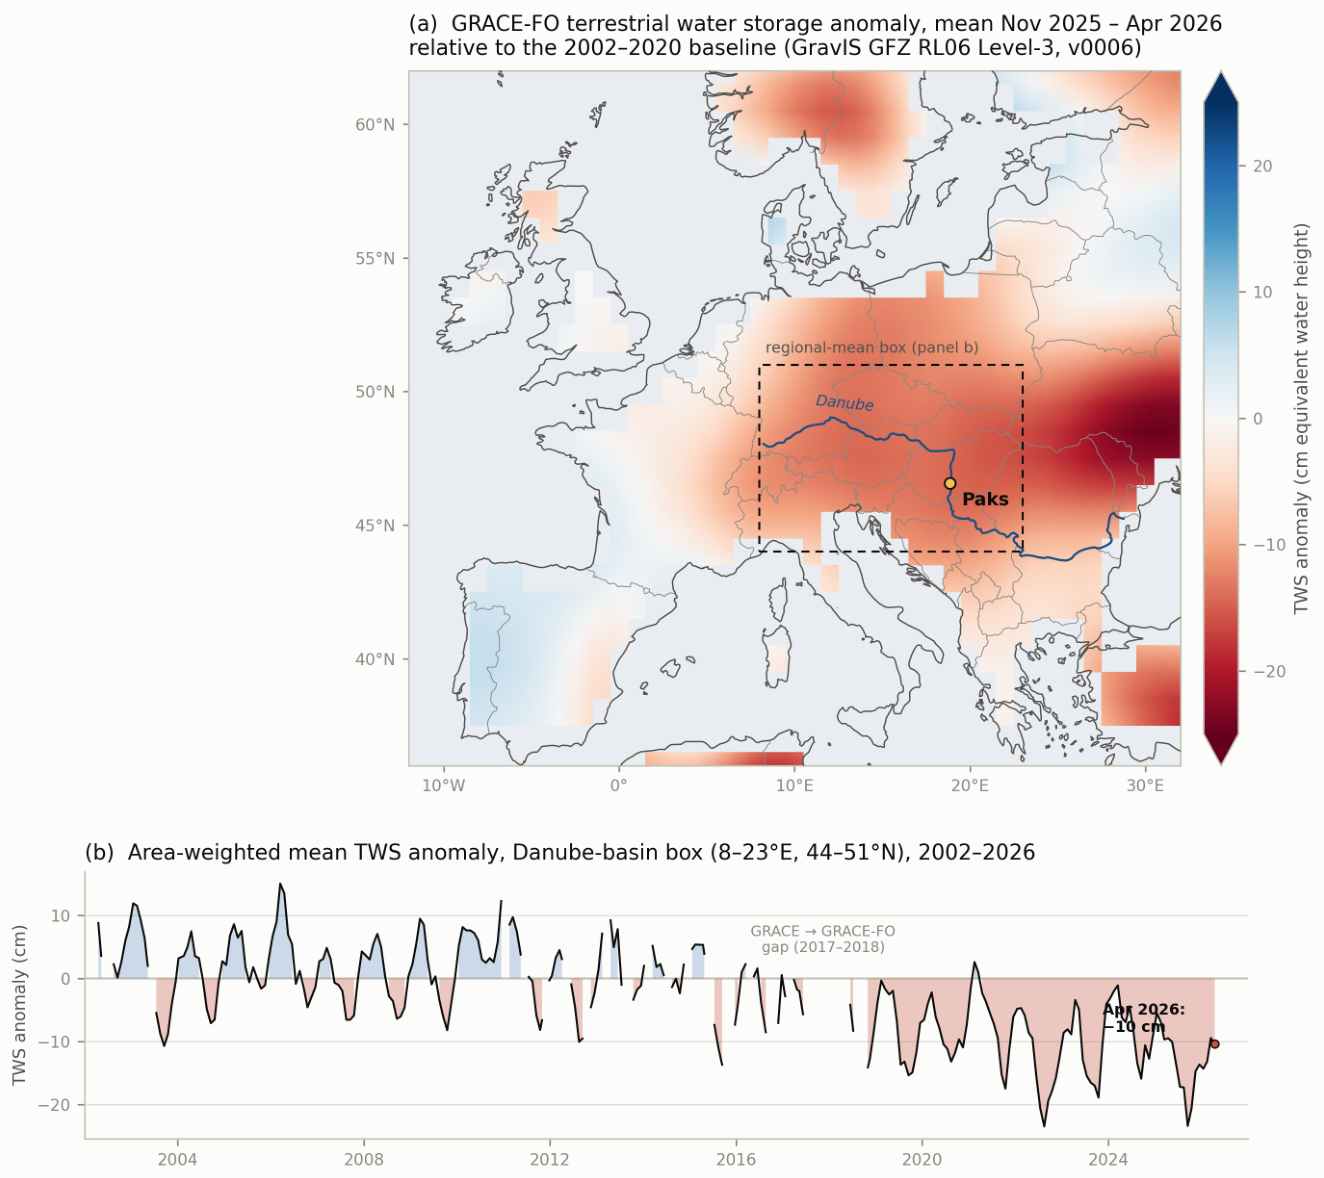
Figure 3.
Sea-surface temperature anomaly, June 2026 monthly mean, computed from the daily NOAA OISST v2.1 0.25° analysis (anomalies relative to the product’s 1971–2000 daily climatology) [25]. The eastern North Atlantic approaches to Europe and the entire Mediterranean, where the basin-mean June anomaly is about +2.5 °C, are strongly warm, the configuration known to support the persistent anticyclonic blocking that diverts the Atlantic storm track away from Central Europe [24]; June 2026 was the warmest extra-polar-ocean June on record [23]. Note also what the map does not show: the subpolar gyre (50–62°N, 45–15°W) averages +0.15 °C in this field, near-neutral rather than anomalously cold, so the observed pattern is not the persistent cold subpolar anomaly that is the fingerprint of AMOC weakening; the cooler patch in the west-central Atlantic sits along the Gulf Stream–North Atlantic Current path, south and west of where that fingerprint would be centred.
Figure 3.
Sea-surface temperature anomaly, June 2026 monthly mean, computed from the daily NOAA OISST v2.1 0.25° analysis (anomalies relative to the product’s 1971–2000 daily climatology) [25]. The eastern North Atlantic approaches to Europe and the entire Mediterranean, where the basin-mean June anomaly is about +2.5 °C, are strongly warm, the configuration known to support the persistent anticyclonic blocking that diverts the Atlantic storm track away from Central Europe [24]; June 2026 was the warmest extra-polar-ocean June on record [23]. Note also what the map does not show: the subpolar gyre (50–62°N, 45–15°W) averages +0.15 °C in this field, near-neutral rather than anomalously cold, so the observed pattern is not the persistent cold subpolar anomaly that is the fingerprint of AMOC weakening; the cooler patch in the west-central Atlantic sits along the Gulf Stream–North Atlantic Current path, south and west of where that fingerprint would be centred.
Disclaimer/Publisher’s Note: The statements, opinions and data contained in all publications are solely those of the individual author(s) and contributor(s) and not of MDPI and/or the editor(s). MDPI and/or the editor(s) disclaim responsibility for any injury to people or property resulting from any ideas, methods, instructions or products referred to in the content. |
© 2026 by the author. Licensee MDPI, Basel, Switzerland. This article is an open access article distributed under the terms and conditions of the Creative Commons Attribution (CC BY) license.
Copyright: This open access article is published under a Creative Commons CC BY 4.0 license, which permit the free download, distribution, and reuse, provided that the author and preprint are cited in any reuse.