

Submitted:
02 August 2026
Posted:
04 August 2026
You are already at the latest version
Abstract
The relationship between public education spending and economic growth remains contested in developing economies, where quality, not just quantity, of investment may matter most. This study examines whether public education expenditure has driven economic growth in Egypt over 1980-2023, addressing the under-studied role of edu-cation quality and structural breaks linked to major reforms. Using the Autoregressive Distributed Lag (ARDL) bounds testing approach with Zivot-Andrews structural break and CUSUM/CUSUMSQ stability tests, the study models short- and long-run effects of education expenditure on GDP growth, controlling for capital formation, labor par-ticipation, trade openness, and foreign investment, and incorporating quality proxies such as student-teacher ratios and completion rates. The bound F-statistic (6.23) con-firm long-run cointegration, and the error-correction coefficient (-0.835, p< 0.01) indi-cates rapid adjustment to equilibrium. Physical capital is the strongest driver of long-run growth, while education expenditure shows a weakly negative long-run as-sociation (significant at 10%), suggesting allocative inefficiency rather than absent re-turns; quality proxies show significant adjustment effects. Stability tests confirm the long-run relationship is structurally invariant once short-run dynamics are accounted for. Improving the efficiency and quality of education spending, rather than its volume, thus appears essential for Egypt to advance Vision 2030, SDG 4, and SDG 8.
Keywords:
public education expenditure
; economic growth
; Egypt
; ARDL bounds testing
; human capital
; structural breaks
; education quality
; endogenous growth
; Egypt vision 2030
; SDG 4
1. Introduction
Education, often repackaged as human capital accumulation, productivity enhancement and sustainable growth are considered the key to economic development and social progress (Barro, 1991; Lucas, 1988; Romer, 1990). For many developing economies like Egypt, strategic investment in education represents not only a social imperative but also an essential economic policy instrument for achieving structural transformation, poverty reduction and long-term competitiveness in an increasingly knowledge-based global economy. Although the Egyptian population exceeds 105 million (as of 2023) and the population under 30 is more than 60 percent youth, these characteristics provide both unique challenges and opportunities for leveraging education for economic advancement.
The education system of Egypt continues to be plagued by long-standing issues including low quality, inequity, and misalignment with the job market, despite substantial increases in public funding for education (World Bank, 2023). The Egyptian education system educates more than 25 million children from early childhood through tertiary education and receives the vast majority of its funding through public sector financing. As such, the ongoing debate regarding the efficiency and effectiveness of investment in education and how they produce economic benefits, including GDP growth and improvements to productivity, remains unresolved.
The Egyptian economy has undergone significant structural transformations over the past four decades, including economic liberalization in the 1990s (Infitah policies), the 2011 revolution and subsequent political transitions, currency devaluation episodes, and the comprehensive economic reform program initiated in 2016 in partnership with the International Monetary Fund (Elseraty & Elseraty, 2025).The structural changes in Egypt’s economy have created a number of different periods of time within Egypt’s overall economic journey. These different time periods may have influenced the impact of education on overall economic growth differently. In addition to this, Egypt has made a commitment to achieve its Vision 2030; an international strategy focused on the comprehensive transformation of Egypt into a knowledge-based, competitive economy through education and sustainable development. Therefore, at the heart of all national development strategies are education and SDG’s (Sustainable Development Goals) established by the United Nations for quality education (4th SDG) and SDG 8 (Decent Work and Economic Growth).
This paper is motivated by three paradoxes surrounding education investment and economic growth in Egypt. First, despite the constitutional commitment to allocate at least 4% of GDP to pre-university education (Article 19, 2014 Constitution), actual public expenditure on education has declined to approximately 1.7% of GDP and 5.3% of total government expenditure in the 2024/25 budget - among the lowest in the region (World Bank, 2024) - yet Egypt continues to perform poorly in international assessments such as TIMSS and PIRLS. Second, despite the expansion of higher education enrollment, the youth unemployment rate (ages 15-24) remains elevated at approximately 19% in 2023-2024 (World Bank, 2024), substantially above the world average of 15.7%. This would suggest a disconnection between education output and the labor market demand. Third, there are noticeable differences regarding access to education and quality of education between urban and rural areas in Egypt as well as between governorates located in different regions of the country; thus raising questions on efficiency of allocation to education.
It is important to conduct extensive empirical research on how or if Education spending aids Economic Growth in Egypt. Factors of quality also must be considered in addition to volume. Discovering this relationship will allow policymakers to develop and implement evidence-based policies. They will also be able to optimally allocate resources to achieve their goals under Vision 2030.
For many years, there has been an emphasis placed on the relationship between education and economic growth as a significant focus of research in development (particularly from theoretical and empirical standpoints). It is generally assumed within the traditional framework that there is a strong link between levels of investment in education and the long-term performance of the economy. However, several empirical examples of developing countries exist where the authors find evidence that contradicts the assertion that a higher level of investment in education results in a higher level of long-term economic performance, or do not provide any significant impact on long-term growth. This paper will examine these discrepancies in literature (gaps) to demonstrate the need for this study using a combination of theoretical support combined with international and empirical data from Egypt and other international empirical studies to support the reason for this study.
Human capital theory is a key theoretical framework for explaining the relationship between education and economic growth; in particular, the early works of Schultz and Becker (Schultz, 1961; Becker, 1964) are cited frequently. Under this approach, education is thought of as a kind of investment in an individual’s skill set, knowledge, and productivity; thus, when the workforce becomes more productive, there will be an increase in aggregate output due to a more efficient supply of labor. Some of the ways through which education can boost an individual’s productivity and earning potential include improving cognitive functioning, increasing technological skill development and familiarity with current trends, and increasing the capacity to adapt to changes in the economy, including technological and structural changes. In addition to human capital theory, the theory of endogenous growth expands on this notion through a more formalized approach to showing how the level of education and skills available in a workforce support the long-term economic growth of an economy. Lucas (1988) identified human capital accumulation as a primary driver of long-term growth, noting that the positive externalities resulting from education are greater than those seen by the individual receiving the education. Individuals who work with educated employees benefit from increased productivity through the additional knowledge they receive from their peers; consequently, the added productivity of these employees can enhance their own productivity while also providing them with access to new technologies. Furthermore, as explained by Romer (1990), human capital plays a fundamental role in innovation and research, stating that a well-educated workforce enhances technological advancement and supports persistent economic growth.
Empirically, however, cross-country studies have produced divergent and sometimes contradictory results (Bils & Klenow, 2000; Psacharopoulos & Patrinos, 2002). Early studies such as Barro (Barro, 1991) show some type of positive correlation between education measurements and economic growth, based on large aggregate datasets from multiple countries. After this initial literature, the findings have been challenged on their robustness. An example of this can be seen Benhabib and Spiegel (Benhabib & Spiegel, 1994) who found that the education and growth relationship was much weaker after accounting for country-specific fixed effects and structural heterogeneity. In more recent works, Hanushek and Woessmann (2007, 2012) have made progress in distinguishing education quality (measured by cognitive skill levels) from education quantity (measured by years of schooling, gross enrollment rate). Results indicate that growth rates are more correlated with learning outcomes and cognitive performance rather than the number of years of schooling completed. Therefore, the comparative effectiveness of education systems is more important than merely increasing the number of people who enroll in school.
When examining how education impacts economic growth in the Middle East and developing countries, the available evidence indicates that institutional quality, labour force absorption and the alignment of labor market demand with education-output construction are major determinants. This perspective is particularly relevant for Egypt, where structural constraints may prevent educational investment from translating into productive economic outcomes.
Despite Egypt’s demographic importance and long-standing development challenges, Egypt-specific empirical research remains relatively limited compared to global literature. According to (Mabrouki, 2022), an analysis of the period from 1990 to 2022 showed that human capital was positively associated with economic growth under normal conditions, but the association decreased during periods of crisis. The methodology used in the study was relatively simple and did not adequately account for the econometric issues associated with endogeneity, structural breaks and short-term dynamic adjustment of the two variables over time. Meanwhile, international assessments of Egypt’s education system by World Bank (2019-2023) continue to identify substantial deficiencies in the quality of education, including large class sizes, a shortage of qualified teachers, outdated course materials and a lack of vocational and technical training; each of these issues may reduce or inhibit the effect of education on promoting more rapid economic growth.
Recent research about Egypt has provided more clarity. For example, Albagoury )2026) used an ARDL model to investigate the relationship between education and growth in Egypt from 2002 to 2023 within the framework of the Sustainable Development Goals (SDG 4: Quality Education). Although they found a long-term relationship between economic growth and education indicators, there were differences in the estimated effects of different levels of education on economic growth with secondary education enrolments having a negative effect (due to potential mismatch between education outcomes and job requirements) and government expenditure on education being weakly negatively related (indicating that spending is not efficient). This supports the idea that education in Egypt will not automatically create economic growth unless we can improve the quality, governance and integration of the labor market.
Additionally, research from comparable surrounding cases also indicates that funding for public education should be one of the main variables in forming policy concerning education. Ahmadini, et al. (2025) used a panel method approach and a machine-learning-based method to analyse the data of all Gulf countries from 1980 until 2022 and found a statistically significant relationship between public education expenditures and GDP. While this study does not solely focus on Egypt, it offers evidence that supports the larger economic argument related to human capital and therefore indicates that, when the conditions are met (i.e., having the right economic and institutional factors), the macroeconomic returns to educational spending can be highly significant. Comparable evidence from other developing-country contexts reinforces this conclusion: Mekdad, Dahmani, and Louaj (2014) document a causal link between public education spending and growth in Algeria; Mallick, Das, and Pradhan (2016) find significant positive effects of educational expenditure on growth across major Asian economies; and Tran (2023) reports similar patterns for ASEAN countries. Cooray (2009) likewise emphasises that the role of education in growth is conditional on both quantity and quality dimensions, a theme central to the present study.
Overall, the literature reveals three critical gaps. First, studies focused on Egypt are limited and do not often use comprehensive econometric examinations of time series dynamics, structural breaks and endogeneity. Second, much of the available evidence uses education quantity indicators, whereas the role of education quality is much less explored in Egypt because there are no suitable data available to study it. Finally, there appears to be much uncertainty surrounding whether public education spending is effective in Egypt, as this varies based on the education level, level of spending effectiveness, and the alignment with the labour market. Due to the above-listed deficits, the current research aims to perform a more thorough and policy relevant evaluation of the education-growth relationship in Egypt.
2. Theoretical and Conceptual Framework
This section develops the theoretical foundation underpinning our empirical analysis, drawing primarily on endogenous growth theory and human capital theory while incorporating Egypt-specific institutional and structural factors.
2.1. Augmented Solow Model with Human Capital
We begin with the augmented Solow model (Mankiw, Romer, & Weil, 1992) which extends the neoclassical growth framework by explicitly including human capital. The production function takes the form:
Y = A Kα Hβ L (1-α-β)
Where Y is total output, K is the physical capital stock, H is the human capital stock, L is the amount of raw labor, and A is Total Factor Productivity (TFP). The elasticities of output with respect to physical capital (K) and human capital (H) are defined by the parameters of α and β, respectively.
2.2. Endogenous Growth Theory and Education Externalities
Endogenous growth theory (Romer, 1990; Lucas, 1988) treats human capital and innovation as endogenous outputs of economic activity rather than exogenous shocks. In Lucas’s formulation, individuals choose how to allocate time between current production and skill accumulation, with the latter generating both private returns and social externalities through knowledge spillovers. In Romer’s framework, human capital directly enters the R&D sector, where it produces blueprints for new intermediate goods, sustaining long-run growth even in the absence of exogenous technical progress. For Egypt, this implies that the growth payoff to education depends not only on volumes of spending but on whether the system produces graduates capable of generating, absorbing, and adapting technology — a margin that aligns directly with the COMPR and STR quality proxies used in this study.
2.3. Quality Versus Quantity of Education: A Conceptual Distinction
Hanushek and Woessmann (2012) show that cognitive skills — not years of schooling — explain the bulk of cross-country differences in growth rates. Following this distinction, our empirical specification proxies education quantity through public expenditure (LOG_EDEXP) and education quality through two complementary indicators: the primary completion rate (LOG_COMPR), capturing the system’s ability to retain and graduate students, and the student-teacher ratio (LOG_STR), capturing classroom intensity that conditions learning outcomes. This distinction is central to the paper’s identification strategy and motivates the dynamic decomposition presented in Section 4.
2.4. Hypotheses
Building on the framework above, we test the following hypotheses: (H1) public education expenditure exerts a positive long-run impact on GDP growth in Egypt; (H2) education-quality proxies (LOG_COMPR, LOG_STR) carry stronger growth effects than expenditure alone; (H3) physical capital accumulation, labor force participation, and FDI act as complementary channels through which education affects growth.
3. Data and Variables
This section will detail the sources of data from different variables, how they were defined, how they were measured and provide descriptive statistics for all of the variables analyzed in the empirical analysis.
3.1. Sources of Data and Time Period
The analysis uses annual time series data for Egypt for the period 1980-2023 (44 observations). These data were obtained from a number of official data sources in order to produce reliable data and can be directly compared with one another at the international level.
3.2. Variable Definitions and Measurement
Table 1 presents detailed definitions of all variables, their measurement units, data sources, indicator codes where applicable, and expected signs based on theoretical framework.
4. Empirical Methodology
This section presents the econometric methodology employed to investigate the relationship between education expenditure and economic growth in Egypt. We employ a comprehensive multi-stage approach combining unit root tests with structural breaks, ARDL bounds testing, and multiple robustness checks.
4.1. Descriptive Statistics
Table 2 presents detailed descriptive statistics like Mean, Median, Maximum, Minimum, Standard deviation, Skewness, Kurtosis, as follows:
Mean and median values of most variables are almost equal, indicating that the distributions are near symmetrical with minimal effect due to extreme values. There are some variables with small variances between mean and median that indicate slight skewness. For example, the mean of GDPG, LOG_GCF, LOG_TRADE, and LOG_FDI are slightly higher than their respective medians which reflects a small positive skewness, although conversely, the means for LOG_STR and LOG_COMPR are slightly lower than their respective medians indicating small negative skewness. Collectively, the variances are minimal reflecting a consistent distribution.
The variability of the different variables is expressed through their respective standard deviations which provide a clearer indication of how much they deviate from their means over time. The variable GDPG has the greatest standard deviation which indicates that there will be more variation in GDPG than any other variable within the dataset when looking at these historical records. In addition, most logarithmic variables (e.g., LOG_EDEXP, LOG_LFP, etc.) have very small standard deviations which demonstrate a relatively stable pattern/behavior through time.
There are no extreme outliers from the maximum and minimum range that can indicate an acceptable interval for each of the variables. The bounded ranges, mostly from the log-based variables, reveal that the variables were well-behaved and can be used as valid data sources for an economic analysis.
Small Skewness values, indicating distributions that are close to symmetry. LOG_FDI shows the highest positive skewness, suggesting occasional higher-than-average values, while LOG_STR and LOG_COMPR exhibit slight negative skewness. However, all skewness values remain within acceptable limits, implying no severe asymmetry.
The kurtosis values for each variable are closer to 3 or just under 3, indicating that there are no significant heavy outliers in any of the variables, and that, therefore, all of the variables are essentially similar to the normal distribution.
According to the Jarque-Bera test’s results show low levels of significance (P>0.05) for each of the variables being tested suggesting that we cannot reject the null hypothesis of normality. Therefore, it appears that all of these variable distributions are close to normally distributed, which helps substantiate the validity of conventional parametric econometric methods.
4.2. Unit Root Tests with Structural Breaks
Given Egypt’s significant structural changes over the study period (economic liberalization, political transitions, IMF reforms), standard unit root tests may be biased. We employ the Zivot-Andrews (1992) test which allows for one endogenous structural break in the series. The test identifies the break date that minimizes the one-sided t-statistic for testing α = 1 in the regression:
where is a dummy variable for a mean shift and DT_t captures a slope shift at the break date. The null hypothesis is that the series contains a unit root with drift, possibly with a break, against the alternative of trend stationarity with a break.
From table (3) the results indicate that the majority of variables are non-stationary at levels under most specifications, particularly when including a deterministic trend. For instance, GDPG fails to reject the null hypothesis of a unit root at level in several specifications, while becoming highly significant after first difference across both ADF and PP tests. Similarly, LOG_TRADE and LOG_FDI exhibit clear non-stationarity at levels, as evidenced by insignificant t-statistics and high p-values, but achieve strong stationarity at first difference (p-value = 0.00). Some variables such as LOG_EDEXP, LOG_STR, and LOG_LFP show significant test statistics at level under certain specifications, the overall evidence across different model forms suggests the presence of stochastic trends. But the consistency between ADF and PP results strengthens the findings and decreases concerns regarding serial correlation and heteroskedasticity biases.
Given Egypt’s substantial structural transformations during the study period (1980-2023) including economic liberalization in the 1990s, the 2011 political transition, the 2016 IMF-supported reform program, and subsequent exchange rate adjustments, we observed that traditional tests like ADF might be unreliable due to the volatile economic nature of Egypt during (1980-2023). Structural breaks can lead to the erroneous non-rejection of the unit root hypothesis when the time series is in fact trend-stationary around a break. To address this issue, the Zivot-Andrews (1992) test was employed, allowing for one endogenous structural break in either the intercept, the trend, or both. Inclusion of dummy variables captures potential shifts in means and dummies in coefficients can account for shifts in slopes. All of the results from ADF tests, PP tests and Zivot-Andrews tests suggest that all variables are stationary when tested after the first difference, indicating that the variables are integrated of order one, I(1). This finding is consistent with the behavior of macroeconomic time-series in emerging countries in which persistent random trends arise from structural reform, policy shocks, and exogenous shocks.
Consequently, since all variables are integrated of order one, the application of cointegration techniques like ARDL bounds testing approach or Johansen cointegration method is econometrically justified to investigate the existence of a long-run equilibrium relationship among the variables in the Egyptian context.

Table 3.
Unit Root Tests.
| indicator | (ADF) test | (PP) test | Order | ||||||
|---|---|---|---|---|---|---|---|---|---|
| Level | 1st Difference | Level | 1st Difference | ||||||
| variable | Constant & trend | constant | constant | None | Constant & trend | constant | constant | None | |
| GDPG | -3.621 | - 3.19 | -3.195 | -9.76 | -3.695 | -3.093 | -9.99 | -10.79 | I (1) |
| (0.04) | (0.03) | (0.03) | (0.00) | (0.03) | (0.035) | (0.00) | (0.00) | ||
| LOG_EDEXP | -5.32 | -3.38 | -9.76 | -9.83 | -5.32 | -3.195 | -21.34 | -14.17 | I (1) |
| (0.00) | (0.017) | (0.00) | (0.00) | (0.00) | (0.027) | (0.00) | (0.00) | ||
| LOG_STR | -7.02 | -0.21 | -6.61 | -11.06 | -7.69 | -2.55 | -26.65 | -14.79 | I (1) |
| (0.00) | (0.93) | (0.00) | (0.00) | (0.00) | (0.11) | (0.00) | (0.00) | ||
| LOG_COMPR | -7.87 | -1.798 | -5.34 | -1.21 | -7.93 | -1.56 | -21.42 | -11.398 | I (1) |
| (0.00) | (0.38) | (0.00) | (0.20) | (0.00) | (0.49) | (0.00) | (0.00) | ||
| LOG_GCF | -3.296 | -1.86 | -9.20 | -9.05 | -3.30 | -1.66 | -9.32 | -9.13 | I (1) |
| (0.08) | (0.3473) | (0.00) | (0.00) | (0.0798) | (0.44) | (0.00) | (0.00) | ||
| LOG_LFP | -7.12 | -0.64 | -6.76 | -9.02 | -20.63 | -2.04 | -32.91 | -11.24 | I (1) |
| (0.00) | (0.85) | (0.00) | (0.00) | (0.00) | (0.27) | (0.00) | (0.00) | ||
| LOG_TRADE | -2.69 | -2.14 | -11.32 | -11.46 | -4.85 | -4.32 | -11.32 | -11.46 | I (1) |
| (0.25) | (0.23) | (0.00) | (0.00) | (0.00) | (0.00) | (0.00) | (0.00) | ||
| LOG_FDI | -2.11 | -1.83 | -8.59 | -8.67 | -2.15 | -1.78 | -8.42 | -8.48 | I (1) |
| (0.53) | (0.36) | (0.00) | (0.00) | (0.50) | (0.38) | (0.00) | (0.00) | ||
Source: Calculated by the researchers using Eviews-13.
4.3. ARDL Bounds Testing Approach
The ARDL bounds testing approach is particularly appropriate for this study. The general ARDL specification for our model is:
The bounds test examines the null hypothesis of no cointegration (H₀: β₁ = β₂ = ... = β₁₀ = 0) against the alternative of cointegration. The F-statistic is compared to critical values provided by Pesaran et al. (2001). If the F-statistic exceeds the upper bound critical value, we reject the null and conclude cointegration exists. Our result in Table 4: the F-statistic (6.228301) exceeds upper bound at 10% and 5% and 1% significance level, indicating cointegration.
4.4. Diagnostic Tests
We conduct comprehensive diagnostic tests to ensure model validity: (1) Serial correlation test (Breusch-Godfrey LM test); (2) Heteroskedasticity test (Breusch-Pagan-Godfrey); (3) Normality test (Jarque-Bera); (4) Ramsey RESET test for specification error; (5) Stability tests (CUSUM and CUSUMSQ).
Table 5.
Diagnostic Tests.
| p-value | Value | Statistic of test | test |
|---|---|---|---|
| 0.6337 | 0.46495 | F-Statistic | B-G Serial Correlation LM Test |
| 0.4279 | 1.0672 | F-Statistic | Breusch-Pagan Godfrey |
| Heteroscedasticity Test | |||
| 0.637 | 0.9017 | Jarque-Bera | Normality Test |
| 0.1102 | 2.743 | F-Statistic | Ramsey RESET Test |
Source: Calculated by the researchers using Eviews-13
The results of the diagnostic tests presented in the table (5) confirm: First, the Breusch–Godfrey Serial Correlation LM Test reports a p-value of 0.6337, which is greater than the 5% significance level. Therefore, we fail to reject the null hypothesis of no serial correlation. This indicates that the residuals are not autocorrelated, confirming that the model does not suffer from serial correlation problems. Second, the Breusch–Pagan–Godfrey Heteroskedasticity Test yields a p-value of 0.4279, also exceeding the conventional 5% threshold. Accordingly, we fail to reject the null hypothesis of homoscedasticity. This result implies that the variance of the residuals is constant over time, suggesting the absence of heteroskedasticity and enhancing the reliability of the estimated coefficients. Third, the Jarque–Bera Normality Test in Egyptian model reports a p-value of 0.6370, which is statistically insignificant at the 5% level. Hence, we cannot reject the null hypothesis that the residuals are normally distributed. This confirms that the residuals follow a normal distribution, satisfying one of the key classical regression assumptions. Finally, the Ramsey RESET Test shows a p-value of 0.1102, which is greater than 0.05. Thus, we fail to reject the null hypothesis that the model is correctly specified. This indicates that there are no omitted relevant variables or incorrect functional form issues in the estimated model.
Overall, the diagnostic test results confirm that the model is free from serial correlation and heteroskedasticity, the residuals are normally distributed, and the functional form is correctly specified. Therefore, the estimated ARDL model can be considered statistically sound and appropriate for inference and policy interpretation.
4.5. Structural Stability Tests (CUSUM and CUSUM of Squares)
The CUSUM and CUSUM of Squares (CUSUMSQ) tests were used to assess the reliability and robustness of the estimated ARDL model by testing if the estimated coefficients are stable during the sample period and if any structural breaks have occurred.
4.5.1. CUSUM Test
Figure 1 illustrates the CUSUM test results. The cumulative sum of recursive residuals remains entirely within the 5% critical bounds throughout the study period (1980–2023). At no point does the CUSUM curve cross the upper or lower significance limits. This indicates that: The estimated coefficients are stable over time, and there is no evidence of structural instability in the model, and the long-run relationship between the variables remains consistent during the sample period. Accordingly, we fail to reject the null hypothesis of parameter stability. This indicates that, although Zivot-Andrews tests detected structural breaks in the level series at major reform dates (1990s liberalization, 2011 transition, 2016 IMF program), the conditional ARDL parameter estimates remain stable across the study period — consistent with the long-run education-growth relationship being structurally invariant once short-run dynamics are accounted for.
4.5.2. CUSUM of Squares Test
The CUSUMSQ test further assesses the stability of the variance of the residuals. As shown in the second panel of Figure 1, the cumulative sum of squared recursive residuals also lies within the 5% confidence bands throughout the entire period. This confirms that: The variance of the residuals is stable, and no sudden structural shifts or volatility changes affected the model, and the estimated ARDL specification is structurally sound.
The results of both CUSUM and CUSUMSQ tests jointly confirm that the estimated model is dynamically stable over the sample period. There is no statistical evidence of parameter instability or structural breaks. Therefore, the model is reliable for inference, and the estimated short-run and long-run coefficients can be interpreted with confidence in explaining the relationship between education variables and economic growth in Egypt.
4.6. ARDL Bounds Test for Cointegration
4.6.1. Long-Run Estimates
Table 6 presents the estimated long-run coefficients of the ARDL model:
Although there is a positive coefficient on GDPG (-1) (0.165) for the lagged dependent variable, this does not have statistical significance because the p-value is 0.2349. Therefore, once we account for the other explanatory variables included in the analysis, past economic performance (lagged dependent variable) does not have a powerful independent long-term effect on current economic growth. Government education expenditure (LOG_EDEXP) has a negative coefficient (-5.705) and is marginally significant at the 10% level (p = 0.0653) Therefore public spending on education is not able to translate directly into economic growth in the long run, and likely reflects structural inefficiencies in the education system, weak targeting of resources, and inappropriate allocation of funds within the education system. This finding contradicts Hypothesis H1 (Section 2.4), which predicted a positive long-run effect of public education expenditure on GDP growth. Accordingly, H1 is rejected by the data.
The structural variable LOG_STR is not significantly associated with the current level of growth (p = 0.4091), while the lagged value, LOG_STR (-1), negatively relates to growth at the 5% level (p = 0.0417). Therefore, structural changes may have a negative long-run effect on the rate of growth as seen by these costs that are incurred in the short run when undertaking structural changes.The coefficient of LOG_COMPR (human capital quality indicators) is negative and significant at highly significant levels (-20.16; p=0.0032), while the coefficient of the lagged value of LOG_COMPR is positive and also statistically significant (17.63; p=0.0018). The negative and positive coefficient signs suggest that human capital quality will make dynamic adjustments over time. In other words, the effect of human capital quality on growth will be negative (i.e., human capital quality puts downward pressure on growth) in the short time period. However, over the long run, with dynamic adjustments, an increase in human capital quality will produce positive returns. LOG_GCF (Gross capital formation) has a highly significant (p=0.0007) positive impact on economic growth, indicating that physical capital accumulation is a major contributor to long run economic growth. The presence of a lagged variable (LOG_GCF(-1)) did not provide an important contribution but having the second lagged variable as a significant positive impact (p=0.0128) illustrates the time lag associated with any investment will be realized. Labor force participation (LOG_LFP) has a notable negative coefficient (-32.25; p = 0.0404). This could suggest structural misalignments in the labor market, such as disguised unemployment or low productivity employment, which reduce the growth-enhancing effect of labor expansion.
The lagged trade openness (LOG_TRADE) results yielded statistical insignificance, indicating a lack of sustainable long-term impact of trade on growth in the sample period of the study. Similarly, both the current and first lag of foreign direct investment (LOG_FDI) were also found to be statistically insignificant; however, the second lag of LOG_FDI (-2) was marginally significant (p = 0.0551) and negatively signed, suggesting that FDI inflows may impose adjustment costs before they begin to generate long-term benefits. The constant was also marginally significant (p = 0.0556) and captures potential growth influences that are not explicitly included within the model.
From a goodness-of-fit perspective, the model explains approximately 84.8% of the variation in economic growth (R² = 0.848) and the level of explanatory power remains strong after adjusting for degrees of freedom based on the adjusted R² (0.761). The F-statistics show that the model is statistically significant (Prob = 0.00), providing evidence of the model’s overall significance. The Durbin-Watson statistics (2.01) indicate no autocorrelation (serial correlation) among the residuals.
In conclusion, long-term results indicate that physical capital accumulation was the predominant driver of long term growth, whereas human capital variables had some mixed and/or lagged effect, while both public education expenditures and trade openness have failed to support sustained economic growth. These all points to the need for structural reforms aimed at improving the efficiency of investments, increasing productivity of labor, and improving the quality of education expenditure to improve the education-growth relationship in the longer term.
4.6.2. Short-Run Dynamics and Error Correction
The Error Correction Model (ECM) estimates presented in Table 7 reveal the short-run dynamics and adjustment mechanisms governing the relationship between education and economic growth in Egypt. The results provide critical insights into both the speed of adjustment toward long-run equilibrium and the immediate effects of education variables on growth.
Error Correction Term and Adjustment Speed
The error correction term (COINTEQ*) is negative and highly statistically significant at the 1% level (coefficient = -0.8348, t-statistic = -8.56168, p = 0.00). It confirms that there is a long-term stable equilibrium relationship between the variables and validates these findings through the bounds test. Further, the magnitude of the coefficient shows that approximately 83.48% of the deviation from the long-run equilibrium path is corrected within one year. This relatively fast adjustment suggests that Egyptian economy reacts quickly to any disequilibria in the education-growth nexus and returns to its equilibrium trajectory in a relatively short period of time.
Short-Run Effects of Education Variables
Primary Completion Rate (LOG_COMPR): The first difference of the primary completion rate, D(LOG_COMPR), exhibits a strong negative and statistically significant effect on economic growth in the short run (coefficient = -20.1626, p = 0.00). This finding suggests that short-run increases in completion rates may actually depress contemporaneous growth, likely reflecting transition costs as students remain in school rather than entering the labor force, alongside structural rationales for this contradictory relationship: (1) The quality of basic education in Egypt does not appear to be good enough for the completion gains to translate into improvements in productivity. (2) There could be some discontinuity between what is taught in schools and what is expected of graduates in the labor market, resulting in graduates not having the skills businesses want them to have. (3) The overcrowding of schools as indicated by a high student-to-teacher ratio and the number of students in each classroom will probably decrease the quality of teaching. Importantly, this negative short-run effect is offset by a positive and significant lagged coefficient on LOG_COMPR(-1) in the long-run table (+17.64, p = 0.0018), confirming that completion-rate gains generate positive returns once students transition into productive employment.
Student-Teacher Ratio (LOG_STR): D(LOG_STR), the first difference of the student-teacher ratio in primary education (a quality proxy in which lower values indicate better quality), has a negative but statistically insignificant short-run association with growth (coefficient = -2.57788, p = 0.1998). The lagged level term LOG_STR(-1), however, is significant and negative (-7.466, p = 0.0417) in the long-run estimates, which is consistent with theoretical expectations: a higher student-teacher ratio (worse quality) reduces growth, while reductions in the ratio enhance human-capital formation and growth with a one-period lag.
Current changes in gross capital formation, D(LOG_GCF) significantly increased growth (coefficient = 6.842541, p = 0.00) showing how important investment is in creating short-run growth by accumulating capital and increasing productive capacity. However, D(LOG_GCF(-1)), the lagged component of investment had a negative and significant effect (coefficient = -4.65131, p = 0.0019), which may indicate diminishing returns or adjustment costs associated with investment made during prior periods.
The lagged FDI variable (D(LOG_FDI(-1))) has a positive and significant impact on growth (coefficient=1.988908; p=0.0116) which indicates that Foreign Direct Investment (FDI) has a positive contribution to economic performance after a one year lag. Conversely, while the current FDI level is also positively correlated with growth, this relationship is not statistically significant (p=0.1006), which further supports the existence of delayed effects between FDI and productive economic activity. The trade variable, D(LOG_TRADE), appears statistically insignificant (p = 0.9977), implying that short-run trade fluctuations do not materially influence growth within this model specification.
According to the analysis of Table 7, the model fits well based on both R-squared at 0.794 and adjusted R-squared at 0.7517 which suggests approximately 75% of the differences in economic growth can be explained by these independent variables. The F-statistics estimated at 18.73185 has a very low probability value (p) of 0.00, therefore, this indicates that we can accept the validity of the model overall. The Durbin-Watson test statistic at 2.010262 indicates there does not appear to be any first-order autocorrelation in the residuals. Information criteria calculated from the analysis (Akaike = 2.537232; Schwarz = 2.868217; Hannan-Quinn = 2.658551) indicate that these values are within the acceptable range thereby confirming the lag structure used.
The short-term results of this study reaffirm the long-term findings and illustrate some of the challenges to education policy in Egypt. The rapid negative impact of primary completion rate which has a slow positive impact demonstrates the urgent need for improving the quality of instruction and reforming the curriculum to meet the needs of the labor force. Policymakers should move their focus from quantity (expanding the capacity of the education system) to quality of education making sure that the growth of education results in real human capital development and increased economic productivity.
5. Policy Implications for Egypt
Based on our empirical findings, we derive evidence-based policy recommendations aligned with Egypt Vision 2030 and SDG 4 (Quality Education) and SDG 8 (Economic Growth and Decent Work). These recommendations address budget allocation, quality enhancement, vocational education, regional equity, and education-labor market linkages.
5.1. Optimize Education Budget Allocation and Increase Efficiency
While Egypt allocates some of its government expenditure to education, efficiency remains suboptimal, so our recommended actions:
- Transparent Tracking Mechanisms: Create strong reporting and tracking mechanisms for education spending from the ministry to the school in order to minimize leakage and corruption.
- Medium Term Expenditure Frameworks: Implement multi-year planning processes to ensure that education financing is stable and predictable to facilitate long-term improvement in quality.
Implementation of these two reforms will allow for improvements in the effectiveness of education spending without necessarily requiring large increases in budget size.
5.2. Prioritize Education Quality over Mere Enrollment Expansion
Given the strong quality-growth linkage, Egypt should prioritize:
- Curriculum reform: Update curricula to emphasize critical thinking, problem-solving, and digital literacy over rote memorization. Align content with 21st-century skills and labor market demands.
- Teacher professional development: Egypt should establish a system of compulsory ongoing professional teacher development by learning from the examples of top-performing countries like Finland and Singapore that have made extensive investments in teacher quality improvement.
- Learning assessments: o assess students and assist students needing interventions early on, Egypt should implement a process of having regular standardized assessments (other than tests) to measure students’ educational performance against a common standard.
- Infrastructure investment: To improve access to educational resources for students, Egypt should invest in improving the physical resources (e.g., buildings) found in schools, especially in rural locations.
5.3. Expand and Upgrade Technical and Vocational Education and Training (TVET)
Egypt’s high youth unemployment despite expanding university enrollment reflects education-labor market mismatches. Strengthening TVET addresses this:
- Upgrade TVET institutions: Modernize equipment, curricula, and teaching methods in technical schools and training centers, partnering with industries for internships and apprenticeships.
- Partnerships with Industry: Develop formal linkages between TVET Institutions and Businesses to ensure curriculum relevance according to employer needs.; Examples include ICT training for the Digital Economy, Advanced Manufacturing, Renewable Energy, and Tourism.
- Dual training systems: Introduce German-style dual training models combining classroom instruction with on-the-job training, ensuring graduates have practical skills employers seek.
5.4. Address Regional Disparities and Promote Equitable Access
Significant urban-rural and inter-governorate disparities undermine Egypt’s growth potential. Recommendations:
- Resource allocation targeted at underdeveloped governorates (i.e., Upper Egypt and frontier governorates), with a goal of reducing the quality gap in education
- Allocate resources using a needs-based formula rather than a population-based formula. Incentives to attract qualified teachers to rural areas, including increased salary and housing benefits, as well as opportunities for career advancement.
- Technology-enabled learning: Leverage ICT to deliver quality content to remote areas with few or no qualified teachers. Digital platforms can supplement -not replace- in-person instruction.
- School feeding programs: Continue and grow programs to eat healthier and have lower school dropout rates
- Conditional cash grants: Consider grant programs to encourage poor families to help keep kids in school until completing secondary school (such as Oportunidades in Mexico).
5.5. Strengthen Education-Labor Market Linkages
To maximize education’s growth contribution, outputs must align with labor market demands:
- Labor market information systems: Develop real-time tracking of skills demands, occupational forecasts, and graduate employment outcomes to inform education planning.
- Collaboration between Universities and Industry: Provide incentives for university collaborations with businesses for research, curriculum and student placements. Use tax incentives or matching grants to encourage industry partnerships.
- Providing Education for Entrepreneurs: Provide an Entrepreneurship Curriculum for both secondary and post-secondary schools, as many graduates will eventually be self-employed or start their own small businesses.
- Tracking Graduates: Develop a system to track employment outcomes (i.e., employment status, salary and job satisfaction) of graduates to measure program effectiveness and to identify areas of improvement.
5.6. Coordinate Education Policies with Broader Economic Reforms
Given complementarities between education and other factors, coordinate policies:
- Reform the investment climate to enhance the business environment so that the growing economy eventually accommodates a growing number of educated graduates. Address bureaucratic red tape, strengthen property rights, and update regulatory structures.
- Maintain low and stable inflation and predictable exchange rate stability to incentivise long-term human capital investment and discourage brain drain.
- Reform labor laws that create job hiring rigidities which contribute to employers’ unwillingness to hire educated graduates.
- Attracting Foreign Direct Investments: Concentrate on attracting foreign direct investments (FDI) into sectors that will create jobs for educated personnel (i.e., technology, advanced manufacturing and business services) rather than focusing on resource extraction.
- Trade Policy: Engage in the pursuit of free trade agreements and export promotion of knowledge-based sectors where Egypt’s educated workforce offers a competitive advantage.
6. Conclusions
Between 1980 and 2023, this study has undertaken a comprehensive examination of the linkage between government expenditure on public education and growth in the Egyptian economy. Utilizing advanced econometric techniques, the study will yield useful policy insights for both Vision 2030 and the achievement of SDG goals in Egypt. It will offer a theoretical basis based on both endogenous growth theory and the theory of human capital to demonstrate various ways in which educational systems can contribute to economic growth: by improving productivity of labor; facilitating the adoption and adaptation of technology; creating more innovative and entrepreneurial activities; contributing to the formation members of society; and by catalyzing structural change in the economy as a result.
For this reason, we applied the ARDL Bounds Test Methodology to help determine Long-Run Equilibrium Relationships and Short-Run Dynamics as well as Structural Break Analysis to help account for Egypt’s substantial Economic and Political Changes. Overall, our multidimensional approach will address several key gaps identified in existing research on Egypt, including: (i) incorporating more quality indicators of educational institutions beyond merely their expenditures; (ii) analyzing Structural Breaks for identifying Regime-Specific Effects; (iii) providing systematic Policy Recommendations that align/are consistent with the country’s National Development Strategy.
The empirical results provide evidence that education has a positive effect on long-term economic growth in Egypt; however, the quality of education is a more significant factor than the sheer quantity of educational provision. In addition to contributing to the GDP, educational expenditures will have a positive effect on GDP; however, qualitative aspects of education (e.g., student-teacher ratio, completion rates) and quantitative aspects of education (e.g., foreign direct investment, physical capital, macroeconomic stability and trade openness) will dilute this effect. The identification of structural breaks indicates that education and economic growth are connected through economic and context-specific factors such as the overall economy.
With respect to all hypotheses formulated in Section 2.4, the empirical evidence yields a mixed but coherent picture. Hypothesis H1 — that public education expenditure exerts a positive long-run effect on GDP growth — is rejected: the long-run coefficient on LOG_EDEXP is negative and weakly significant (−5.71, p = 0.065), indicating that, in the Egyptian case over 1980–2023, raising the share of GDP allocated to public education has not, on average, generated measurable long-run output gains. Hypothesis H2 — that education-quality proxies carry stronger growth effects than expenditure alone — is supported by the dynamic adjustment pattern of LOG_COMPR and the significant lagged effect of LOG_STR. Hypothesis H3 — that physical capital, labor force participation, and FDI act as complementary channels — is partially supported: gross capital formation emerges as the strongest long-run driver, while labor force participation and FDI exhibit complex, lag-dependent effects suggestive of structural frictions in absorption. Taken together, the rejection of H1 and the support for H2 reinforces the central message of this paper: in Egypt, the binding constraint on the education–growth link is not the level of spending but the efficiency, quality, and labor-market alignment of that spending.
The findings of the paper could drastically influence policy decisions within Egypt. To ensure that Egypt is making the most effective use of its available educational resources, it must focus less on the current increase in enrolment numbers and more on the quality of education provided by the schools. Improvements in the following areas will aid this working: Lowering student-teacher ratios; Better teacher training; Updating curricula; Improving methods for measuring and evaluating student learning outcomes. Increasing vocational and technical education options will assist in filling skill gaps in high-demand labor markets and ultimately assist in more effectively addressing the growing problem of youth unemployment. Ultimately, providing equitable access to education throughout the country helps support overall economic growth and reduce the widening effect of economic inequity. Finally, developing stronger connections between education and the workforce through link between universities and businesses, enhancing labor market information systems and providing entrepreneurship education will maximize the economic relevance of student outcomes.
Critically, education policies must be coordinated with broader economic reforms. Macroeconomic stability, improving the investment climate, labor market flexibility, the strategic attraction of FDI, and trade policy are all critical to the potential growth impact of education. The need for this integrated approach aligns with the multi-dimensional strategic development plan of Egypt Vision 2030 and also reflects the interconnectedness of development challenges.
To meet Egypt’s Vision 2030 goals of becoming more competitive and a knowledge economy, education has to be at the forefront of the overall strategy for development. Education should not just be considered social expenditure but an economic investment. The demographic dividend that Egypt could obtain will only occur if young Egyptians have access to the relevant education they need in order to be employed productively. Otherwise, continued deficiencies in quality of education, mismatches in the labor market and lack of vocational training will lead to unemployment, social instability and lost opportunities for growth.
Moving forward, there needs to be a commitment to educational reform and properly funding education for the long term in order for the Egyptian education system to be overhauled and not just improved a little bit at a time. There are examples from around the world where countries have managed to significantly transform their education systems, such as Finland from two decades of poor performance to being one of the best in the world and Singapore’s investments in people that have generated significant economic growth. The resources and youth of Egypt, along with a vision for where the country is headed, can provide the foundation for achieving similar types of education system transformation through continued political support for change, stability in their education policies, and implementing education reforms based upon evidence and research data.
The contribution of the present study relates to both the academic literature and policy discussions about education and growth in Egypt. It provides a new body of evidence to contribute to the education-growth literature by applying a rigorous methodology to the specific context of Egypt. In addition, the research provides practical evidence-based recommendations for policymakers, educators and development partners in Egypt. Given Egypt’s demographic transition, economic restructuring and aspirations for development, the study highlights the critical importance of education in shaping the nation’s economic future.
In conclusion, public education investment is not a luxury but a necessity for Egypt’s sustainable economic development. The evidence supports strategic, quality-focused education investments as drivers of productivity, innovation, competitiveness, and inclusive growth. Egypt Vision 2030’s success hinges significantly on whether education policies translate into enhanced human capital, productive employment, and sustained economic dynamism. This study provides the empirical foundation and policy roadmap for realizing that vision.
References
- Ahmadini, A. A. H.; El-Saeed, A. R.; Elshafei, A. S. M. A. Impact of public education spending on GDP in Gulf countries: A machine learning analysis. J. Radiat. Res. Appl. Sci. 2025, 18, 101423. [Google Scholar]
- Albagoury, S. H. Investing in future: education for sustainable growth in Egypt. Qual. Educ. All. 2026, 3(1), 37–52. [Google Scholar] [CrossRef]
- Arab Republic of Egypt. Constitution of the Arab Republic of Egypt, Article 19 (Right to Education); State Information Service: Cairo, 2014. [Google Scholar]
- Athey, S.; Imbens, G. W. Machine learning methods that economists should know about. 2019. [Google Scholar] [CrossRef]
- Barro, R. J. Economic growth in a cross section of countries. Q. J. Econ. 1991, 106(2), 407–443. [Google Scholar] [CrossRef]
- Becker, G. S. Human Capital: A Theoretical and Empirical Analysis, with Special Reference to Education; University of Chicago Press, 1964. [Google Scholar]
- Benhabib, J.; Spiegel, M. M. The role of human capital in economic development: Evidence from aggregate cross-country data. J. Monet. Econ. 1994, 34(2), 143–173. [Google Scholar] [CrossRef]
- Bils, M.; Klenow, P. J. Does schooling cause growth? Am. Econ. Rev. 2000, 90(5), 1160–1183. [Google Scholar] [CrossRef]
- Cooray, A. V. The role of education in economic growth. In Proceedings of the 2009 Australian Conference of Economists; Economic Society of Australia, 2009. [Google Scholar]
- Elseraty, A.; Elseraty, M. Analyzing the relationship between the inflation rate and Egypt’s current account balance using machine learning during the period (1991–2023). Manarat Al-Iskandaria Commer. Sci. 2025, 1(2), 148–181. [Google Scholar] [CrossRef]
- Hanushek, E. A.; Woessmann, L. The role of education quality for economic growth; World Bank Policy Research Working Paper No. 4122; 2007. [Google Scholar]
- Hanushek, E. A.; Woessmann, L. Do better schools lead to more growth? Cognitive skills, economic outcomes, and causation. J. Econ. Growth 2012, 17(4), 267–321. [Google Scholar] [CrossRef]
- Lucas, R. E. On the mechanics of economic development. J. Monet. Econ. 1988, 22(1), 3–42. [Google Scholar] [CrossRef]
- Mabrouki, M. Patent, education, human capital, and GDP in Scandinavian countries: A dynamic panel CS-ARDL analysis. J. Knowl. Econ. 2022, 1–16. [Google Scholar]
- Mallick, L.; Das, P. K.; Pradhan, K. C. Impact of educational expenditure on economic growth in major Asian countries: Evidence from econometric analysis. Theor. Appl. Econ. 2016, 23(2), 173–186. [Google Scholar]
- Mankiw, N. G.; Romer, D.; Weil, D. N. A contribution to the empirics of economic growth. Q. J. Econ. 1992, 107(2), 407–437. [Google Scholar] [CrossRef] [PubMed]
- Mekdad, Y.; Dahmani, A.; Louaj, M. Public spending on education and economic growth in Algeria: Causality test. Int. J. Bus. Manag. 2014, 2(3), 55–70. [Google Scholar]
- Pesaran, M. H.; Shin, Y.; Smith, R. J. Bounds testing approaches to the analysis of level relationships. J. Appl. Econom. 2001, 16(3), 289–326. [Google Scholar] [CrossRef]
- Phillips, P. C.; Hansen, B. E. Statistical inference in instrumental variables regression with I(1) processes. Rev. Econ. Stud. 1990, 57(1), 99–125. [Google Scholar] [CrossRef]
- Psacharopoulos, G.; Patrinos, H. A. Returns to investment in education: A further update. In Policy Research Working Paper 2881; World Bank, 2002. [Google Scholar]
- Romer, P. M. Endogenous technological change. J. Political Econ. 1990, 98(5(Part 2), S71–S102. [Google Scholar] [CrossRef] [PubMed]
- Schultz, T. W. Investment in human capital. Am. Econ. Rev. 1961, 51(1), 1–17. [Google Scholar]
- Tran, N. T. The impact of public education spending on GDP in ASEAN countries. J. Public Adm. Public Aff. Manag. 2023, 8(2), 45–62. [Google Scholar]
- World Bank. Expectations and Aspirations: A New Framework for Education in the Middle East and North Africa; World Bank Group, 2019. [Google Scholar]
- World Bank. World Development Indicators Database. 2023. Available online: https://databank.worldbank.org/source/world-development-indicators.
- World Bank. Egypt Economic Monitor / World Development Indicators (Egypt country profile); World Bank Group: Washington, DC, 2024; Available online: https://www.worldbank.org/en/country/egypt.
- Zivot, E.; Andrews, D. W. K. Further evidence on the great crash, the oil-price shock, and the unit-root hypothesis. J. Bus. Econ. Stat. 1992, 10(3), 251–270. [Google Scholar] [CrossRef]
Figure 1.
CUSUM test and CUSUM of square tests.
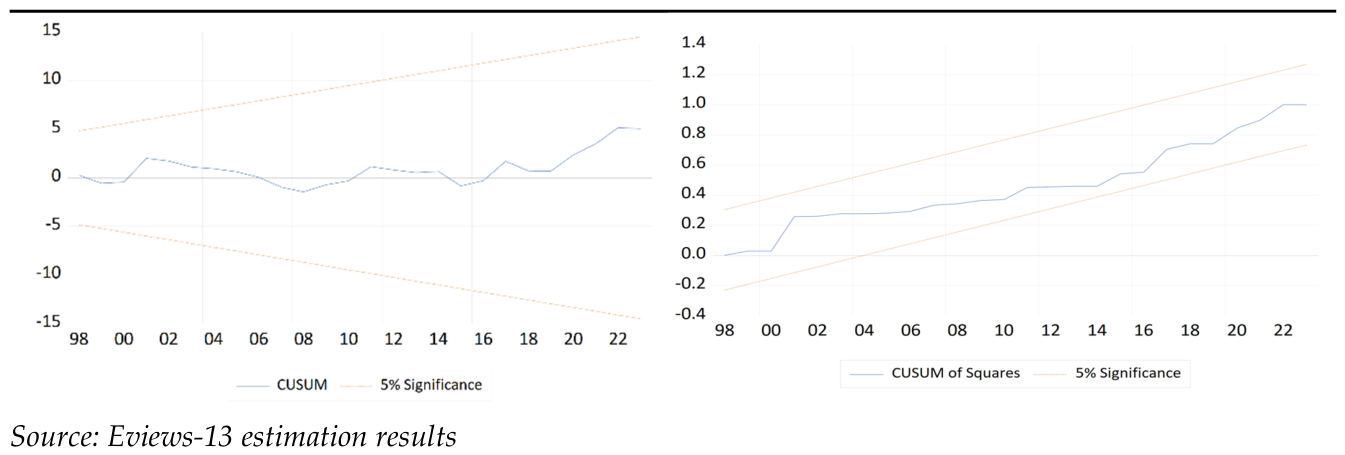
Table 1.
Variable Definitions, Sources, and Expected Signs.
| Variable | Definition and Measurement | Source | Transform | Expected Sign |
|---|---|---|---|---|
| GDPG | Annual GDP growth rate (constant 2015 US$). Dependent variable. | WDI | None | Dependent |
| EDEXP | Government expenditure on education as % of GDP. | WDI | Log | + (positive) |
| STR | Student-teacher ratio in primary education (quality proxy). | UNESCO UIS | Log | - (negative) |
| COMPR | Primary completion rate (% of relevant age group). | WDI | Log | + (positive) |
| GCF | Gross capital formation (% of GDP). | WDI | Log | + (positive) |
| LFP | Labor force participation rate (% of pop 15+). | WDI | Log | + (positive) |
| TRADE | Trade openness: (exports + imports) as % of GDP. | WDI | Log | + (positive) |
| FDI | Foreign direct investment net inflows (% of GDP). | WDI | Log(1+FDI) | + (positive) |
Note: WDI = World Bank World Development Indicators; UNESCO UIS = UNESCO Institute for Statistics. All variables in constant prices or percentages. Log transformations applied to reduce heteroskedasticity and facilitate elasticity interpretation.
Table 2.
Descriptive Statistics (1980-2023).
| GDPG | LOG_ EDEXP |
LOG_ STR |
LOG_ COMPR |
LOG_ GCF |
LOG_ LFP |
LOG_ TRADE |
LOG_ FDI |
||
|---|---|---|---|---|---|---|---|---|---|
| Mean | 4.856818 | 1.429217 | 3.207777 | 4.370475 | 2.944502 | 3.845226 | 3.849625 | 1.178603 | |
| Median | 4.550000 | 1.410975 | 3.212856 | 4.376370 | 2.916115 | 3.847697 | 3.827093 | 1.100165 | |
| Maximum | 9.370000 | 1.633154 | 3.370738 | 4.552824 | 3.509753 | 3.901973 | 4.069539 | 2.192770 | |
| Minimum | 1.650000 | 1.238374 | 3.034953 | 4.125520 | 2.554899 | 3.799526 | 3.664331 | 0.598837 | |
| Std. Dev. | 1.884545 | 0.084634 | 0.088614 | 0.117304 | 0.259813 | 0.023878 | 0.114245 | 0.396521 | |
| Skewness | 0.642447 | 0.388333 | -0.321847 | -0.243085 | 0.613969 | 0.057221 | 0.437930 | 0.777181 | |
| Kurtosis | 2.937302 | 2.861721 | 2.422980 | 1.970356 | 2.359915 | 2.467564 | 2.157237 | 2.857502 | |
| Jarque-Bera | 3.033955 | 1.140938 | 1.370041 | 2.376967 | 3.515486 | 0.543740 | 2.708528 | 4.466638 | |
| Probability | 0.219374 | 0.565260 | 0.504080 | 0.304683 | 0.172434 | 0.761953 | 0.258137 | 0.107172 | |
| Sum | 213.7000 | 62.88556 | 141.1422 | 192.3009 | 129.5581 | 169.1899 | 169.3835 | 51.85853 | |
| Sum Sq. Dev. | 152.7150 | 0.308004 | 0.337657 | 0.591691 | 2.902630 | 0.024518 | 0.561237 | 6.760826 | |
| Observations | 44 | 44 | 44 | 44 | 44 | 44 | 44 | 44 | |
Source: Calculated by the researchers using Eviews-13.
Table 4.
ARDL Bounds Test Results.
| Null hypothesis: No levels relationship | ||||||
| Number of cointegrating variables: 7 | ||||||
| Trend type: Rest. constant (Case 2) | ||||||
| Sample size: 42 | ||||||
| Test Statistic | Value | |||||
| F-statistic | 6.228301 | |||||
| Bounds Critical Values | ||||||
| Sample ... | 10% | 5% | 1% | |||
| I(0) | I(1) | I(0) | I(1) | I(0) | I(1) | |
| 40 | 2.152 | 3.296 | 2.523 | 3.829 | 3.402 | 5.031 |
| 45 | 2.131 | 3.223 | 2.504 | 3.723 | 3.383 | 4.832 |
| Asymptotic | 1.92 | 2.89 | 2.17 | 3.21 | 2.73 | 3.9 |
| * I(0) and I(1) are respectively the stationary and non-stationary bounds. | ||||||
Source: Calculated by the researchers using Eviews-13.
Table 6.
Long-Run Coefficient Estimates.
| Variable | Coefficient | Std. Error | t-Statistic | Prob.* |
|---|---|---|---|---|
| GDPG(-1) | 0.165202 | 0.135846 | 1.216098 | 0.2349 |
| LOG_EDEXP | -5.70501 | 2.963919 | -1.92482 | 0.0653 |
| LOG_STR | -2.57788 | 3.072299 | -0.83907 | 0.4091 |
| LOG_STR(-1) | -7.46574 | 3.484427 | -2.1426 | 0.0417 |
| LOG_COMPR | -20.1626 | 6.206683 | -3.24852 | 0.0032 |
| LOG_COMPR(-1) | 17.63614 | 5.057353 | 3.487228 | 0.0018 |
| LOG_GCF | 6.842541 | 1.77 | 3.865843 | 0.0007 |
| LOG_GCF(-1) | -0.75252 | 1.879832 | -0.40031 | 0.6922 |
| LOG_GCF(-2) | 4.651307 | 1.739595 | 2.673787 | 0.0128 |
| LOG_LFP | -32.2551 | 14.95281 | -2.15713 | 0.0404 |
| LOG_TRADE | 0.003362 | 1.969343 | 0.001707 | 0.9987 |
| LOG_TRADE(-1) | -3.37237 | 2.610551 | -1.29182 | 0.2078 |
| LOG_FDI | 1.227386 | 1.160891 | 1.057279 | 0.3001 |
| LOG_FDI(-1) | 0.1671 | 0.964942 | 0.173171 | 0.8639 |
| LOG_FDI(-2) | -1.98891 | 0.990376 | -2.00824 | 0.0551 |
| C | 161.5645 | 80.60663 | 2.004357 | 0.0556 |
| R-squared | 0.848315 | Mean dependent var | 4.741905 | |
| Adjusted R-squared | 0.760804 | S.D. dependent var | 1.84822 | |
|
S.E. of regression |
0.903922 | Akaike info criterion | 2.918184 | |
| Schwarz criterion | 3.580154 | |||
| Hannan-Quinn criter. | 3.160822 | |||
| F-statistic | 9.693822 | Durbin-Watson stat | 2.010262 | |
| Prob(F-statistic) | 0.00 | |||
Source: Calculated by the researcher using Eviews-13.
Table 7.
Error Correction Model (Short-Run Dynamics).
| Variable | Coefficient | Std. Error | t-Statistic | Prob. |
|---|---|---|---|---|
| COINTEQ* | -0.8348 | 0.097504 | -8.56168 | 0.00 |
| D(LOG_STR) | -2.57788 | 1.971366 | -1.30766 | 0.1998 |
| D(LOG_COMPR) | -20.1626 | 3.968096 | -5.08117 | 0.00 |
| D(LOG_GCF) | 6.842541 | 1.262087 | 5.421608 | 0.00 |
| D(LOG_GCF(-1)) | -4.65131 | 1.377898 | -3.37565 | 0.0019 |
| D(LOG_TRADE) | 0.003362 | 1.143727 | 0.002939 | 0.9977 |
| D(LOG_FDI) | 1.227386 | 0.727284 | 1.68763 | 0.1006 |
| D(LOG_FDI(-1)) | 1.988908 | 0.745065 | 2.669441 | 0.0116 |
| R-squared | 0.794093 | Mean dependent var | -0.05119 | |
| Adjusted R-squared | 0.7517 | S.D. dependent var | 1.586317 | |
| S.E. of regression | 0.790457 | Akaike info criterion | 2.537232 | |
| Schwarz criterion | 2.868217 | |||
| Log likelihood | -45.2819 | Hannan-Quinn criter. | 2.658551 | |
| F-statistic | 18.73185 | Durbin-Watson stat | 2.010262 | |
| Prob(F-statistic) | 0.00 | |||
Source: Calculated by the researcher using Eviews-13.
Disclaimer/Publisher’s Note: The statements, opinions and data contained in all publications are solely those of the individual author(s) and contributor(s) and not of MDPI and/or the editor(s). MDPI and/or the editor(s) disclaim responsibility for any injury to people or property resulting from any ideas, methods, instructions or products referred to in the content. |
© 2026 by the authors. Licensee MDPI, Basel, Switzerland. This article is an open access article distributed under the terms and conditions of the Creative Commons Attribution (CC BY) license (http://creativecommons.org/licenses/by/4.0/).
Copyright: This open access article is published under a Creative Commons CC BY 4.0 license, which permit the free download, distribution, and reuse, provided that the author and preprint are cited in any reuse.


