
Submitted:
31 July 2026
Posted:
03 August 2026
You are already at the latest version
Abstract
Loudness discrepancies between Internet advertisements and the program material they accompany affect user comfort, yet, unlike broadcast television, streaming services are subject to few binding loudness regulations. This article presents a combined objective and subjective study of the loudness of Internet advertisements. Objective loudness was measured in LUFS units according to Recommendation ITU-R BS.1770-4 using an application built on the pyloudnorm package and validated against the ITU-R BS.2217-2 compliance material. Fifteen advertisement–program pairs collected from popular Polish streaming and video-on-demand services were analyzed. In the subjective experiment, thirty listeners compared the loudness of each advertisement with that of the accompanying program material using a bounded, bipolar category-rating scale administered through the webMUSHRA framework; the ordinal character of such ratings is explicitly acknowledged in the analysis. The ratings were examined with one-way analysis of variance and Tukey post hoc tests within listener groups, and the per-sample mean ratings were correlated with the objective loudness differences. Subjective ratings correlated strongly with objective LUFS differences, and rating consistency decreased with lower listener expertise in audio processing and with self-reported hearing problems. The results document the extent to which loudness recommendations are exceeded in Internet advertising and provide a reusable methodology for monitoring compliance. Although the problem is illustrated with examples drawn from Polish services, the authors' exploratory checks of foreign platforms indicate that a similar situation prevails across many Internet services worldwide.
Keywords:
loudness
; LUFS
; ITU-R BS.1770
; Internet advertising
; subjective listening tests
; category rating
; webMUSHRA
; analysis of variance
1. Introduction
In the era of digital media consumption, the loudness of Internet advertisements is not only a technical matter but also an important factor in user comfort. In traditional television and radio broadcasting, the loudness of commercial breaks is constrained by binding regulations and by well-established loudness normalization practices based on Recommendation ITU-R BS.1770 and EBU R 128. In the Internet domain, by contrast, compliance with loudness recommendations is largely voluntary, and individual streaming platforms publish their own—often mutually inconsistent—technical specifications, or none at all. As a result, users are routinely exposed to abrupt loudness changes when advertisements interrupt streamed program material.
The perception of loudness has been studied extensively since the pioneering psychophysical work of Stevens [1] and the psychoacoustic modeling of Zwicker and Fastl [2], and it is reflected in the standardized equal-loudness-level contours [3]. On the measurement side, the LUFS scale (Loudness Units relative to digital Full Scale) introduced in Recommendation ITU-R BS.1770-4 [4] and operationalized through EBU R 128 [5] aligns objective measurements with the average subjective loudness impression, while EBU R 128 Supplement 1 [6] specifies loudness parameters for short-form content such as advertisements. Software implementations of the ITU algorithm, including the open-source pyloudnorm package [7], make these measurements readily reproducible.
However, whereas the loudness of television advertising has been the subject of both regulation and research, the subjective assessment of the loudness of Internet advertisements has so far remained outside the focus of experimental studies. In particular, little is known about how the difference between the objective loudness of an advertisement and that of the surrounding program material translates into listeners' judgments, and how listener characteristics—such as expertise in audio processing or hearing problems—affect the consistency of those judgments.
The main contributions of this article are the following: (i) an objective loudness survey of advertisement–program pairs collected from fifteen popular Internet services, performed with a validated implementation of the ITU-R BS.1770-4 algorithm, which documents the extent and inconsistency of compliance with loudness recommendations across platforms; (ii) a subjective listening experiment with thirty participants, in which the loudness of each advertisement was compared with that of the accompanying program material using a bounded, bipolar category-rating scale administered through the webMUSHRA framework, together with an analysis relating the ratings to the objective measurements; (iii) a statistical analysis of the subjective ratings, carried out with explicit acknowledgment of the ordinal character of the rating scale and based on analysis of variance with Tukey post hoc tests within listener groups and on the correlation of the per-sample mean ratings with the objective measurements; and (iv) evidence that the consistency of loudness judgments decreases with lower listener expertise in sound processing and with self-reported hearing problems, which has practical implications for the design of loudness monitoring and complaint-handling procedures.
The remainder of the paper is organized as follows. Section 2 reviews loudness perception models and the LUFS standardization scale. Section 3 describes the materials and methods: the objective measurement application and its validation, the collected test material, the subjective test procedure, and the statistical methods. Section 4 presents the objective and subjective results and their statistical analysis. Section 5 discusses the findings and the limitations of the study, and Section 6 concludes the paper.
2. Loudness Models and the LUFS Standardization Scale
The perception of loudness is conditioned by the number of nerve impulses reaching the brain; therefore, not only the intensity and dynamics of a sound but also its spectral composition are essential in determining the magnitude of the auditory sensation, as illustrated by the equal-loudness-level contours [3]. In addition, the perception of a given sound is decisively influenced by the anatomy of the ear, whose frequency analysis can be generalized as a bank of band-pass filters with bandwidths corresponding to the critical bands. Describing these factors with a mathematical model is challenging because of their complexity. Stevens and Zwicker were pioneers in this field.
Stevens proposed a power-law description of the intensity of sensory impressions [1], characterized by Equation (1):
where I is the intensity of the sound stimulus; ψ(I) is the psychophysical function modeling the dependence of the subjectively perceived loudness on the magnitude of the stimulus; k is a proportionality coefficient (for loudness, the unit is the sone); and a is the power exponent, equal to approximately 0.33 for loudness when the stimulus is expressed as sound intensity (equivalently, approximately 0.67 when the stimulus is expressed as sound pressure, since intensity is proportional to the square of pressure). The constants a and k were determined experimentally by Stevens. The compressive, non-linear characteristic of Equation (1) reflects the non-linear perception of loudness by the human auditory system: a tenfold increase in intensity (10 dB) corresponds approximately to a doubling of loudness.
ψ(I) = kIa
Stevens' power law provides an accurate description of loudness growth for a 1 kHz pure tone under the experimental conditions in which it was established [1,8,9]. It was not, however, intended to model the loudness of complex, spectrally rich, and time-varying signals, for which spectral weighting, frequency masking, and critical-band effects must be taken into account. To address these phenomena, Zwicker proposed a loudness model [2] that combines several psychoacoustic properties—such as the frequency-dependent sensitivity of the human ear, reflected by weighting with equal-loudness contours, frequency masking, and the critical-band theory—to determine the loudness of complex stationary or time-varying sounds. The algorithm based on this model has been standardized as ISO 532-1:2017 [11], which superseded the earlier ISO 532B; numerous implementations exist, including the “Perceived loudness of acoustic signal” function in the MATLAB environment [12].
The algorithm defined in ISO 532-1 is, however, computationally too complex to be practical for the routine measurement of signals broadcast as advertisements in the Internet domain. For this reason, the algorithm described in Recommendation ITU-R BS.1770 [4], adopted by the EBU in Recommendation R 128 [5] (version 5.0, November 2023), is commonly used; the EBU has also issued Supplement 1 (EBU R 128s1) [6], which provides specific loudness parameters for short-form content, including commercials and promotional material—precisely the category of audio examined in this study. It should be noted that the most recent revision of the ITU recommendation is BS.1770-5 [16]; the measurement algorithm relevant to this study is unchanged with respect to BS.1770-4.
The BS.1770 algorithm was developed by the International Telecommunication Union to establish a universal standard for measuring the loudness of audio signals. Its main element is the K-weighting curve, which allows the signal, as subjectively perceived by the human ear, to be captured in an objective measurement. The K-weighting filter approximates the frequency-dependent sensitivity of the human auditory system, building on the psychoacoustic models developed by Glasberg and Moore [13,14]. The K-curve, shown in Figure 1 (reproduced from EBU Tech 3343 [15]), corresponds to the shape of the equal-loudness contours. By default, Recommendation ITU-R BS.1770 operates on five channels: left, right, center, left surround, and right surround. The signal in each channel is divided into buffers with a default length of 400 ms, filtered with the K-curve, and the mean square is computed. These values constitute the momentary loudness, while the integrated loudness (in LUFS) is obtained by gating and averaging the momentary values. Before the final determination of the program loudness, each channel is weighted accordingly (Figure 2).
3. Materials and Methods
3.1. Objective Loudness Measurement Application and Its Validation
To determine the objective loudness of advertisements broadcast on the Internet, the LUFS loudness representation defined in Recommendation ITU-R BS.1770-4 [4] was adopted. A measurement application was implemented on the basis of the open-source Python package pyloudnorm [7] and extended to compute and plot momentary loudness values in addition to the integrated loudness.
Any loudness meter should be verified against samples with known loudness levels, and its readings should be compared with those of established implementations. The developers of pyloudnorm conducted extensive conformance measurements of the ITU algorithm included in the package, comparing it with LUFS meter implementations such as the loudness.py script by De Man [17], FFmpeg [18], libebur128 [19], Essentia [20], and the Youlean Loudness Meter [21]. These implementations were tested using the compliance material for Recommendation ITU-R BS.1770 described in Report ITU-R BS.2217-2 [22], covering two-channel pure tones at octave-band frequencies, chirps, and combinations of music and speech. According to Report BS.2217, a LUFS meter complies with the ITU algorithm provided that its readings do not deviate by more than 0.1 LU from the loudness level established for the compliance sample. The pyloudnorm implementation passes all compliance samples, and the application developed for this study processes each required sample in accordance with the ITU algorithm. As an example, Figure 3 shows the analysis of the compliance file “1770-2 Conf Stereo VinL+R-23LKFS” performed by the application.
3.2. Test Material
The test material consists of advertisement–program pairs collected from popular Internet streaming, radio-streaming, and video-on-demand services. The signal reproduced by the web browser was captured with the loopback driver BlackHole [23], which routes the loudspeaker output back to the audio input under macOS, and recorded as stereo files with a sampling rate of 48 kHz and a bit depth of 24 bits. Each sample contains 15 s of an advertisement together with 15 s of the regular program material immediately preceding or following it; the program material acts as the reference signal against which the loudness of the advertisement is compared. To support the analysis, the samples were additionally categorized by the type of the accompanying program content (music, film, or broadcast/talk), as indicated in Table 1, since music-streaming services normalize their program material to a consistent platform level whereas other content types are not subject to such normalization. The application determines the integrated loudness of each part of the sample and plots the momentary loudness values of the two signals juxtaposed over their duration. The collected samples, together with the advertiser names and the individual maximum-loudness requirements compiled from each service's publicly available technical specification (N/A where no specification was available), are listed in Table 1. In the remainder of the paper, sample 13, for example, refers to a video from the Polish television on-demand service TVP VOD interrupted by an advertising spot; the other samples are labeled analogously.
3.3. Participants and Subjective Test Procedure
Thirty listeners from different social groups participated in the subjective experiment. Their age ranged from 23 to 54 years; 70% were men and 30% were women. The participants declared their level of knowledge of sound processing on a three-level scale: 11 declared a high level, 7 a medium level, and 12 a low level. In addition, participants were asked whether they experienced hearing problems: 9 participants reported hearing problems and 21 reported none. The assignment to the latter group was based on personal self-declaration rather than on audiometric examination, which is acknowledged as a limitation in Section 5. An effort was made to obtain a similar number of people in each statistical group.
To standardize the procedure and ensure comparable conditions, every session was conducted in an identical test environment. All tests were carried out on a MacBook Pro running macOS Ventura 13.3.1, and the audio was reproduced through Audio-Technica ATH-AVC500 closed-back headphones [24], chosen for their reasonably uniform frequency response across the 20 Hz–20 kHz band. The same playback volume, corresponding to approximately −10 dB relative to the maximum output level of the computer, was maintained in every session.
The listening test was implemented as a questionnaire in the webMUSHRA framework [10], a web-based environment for listening tests designed around the MUSHRA methodology of Recommendation ITU-R BS.1534-3 [25]. In each of the 15 trials, the participant listened to the program material, labeled “A”, and to the advertisement, labeled “B”, and judged how much the loudness of the advertisement differed from that of the program material. The judgment was expressed on a bounded, bipolar category-rating scale with the following labeled categories: −2 (the advertisement is much quieter), −1 (the advertisement is quieter), 0 (the advertisement has the same loudness), +1 (the advertisement is louder), and +2 (the advertisement is much louder), with the possibility of assigning intermediate (floating-point) ratings between the labeled categories. An example trial interface is shown in Figure 5 (in Section 4). The questionnaire ended with several questions characterizing the participant, used to separate the expertise and hearing-status groups described above.
It should be emphasized that, although the procedure was inspired by the direct-scaling tradition of Stevens [8,9], it does not constitute classical magnitude estimation, in which listeners assign freely chosen numerical values proportional to the perceived magnitude. Instead, the participants evaluated the stimuli on a bounded ordinal rating scale of the category-rating type. Consequently, the subjective data are treated throughout this paper as ordinal rather than ratio-scale measurements, which determines the choice of the statistical methods described in Section 3.4.
3.4. Statistical Methods
Because the subjective ratings were collected on a bounded category-rating scale, they constitute ordinal data, which constrains their admissible statistical treatment. The analyses applied in this study therefore operate primarily on quantities derived from the ratings rather than on the raw scale values of individual responses. The agreement between the subjective and objective assessments was quantified with Pearson's correlation coefficient computed between the per-sample ratings averaged over the listeners and the objective loudness differences rescaled to the −2 to +2 range; averaging over 30 listeners yields approximately continuous per-sample scores and justifies the auxiliary use of a linear correlation measure.
Within each listener group (expertise and hearing-status groups), a one-way analysis of variance (ANOVA) with Tukey's post hoc test was performed on the ratings, and the number of sample pairs found to differ significantly in the post hoc test is used as an indicator of how reliably the listeners in a given group discriminated the loudness differences between the stimuli. It is acknowledged that rank-based methods, such as Spearman's rank correlation or the Friedman test, recommended for the statistical treatment of MUSHRA-type listening-test data [27], constitute the formally most appropriate analysis of ordinal ratings; such analyses require the individual raw responses and are indicated in Section 5 as part of the planned follow-up study.
4. Results
4.1. Objective Measurements
The integrated loudness of the advertisement part and of the reference (program) part of each sample listed in Table 1, determined with the pyloudnorm-based application, is presented in Table 2. Values marked with an asterisk (*) comply with the −23 LUFS target consistent with the directives of the Polish regulator, the National Broadcasting Council [26]; in the Internet domain, compliance with this directive is voluntary. As an example of the momentary analysis, Figure 4 shows the momentary loudness of the advertisement part of sample 11 over its 15 s duration.
Several observations follow from Table 2. First, compliance with the −23 LUFS target is inconsistent both across and within services: on cda.pl, for instance, one advertisement was reproduced at −12.1 LUFS and another at −25.5 LUFS. Second, the largest excess over a service's own published specification was observed on Spotify (sample 3), where the advertisement reached −5.8 LUFS against the declared −14 LUFS requirement, i.e., approximately 8 LU above the specification and more than 7 LU above the accompanying program material. Third, on radio-streaming services (samples 1 and 2), both the advertisements and the program material were reproduced at very high loudness levels around −6 LUFS, reflecting the strong dynamic processing typical of that domain. It should also be noted that a complete characterization of program audio according to EBU R 128 [5] and its Supplement 1 for short-form content [6] additionally requires the Loudness Range (LRA, EBU Tech 3342) and the maximum true-peak level (dBTP). These parameters were not captured in the current dataset; this limitation is discussed in Section 5, since strong dynamic compression (low LRA) can cause an advertisement to be perceived as subjectively louder than its integrated loudness alone would predict.
An example of the subjective trial interface used to compare the loudness of an advertisement with the reference program material is shown in Figure 5.
4.2. Correlation Between Subjective and Objective Data
To verify the agreement between the objective and the subjective data, the per-sample subjective ratings averaged over all listeners were juxtaposed with the objective loudness differences rescaled to the −2 to +2 range. For each sample, the difference between the integrated loudness of the program material and that of the advertisement was computed, and the resulting differences were mapped onto the rating scale by min–max rescaling: each difference was shifted by the minimum of the observed range, divided by the absolute width of that range, multiplied by the width of the target scale (4 units), and offset by its lower bound (−2). The resulting scatter plot is shown in Figure 6. Pearson's correlation coefficient computed on the averaged ratings is R = 0.89, which means that the per-sample mean ratings of all respondents are strongly correlated with the corresponding rescaled objective loudness differences.
The same correlation analysis was performed separately for the listener groups declaring different levels of familiarity with sound processing, yielding Pearson coefficients of 0.89, 0.89, and 0.82 for the high, medium, and low familiarity groups, respectively. Thus, the strength of the correlation decreases as the familiarity with sound processing decreases. In addition, the correlation between the subjective and objective evaluations was computed for the groups of listeners with and without self-reported hearing problems, yielding Pearson coefficients of 0.57 and 0.90, respectively. The coefficient of 0.57 obtained for the group reporting hearing problems is markedly lower than in the other cases, although it still indicates a moderate-to-strong association. The strength of the correlation therefore decreases in the presence of self-reported hearing problems.
4.3. Consistency of the Subjective Ratings Across Listener Groups
The consistency of the ratings across the 15 samples and across the listener groups was examined with a one-way ANOVA and Tukey's post hoc test performed within each group; the number of sample pairs found to differ significantly in the post hoc test is used as an indicator of how reliably the listeners in a given group discriminated the loudness differences between the stimuli. The results for the expertise groups are given in Table 3, and for the hearing-status groups in Table 4.
As Table 3 shows, the higher the declared familiarity with sound processing, the more sample pairs are discriminated as significantly different (60, 42, and 34 pairs for the expert, average, and low-knowledge groups, respectively). In other words, the lower the familiarity with sound-processing topics, the more random and less coherent the answers become.
As Table 4 shows, the ratings of the group reporting no hearing problems differentiate the stimuli highly significantly (F = 38.39, p < 0.001), with 69 sample pairs found to differ in the Tukey post hoc test, whereas the ratings of the group reporting hearing problems do not differ significantly across the samples (F = 0.217, p = 0.643; only 3 significant pairs). The listeners without hearing problems therefore provided markedly more coherent loudness judgments, which is consistent with the correlation results of Section 4.2 (Pearson coefficients of 0.90 and 0.57 for the groups without and with self-reported hearing problems, respectively).
The correlation analyses of Section 4.2 corroborate these observations: the strength of the correlation between the subjective and objective assessments increases with the level of familiarity with sound processing and decreases in the presence of self-reported hearing problems. Taken together, the ANOVA-based analyses and the correlation results consistently indicate that the coherence of loudness judgments depends strongly on the listener group.
5. Discussion
The objective results demonstrate that the loudness of Internet advertising is far from uniform. Although several video-on-demand platforms reproduce both advertisements and program material close to the −23 LUFS broadcast target, other services either publish no loudness specification at all or fail to enforce the one they publish, with excesses of up to about 8 LU over the declared limit (sample 3) and differences of more than 7 LU between an advertisement and the accompanying program material. Moreover, the advertisement loudness was often not constant within a single service: on cda.pl, individual advertisements differed by more than 13 LU. A likely explanation, exemplified by Spotify, is that advertisements are played out at the level delivered by the advertiser rather than being normalized by the platform. For music-streaming services, the program material is typically normalized to a consistent platform level, whereas services distributing other media impose no such normalization, so each item may have a different loudness—an asymmetry that should be taken into account when comparing advertisement and reference levels across service types.
The subjective results confirm that the objective LUFS differences are a good predictor of the perceived loudness relations: the averaged ratings of the 30 listeners correlate strongly with the rescaled objective differences. At the same time, the group analyses show that the coherence of the judgments depends substantially on the listener: participants with greater declared familiarity with sound processing discriminate the loudness differences more reliably (more significantly different sample pairs in the post hoc analysis), whereas self-reported hearing problems reduce the correlation between the subjective and objective assessments. This observation is of practical relevance: complaint-driven mechanisms for policing advertisement loudness will be dominated by the judgments of non-expert listeners, whose ratings are noisier, which strengthens the case for objective, measurement-based monitoring of the type presented here.
An interesting difference from traditional television advertising should also be noted. Unlike TV commercials, Internet advertisements are usually not designed to catch the attention of people who are not watching or actively listening to the program: they are typically viewed immediately before the material the user is waiting for, so the user's attention is already engaged. This may partly explain why, on several platforms, the advertisements were broadcast at levels close to that of the accompanying material, while on others commercial pressure or the absence of enforcement leads to substantial loudness excesses.
Several limitations of the present study should be acknowledged. First, the sample of 15 advertisement–program pairs and 30 listeners, although sufficient to reveal the main effects, is modest, and the group sizes (in particular the 9 listeners reporting hearing problems) limit the statistical power of the between-group comparisons. Second, the hearing status of the participants was self-reported and not verified audiometrically. Third, the subjective ratings were collected on a bounded, bipolar category-rating scale; such data are ordinal, which restricts the admissible statistical treatment, and the bounded scale may compress the ratings of the largest loudness differences. The analyses reported here rely on ANOVA with post hoc tests and on correlations of the per-sample mean ratings; a fully rank-based treatment of the individual ratings, following the recommendations for MUSHRA-type data [27], remains to be carried out on newly collected raw responses. Fourth, the objective characterization was limited to the integrated loudness; the Loudness Range (LRA) and the maximum true-peak level required for a complete characterization according to EBU R 128 and its Supplement 1 were not captured, even though strong dynamic compression (low LRA) can make an advertisement sound louder than its integrated loudness suggests. Fifth, all listening sessions used a single playback level and a single headphone model, so level- and transducer-dependent effects were not examined.
Future work should therefore include: enlarging the corpus of advertisement–program pairs and the listener panel; audiometric screening of the participants; extending the objective measurements with LRA and true-peak values; a rank-based statistical treatment of the individual ratings (Spearman rank correlation, Friedman test) applied to the newly collected responses; and an additional experiment in which the advertisement and program signals are masked by tones of different frequencies but equal amplitude, in order to highlight the influence of the critical bands on the perception of advertisement loudness.
6. Conclusions
This article presented a combined objective and subjective study of the loudness of Internet advertisements. The LUFS scale, as the loudness standard of the broadcasting and mastering industries, proved suitable for the application described in this paper, and the measurement application built on a validated open-source implementation of the ITU-R BS.1770-4 algorithm, together with a database of collected samples, provides a reusable framework for monitoring advertisement loudness in the network domain.
The objective measurements showed that compliance with loudness recommendations in the Internet domain is inconsistent: several services reproduce advertisements close to the −23 LUFS broadcast target, while others exceed their own published specifications by up to about 8 LU, and the advertisement loudness often varies considerably within a single service. The subjective experiment with thirty listeners demonstrated that the perceived loudness relations between advertisements and program material correlate strongly with the objective LUFS differences, and that the consistency of the subjective judgments decreases with lower listener expertise in sound processing and with self-reported hearing problems.
In summary, this study underscores the need for standardized and enforced audio loudness levels in Internet advertising, documents significant loudness discrepancies across platforms, and provides both a methodology and reference data for further work on the objective monitoring of advertisement loudness and on the factors shaping its subjective perception. Although the study material was drawn from Polish Internet services, the exploratory surveys of foreign platforms carried out by the authors indicate that the situation documented here is not specific to the Polish market: inconsistent or unenforced loudness practices of a similar kind can be observed on many Internet services worldwide, which makes the presented monitoring methodology broadly applicable.
Author Contributions
Conceptualization, A.C. and M.S.; methodology, A.C. and M.S.; software, M.S.; validation, M.S.; formal analysis, M.S.; investigation, M.S.; resources, M.S.; writing—original draft preparation, M.S.; writing, A.C.; supervision, A.C. All authors have read and agreed to the published version of the manuscript.
Funding
This study was partly supported by the Faculty of Electronics, Telecommunications and Informatics of Gdańsk University of Technology.
Institutional Review Board Statement
Ethical review and approval were waived for this study, as the Internet streaming listening tests were non-invasive, posed no risk to participants, and no personal or medical data that could identify participants were collected.
Informed Consent Statement
Informed consent was obtained from all subjects involved in the study.
Data Availability Statement
The data presented in this study are available on request from the corresponding author. The audio samples are not publicly available because they contain copyrighted advertisement and program material.
Acknowledgments
The authors would like to thank all participants in the subjective listening tests.
Conflicts of Interest
The authors declare no conflicts of interest.
References
- Stevens, S.S. On the psychophysical law. Psychol. Rev. 1957, 64, 153–181. [Google Scholar] [CrossRef] [PubMed]
- Zwicker, E.; Fastl, H. Psychoacoustics: Facts and Models, 3rd ed.; Springer: Berlin/Heidelberg, Germany, 2007. [Google Scholar]
- ISO 226:2023; Acoustics—Normal Equal-Loudness-Level Contours. International Organization for Standardization: Geneva, Switzerland, 2023.
- Recommendation ITU-R BS.1770-4; Algorithms to Measure Audio Programme Loudness and True-Peak Audio Level. International Telecommunication Union: Geneva, Switzerland, 2015. Available online: https://www.itu.int/dms_pubrec/itu-r/rec/bs/R-REC-BS.1770-4-201510-I!!PDF-E.pdf (accessed on 15 October 2023).
- EBU Recommendation R 128, Version 5.0; Loudness Normalisation and Permitted Maximum Level of Audio Signals; European Broadcasting Union: Geneva, Switzerland, 2023; Available online: https://tech.ebu.ch/publications/r128 (accessed on 15 October 2023).
- EBU R 128 Supplement 1; Loudness Parameters for Short-Form Content (Adverts, Promos, etc.). European Broadcasting Union: Geneva, Switzerland, 2023. Available online: https://tech.ebu.ch/docs/r/r128s1v1_0.pdf (accessed on 15 October 2023).
- Steinmetz, C.J.; Reiss, J.D. pyloudnorm: A Simple yet Flexible Loudness Meter in Python. In Proceedings of the 150th AES Convention, Online, 25–28 May 2021; Available online: https://csteinmetz1.github.io/pyloudnorm-eval/paper/pyloudnorm_preprint.pdf (accessed on 15 October 2023).
- Stevens, S.S. The direct estimation of sensory magnitudes—Loudness. Am. J. Psychol. 1956, 69, 1–25. [Google Scholar] [CrossRef]
- Stevens, S.S. Psychophysics: Introduction to Its Perceptual, Neural, and Social Prospects; Wiley: New York, NY, USA, 1975. [Google Scholar]
- Schoeffler, M.; Bartoschek, S.; Müller-Trapet, M.; Kraft, M.; Raake, A.; Herre, J. webMUSHRA—A comprehensive framework for web-based listening tests. J. Open Res. Softw. 2018, 6, 8. [Google Scholar] [CrossRef]
- ISO 532-1:2017; Acoustics—Methods for Calculating Loudness—Part 1: Zwicker Method. International Organization for Standardization: Geneva, Switzerland, 2017.
- MathWorks. Acoustic Loudness—ISO 532-1:2017(E), Zwicker Method. Available online: https://www.mathworks.com/help/audio/ref/acousticloudness.html (accessed on 15 October 2023).
- Glasberg, B.R.; Moore, B.C.J. A model of loudness applicable to time-varying sounds. J. Audio Eng. Soc. 2002, 50, 331–342. [Google Scholar]
- Moore, B.C.J.; Glasberg, B.R.; Baer, T. A model for the prediction of thresholds, loudness and partial loudness. J. Audio Eng. Soc. 1997, 45, 224–240. [Google Scholar]
- Guidelines for Production of Programmes in Accordance with EBU R 128. EBU Tech 3343; Guidelines for Production of Programmes in Accordance with EBU R 128. European Broadcasting Union: Geneva, Switzerland, 2023. Available online: https://tech.ebu.ch/docs/tech/tech3343.pdf (accessed on 15 October 2023).
- Recommendation ITU-R BS.1770-5; Algorithms to Measure Audio Programme Loudness and True-Peak Audio Level. International Telecommunication Union: Geneva, Switzerland, 2023. Available online: https://www.itu.int/dms_pubrec/itu-r/rec/bs/R-REC-BS.1770-5-202311-I!!PDF-E.pdf (accessed on 15 November 2023).
- De Man, B. Evaluation of implementations of the EBU R128 loudness measurement. In Proceedings of the 145th AES Convention, New York, NY, USA, 17–20 October 2018. [Google Scholar]
- FFmpeg. loudnorm Filter Documentation. Available online: http://ffmpeg.org/ffmpeg-all.html#loudnorm (accessed on 15 November 2023).
- Kokemüller, J. libebur128: A Library Implementing the EBU R128 Loudness Standard. Available online: https://github.com/jiixyj/libebur128 (accessed on 15 November 2023).
- Music Technology Group. Essentia: C++ Library for Audio and Music Analysis. Available online: https://github.com/MTG/essentia (accessed on 15 November 2023).
- Nikolic, J. Youlean Loudness Meter. Available online: https://youlean.co (accessed on 15 November 2023).
- Report ITU-R BS.2217-2; Compliance Material for Recommendation ITU-R BS.1770. International Telecommunication Union: Geneva, Switzerland, 2016. Available online: https://www.itu.int/dms_pub/itu-r/opb/rep/R-REP-BS.2217-2-2016-PDF-E.pdf (accessed on 15 October 2023).
- Existential Audio. BlackHole: Route Audio Between Apps. Available online: https://github.com/ExistentialAudio/BlackHole (accessed on 15 October 2023).
- Audio-Technica. ATH-AVC500 Headphones Specification. Available online: https://www.audio-technica.com/en-eu/ath-avc500 (accessed on 15 November 2023).
- Recommendation ITU-R BS.1534-3; Method for the Subjective Assessment of Intermediate Quality Level of Audio Systems. International Telecommunication Union: Geneva, Switzerland, 2015.
- National Broadcasting Council (Krajowa Rada Radiofonii i Telewizji). Regulation of 30 June 2011 on the Manner of Advertising and Telesales Activities in Radio and Television Programmes. Available online: http://www.archiwum.krrit.gov.pl/Data/Files/_public/Portals/0/regulacje-prawne/polska/kontrola-nadawcow/rozporzadzenie-4.docx (accessed on 15 October 2023).
- Mendonça, C.; Delikaris-Manias, S. Statistical tests with MUSHRA data. In Proceedings of the 144th AES Convention, Milan, Italy, 23–26 May 2018; p. Paper 10006. [Google Scholar]
Figure 1.
K-weighting filter curve used for loudness measurement (after EBU Tech 3343 [15]).
Figure 1.
K-weighting filter curve used for loudness measurement (after EBU Tech 3343 [15]).
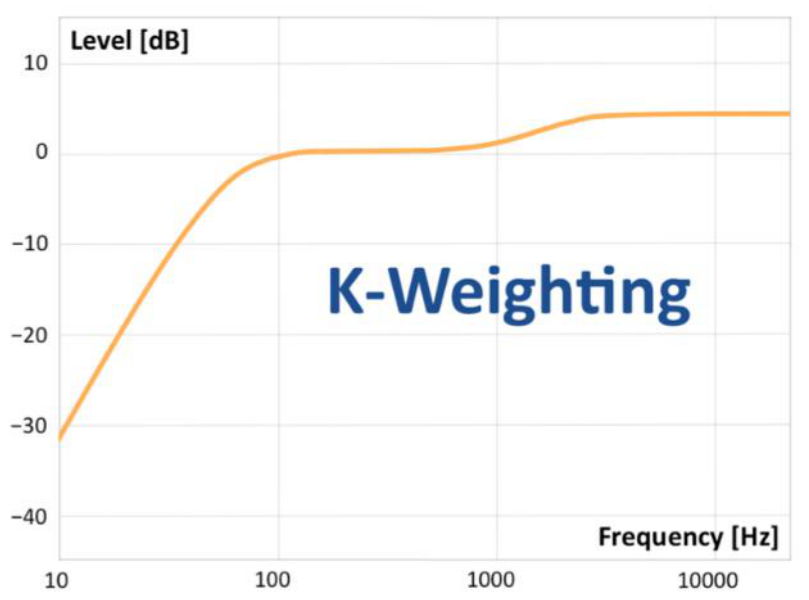
Figure 2.
Channel processing and summation in accordance with Recommendation ITU-R BS.1770 [4].
Figure 2.
Channel processing and summation in accordance with Recommendation ITU-R BS.1770 [4].
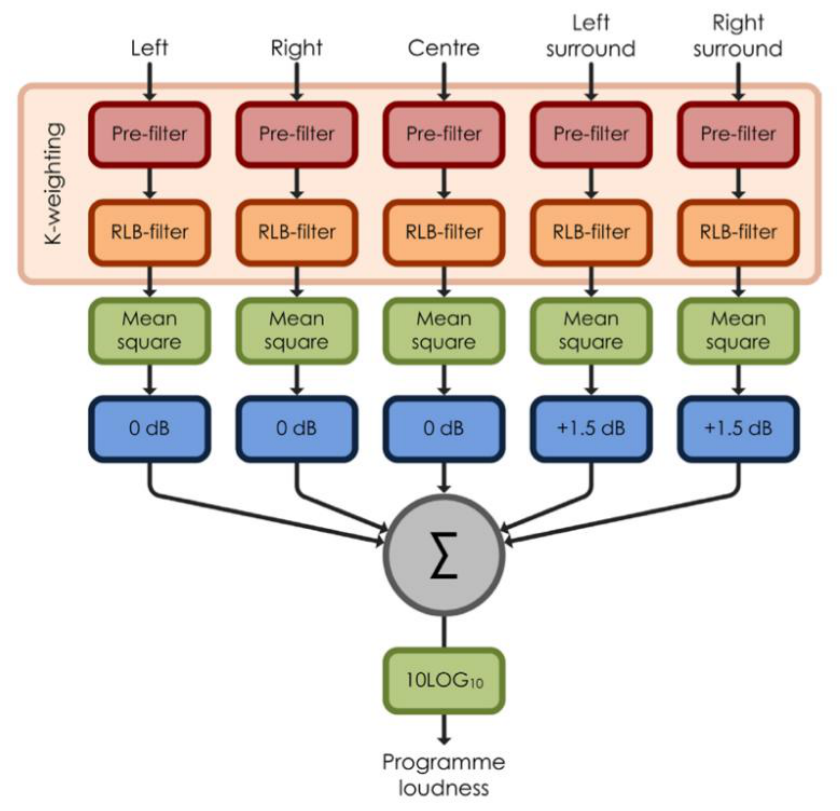
Figure 3.
Analysis of the file 1770-2 Conf Stereo VinL+R-23LKFS from the compliance material for Recommendation ITU-R BS.1770 [22], processed by the application based on the pyloudnorm package [7].
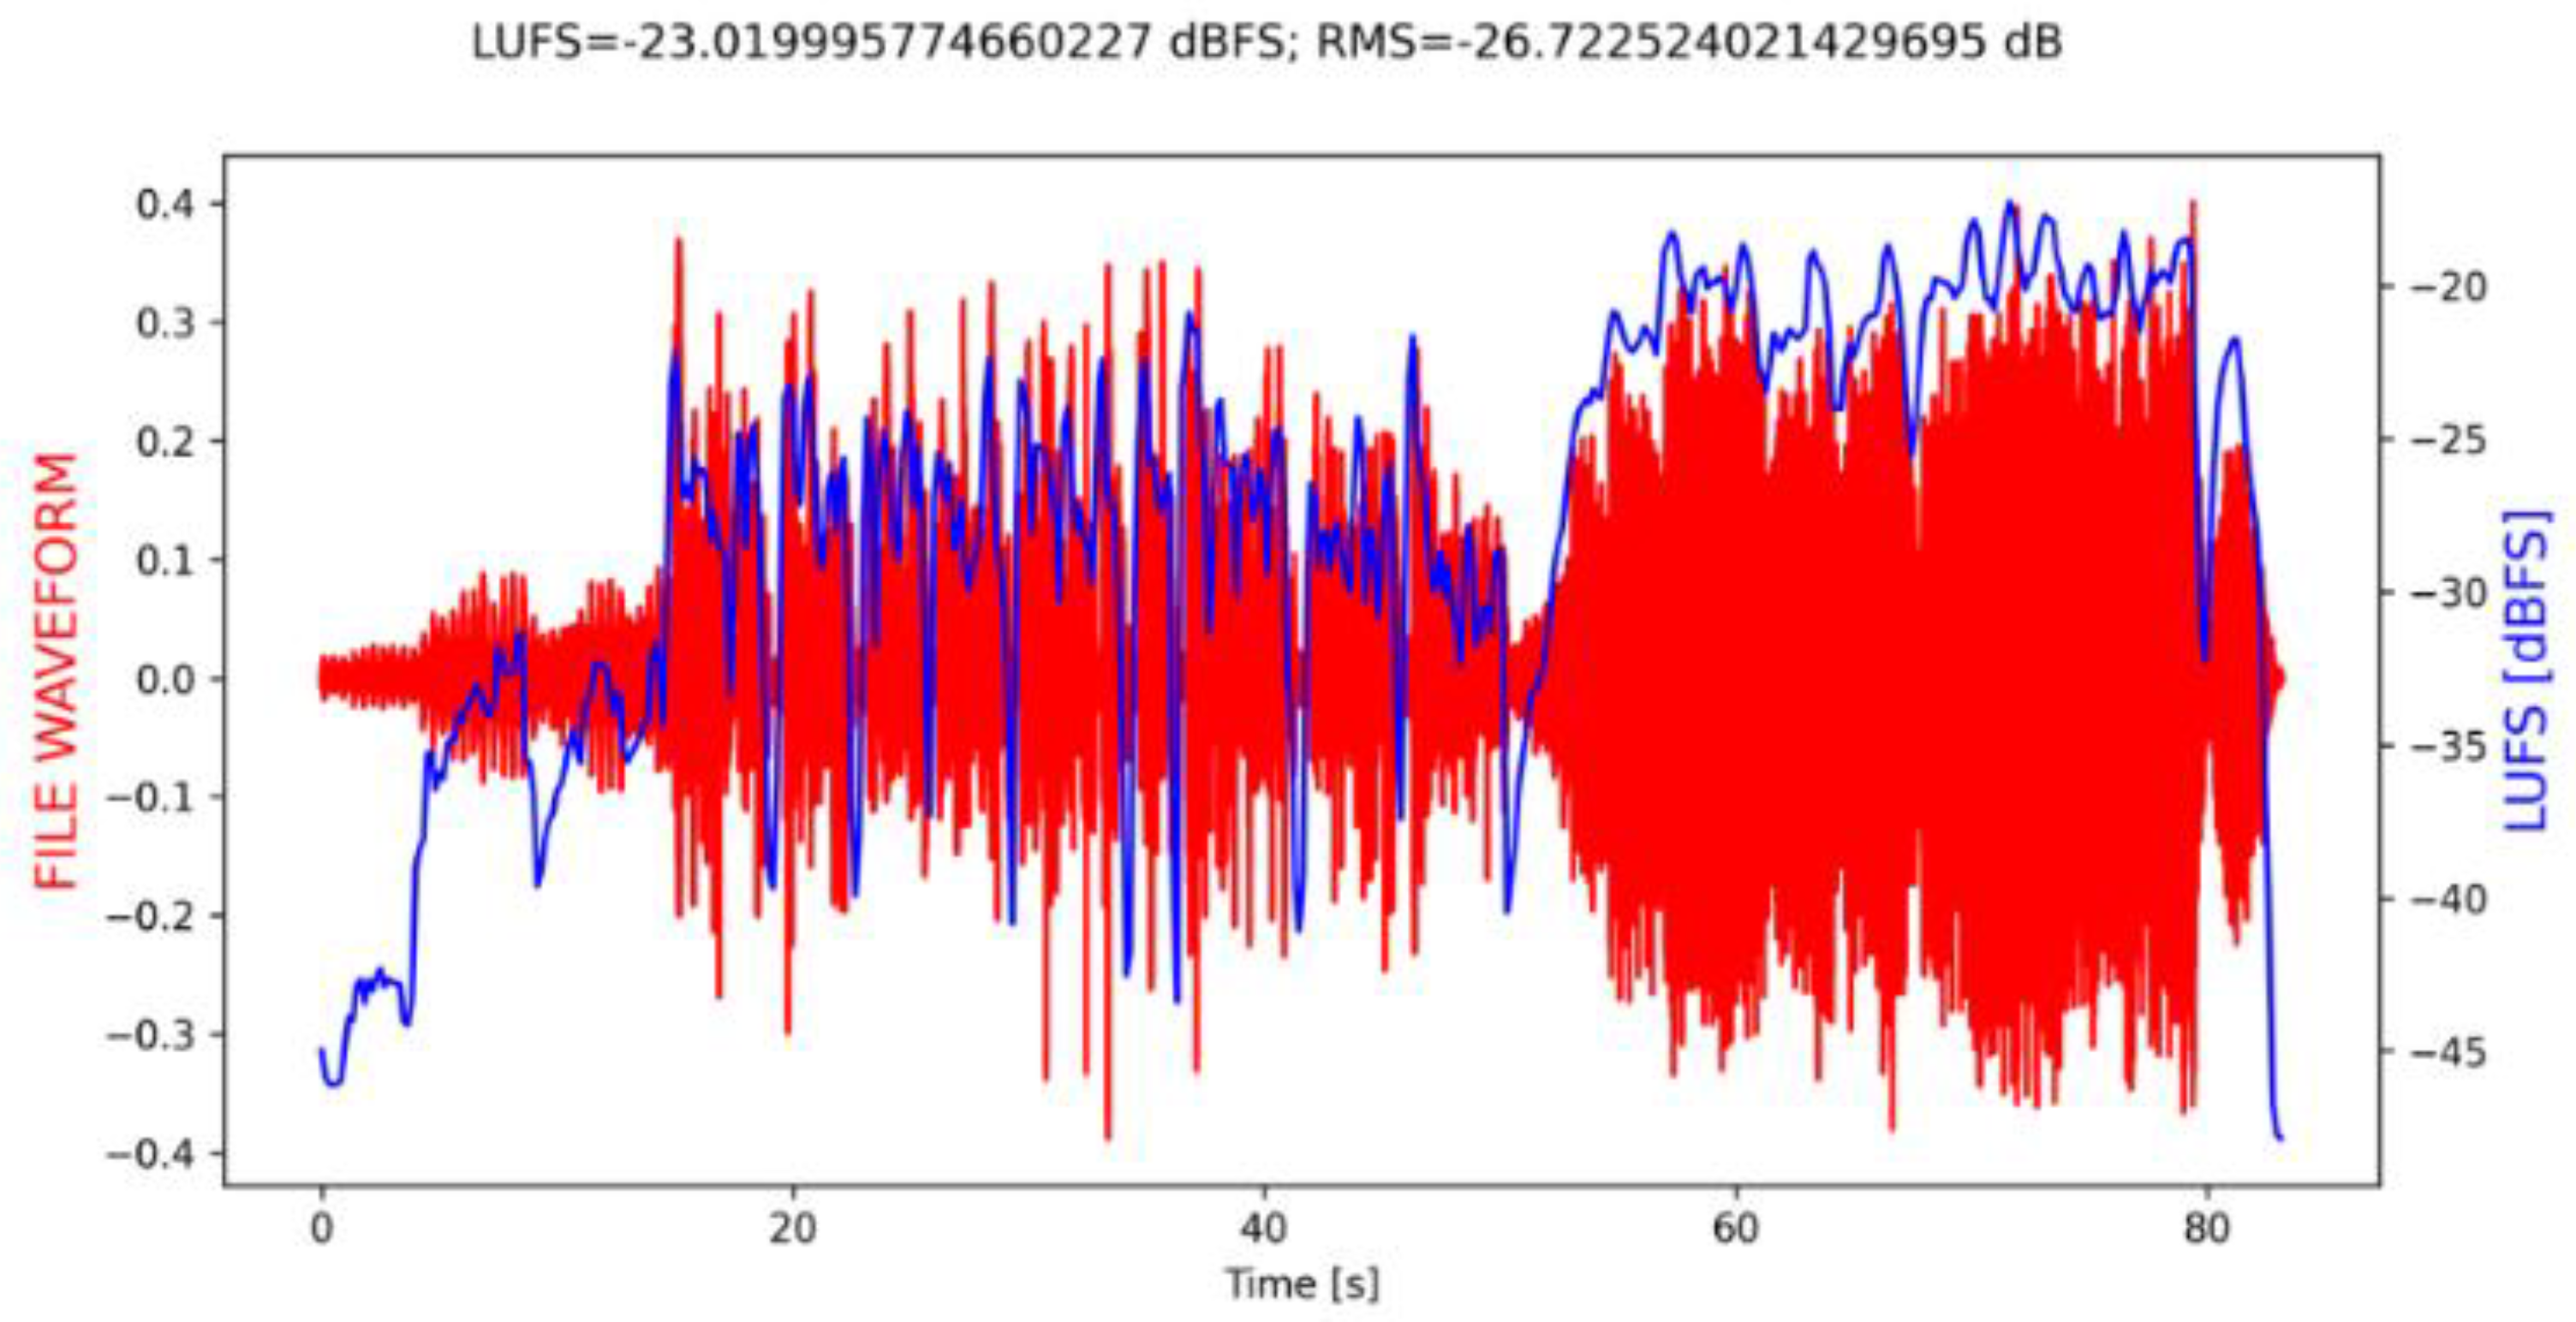
Figure 4.
Objective analysis of the advertisement part of sample 11 performed by the application (the integrated loudness and RMS values are given in the caption above the graph).
Figure 4.
Objective analysis of the advertisement part of sample 11 performed by the application (the integrated loudness and RMS values are given in the caption above the graph).
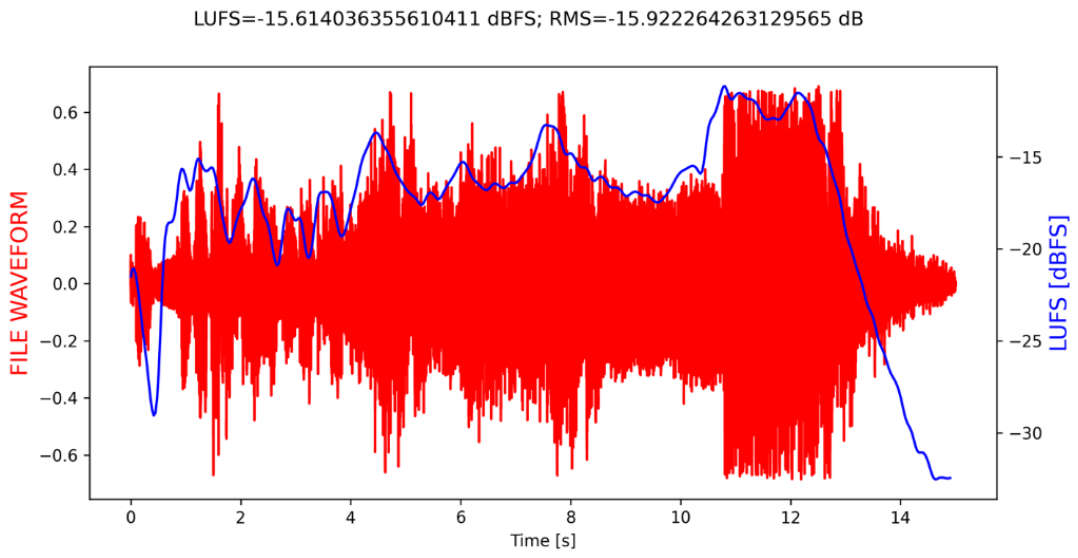
Figure 5.
Example comparison of the advertisement loudness against the reference material using the webMUSHRA-based interface.
Figure 5.
Example comparison of the advertisement loudness against the reference material using the webMUSHRA-based interface.
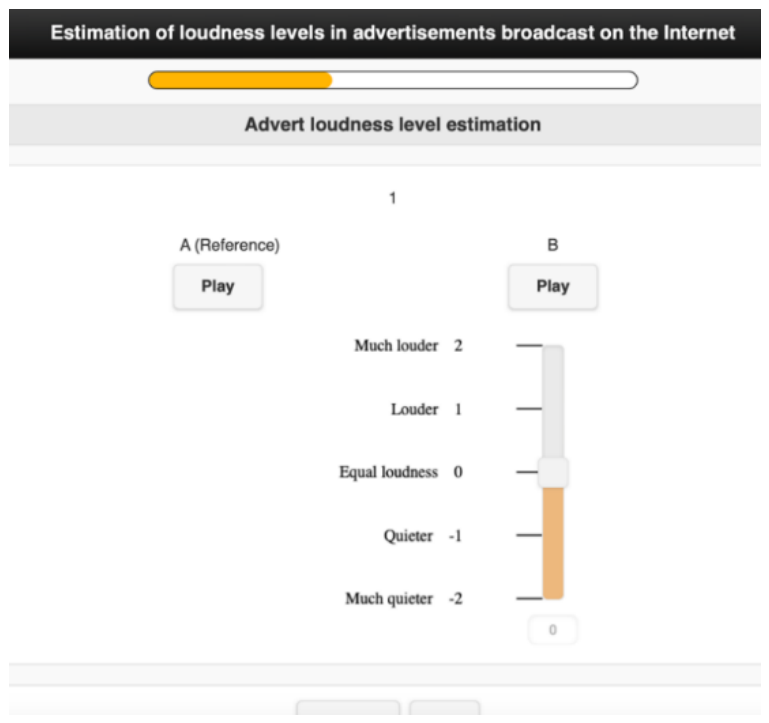
Figure 6.
Correlation between the objective and subjective assessments for the entire research sample.
Figure 6.
Correlation between the objective and subjective assessments for the entire research sample.
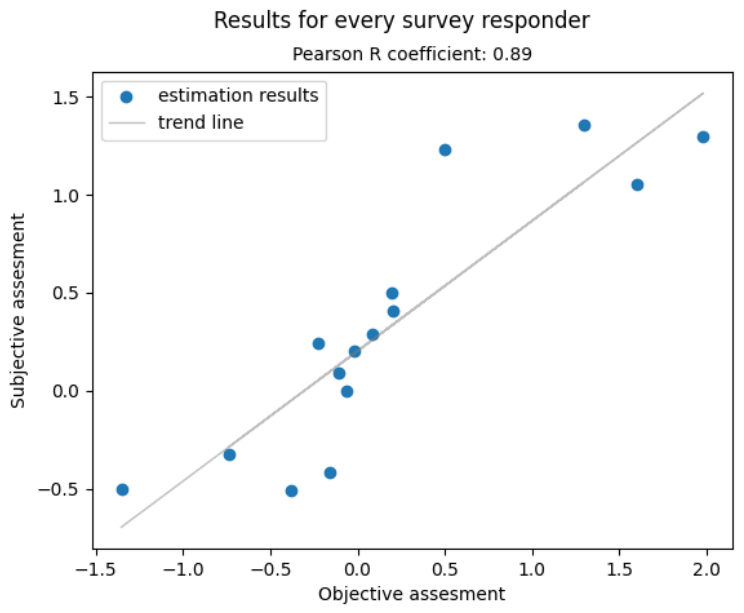

Table 1.
Internet services collated with the individual requirements for the maximum loudness level and the type of the accompanying program content.
Table 1.
Internet services collated with the individual requirements for the maximum loudness level and the type of the accompanying program content.
| ID | Advertiser | Source | Content Type | Required Loudness [LUFS] |
|---|---|---|---|---|
| 1 | Carrefour | RMF FM | Music | N/A |
| 2 | Media Expert | RMF FM | Music | N/A |
| 3 | Budros.pl | Spotify | Music | −14 |
| 4 | Lotto | PR Czwórka | Broadcast | N/A |
| 5 | Self-promotion | PR Jedynka | Music | N/A |
| 6 | Liporedium | player.pl | Film | −23 |
| 7 | Bioliq | player.pl | Film | −23 |
| 8 | Nicorette | WP Pilot | Film | −23 |
| 9 | Movie trailer | cda.pl | Film | N/A |
| 10 | BNP Paribas | TVP VOD | Broadcast | −23 |
| 11 | Dafi | TVP VOD | Film | −23 |
| 12 | Sarazolin | TVP VOD | Music | −23 |
| 13 | Allegro | TVP VOD | Broadcast | −23 |
| 14 | Fortuna | cda.pl | Broadcast | N/A |
| 15 | Stihl | cda.pl | Broadcast | N/A |
Table 2.
Integrated loudness of each collected sample as determined by the application. (*) denotes compliance with the −23 LUFS target.
Table 2.
Integrated loudness of each collected sample as determined by the application. (*) denotes compliance with the −23 LUFS target.
| ID | Advertiser | Advertisement Loudness [LUFS] | Reference Loudness [LUFS] | Source |
|---|---|---|---|---|
| 1 | Carrefour | −6.235 | −6.736 | RMF FM |
| 2 | Media Expert | −6.078 | −7.213 | RMF FM |
| 3 | Budros.pl | −5.782 | −13.228 | Spotify |
| 4 | Lotto | −13.637 | −12.349 | PR Czwórka |
| 5 | Self-promotion | −17.268 | −18.445 | PR Jedynka |
| 6 | Liporedium | −23.166 * | −22.784 * | player.pl |
| 7 | Bioliq | −23.434 * | −23.338 * | player.pl |
| 8 | Nicorette | −17.005 | −26.198 * | WP Pilot |
| 9 | Movie trailer | −15.614 | −27.012 * | cda.pl |
| 10 | BNP Paribas | −22.233 | −21.605 | TVP VOD |
| 11 | Dafi | −23.821 * | −22.918 * | TVP VOD |
| 12 | Sarazolin | −23.124 * | −18.869 | TVP VOD |
| 13 | Allegro | −25.559 * | −23.361 * | TVP VOD |
| 14 | Fortuna | −12.139 | −15.003 | cda.pl |
| 15 | Stihl | −25.458 * | −17.673 | cda.pl |
Table 3.
ANOVA and Tukey post hoc test results for the respective listener expertise groups.
| Knowledge Level | F Statistic | Significance p | Significantly Different Sample Pairs |
|---|---|---|---|
| Expert | 16.459966 | 0.000077 | 60 |
| Average | 12.236133 | 0.000592 | 42 |
| Low | 5.040423 | 0.0269 | 34 |
Table 4.
ANOVA and Tukey post hoc test results for the listener groups stratified by self-reported hearing problems.
Table 4.
ANOVA and Tukey post hoc test results for the listener groups stratified by self-reported hearing problems.
| Hearing Problems | F Statistic | Significance p | Significantly Different Sample Pairs |
|---|---|---|---|
| No | 38.388984 | 1.480 × 10⁻⁹ | 69 |
| Yes | 0.217031 | 0.643056 | 3 |
Disclaimer/Publisher’s Note: The statements, opinions and data contained in all publications are solely those of the individual author(s) and contributor(s) and not of MDPI and/or the editor(s). MDPI and/or the editor(s) disclaim responsibility for any injury to people or property resulting from any ideas, methods, instructions or products referred to in the content. |
© 2026 by the authors. Licensee MDPI, Basel, Switzerland. This article is an open access article distributed under the terms and conditions of the Creative Commons Attribution (CC BY) license (http://creativecommons.org/licenses/by/4.0/).
Copyright: This open access article is published under a Creative Commons CC BY 4.0 license, which permit the free download, distribution, and reuse, provided that the author and preprint are cited in any reuse.


