

Submitted:
03 August 2026
Posted:
03 August 2026
You are already at the latest version
Abstract
Hail and sudden heavy rainfall regularly destroy vegetable and grain crops in the state of Puebla, Mexico, with the state’s rural-development authority reporting thousands of damaged hectares within a single growing cycle. This paper presents SPAI-EH, a low-cost Internet of Things system that detects intense rainfall and hail in real time, automatically closes a protective gate over the affected plot, and routes the captured water toward irrigation reuse. The pilot implementation uses an ESP32 microcontroller simulated in Wokwi, combining a DHT22 temperature and humidity sensor with an analog potentiometer that emulates a rain and hail intensity sensor, a servo-actuated gate, a warning LED, and a liquid-crystal display. Readings are classified locally through threshold rules and, when connectivity is available, through a call to a cloud generative-AI model that returns a hazard classification and a gate action. Every reading is stored in an Oracle Application Express database accessed through RESTful web services, and a MIT App Inventor mobile application lets a grower monitor five simulated plots on a map and manually close a gate. Across the recorded test window, the system correctly distinguished normal conditions from three simulated hail events and one heavy-rain event in a single plot, while the remaining plots stayed within expected ranges. The paper also discusses the applicable IEEE IoT standards and the gap between the classroom pilot and a field-ready deployment.
Keywords:
agricultural IoT
; cloud database
; ESP32
; generative AI
; hail detection
I. Introduction
Hail and sudden heavy rainfall are recurrent threats to agriculture in the state of Puebla, Mexico. In late May 2026 alone, state authorities reported hail damage across roughly 170 hectares in the Izta-Popo region from a single storm [1], while Puebla’s Secretaría de Desarrollo Rural documented more than 3,156 hectares affected by atypical rainfall and hail across 33 municipalities within one growing cycle, with vegetable crops such as broccoli, squash, onion, and tomato among the hardest hit [2]. The state government has had to activate a dedicated contingency fund, worth 30 million pesos, to compensate producers after events of this kind [1]. These losses fall disproportionately on smallholder growers who cannot afford permanent greenhouse infrastructure, and they connect directly to United Nations Sustainable Development Goal (SDG) 15, Life on Land, together with SDG 2 (Zero Hunger), SDG 6 (Clean Water and Sanitation), and SDG 13 (Climate Action) [3].
This paper presents SPAI-EH (Sistema de Protección Agrícola Inteligente contra Eventos Hidrometeorológicos Extremos), a low-cost Internet of Things (IoT) system that detects intense rainfall and hail, closes a protective gate over the crop automatically, and channels the water collected during the event toward a storage tank for later irrigation reuse. Unlike a purely reactive compensation mechanism such as the contingency fund described above, SPAI-EH aims to prevent physical damage before it happens while also recovering a resource, water, that would otherwise run off. The system combines an ESP32 microcontroller simulated in Wokwi, an Oracle Application Express (APEX) cloud database accessed through Oracle REST Data Services (ORDS), a MIT App Inventor mobile client, and a cloud-hosted generative artificial-intelligence (AI) model used as the hazard classifier.
The remainder of the paper is organized as follows. Section II reviews related agricultural IoT work. Section III describes the four layers of the system architecture: sensing and actuation, decision logic, the cloud data layer, and the mobile client. Section IV reports the observations collected during the test window and discusses the gap between the classroom pilot and a field-ready deployment. Section V concludes with an assessment of the value, client readiness, and personal readiness questions posed by the course rubric.
II. Related Work
Several recent projects follow the same general pattern adopted here: an inexpensive microcontroller reads one or more environmental sensors, applies a decision rule, and forwards the result to a cloud service and a mobile interface. Soussi et al. [4] reviewed the precision-agriculture literature and highlighted architectures that pair a DHT22 temperature/humidity sensor with a low-cost Wi-Fi-enabled microcontroller and a cloud dashboard, the same pairing adopted for SPAI-EH, noting that this configuration remains attractive because it is inexpensive and easy for non-specialist growers to interpret.
Closer to the specific hazard addressed here, Shahab et al. [5] describe a rule-based decision layer that activates “hail protectors” once a hail event is detected in a field, combining joint and single-condition fallback rules in a way that parallels the two-tier logic used in SPAI-EH: deterministic threshold rule acts as a safety net, while a higher-level model, in this case a cloud generative-AI model rather than a rule engine, adjudicates the final classification when connectivity allows. Hasib and Akib [6] describe a comparable ESP32-based platform that reads temperature, humidity, and water-level sensors and streams the data to a cloud analytics service with automated alerts; SPAI-EH follows the same sensing-to-cloud-to-alert pattern but replaces the generic dashboard with an Oracle APEX application built specifically around the gate-closing decision, and adds a mobile client capable of issuing that decision manually.
The convergence of these independent projects on a threshold-plus-model hybrid, rather than a single classifier, suggests that this pattern is becoming a pragmatic default for weather-triggered actuation in low-cost agricultural IoT. At the same time, reviews of IoT and AI in agriculture repeatedly flag connectivity limitations in rural areas as a structural constraint on this class of system [4]. This concern is directly relevant to SPAI-EH because the gate-closing decision is time-critical and cannot be allowed to stall while a remote model responds; Section III-B describes how the local threshold fallback addresses this constraint, and Section IV-B discusses its practical implications.
III. System Design and Implementation
SPAI-EH is organized in four layers, summarized in Figure 1: a sensing-and-actuation layer built on an ESP32 development board, a decision-logic layer that classifies each reading, a cloud data layer built on Oracle APEX, and a mobile client built with MIT App Inventor. The classroom pilot models five simulated plots, Parcela Norte, Parcela Sur, Parcela Valle, Parcela Loma, and Parcela Río, of which Parcela Norte was instrumented in the Wokwi simulator; the remaining four were represented directly in the Oracle APEX database and the mobile client to demonstrate the multi-plot dashboard and map.
A. Sensing and Actuation Layer
The ESP32 firmware, written in MicroPython and executed in the Wokwi simulator, reads a DHT22 sensor [7] for ambient temperature and relative humidity and an analog input (0-4095 counts) from a potentiometer that stands in for a tipping-bucket rain gauge and a piezoelectric hail sensor, the two sensors originally proposed for the field version of the system. Wokwi does not currently provide simulation models for either of those sensors, so the pilot represents their combined intensity signal as a single analog value, which is sufficient to validate the classification and actuation logic before a field deployment replaces it with the real sensors. Actuation is provided by a servo motor that opens or closes the protective gate (0° open, 90° closed), a LED that signals an active alert, and a 16x2 I2C liquid-crystal display that shows the current temperature, humidity, classification, and action for on-site diagnostics. Figure 2 shows the simulated wiring: the DHT22 and the potentiometer feed the ESP32’s digital and analog pins, while the LCD, the LED and its current-limiting resistor, and the servo are driven from separate GPIO pins; the display in the screenshot already reads “GRANIZO - CERRAR”, captured during one of the hail events discussed in Section IV-A.
B. Decision Logic: Local Thresholds and Generative AI
Each reading is classified into one of three states, NORMAL, LLUVIA_INTENSA (heavy rain), or GRANIZO (hail), and each state maps to an action, SIN_ACCION or CERRAR (close). A local rule provides an immediate, connectivity-independent classification: readings at or above 3000 counts are treated as GRANIZO and readings at or above 1500 counts as LLUVIA_INTENSA, both triggering CERRAR. When the ESP32 is connected to Wi-Fi, the firmware enables a second, higher-level classification step: it sends the current temperature, humidity, and analog reading to a Gemini generative-AI model [8] over HTTPS, together with the same threshold values, and asks it to return a single classification-action pair. If the request fails, times out, or returns an unexpected format, the firmware falls back to the local rule, so the gate-closing decision is never left waiting on the network. To avoid unnecessary AI calls, the firmware only re-evaluates when the analog reading changes by at least 50 counts from the previous cycle, holding the last decision otherwise.
Figure 3 shows the core of this decision loop, abridged for space. The Gemini API key used during development is redacted here; because the Wokwi project is publicly viewable, that key should be revoked and replaced before the code is shared or submitted further.
C. Cloud Data Layer (Oracle APEX / ORDS)
Every classified reading is stored in an Oracle APEX schema exposed through Oracle REST Data Services (ORDS) [9]. The schema, shown in Figure 4, is organized around three tables related in a 1:N chain. PARCELA registers each of the five monitored plots once, with its name, crop, area in hectares, municipality, and latitude/longitude, the same coordinates plotted as map markers in Section III-D. SENSOR (Table 1) registers each physical sensor once, referencing its plot through ID_PARCELA, with its type, model, unit of measurement, installation date, and operational status; this design lets the same firmware logic serve any number of plots simply by inserting new SENSOR rows, and echoes, at the schema level, the self-describing-transducer philosophy of IEEE 1451 discussed in the Appendix. LECTURA_SENSOR stores each individual reading, referencing its sensor through ID_SENSOR, with a timestamp, numeric value, classification, and gate action.
The ESP32 posts three LECTURA_SENSOR rows per decision cycle, one per sensor of Parcela Norte, through a POST request to the /proyecto/lecturas ORDS endpoint, spaced 400 ms apart to avoid tripping the platform’s web application firewall. Figure 5 and Figure 6 show the corresponding raw table views in Oracle APEX’s SQL Workshop.
Table 2 summarizes the average temperature and humidity recorded across the five monitored plots during the test window, and Figure 7 shows the corresponding Oracle APEX dashboards.
Figure 8 lists a representative SQL Workshop query behind these aggregations.
D. Mobile Monitoring and Control (MIT App Inventor)
A three-screen MIT App Inventor [10] application, summarized in Table 3, gives a grower a mobile view of the five plots and a way to intervene manually. Screen1 issues a GET request to the /proyecto/parcelas ORDS endpoint, decodes the JSON response into a dictionary, and colors a map marker per plot, for example red for GRANIZO, so a grower can identify an at-risk plot at a glance. Tapping a marker opens Screen2, which shows the plot name and a “Cerrar compuerta / activar malla” button; pressing it sends a POST request with a small JSON payload, {“parcela”: name, “accion”: “CERRAR”}, to the /proyecto/compuertas endpoint, giving the grower a manual override independent of the automatic ESP32 decision. Screen3 exposes the raw JSON returned by the last GET request, used during development to verify that the ORDS endpoint and the App Inventor client agreed on the data format.
Figure 9 shows the resulting client: the Screen1 map colored by clasificacion_evento, the Screen2 manual-override view for Parcela Norte, and the block logic implementing Screen2.
E. Cost and Bill of Materials
Table 4 lists approximate 2026 online-marketplace prices for the components that would instrument one plot in a field deployment, using the tipping-bucket rain gauge and piezoelectric hail sensor proposed in Section IV-B rather than the potentiometer proxy used in the Wokwi pilot. The bill of materials totals roughly USD 45-80 per plot, well within the low-cost requirement stated in Section I, and excludes the LoRaWAN gateway shared across several plots and the mechanical gate itself, whose cost scales with the size of the protected area rather than with the number of sensors.
For context, a single severe hailstorm in Cuayucatepec, Puebla, was reported to cause losses of up to 200,000 pesos, roughly USD 10,000-11,000, per hectare on crops such as chile and maize [11], two to three orders of magnitude above the per-plot hardware cost in Table 4. This gap does not by itself prove that SPAI-EH would have prevented that specific loss, since the outcome depends on gate size, response time, and hail severity, but it supports the case, developed further in Section V, that hardware cost is not the limiting factor for adoption; the limiting factors are the sensing and connectivity gaps identified in Section IV-B and the deployment model discussed in Section V.
IV. Results and Discussion
A. Observations
Over the recorded test window, the temperature and humidity sensors of the five plots stayed within the ranges summarized in Table 2, between 18 °C and 20 °C and between 64% and 70% relative humidity, consistent with typical daytime conditions in the highlands of Puebla. The rain/hail proxy sensor of Parcela Sur registered three readings at its maximum value (100%) and one intermediate reading near 60%, visible as sharp spikes in Figure 10, while the remaining plots stayed within a 10%-30% band; these four events are consistent with three simulated hail events and one heavy-rain event correctly triggering the CERRAR action, and the system did not raise any false alerts for the other plots during the same window.
The sample of stored readings also shows finer-grained, sensor-specific classification labels, Húmedo for elevated humidity readings and Calor for elevated temperature readings, alongside Normal and Nivel Bajo, together with Abrir and Mantener actions, for the rain-proxy sensor when its reading fell back below the operative threshold. This indicates that the business rules applied at the database layer refine the coarser three-state classification produced by the firmware into a more actionable, per-sensor status for the dashboard and the mobile client.
B. Limitations and the Pilot-to-Field Gap
Three gaps separate the present pilot from a field-ready deployment. First, connectivity: the pilot reaches Oracle APEX over the simulated Wi-Fi network Wokwi-GUEST, which is realistic for a single ESP32 near a router but not for parcels kilometers apart in rural Puebla; a field deployment should retain the IEEE 802.15.4-based mesh or LoRaWAN gateway architecture proposed in the original project idea, consistent with field evidence that LoRaWAN sustains reliable delivery over multi-kilometer links in rural areas without cellular or power infrastructure [14], discussed further in the Appendix. Second, sensing: the single analog rain/hail proxy used here should be replaced with the tipping-bucket rain gauge and piezoelectric or acoustic hail sensor originally proposed, since a real deployment must distinguish the two hazards from their physical signatures rather than from one shared analog channel. Third, the reliance on a cloud generative-AI model for part of the classification introduces a dependency that reviews of agricultural IoT identify as a structural risk in low-connectivity rural areas [4]; the local threshold fallback mitigates this for the gate-closing decision itself, but a field version should periodically validate that the AI-assisted classification agrees with the threshold rule, and log any disagreement for later review rather than silently trusting either source, since generative models can produce fluent but incorrect outputs even when queried with well-specified prompts [15]. None of these gaps invalidate the architecture demonstrated here; they define the next iteration’s scope.
C. Security Considerations
Two security gaps surfaced during implementation and are worth flagging for any team building on this work. First, the firmware embeds its generative-AI API key as a plain-text constant; because the Wokwi project is publicly viewable by design, that key was exposed and had to be revoked. A field version should load credentials from a build-time secret or a hardware secure element rather than hardcoding them in source that may be shared, simulated, or version-controlled in the open, and should scope the key to the minimum API access it needs. Second, the /proyecto/lecturas and /proyecto/compuertas ORDS endpoints accept POST requests with only a Content-Type header and no authentication token, so any client that discovers the URL, not only the ESP32 or the App Inventor app, could inject fabricated readings or issue a gate command. This is acceptable for a classroom pilot on a shared academic APEX workspace, but a field deployment should require a per-device API key or OAuth client credential on both endpoints, consistent with the message-security goals that motivate standards such as IEEE 1451 [12], discussed further in the Appendix.
V. Conclusions
This paper presented SPAI-EH, a low-cost IoT system that combines an ESP32 microcontroller, a two-tier local-threshold-and-generative-AI decision layer, an Oracle APEX cloud database, and a MIT App Inventor mobile client to detect hail and heavy rain and close a protective gate before crop damage occurs. The course rubric asks three questions of this kind of project, which we answer directly.
The pilot generates measurable value at its current scale: the system correctly separated the three simulated hail events and one heavy-rain event of Parcela Sur from the normal readings of the remaining four plots, giving a grower earlier, more specific warning than a general weather forecast, and it recovers water that a gate-only system would otherwise let run off, at a per-plot hardware cost (Table 4) two to three orders of magnitude below the losses documented for a single severe hailstorm [11]. This value is conditional on closing the three gaps identified in Section IV-B before any real deployment.
The client, the smallholder grower described in Section I, is only partially ready for this technological implementation. A basic smartphone and an intermittent data connection, which the App Inventor client already assumes, are realistic for most of the growers affected by the storms cited in Section I, but the recurring 30-million-peso contingency fund [1] suggests that many of these growers currently rely on post-hoc compensation rather than on any preventive instrumentation, so adoption would require a low-cost hardware package, training, and probably a subsidized or cooperative deployment model rather than an individual purchase.
Our team is ready to carry out the software and integration side of this kind of implementation, though not yet its full field deployment. The pilot shows that we can design and integrate a four-layer IoT system end to end, from an embedded sensor loop to a cloud REST API and a mobile client, and reason about the trade-off between a fast local rule and a more capable but slower cloud model. What we are not yet in a position to do alone is the physical and regulatory work of a field deployment, weatherproof enclosures, an actual gate mechanism sized for a real structure, and coordination with the plot owners and the state’s rural-development authority, which would require collaborators outside this course.
Future work should close the sensing gap described in Section IV-B, add the disagreement logging suggested for the AI-assisted classification, and pilot the system on one real, small plot before considering the multi-plot rollout implied by Figure 1.
Acknowledgments
The authors thank the instructors of Taller Internet de las Cosas para la Inteligencia de Datos at Instituto Tecnológico y de Estudios Superiores de Monterrey for the Oracle APEX/ORDS endpoints and the Wokwi base project used in this work.
Appendix Applicable IEEE IoT Standards
A. IEEE 802.15.4 (Wireless Personal Area Networks)
IEEE 802.15.4 is part of the IEEE 802.15 series and defines the physical and medium-access-control layers for low-rate wireless personal area networks (LR-WPANs), the basis of protocols such as Zigbee and 6LoWPAN, and is explicitly listed among the IEEE IoT Initiative’s relevant standards activities [12]. It targets low-cost, low-power, low-complexity devices, which matches the low-cost requirement stated in Section I. In the classroom pilot described in Section III, the ESP32 reaches Oracle APEX directly over Wi-Fi (IEEE 802.11), which the Wokwi simulator supports out of the box; in a field deployment spanning several parcels beyond Wi-Fi range, an 802.15.4-based mesh would instead link each plot’s sensor cluster to a local gateway, which would then forward the aggregated data over a wider-area link, consistent with the layered communication design originally proposed for SPAI-EH.
B. IEEE 1451 (Smart Transducer Interface Standard)
IEEE 1451 specifies communication protocols and data formats that let smart transducers, sensors and actuators with self-identification, self-description, and self-calibration capabilities, interoperate over a network regardless of the underlying communication technology, through a Transducer Electronic Data Sheet (TEDS) [12,13]. SPAI-EH does not implement a literal 1451 transducer bus, but the SENSOR table described in Section III-C follows the same self-describing philosophy at the database level: each sensor’s type, model, and unit of measurement are recorded once, so that adding a different sensor model to a plot, for example replacing the potentiometer proxy with a real piezoelectric hail sensor, only requires a new SENSOR row rather than a firmware or schema change. This alignment is useful because Section IV-B identifies exactly that substitution as one of the gaps to close before a field deployment.
References
- “Granizada en Puebla deja afectaciones en 170 has; indemnizarán a productores,” Angulo7, May 28, 2026. [Online]. Available: https://www.angulo7.com.mx/2026/noticias-puebla/granizada-en-puebla-deja-afectaciones-en-170-has-indemnizaran-a-productores/697659/.
- “Suman daños en 3 mil 156 has de cultivo de 33 municipios por caída de granizo en Puebla: SDR,” La Jornada de Oriente. [Online]. Available: https://www.lajornadadeoriente.com.mx/puebla/suman-danos-por-lluvias-y-granizadas/.
- United Nations Department of Economic and Social Affairs. “The 17 Goals,” Sustainable Development. Available online: https://sdgs.un.org/goals.
- Soussi; Zero, E.; Sacile, R.; Trinchero, D.; Fossa, M. Smart Sensors and Smart Data for Precision Agriculture: A Review. Sensors 2024, vol. 24(no. 8), 2647. [Google Scholar] [CrossRef] [PubMed]
- Shahab, H.; Naeem, M.; Iqbal, M.; Aqeel, M.; Ullah, S. S. IoT-driven smart agricultural technology for real-time soil and crop optimization. Smart Agricultural Technology, 2025. [Google Scholar]
- Hasib, A. S. M.; Ahsanul, Sarkar; Akib. An IoT-Based Smart Plant Monitoring and Irrigation System with Real-Time Environmental Sensing, Automated Alerts, and Cloud Analytics. arXiv 2026, arXiv:2601.15830. [Google Scholar]
- Aosong (Guangzhou) Electronics Co., “Digital-output relative humidity & temperature sensor/module DHT22 (DHT22 also named as AM2302),” product datasheet.
- Google, “Gemini API documentation,” Google AI for Developers. Available online: https://ai.google.dev/.
- Oracle Corporation. Oracle REST Data Services (ORDS) Documentation. Available online: https://docs.oracle.com/en/database/oracle/oracle-rest-data-services/.
- Massachusetts Institute of Technology. MIT App Inventor Documentation. Available online: https://appinventor.mit.edu/.
- “Granizada devasta cultivos en Cuayucatepec; pérdidas alcanzan hasta 200 mil pesos por hectárea,” Municipios Puebla, May 28, 2026. Available online: https://municipiospuebla.mx/nota/tehuacan/granizada-devasta-cultivos-en-cuayucatepec-perdidas-alcanzan-hasta-200-mil-pesos-por.
- IEEE Standards Association. IEEE Standards Activities in the Internet of Things (IoT). Available online: https://standards.ieee.org.
- NIST. Understanding the IEEE 1451 Networked Smart Transducer Interface Standard. Available online: https://www.nist.gov/publications/understanding-ieee-1451-networked-smart-transducer-interface-standard.
- Chapungo, N. J.; Postolache, O. Experimental Evaluation of LoRaWAN Connectivity Reliability in Remote Rural Areas of Mozambique. Sensors 2025, vol. 25(no. 19), Art. no. 6027. [Google Scholar] [CrossRef] [PubMed]
- Alansari; Luqman, H. Large Language Models Hallucination: A Comprehensive Survey. arXiv 2025, arXiv:2510.06265. [Google Scholar]
Figure 1.
SPAI-EH four-layer architecture: sensing/actuation, decision logic, cloud data, and mobile client.
Figure 1.
SPAI-EH four-layer architecture: sensing/actuation, decision logic, cloud data, and mobile client.
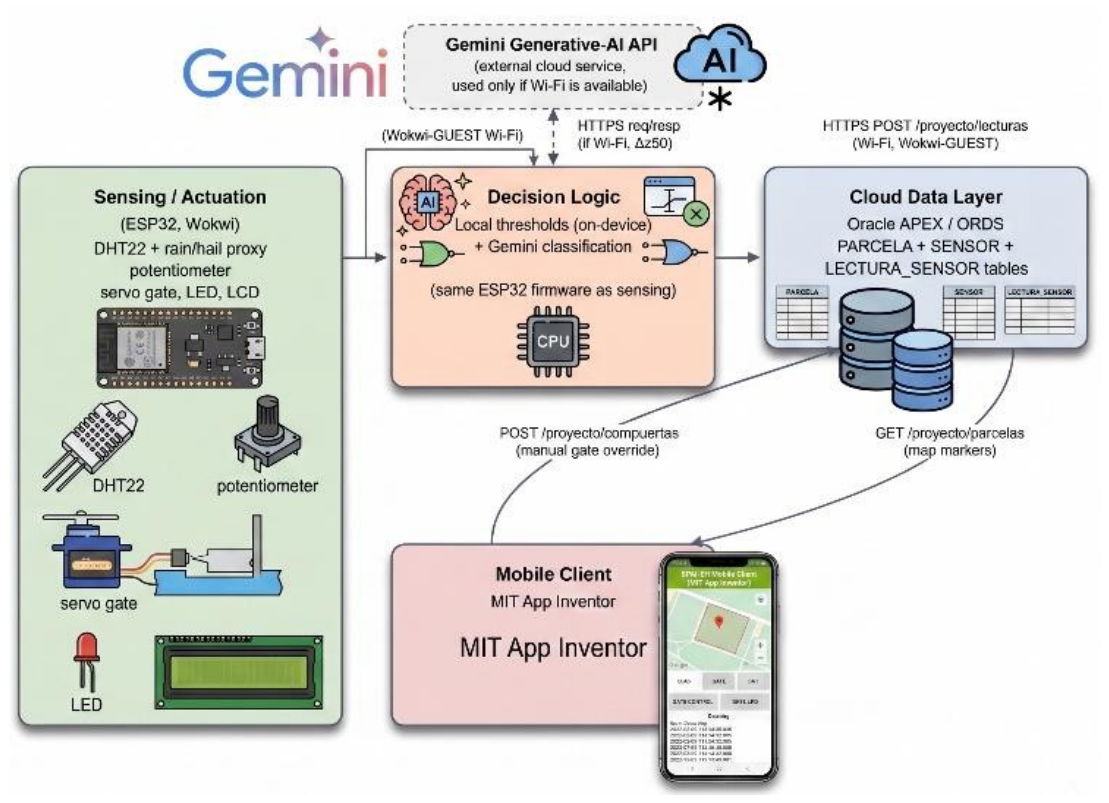
Figure 2.
Wokwi wiring diagram: ESP32 with DHT22, potentiometer (rain/hail proxy), LCD, alert LED, and gate servo.
Figure 2.
Wokwi wiring diagram: ESP32 with DHT22, potentiometer (rain/hail proxy), LCD, alert LED, and gate servo.
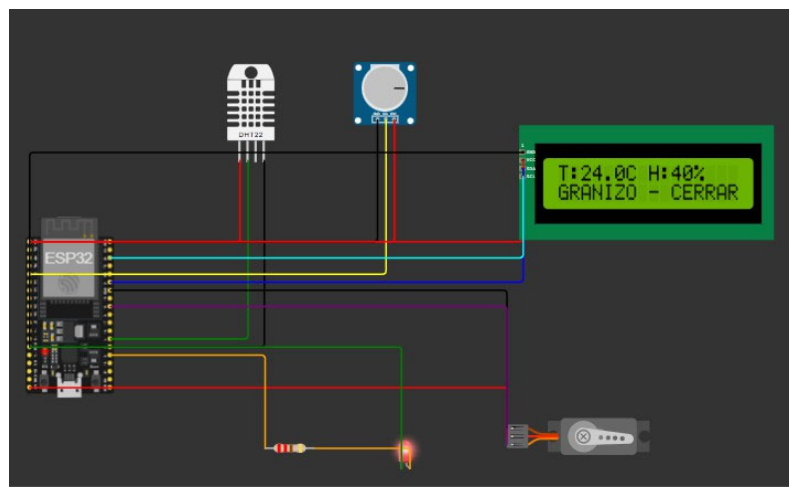
Figure 3.
Core classification and Oracle APEX posting logic (MicroPython, ESP32; excerpt, credential redacted).
Figure 3.
Core classification and Oracle APEX posting logic (MicroPython, ESP32; excerpt, credential redacted).
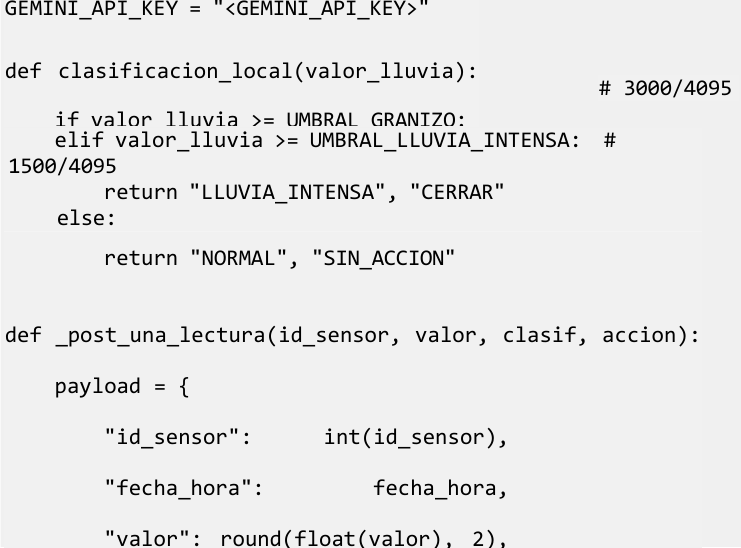
Figure 4.
Entity-relationship diagram of the Oracle APEX schema: PARCELA (1) tiene (N) SENSOR (1) genera (N) LECTURA_SENSOR.
Figure 4.
Entity-relationship diagram of the Oracle APEX schema: PARCELA (1) tiene (N) SENSOR (1) genera (N) LECTURA_SENSOR.
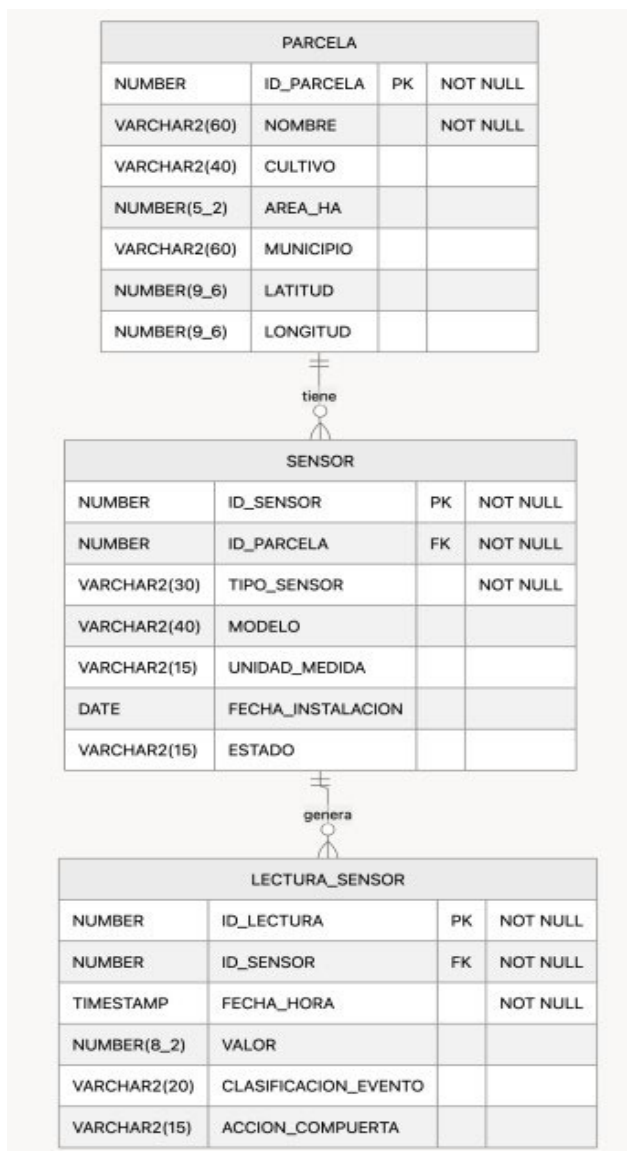
Figure 5.
Oracle APEX SQL Workshop view of the SENSOR table.
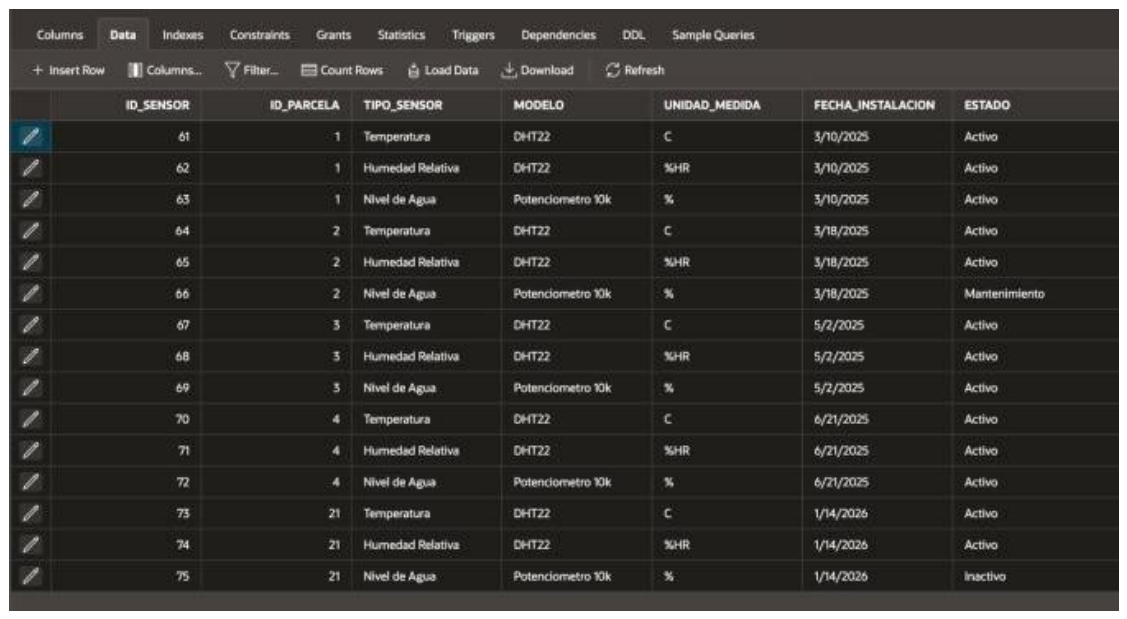
Figure 6.
Oracle APEX SQL Workshop view of the LECTURA_SENSOR table.
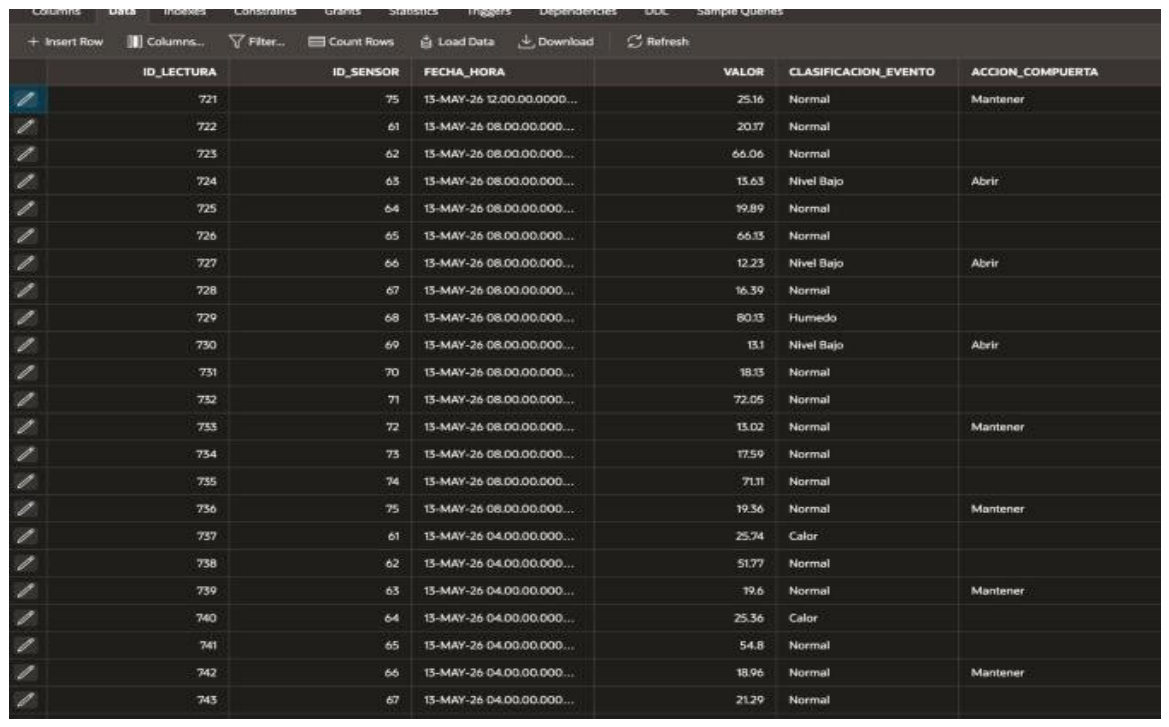
Figure 7.
Oracle APEX dashboards: average temperature (left) and humidity (right) by plot.
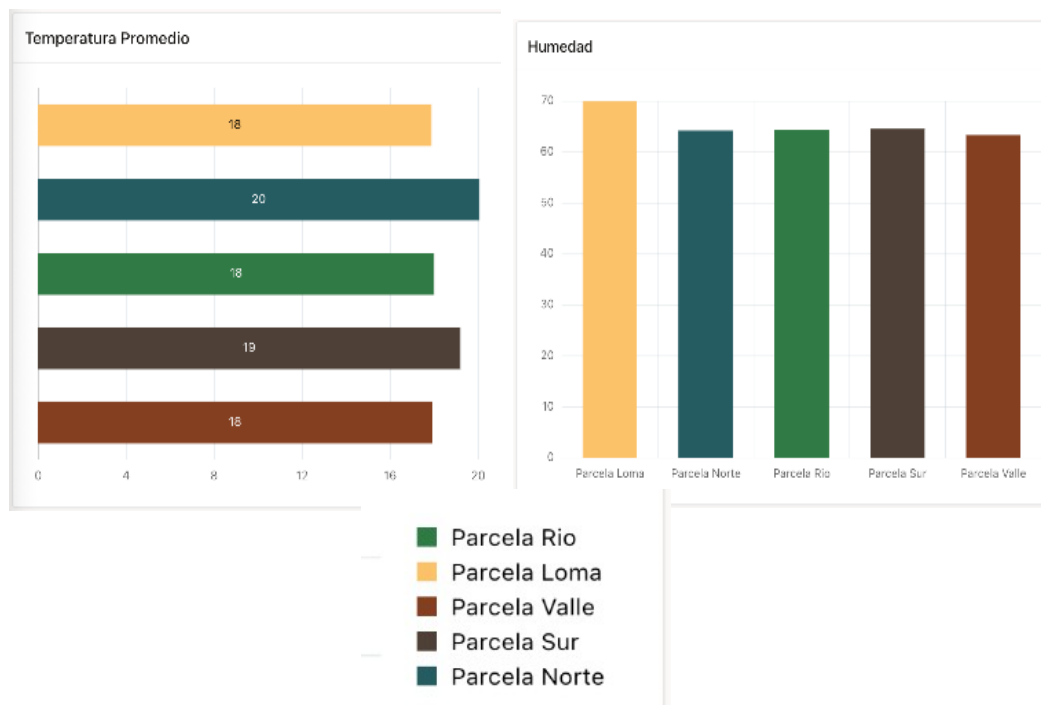
Figure 8.
Sample Oracle APEX SQL query aggregating relative-humidity readings by plot, including the plot coordinates used by the mobile map of Figure 9(a); the temperature dashboard (Figure 7) and the water-level time series (Figure 10) are produced by analogous queries that vary the tipo_sensor filter and the aggregation.
Figure 8.
Sample Oracle APEX SQL query aggregating relative-humidity readings by plot, including the plot coordinates used by the mobile map of Figure 9(a); the temperature dashboard (Figure 7) and the water-level time series (Figure 10) are produced by analogous queries that vary the tipo_sensor filter and the aggregation.
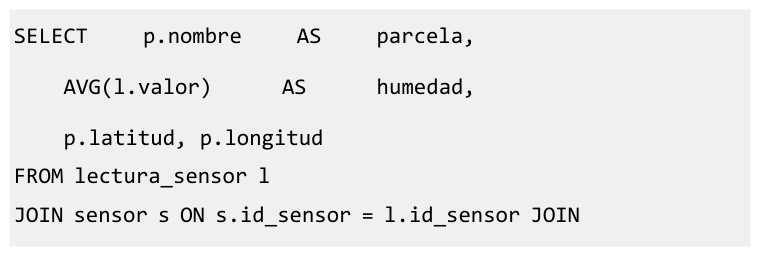
Figure 9.
MIT App Inventor evidence: (a) Screen1 map view colored by clasificacion_evento; (b) Screen2 manual-override view for Parcela Norte; (c) Screen2 block logic (globals, marker lookup, and POST to /proyecto/compuertas).
Figure 9.
MIT App Inventor evidence: (a) Screen1 map view colored by clasificacion_evento; (b) Screen2 manual-override view for Parcela Norte; (c) Screen2 block logic (globals, marker lookup, and POST to /proyecto/compuertas).
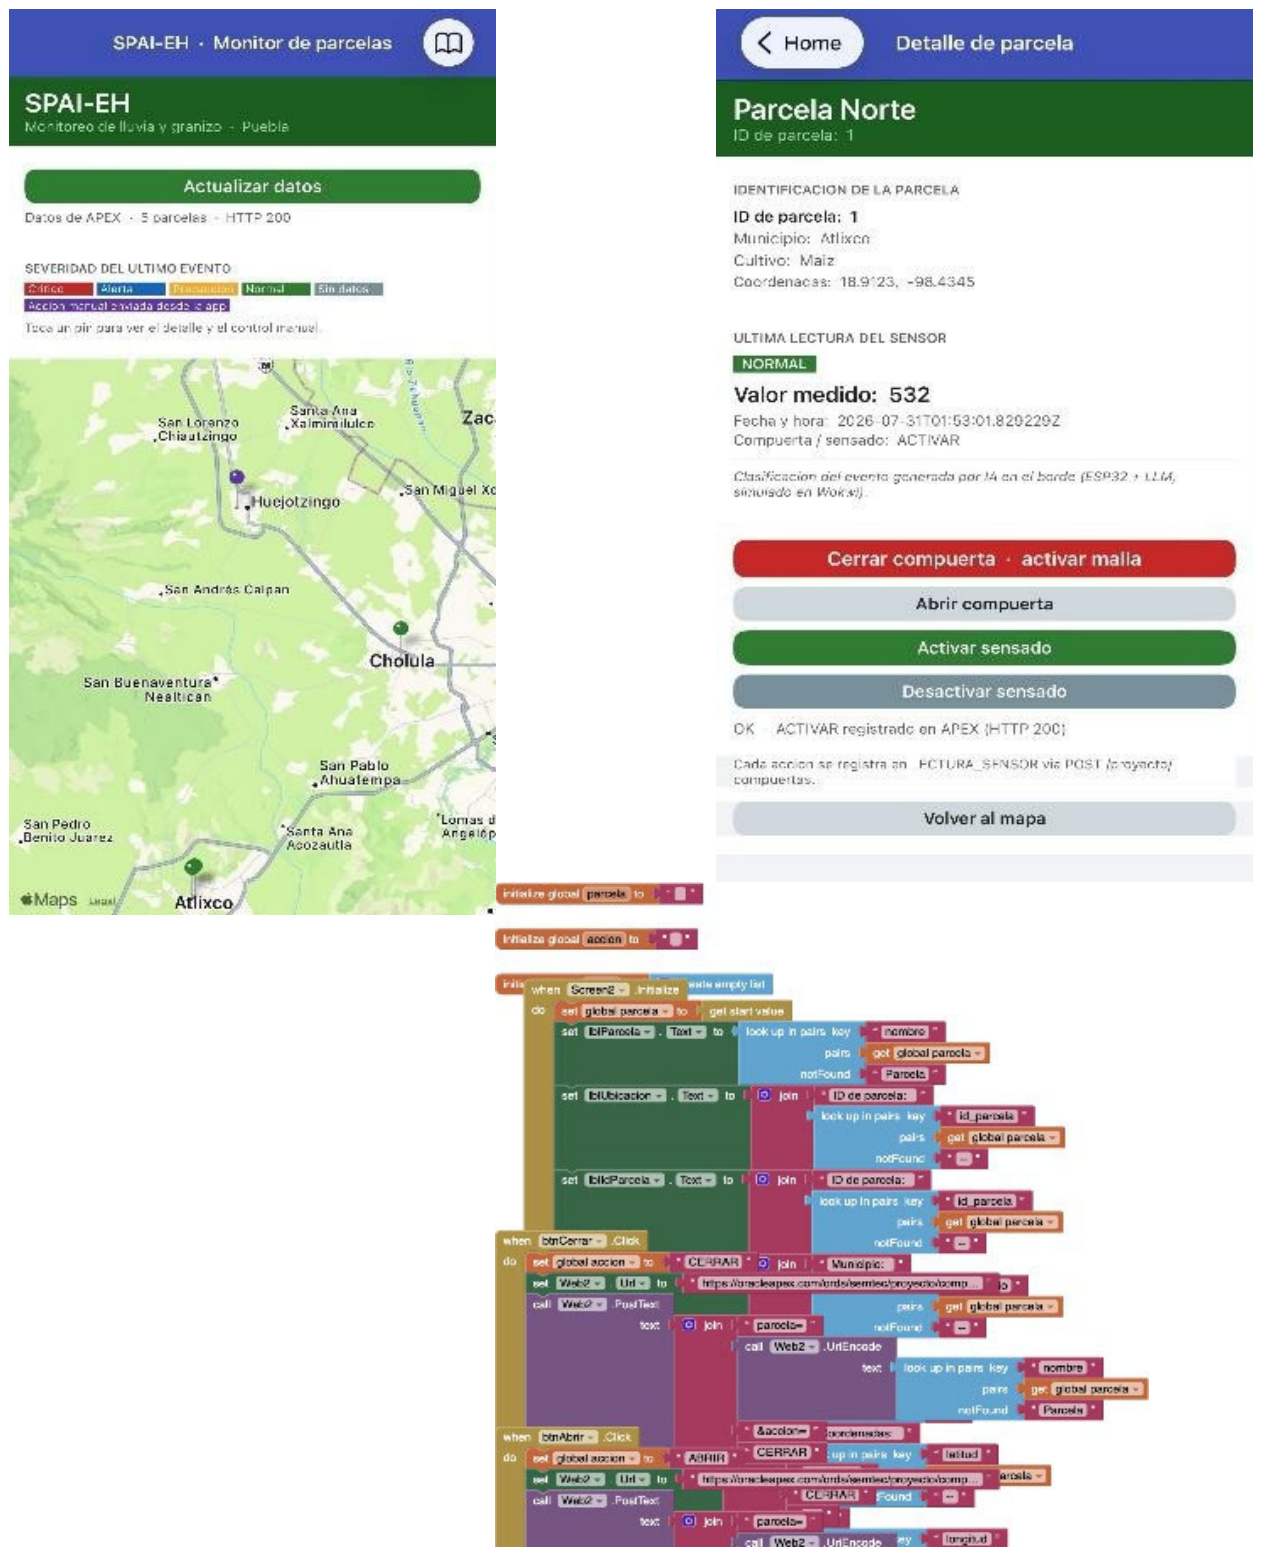
Figure 10.
Oracle APEX time series of the rain/hail proxy sensor across the five plots.
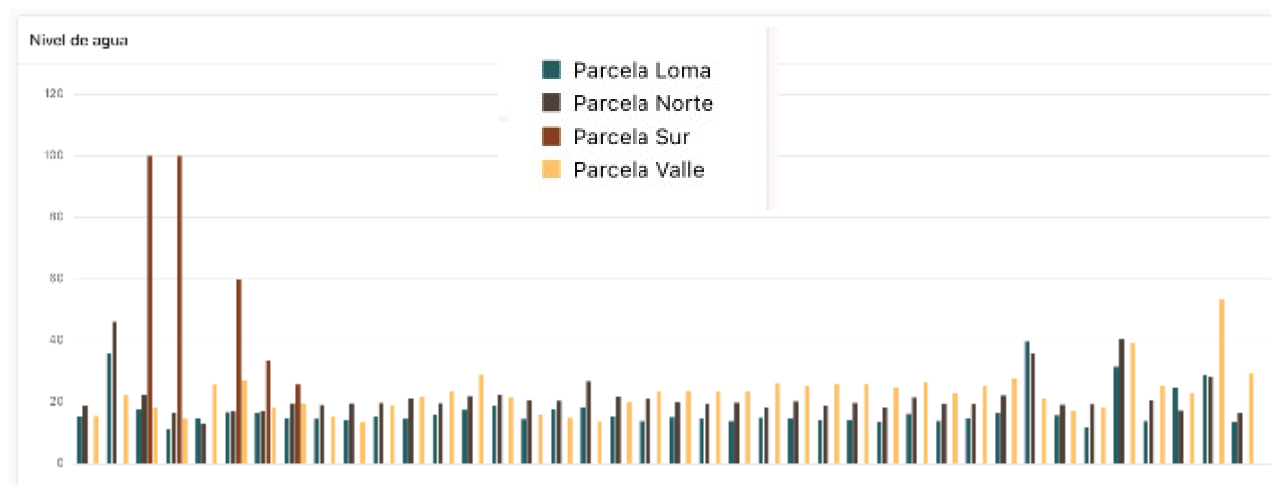

Table 1.
Sensor Registry Entries for Parcela Norte (Id_Parcela = 1).
| ID_SENSOR | TIPO_SENSOR | MODELO | UNIDAD | ESTADO |
| 61 | Temperatura | DHT22 | °C | Activo |
| 62 | Humedad Relativa | DHT22 | %HR | Activo |
| 63 | Nivel de Agua (lluvia/granizo) | Potenc. 10k | % | Activo |
Table 2.
Average Temperature and Humidity by Monitored Plot.
| Parcela | Avg. Temp. (°C) | Avg. Humidity (%) |
| Loma | 18 | 70 |
| Norte | 20 | 65 |
| Río | 18 | 65 |
| Sur | 19 | 65 |
| Valle | 18 | 64 |
Table 3.
MIT App Inventor Screens and Core Block Logic.
| Screen | Purpose | Core blocks |
| Screen1 (Map) | 5 plots as map markers | Web1.Get -> JSON dict -> marker color by clasificacion_evento |
| Screen2 (Detail) | Manual gate override | Web2.PostText {parcela, accion:”CERRAR”} -> /compuertas |
| Screen3 (Log) | Raw JSON of last GET | lblLog bound to global lastJson |
Table 4.
Approximate Bill of Materials per Plot (2026 Online-Marketplace Prices, USD).
| Component | Approx. cost (USD) |
| ESP32 development board | 5-8 |
| DHT22 temperature/humidity sensor | 8-12 |
| Tipping-bucket rain gauge | 10-20 |
| Piezoelectric/acoustic hail sensor | 5-15 |
| SG90 servo (gate actuator) | 2-4 |
| 16x2 I2C LCD display | 4-6 |
| LED, resistor, enclosure, wiring | 8-15 |
| Total per plot | ~45-80 |
Disclaimer/Publisher’s Note: The statements, opinions and data contained in all publications are solely those of the individual author(s) and contributor(s) and not of MDPI and/or the editor(s). MDPI and/or the editor(s) disclaim responsibility for any injury to people or property resulting from any ideas, methods, instructions or products referred to in the content. |
© 2026 by the authors. Licensee MDPI, Basel, Switzerland. This article is an open access article distributed under the terms and conditions of the Creative Commons Attribution (CC BY) license (http://creativecommons.org/licenses/by/4.0/).
Copyright: This open access article is published under a Creative Commons CC BY 4.0 license, which permit the free download, distribution, and reuse, provided that the author and preprint are cited in any reuse.


