

Submitted:
02 August 2026
Posted:
03 August 2026
You are already at the latest version
Abstract
Background: During a rapidly expanding outbreak, changes in confirmed case counts and test positivity may reflect transmission, testing selectivity, geographic expansion of surveillance, or delayed processing of accumulated samples. This study reconstructed laboratory indicators reported during the 2026 Bundibugyo virus disease (BVD) outbreak in the Democratic Republic of the Congo (DRC) and examined how testing volume and sample backlog influenced their interpretation. Methods: This retrospective descriptive analysis included 68 of 77 expected daily situation reports through 30 July 2026, with 11 WHO weekly BVD reports through 26 July used for triangulation. Province-level laboratory indicators, pending-sample counts, operational events, and selected cumulative case and death outcomes were extracted. Interval and cumulative observations were analysed separately. An operational interpretation framework classified consecutive comparable observations using prespecified thresholds of a 5-percentage-point change in positivity and a 20% change in testing volume. Comparisons with cumulative crude case fatality ratio (CFR) were exploratory and descriptive. Results: Of 82 positivity records, 75 interval observations were eligible for the primary analysis. Volume-weighted positivity was 32.1% (95% exact CI 30.9–33.3%) in Ituri and 7.3% (6.4–8.3%) in North Kivu. In North Kivu, same-day pending results increased from 42 on 2 June to 193 on 6 June and remained elevated through 11 June; reagent shortages were reported from 5 June. Despite lower positivity, cumulative crude CFR in North Kivu increased from 5.3% on 31 May to 60.0% on 11 June and was 58.2% on 13 July. In Ituri, cumulative crude CFR increased from 15.4% to 17.6% over 31 May–11 June and was 34.9% on 13 July. These cumulative values were not interpreted as period-specific fatality risks, and unresolved outcomes were not estimable by province. WHO weekly triangulation showed that the same national positivity-range statement was carried forward in reports dated 12, 19, and 26 July, while daily positivity in Ituri varied from 13.3% to 51.3% during the corresponding period. Across 72 province-level transitions, the operational framework showed that changes in positivity and testing volume required contextual corroboration to distinguish selective testing, surveillance expansion, and laboratory constraints. Conclusions: Test positivity and cumulative crude CFR provided distinct and sometimes discordant surveillance signals. High positivity did not consistently indicate higher cumulative mortality, while low positivity could coexist with substantial mortality and laboratory backlog. The operational framework supports joint assessment of positivity, testing volume, pending-sample burden, geographic coverage, cumulative outcomes, and laboratory context. Situation reports should provide current numerators and denominators, distinguish samples awaiting transport from those awaiting analysis, and report backlog age, turnaround times, and outcome completeness.
Keywords:
Bundibugyo virus disease
; Ebola disease
; test positivity
; laboratory surveillance
; diagnostic backlog
; outbreak response
Background
Bundibugyo virus was first identified during a 2007 outbreak in Bundibugyo District, Uganda [1]. On 15 May 2026, the ministries of health of the Democratic Republic of the Congo (DRC) and Uganda declared outbreaks of Bundibugyo virus disease (BVD) [2,3]. The outbreak became the largest documented BVD outbreak and occurred in settings affected by insecurity, population movement, and constrained health-system capacity [4,5].
Laboratory confirmation is central to Ebola outbreak response because it determines case classification, supports isolation and contact tracing, and underlies publicly reported confirmed-case counts. Experience from the 2014-2016 West Africa epidemic showed that centralised testing, specimen transport, delayed turnaround, and fragmented laboratory data systems can impair both clinical management and surveillance interpretation [6,7]. Across historical Ebola outbreaks, delayed recognition has also been associated with longer and larger events [8].
Test positivity is often used as an indicator of epidemic intensity, but its interpretation depends on who is tested, how broadly testing is deployed, and the number of tests performed [9,10,11]. Preferential testing of symptomatic or high-risk individuals can inflate positivity relative to population prevalence, while expansion of testing can lower positivity even when transmission remains substantial. Laboratory and reporting delays further distort real-time case trends because results may be assigned to the reporting date rather than the date of specimen collection; processing accumulated samples can therefore produce abrupt increases in reported confirmed cases that reflect delayed confirmation rather than infections acquired during the latest reporting interval [12,13]. WHO updates during the 2026 outbreak explicitly attributed part of the increase in reported cases to expanded testing capacity and processing of previously collected samples [14,15] .
Existing peer-reviewed reports and analyses of the 2026 BVD outbreak have described the early epidemiology, outbreak projections, estimated outbreak size, cross-border spread, clinical and public health challenges, and broader operational constraints [4,5,16,17,18,19]. However, these studies have not focused on the longitudinal joint interpretation of province-level test positivity, testing volume, and pending-sample indicators derived from the public DRC situation-report series. This study addresses that operational gap by applying a transparent framework to interpret these indicators together. The primary objective was to describe temporal and geographic patterns in reported test positivity, testing volume, and sample backlog during the 2026 BVD outbreak in the DRC using publicly available data. Secondary objectives were to assess the completeness and internal consistency of laboratory reporting, identify reported changes in laboratory capacity, and apply a structured framework for interpreting positivity alongside testing volume and backlog evidence. An exploratory ecological analysis compared cumulative crude CFR with positivity and backlog status where province- and date-aligned data were available. This comparison was descriptive and was not intended to infer that laboratory bottlenecks caused mortality.
Methods
Study Design and Reporting Period
A retrospective descriptive ecological analysis was conducted using laboratory surveillance indicators reported in public DRC situation reports. The primary analytic window extended from the earliest available outbreak-related laboratory report through the daily report dated 30 July 2026.
Data Sources
The primary data sources were daily situation reports issued by the Centre des Opérations d’Urgence de Santé Publique (COUSP) and the Institut National de Santé Publique (INSP) [20]. Eleven WHO weekly BVD situation reports, covering data through 26 July 2026, were used to triangulate laboratory capacity events, backlog statements, turnaround-time information, and reporting consistency [21]. Of 77 expected daily report numbers, 68 source files were available. The nine unavailable reports were not interpreted as indicating zero laboratory activity. The INRB-UMIE/BDBV2026-Data repository was used for cross-validation rather than primary extraction. WHO weekly reports were used only for triangulation; their weekly or cumulative positivity measures were not pooled with the primary interval-level series because the reporting periods and denominators were not directly comparable. The flow of daily report inclusion and positivity-record derivation is shown in Figure 1.
Indicator Definitions and Extraction
Testing volume was defined as the number of samples analysed per reported interval. Test positivity was calculated as positive results divided by the reported number analysed, or by positive plus negative final results when both were stated. Uncertainty in denominator composition was retained where repeat, indeterminate, or other results could not be distinguished. Pending samples were classified as awaiting transport or awaiting analysis when the report wording allowed this distinction.
Laboratory records were extracted from free-text reports. Each record retained the reporting date, province, numerator, denominator, reported and recalculated positivity, measurement basis, and source text. Interval and cumulative observations were analysed separately. Samples analysed were not converted to a daily rate when the reporting interval was unclear; a sensitivity analysis was restricted to records explicitly describing a single-day interval. Laboratory capacity and decentralisation events were also extracted from the daily and WHO weekly reports. Because the reports did not always distinguish the date of occurrence from the date of reporting or publication, each event was assigned the date on which it was reported.
Reconciliation and Analytic Eligibility
When both a reported positivity percentage and its numerator and denominator were available, positivity was recalculated. Differences of 0.5 percentage points or less were considered rounding differences. Larger discrepancies were excluded from the primary analysis until resolved. Primary analysis was limited to interval-based observations with agreement between reported and recalculated positivity within the prespecified tolerance.
Missing Data and Reporting Completeness
Missing observations were neither imputed nor carried forward. Source availability was calculated as the proportion of the 77 expected daily reports that were available. Indicator-reporting completeness was calculated separately as the proportion of the 68 available reports that contained each laboratory indicator.
Operational Interpretive Framework
A prespecified interpretive matrix linked combinations of positivity direction and testing-volume direction to plausible operational explanations and the corroborating information required to support each interpretation. For each province, consecutive comparable laboratory observations were assessed for changes in positivity and testing volume. Positivity was classified as rising or falling when it changed by at least 5 percentage points, and testing volume was classified as rising or falling when it changed by at least 20%; smaller changes were classified as stable. These prespecified operational thresholds were used to apply the interpretive framework consistently and to limit classification based on minor reporting fluctuations. For transition classification, full matches were rising positivity with falling testing volume or falling positivity with rising testing volume. Partial matches were stable positivity with falling testing volume or rising positivity with stable testing volume; other combinations were unmatched. Backlog-related and newly reporting-area patterns were assessed contextually and were not included in the transition match counts. The framework was treated as a contextual interpretation aid rather than a validated risk score.
Exploratory Comparison with Cumulative Case Fatality Ratios
Where province-level outcome data were available for the same dates and settings examined in the laboratory analysis, cumulative crude case fatality ratio (CFR) was compared descriptively with reported positivity and backlog status. Crude CFR was calculated as cumulative confirmed deaths divided by cumulative confirmed cases at each reporting date. Province-level case and death totals were extracted from dated distribution tables. When a report provided only a province-level cumulative CFR percentage, that percentage was retained and the underlying case and death totals were recorded as not stated rather than estimated.
Each CFR value was treated as a cross-sectional cumulative measure at a specific reporting date. Changes between reporting dates were not interpreted as period-specific fatality risks because deaths could relate to cases confirmed earlier and cumulative totals could be revised retrospectively. Province-level recovery counts were not reported consistently, so unresolved-outcome proportions could not be estimated. The comparison was exploratory, descriptive and ecological, and was not used to infer that laboratory backlog caused higher mortality.
Sensitivity Analyses
Seven sensitivity analyses were prespecified: recalculated rather than reported positivity; exclusion of low-certainty records; restriction by denominator composition; comparison of original and revised reports; restriction to explicit 24-hour observations; exclusion of repeat or indeterminate tests; and comparison of fixed thresholds with data-derived quantile thresholds. Analyses requiring information not consistently reported were classified as not estimable.
Statistical Analysis
Province-level testing volume and positivity were summarised using medians and ranges. Volume-weighted positivity was calculated by dividing the total number of positive results by the total number of samples analysed within each province and was presented with exact Clopper-Pearson 95% confidence intervals. These intervals were descriptive and conditional on the reported aggregate denominators; they did not account for serial dependence, changes in case ascertainment or testing strategy, repeated testing, or geographic clustering. Provinces with fewer than four comparable interval observations were excluded from distributional comparisons and described narratively.
Positivity, backlog status, and cumulative crude CFR were compared descriptively where province- and date-aligned observations were available. No correlation, regression, or causal analysis was performed because the outcome data were sparse, cumulative, and not consistently aligned with the laboratory reporting intervals. Analyses were conducted in Python 3.12 using pandas, NumPy, SciPy, and Matplotlib.
Ethical Considerations and Reporting Guideline
The study used publicly available aggregate surveillance data and did not access individual-level records or identifiable information. No interaction with participants occurred. Reporting followed the STROBE guidance for observational studies, and the completed checklist is provided as Supplementary File S1.
Results
Reporting Coverage and Analytic Sample
Of 77 expected daily reports through 30 July 2026, 68 were available and nine were unavailable. All available reports contained laboratory information. The flow of report inclusion and positivity-record derivation is shown in Figure 1.
Testing Volume and Test Positivity
Ituri contributed 44 primary-eligible interval observations from 6 June to 30 July, North Kivu contributed 29 from 18 June to 30 July, and Haut-Uele contributed two observations on 21–22 July. Haut-Uele was excluded from the distributional comparison because it did not meet the prespecified minimum of four observations. Province-specific testing volume and positivity estimates are summarised in Table 1.
Volume-weighted positivity was substantially higher in Ituri than in North Kivu, at 32.1% and 7.3%, respectively. No formal statistical comparison was performed because the observations were serial and heterogeneous. Temporal variation in samples analysed per reported interval and interval-specific positivity in Ituri and North Kivu is shown in Figure 2. The distributions of interval-level positivity and samples analysed per reported interval in Ituri and North Kivu are shown in Figure 3.
Pending Samples and Laboratory Backlog
North Kivu reports contained two distinct pending-sample series. A recommendations-tracking line reported 47 samples awaiting analysis on 31 May and 1 June and 42 samples on 4 and 5 June. Because these values were carried forward unchanged while the laboratory section reported different same-day counts, they were treated as operational tracking figures rather than current estimates. The laboratory section reported 42 pending results on 2 June, 147 on 3 June, 118 on 4 June, 159 on 5 June, and a peak of 193 on 6 June, followed by 183 on 7 June, 146 on 8 June, 182 on 9 June, and 172 on 11 June. Reports from 5 June onward attributed the accumulation to reagent shortages, while reports dated 2, 3, and 11 June indicated delays exceeding five days.
A later period, from 18 June to 13 July, repeatedly described unanalysed samples as an operational constraint but did not provide numeric backlog counts. Triangulation with WHO weekly BVD reports clarified the sequence of events. WHO Weekly BVD Report 03, covering data through 31 May, stated that earlier stockouts had been resolved, although turnaround times in North Kivu remained prolonged. The daily pending-results series subsequently increased between 2 and 11 June. WHO Weekly BVD Report 05, covering data through 14 June, reported that reagents had been delivered and backlogged samples tested. Together, these reports support treating the quantified June episode and the later qualitative period as separate reporting phases. However, they do not confirm that all pending samples had been cleared. The qualitative period was therefore analysed separately, and the disappearance of the recurrent backlog statement after 13 July was not interpreted as evidence of complete clearance.
In Haut-Uele, reports dated 17–19 July documented four samples awaiting transport and counts of 53 and four samples undergoing analysis. A separate count of six samples reported on 18 July referred to Tshopo rather than Haut-Uele. Among the 68 available daily reports, 23 (33.8%) mentioned backlog qualitatively, 11 (16.2%) provided a numeric North Kivu pending-sample count, three (4.4%) provided a numeric Haut-Uele count, one (1.5%) provided a numeric Tshopo count, and three (4.4%) reported an explicit age threshold. No complete series of laboratory turnaround times was available.
Positivity, Case Fatality Ratios, and Unresolved Outcomes
Cumulative province-level outcome data were available at selected dates but not as a complete daily series. During the quantified North Kivu pending-sample period, cumulative crude CFR increased from 5.3% (1 death among 19 confirmed cases) on 31 May to 60.0% (24/40) on 11 June. Intermediate cumulative totals were revised across reports, including a decrease from 44 confirmed cases and 26 deaths on 10 June to 40 cases and 24 deaths on 11 June. The change between endpoints was therefore not interpreted as an incident or within-period fatality risk. In Ituri, cumulative crude CFR increased from 15.4% (46/299) on 31 May to 17.6% (114/646) on 11 June. During the later qualitative North Kivu backlog period, cumulative crude CFR was 56.7% (38/67) on 15 June, 57.3% (71/124) on 1 July, and 58.2% on 13 July, when province-specific counts were not stated. In Ituri, cumulative crude CFR was 20.5% (157/767) on 15 June, 34.3% on 12 July, and 34.9% on 13 July; the latter two reports did not state province-specific counts. For Haut-Uele, the nearest available outcome observation preceded the positivity observations by eight days: a cumulative crude CFR of 92.9% was reported on 13 July without province-specific case and death totals. Because province-level recoveries were not reported consistently, unresolved-outcome proportions could not be estimated. These findings are descriptive and do not establish an association between laboratory backlog and mortality. The alignment of province-level test positivity, cumulative crude CFR, unresolved outcomes, and laboratory context is summarised in Table 2.
Systematic Interpretive Classification
The operational interpretive framework and the corroborating information required for each pattern are presented in Table 3. Across 72 consecutive province-level transitions, the prespecified thresholds identified 19 full matches, 16 partial matches, and 37 unmatched transitions. All 35 full or partial matches were retained as candidates for interpretation. Selected periods illustrating how the framework was applied to specific laboratory and reporting patterns are summarised in Table 4.
Reporting Consistency and Operational Events
Among the 11 WHO weekly reports, three consecutive reports dated 12, 19, and 26 July repeated the same national positivity range despite changes in the daily Ituri series. An earlier laboratory statement on reagent delivery and backlog testing was also repeated verbatim from the report covering data through 14 June in the following weekly report. These carried-forward statements were treated as reporting-consistency findings and contextual information, not as current estimates of daily positivity or backlog status.
Six dated laboratory capacity or decentralisation events used in Figure 4 were identified between 14 and 24 July. The WHO weekly reports additionally provided context on earlier reagent delivery, stockouts, backlog processing, and turnaround-time constraints. Event dates indicate when events were reported and do not establish their precise occurrence dates or causal effects on laboratory indicators.
Sensitivity Analyses
Replacing reported positivity with recalculated positivity produced minimal differences among the 75 primary observations (Table 5). Eleven values differed after rounding; the mean absolute difference was 0.02 percentage points and the maximum was 0.4 percentage points. Restriction to explicit 24-hour observations retained 73 of 75 observations (97.3%). Exploratory quantile-derived thresholds were 12.3 percentage points for positivity change and 46.0% for testing-volume change. Exact category agreement with the fixed-threshold classification was 68.1% across 72 transitions. Sensitivities concerning denominator composition and repeat or indeterminate testing were not estimable because these components were not reported consistently. The original-versus-revised comparison was only partially estimable because revision and supersession markers were incomplete.
Discussion
Principal Findings and Contribution
This study reconstructs laboratory test positivity, testing volume, and pending-sample reporting during the 2026 BVD outbreak. Ituri had substantially higher volume-weighted positivity than North Kivu, at 32.1% compared with 7.3%, while North Kivu experienced a quantified laboratory backlog that peaked at 193 pending samples and included delays exceeding five days. Across the available outcome observations, North Kivu had a markedly higher cumulative crude CFR despite its lower positivity, showing that positivity and cumulative mortality provided distinct and sometimes discordant surveillance signals. Triangulation with the 11 WHO weekly reports available through 26 July showed that the same national positivity range appeared in reports dated 12, 19, and 26 July, while daily provincial positivity varied during the corresponding period. The weekly figure was therefore treated as a contextual summary rather than a contemporaneous estimate. By linking positivity to testing volume, backlog status, cumulative outcomes, and laboratory context, the study demonstrates why these indicators should be interpreted jointly during a rapidly evolving outbreak.
Interpreting Positivity During Rapid Outbreak Expansion
Positivity could not be interpreted independently of testing volume, case-detection practices, geographic expansion, and laboratory capacity. This is consistent with previous studies showing that test positivity is shaped by the population selected for testing and the intensity and reach of testing, and therefore does not directly represent population-level transmission [9,10,11]. Preferential testing of symptomatic or high-risk individuals can increase positivity, while broader testing may reduce positivity even when transmission remains substantial. During an outbreak, delayed specimen transport and processing can further separate the timing of reported results from the timing of infection and case detection [12,13]. The findings from Haut-Uele illustrate this limitation. Positivity estimates of 25.0% and 50.0% were operationally notable, but they were based on only 20 and 12 samples during the first days of province-level reporting. These values may indicate selective testing, early detection of a local cluster, or limited testing reach, but the available data do not distinguish among these explanations. They should therefore be interpreted as signals requiring investigation, not as direct measures of provincial epidemic intensity. The transient increase in Ituri provides a different example. Positivity rose sharply while testing volume increased by more than 70%, then declined at the next observation. Previous work has shown that concurrent changes in testing volume and positivity can reflect shifts in case finding, sampling strategy, or the composition of the tested population [9,10,11]. In this study, the combination did not fit a single predefined operational pattern. The absence of a unique classification was therefore informative: it indicated that the observed change could not be attributed confidently to transmission, surveillance expansion, or selective testing without additional evidence on alerts investigated, sampling locations, specimen delays, and changes in testing strategy.
Pending Samples, Backlog, and Cumulative Outcomes
The North Kivu series illustrates how unresolved specimens can distort the timing of aggregate surveillance signals. Increases in confirmed cases after accumulated samples are processed may reflect delayed confirmation of earlier suspected cases rather than transmission during the most recent reporting interval. WHO updates on the 2026 outbreak similarly noted that expanded testing capacity and processing of previously collected samples contributed to increases in reported cases [14,15].
Triangulation of the daily and WHO weekly reports supported separate interpretation of the quantified North Kivu backlog from 2 to 11 June and the later qualitative constraint reported from 18 June. The weekly reports indicated that earlier stockouts had been reported as resolved by 31 May, although turnaround times in North Kivu remained prolonged, and later stated that reagents had been delivered and backlogged samples tested. These statements clarify the sequence of reported laboratory constraints but do not establish complete clearance of all pending samples. This distinction is important because qualitative backlog statements do not indicate magnitude, age, or resolution, while carried-forward values may not represent the current stock.
The exploratory outcome comparison further showed that low positivity did not imply a low cumulative mortality burden. North Kivu had substantially lower positivity than Ituri, yet its cumulative crude CFR increased from 5.3% on 31 May to 60.0% on 11 June and remained approximately 57–58% through mid-July. In Ituri, cumulative crude CFR increased more gradually, from 15.4% to 17.6% over the earlier period and to approximately 34–35% by 12–13 July. These cumulative estimates were not period-specific fatality risks and do not show that laboratory backlog caused mortality. Previous Ebola studies have shown that delayed recognition, restricted access to testing, specimen-transport constraints, and delayed laboratory confirmation can affect which cases are detected and when they enter surveillance datasets [6,7,8,12,13]. Reports from the 2026 BVD outbreak have also described insecurity, delayed presentation, limited access to care, and evolving case detection as important operational constraints [4,5,16,17,18,19]. The observed discordance may therefore reflect delayed outcome ascertainment, selective detection of severe cases, delayed presentation or diagnosis, incomplete follow-up, changing access to care, and retrospective revision of cumulative totals. The finding concerns the interpretation of surveillance indicators and should not be interpreted as evidence of a causal relationship between laboratory backlog and mortality.
Operational Interpretive Framework
The framework translates established principles concerning test positivity, testing intensity, sampling selectivity, and laboratory delay into a structured operational interpretation tool [6,7,8,9,10,11,12,13]. It specifies the corroborating information required before a positivity–volume pattern can inform action. Agreement of 68.1% between the fixed and exploratory thresholds indicates that classifications were sensitive to threshold selection. The framework should therefore be used as a structured prompt for investigation, not as an automated score or validated prediction tool. Its value lies in directing attention to missing contextual information, including alert volume, sampling strategy, backlog magnitude and age, reagent availability, turnaround time, and geographic expansion.
Implications for Situation Reporting
Situation reports should present the numerator, denominator, reporting period, and geographic attribution for each positivity estimate. They should distinguish samples awaiting transport from those awaiting analysis, report the number and age of pending samples, and provide collection-to-receipt and receipt-to-result turnaround times. Values carried forward from previous reports should be labelled explicitly. These practices would help distinguish transport constraints, processing bottlenecks, and documentation delays and improve interpretation of confirmed-case trends.
Strengths and Limitations
Strengths include the prespecified framework, explicit handling of unavailable reports, separation of interval and cumulative observations, reconciliation of reported and recalculated positivity, systematic classification of eligible transitions, and triangulation with WHO weekly reports. Repeat verification showed exact agreement across 76 sampled records, and the analysis was reproduced in a clean software environment. Limitations include reliance on aggregate reports with changing formats, incomplete denominator detail, inconsistent reporting of repeat and indeterminate tests, episodic backlog data, and uneven geographic coverage. Outcome data were sparse, cumulative, sometimes revised, and incompletely aligned with laboratory observations. Causal inference was not possible, and event dates were uncertain.
Conclusions
During the ongoing 2026 BVD outbreak, test positivity and cumulative crude CFR provided distinct and sometimes discordant surveillance signals. Higher positivity did not consistently correspond to higher cumulative crude CFR, while lower positivity could coexist with substantial mortality and laboratory backlog. Positivity, confirmed-case counts, and crude CFR should therefore not be interpreted in isolation when testing reach, sample processing, outcome ascertainment, and reporting completeness are changing. More complete and current reporting, supported by a corroboration-dependent operational framework, is essential for interpreting the evolving outbreak and guiding response decisions.
Author Contributions
TEA conceived and designed the study, developed the protocol and statistical analysis plan, performed the extraction and analysis, developed the analytical pipeline, interpreted the findings, and drafted the manuscript. TEA approved the submitted version and is accountable for the work.
Funding
This research received no specific grant from any funding agency in the public, commercial, or not-for-profit sectors.
Institutional Review Board Statement
Not applicable. The study used only publicly available aggregate surveillance data and did not involve identifiable participant information or direct interaction with participants.
Informed Consent Statement
Not applicable.
Acknowledgments
The author acknowledges the people and communities affected by the outbreak and the health workers, laboratory teams, surveillance staff, community responders, and public health authorities involved in the response. The author also acknowledges DRC INSP and INRB for making public outbreak updates available for analysis.
Competing Interests
The author declares no competing interests.
References
- Towner, J.S.; Sealy, T.K.; Khristova, M.L.; Albariño, C.G.; Conlan, S.; Reeder, S.A.; et al. Newly Discovered Ebola Virus Associated with Hemorrhagic Fever Outbreak in Uganda. PLoS Pathog. 2008, 4, e1000212. [Google Scholar] [CrossRef] [PubMed]
- Ministère de la Santé Publique H et PS. Déclaration de la 17e épidémie de la maladie à virus Ebola dans les zones de santé de Rwampara, Mongbwalu et Bunia dans la province de l’Ituri, République Démocratique du Congo. Kinshasa; 2026 May. Kinshasa, May.
- Uganda Ministry of Health. Press statement Ebola Bundibugyo virus disease outbreak 2026 [Internet]. Kampala; 2026 May [cited 2026 May 31]. Available online: https://health.go.ug/download/press-statement-ebola-bundibugyo-virus-disease-outbreak-2026/.
- Eric Q. Mooring, William T. Koval P, Isobel Routledge P, Inga Holmdahl P, Española G, Rebecca Kahn P, et al. Modeled Scenario Projections for the Ebola Disease Outbreak Caused by Bundibugyo Virus, 2026. MMWR Morb. Mortal. Wkly. Rep. 2026, 75, 285–9. [CrossRef] [PubMed]
- Delayo L. Zomahoun M, Mary Adetinuke Boyd M, Margaret A. Honein P, Joel M. Montgomery P, Emily Zielinski-Gutierrez D, Elissa Meites M, et al. Notes from the Field: Outbreak of Ebola Disease Caused by Bundibugyo Virus — Democratic Republic of the Congo and Uganda, May 2026. MMWR Morb. Mortal. Wkly. Rep. 2026, 75, 293–4. [CrossRef] [PubMed]
- Broadhurst, M.J.; Brooks, T.J.G.; Pollock, N.R. Diagnosis of Ebola Virus Disease: Past, Present, and Future. Clin. Microbiol. Rev. 2016, 29, 773–93. [Google Scholar] [CrossRef] [PubMed]
- Durski, K.N.; Singaravelu, S.; Teo, J.; Naidoo, D.; Bawo, L.; Jambai, A.; et al. Development, Use, and Impact of a Global Laboratory Database During the 2014 Ebola Outbreak in West Africa. J. Infect. Dis. 2017, 215, 1799–806. [Google Scholar] [CrossRef] [PubMed]
- Matson, M.J.; Chertow, D.S.; Munster, V.J. Delayed recognition of Ebola virus disease is associated with longer and larger outbreaks. Emerg. Microbes Infect. 2020, 9, 291–301. [Google Scholar] [CrossRef] [PubMed]
- Chiu, W.A.; Ndeffo-Mbah, M.L. Using test positivity and reported case rates to estimate state-level COVID-19 prevalence and seroprevalence in the United States. PLoS Comput Biol. 2021, 17, e1009374. [Google Scholar] [CrossRef] [PubMed]
- Furuse, Y.; Ko, Y.K.; Ninomiya, K.; Suzuki, M.; Oshitani, H. Relationship of test positivity rates with covid--19 epidemic dynamics. Int. J. Env. Res. Public Health 2021, 18, 4655. [Google Scholar] [CrossRef] [PubMed]
- Mercer, T.R.; Salit, M. Testing at scale during the COVID-19 pandemic. Nat. Rev. Genet. 2021, 2021 22:7 22, 415–26. [Google Scholar] [CrossRef] [PubMed]
- Noufaily, A.; Farrington, P.; Garthwaite, P.; Enki, D.G.; Andrews, N.; Charlett, A. Detection of Infectious Disease Outbreaks From Laboratory Data With Reporting Delays. J. Am. Stat. Assoc. 2016, 111, 488–99. [Google Scholar] [CrossRef]
- Wölfel, R.; Stoecker, K.; Fleischmann, E.; Gramsamer, B.; Wagner, M.; Molkenthin, P.; et al. Mobile diagnostics in outbreak response, not only for Ebola: a blueprint for a modular and robust field laboratory. Euro Surveill. 2015, 20. [Google Scholar] [CrossRef] [PubMed]
- World Health Organization. Ebola disease caused by Bundibugyo virus, Democratic Republic of the Congo & Uganda [Internet]. 2026 [cited 2026 Aug 2]. Available online: https://www.who.int/emergencies/disease-outbreak-news/item/2026-DON613.
- World Health Organization. Ebola disease caused by Bundibugyo virus, Democratic Republic of the Congo & Uganda [Internet]. 2026 [cited 2026 Aug 2]. Available online: https://www.who.int/emergencies/disease-outbreak-news/item/2026-DON606.
- Sullivan, N.J. Bundibugyo Virus Disease in 2026 — Clinical and Public Health Responses. N. Engl. J. Med. 2026. [Google Scholar] [CrossRef] [PubMed]
- Mccabe, R.; Ebbarnezh, L.; Okware, S.; Fotsing, R.; Koua, E.; Mbaka, P.; et al. Estimation of the size of the outbreak of Ebola disease caused by Bundibugyo virus in the Democratic Republic of the Congo; Imperial College London, 18 May 2026. [Google Scholar] [CrossRef] [PubMed]
- Mwamba, D.; Akilimali, P.; Mboussou, F.; Kabasubabo, F.; Angendu, K.; Ngandu, C.; et al. Bundibugyo virus disease outbreak in Ituri, Democratic Republic of the Congo. The Lancet 2026, 407, 2367–9. [Google Scholar] [CrossRef] [PubMed]
- Chamla, D.; Belizaire, M.R.D.; Co, I.F.; Jinadu, A.; Mamadu, I.; Atagbaza, A.O. Size of the 2026 Ebola outbreak and risk of cross-border spillover from Bundibugyo virus in Ituri Province, DR Congo, and its implications for preparedness: a recalibrated stochastic modelling study. Lancet Infect. Dis. 2026, 0. [Google Scholar] [CrossRef] [PubMed]
- Centre des Operations d Urgences de Sante Publique RDC. Rapport de situation de la 17eme epidemie de la maladie a virus Ebola RDC [Internet]. 2026 [cited 2026 May 30]. Available online: https://insp.cd/sitrep-mve-n-013-2026/.
- World Health Organization. EBOLA BUNDIBUGYO VIRUS DISEASE OUTBREAK Democratic Republic of the Congo | Uganda Weekly External Situation Report 05, Data as of 14 June 2026 | WHO | Regional Office for Africa [Internet]. 2026 [cited 2026 Aug 2]. Available online: https://www.afro.who.int/countries/uganda/publication/ebola-bundibugyo-virus-disease-outbreak-democratic-republic-congo-1.
Figure 1.
Flow of daily situation reports and extracted positivity records included in the analysis. Of 77 expected daily reports, 68 were available and all contained laboratory information. These yielded 82 positivity records: 75 primary-eligible interval observations, three cumulative observations, three unresolved discrepancies excluded from the primary analysis, and one alternative-denominator observation retained for sensitivity analysis. Eleven WHO weekly BVD reports were used for triangulation only and were not pooled with the primary interval-level series.
Figure 1.
Flow of daily situation reports and extracted positivity records included in the analysis. Of 77 expected daily reports, 68 were available and all contained laboratory information. These yielded 82 positivity records: 75 primary-eligible interval observations, three cumulative observations, three unresolved discrepancies excluded from the primary analysis, and one alternative-denominator observation retained for sensitivity analysis. Eleven WHO weekly BVD reports were used for triangulation only and were not pooled with the primary interval-level series.
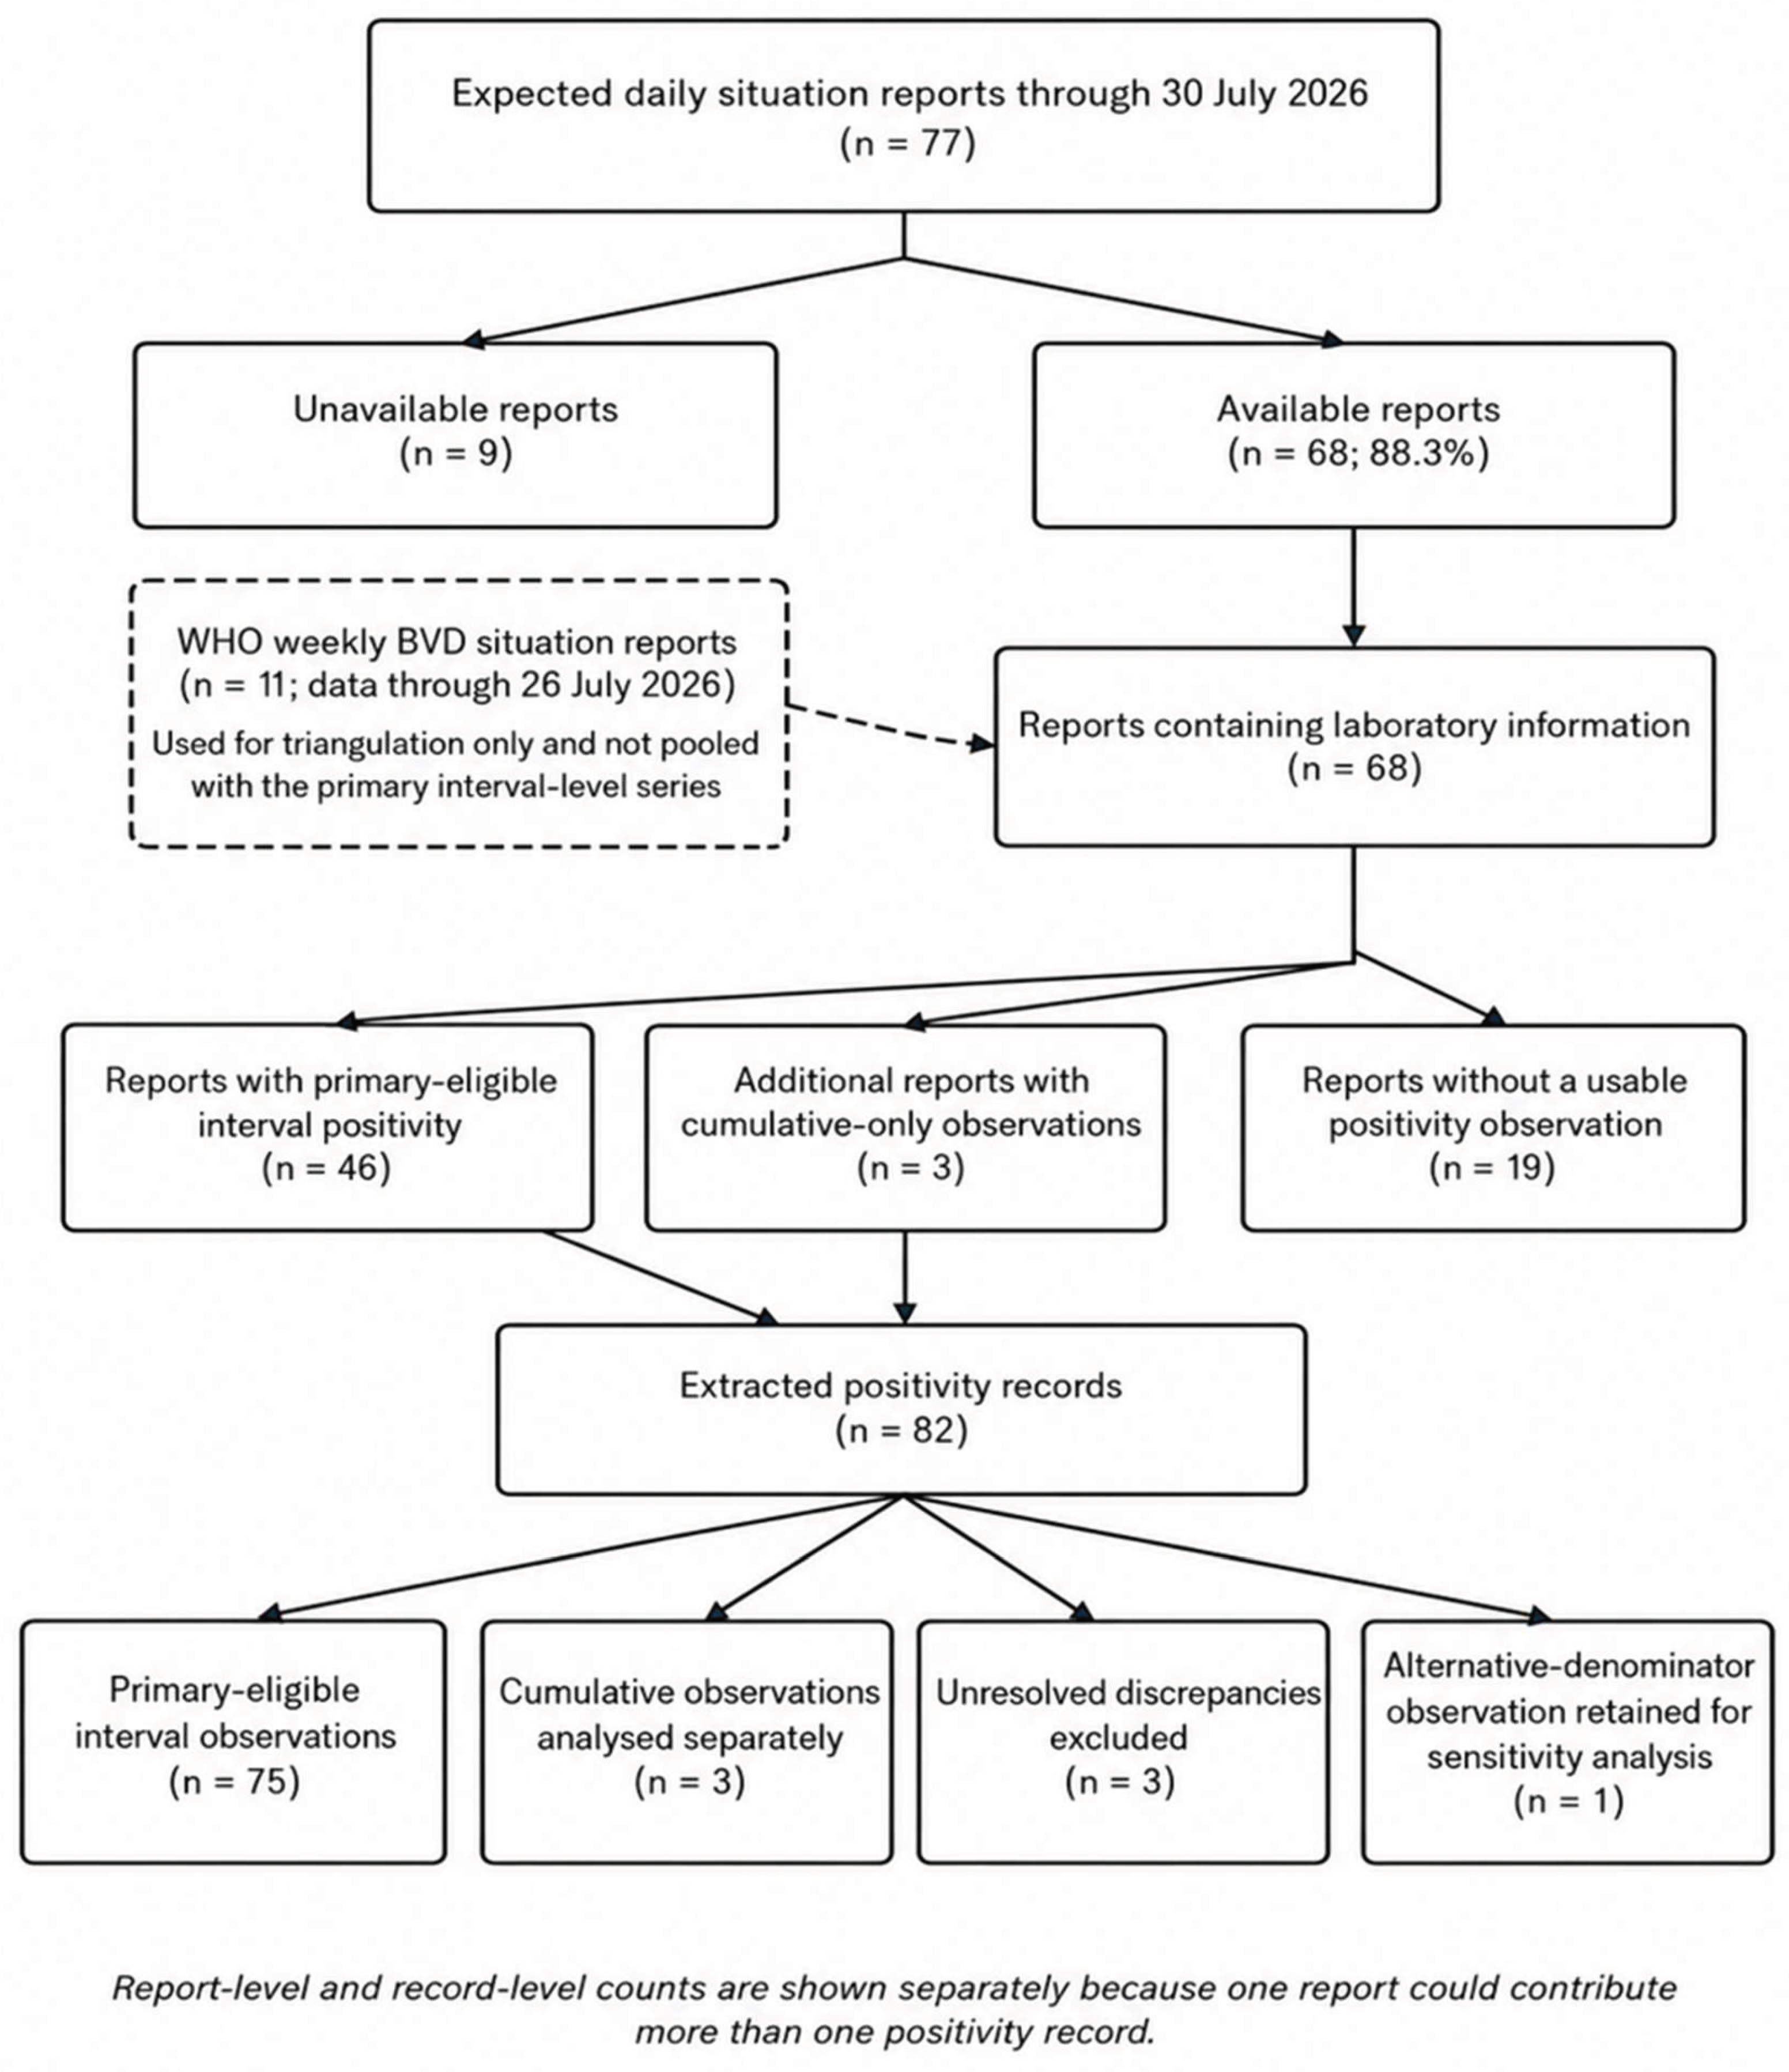
Figure 2.
Temporal variation in testing volume and interval-specific test positivity during the 2026 Bundibugyo virus disease outbreak in Ituri and North Kivu, through 30 July 2026. Panel A shows the number of samples analysed in each reported interval, and Panel B shows the corresponding proportion that tested positive. Exact 95% confidence intervals are based on the reported interval denominator and reflect binomial uncertainty only; they do not account for changes in testing strategy, case ascertainment, repeated testing, or geographic clustering.
Figure 2.
Temporal variation in testing volume and interval-specific test positivity during the 2026 Bundibugyo virus disease outbreak in Ituri and North Kivu, through 30 July 2026. Panel A shows the number of samples analysed in each reported interval, and Panel B shows the corresponding proportion that tested positive. Exact 95% confidence intervals are based on the reported interval denominator and reflect binomial uncertainty only; they do not account for changes in testing strategy, case ascertainment, repeated testing, or geographic clustering.
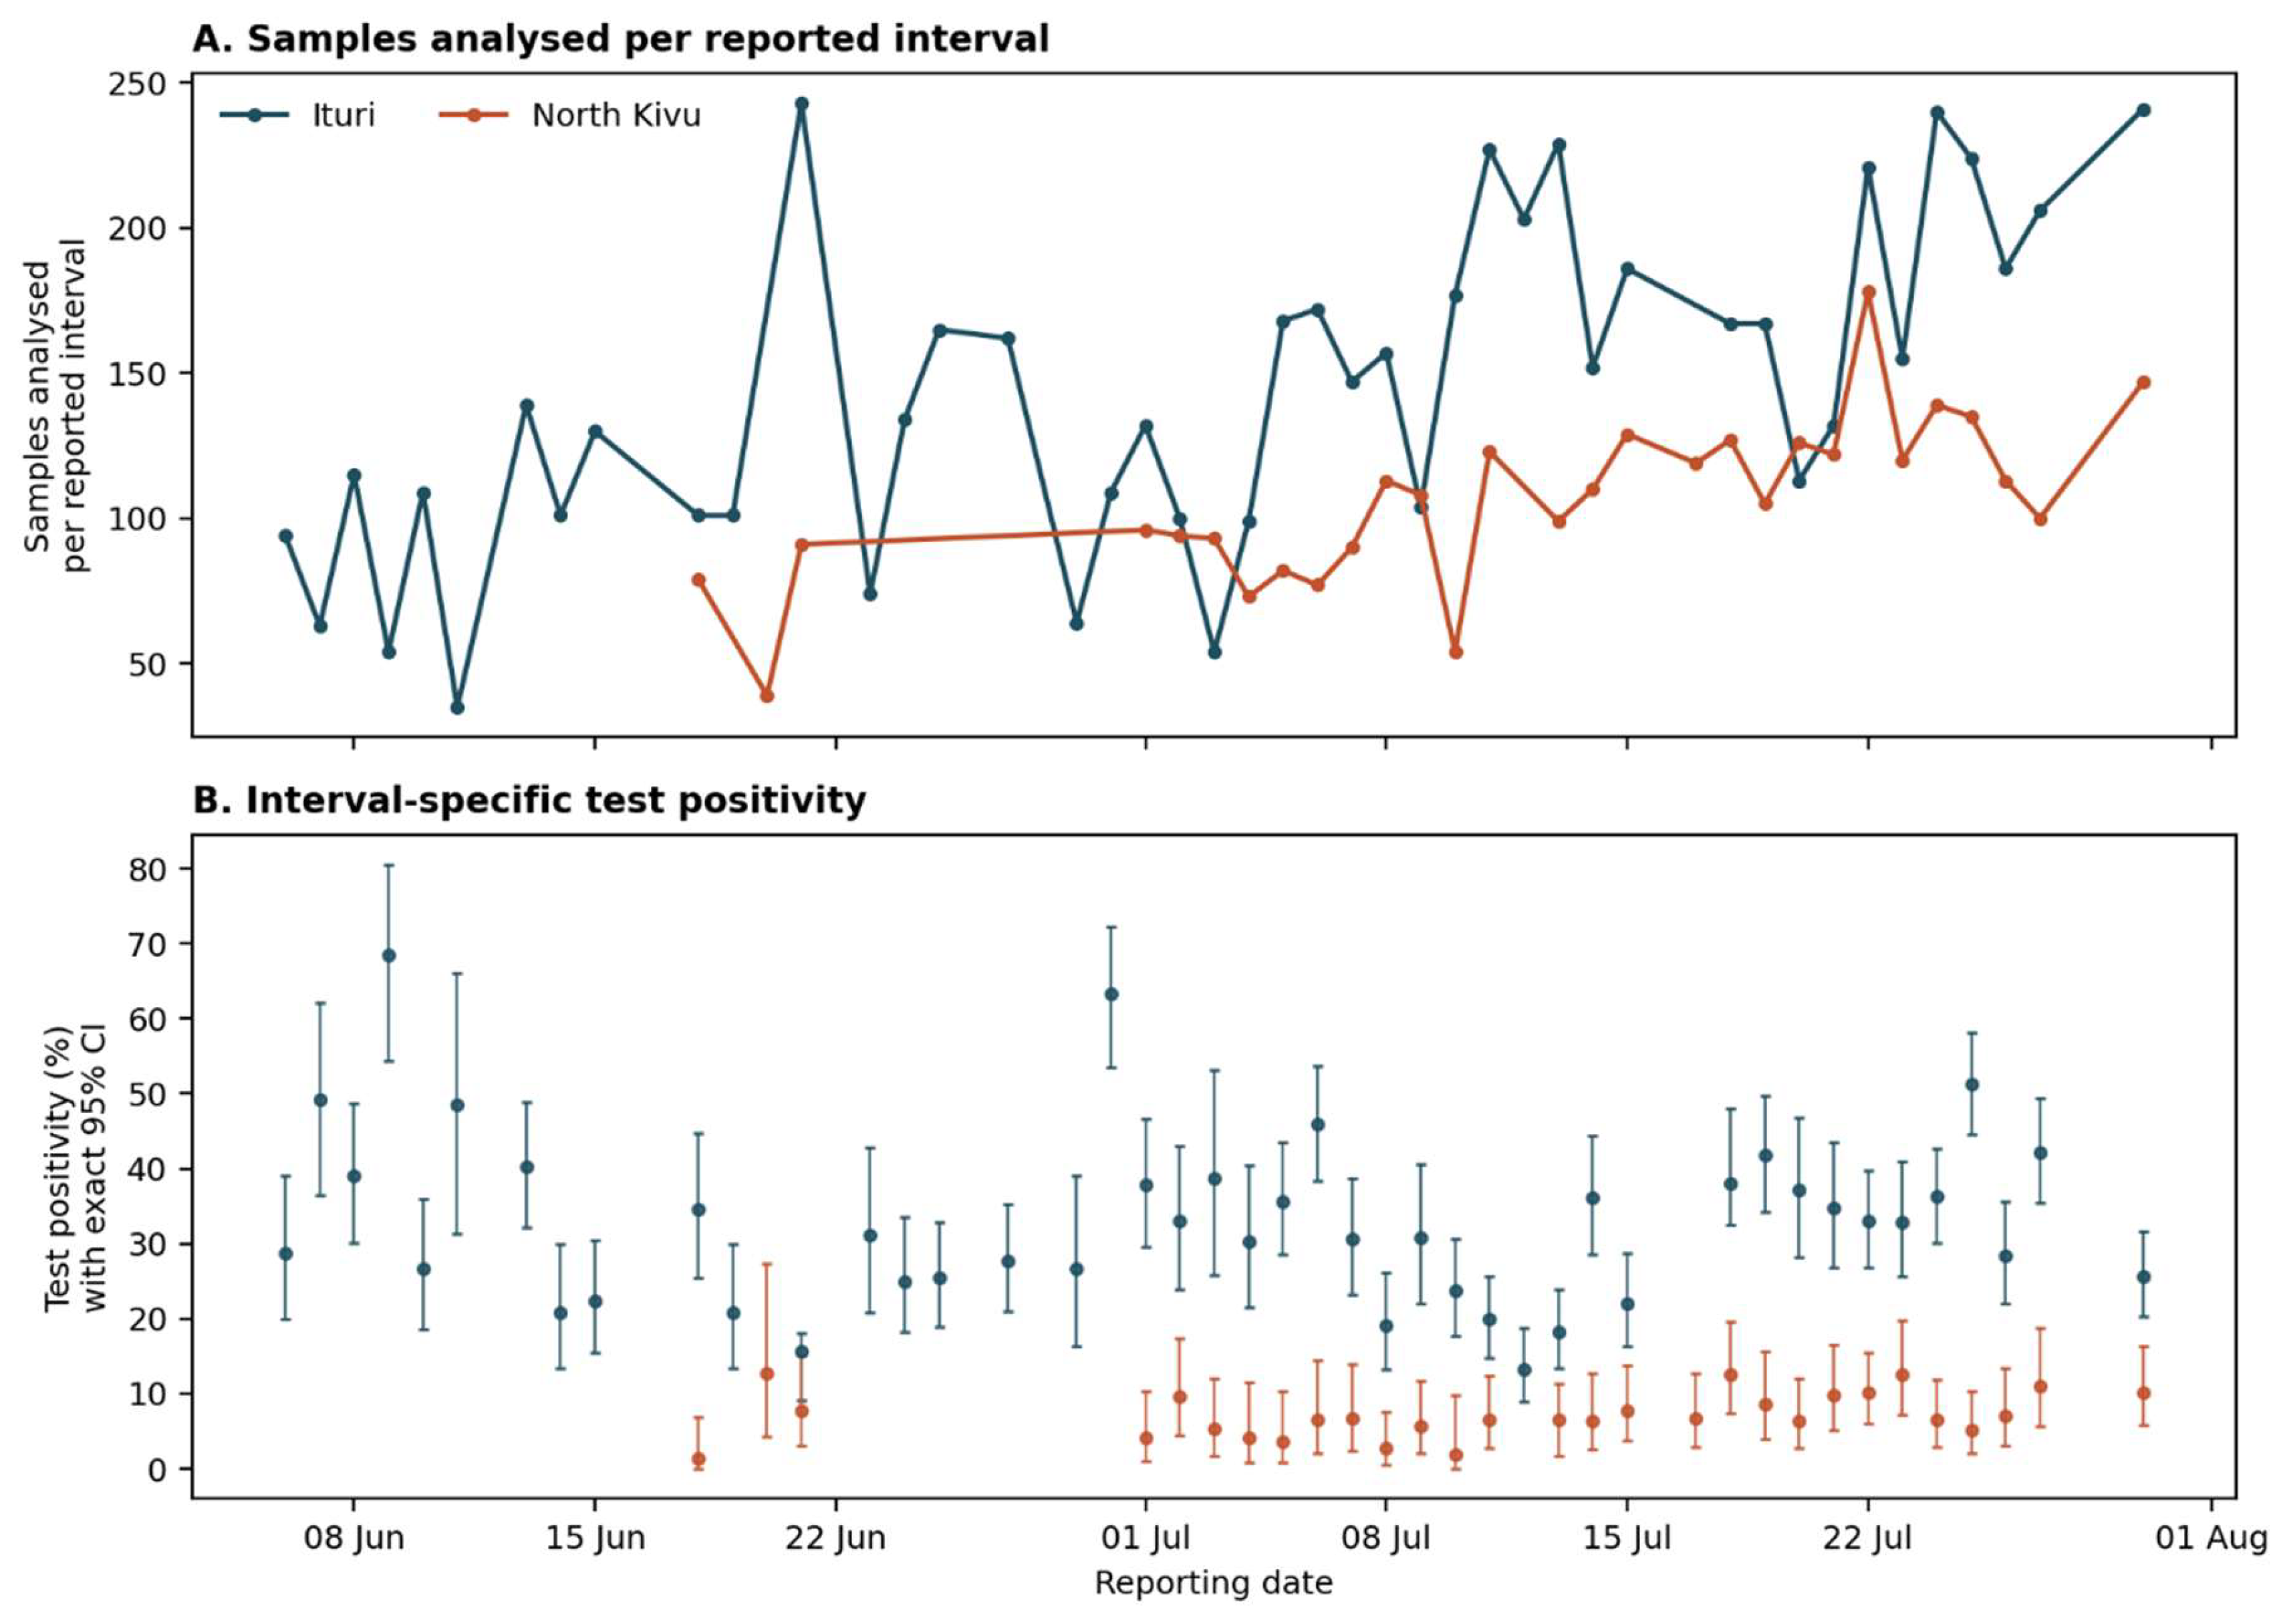
Figure 3.
Distribution of interval-specific test positivity and testing volume during the 2026 Bundibugyo virus disease outbreak in Ituri and North Kivu, through 30 July 2026. The figure compares the distribution of positivity estimates and the number of samples analysed per reported interval between the two provinces. Haut-Uele was excluded because only two comparable interval-level observations were available.
Figure 3.
Distribution of interval-specific test positivity and testing volume during the 2026 Bundibugyo virus disease outbreak in Ituri and North Kivu, through 30 July 2026. The figure compares the distribution of positivity estimates and the number of samples analysed per reported interval between the two provinces. Haut-Uele was excluded because only two comparable interval-level observations were available.
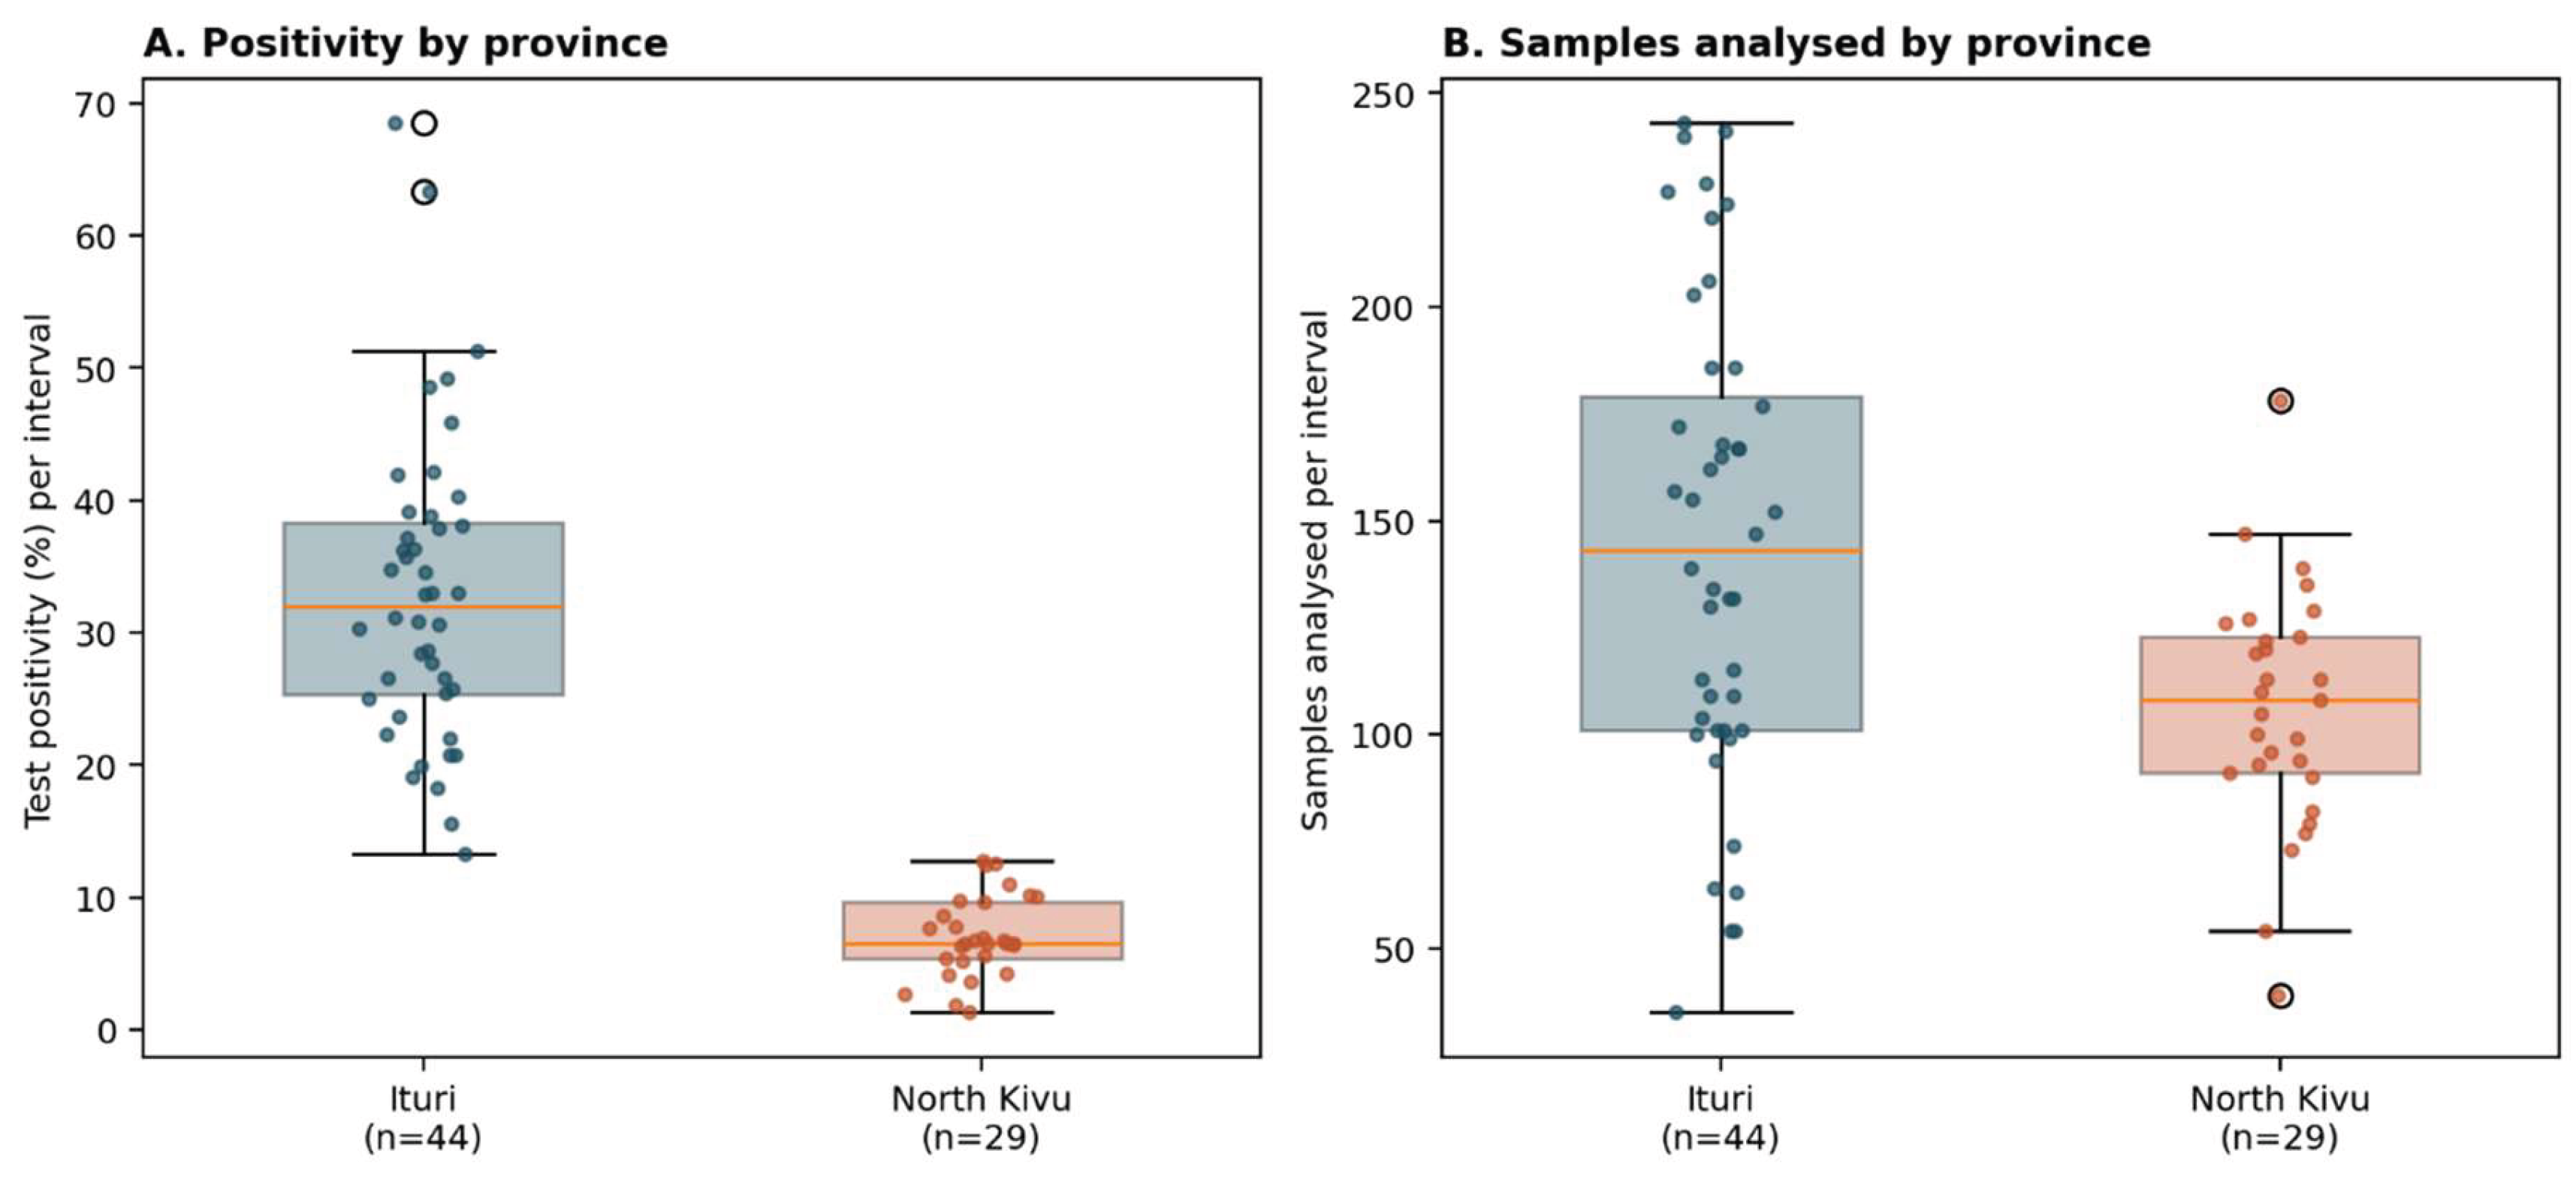
Figure 4.
Availability of extractable province-level positivity data and reported laboratory capacity or decentralisation events during the 2026 Bundibugyo virus disease outbreak, through 30 July 2026. Panel A shows daily reports containing at least one eligible province-level positivity observation. Panel B shows six dated capacity or decentralisation events reported between 14 and 24 July. Dates indicate when events were reported and do not establish occurrence dates or causal effects.
Figure 4.
Availability of extractable province-level positivity data and reported laboratory capacity or decentralisation events during the 2026 Bundibugyo virus disease outbreak, through 30 July 2026. Panel A shows daily reports containing at least one eligible province-level positivity observation. Panel B shows six dated capacity or decentralisation events reported between 14 and 24 July. Dates indicate when events were reported and do not establish occurrence dates or causal effects.
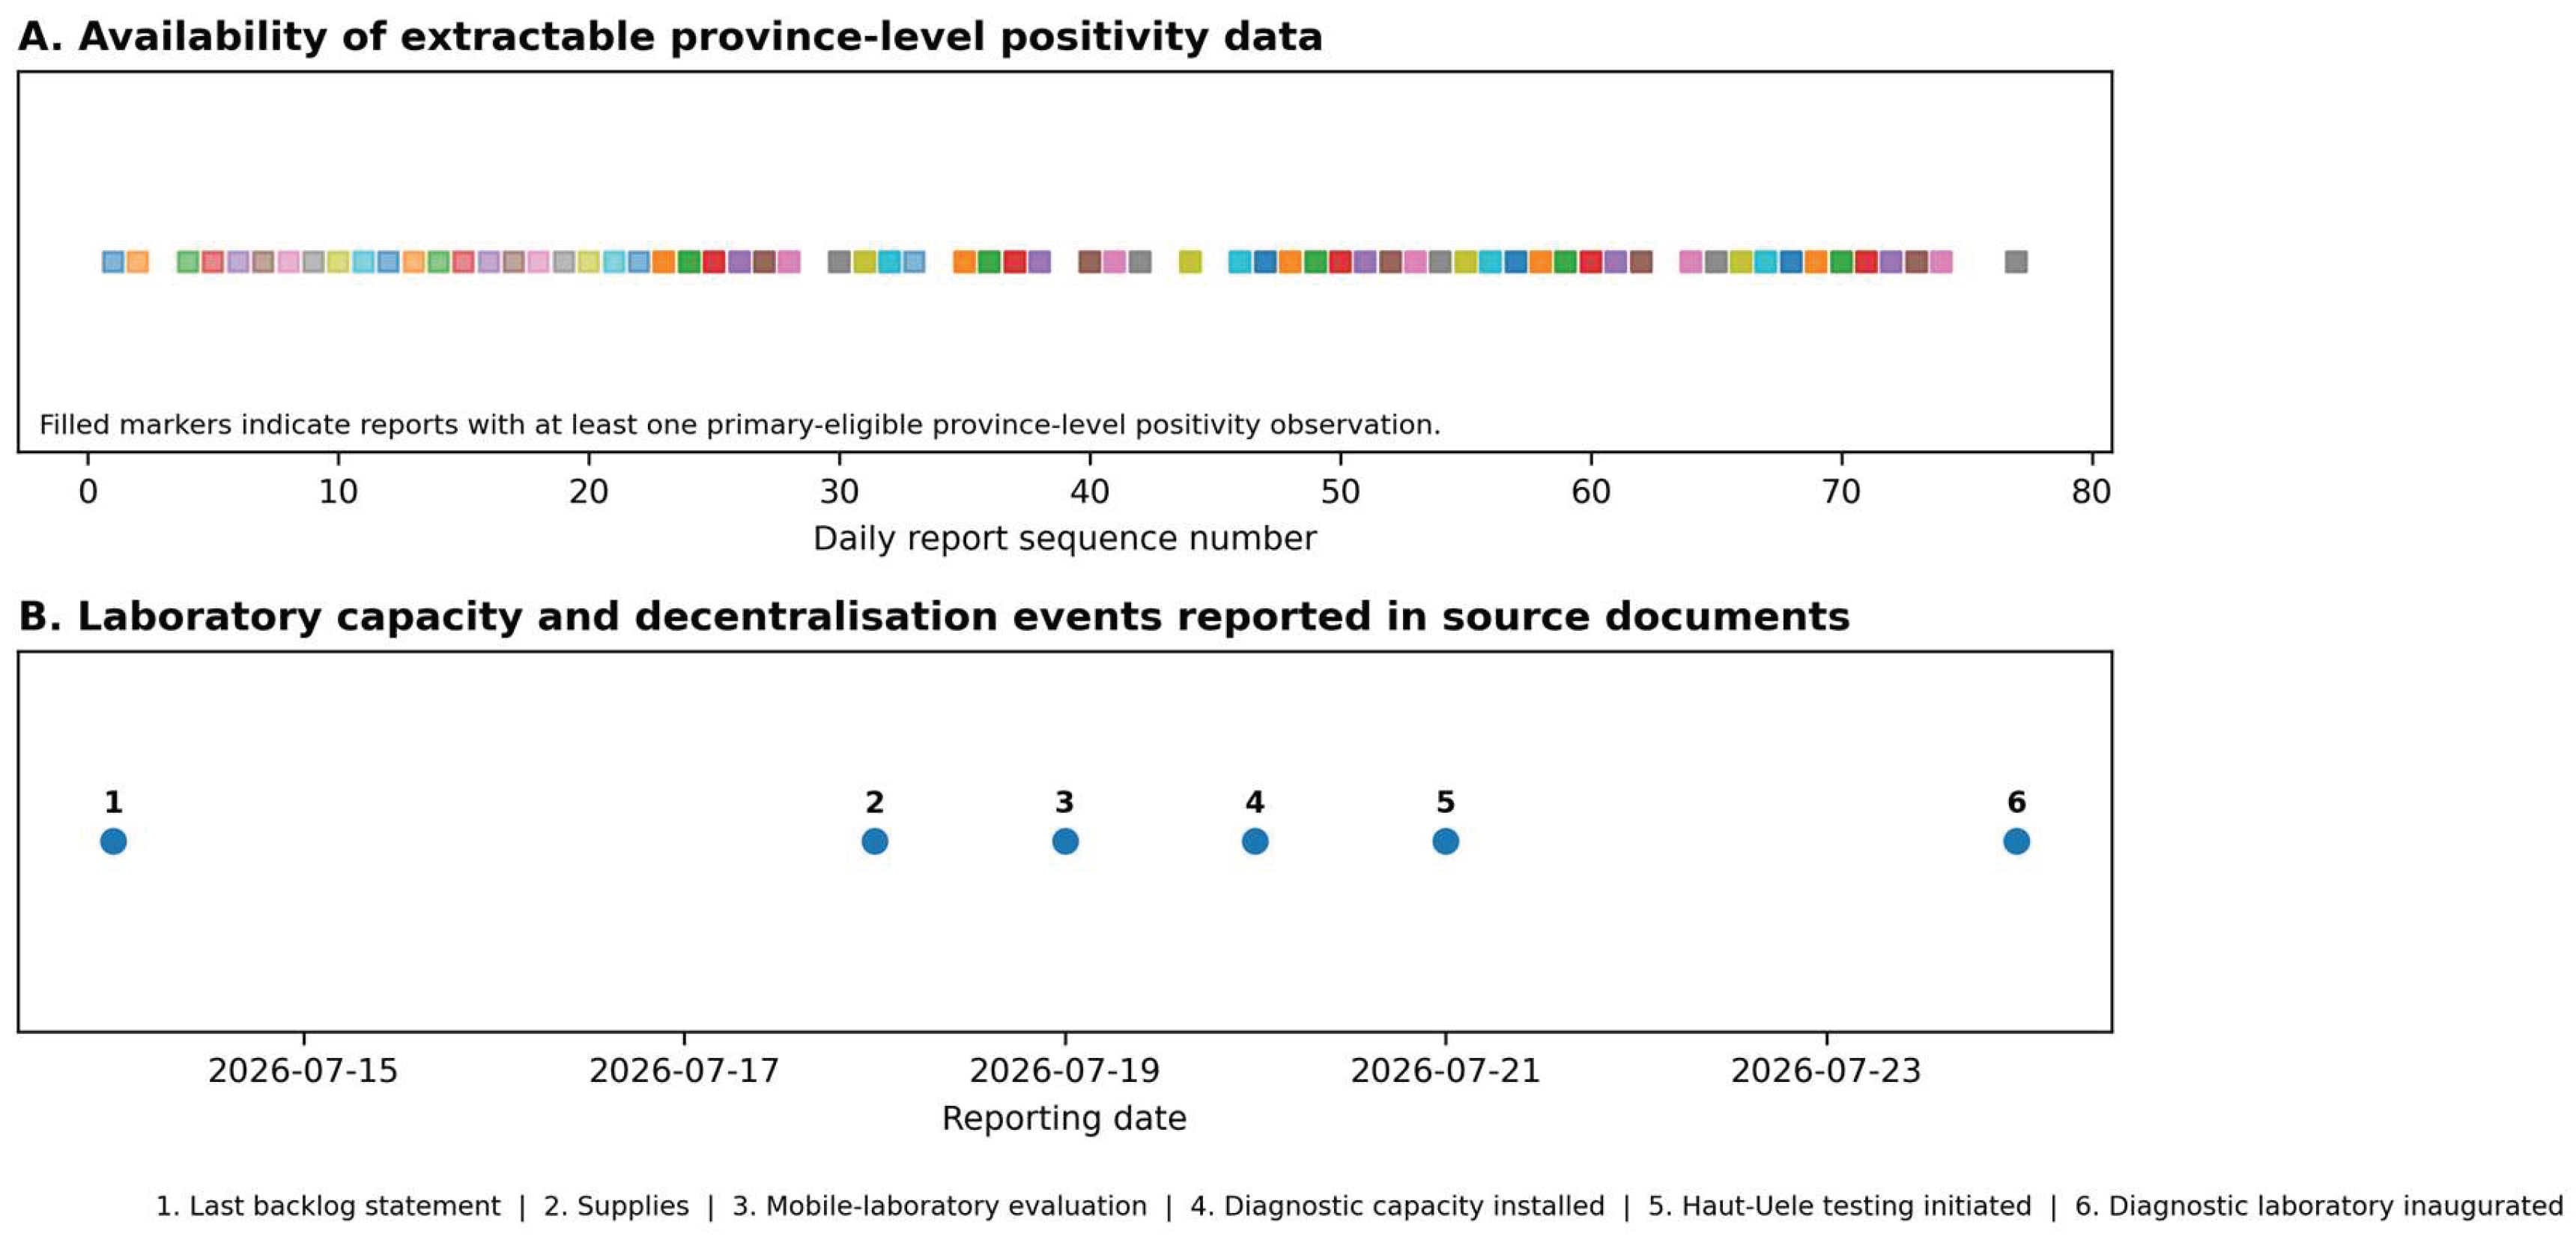

Table 1.
Testing volume and test positivity by province and observation period.
| Province | Observation period | Intervals | Samples analysed per interval, median (range) | Interval positivity, median (range) | Volume-weighted positivity (95% exact CI) |
| Ituri | 6 June-30 July 2026 | 44 | 136.5 (35-241) | 33.0% (13.3-68.5%) | 2013/6272 = 32.1% (30.9-33.3%) |
| North Kivu | 18 June-30 July 2026 | 29 | 108 (39-178) | 6.5% (1.3-12.8%) | 225/3081 = 7.3% (6.4-8.3%) |
| Haut-Uele | 21-22 July 2026 | 2 | 16 (12-20) | 37.5% (25.0-50.0%) | 11/32 = 34.4% (18.6-53.2%) |
Note: CI, confidence interval. Haut-Uele estimates are descriptive because only two comparable interval-level observations were available.
Table 2.
Exploratory alignment of test positivity, cumulative crude CFR, and laboratory context.
| Period and setting | Positivity | Cumulative confirmed deaths / cases | Cumulative crude CFR | Unresolved outcomes | Laboratory context |
| Quantified North Kivu pending-sample period, 31 May-11 June 2026 | No eligible interval positivity observations were available for most of this period. | 1/19 on 31 May; 24/40 on 11 June | 5.3% to 60.0% | Not estimable because province-level recovery data were unavailable | Quantified pending-sample series; peak 193 on 6 June; reagent shortages reported from 5 June. Cumulative totals were revised across reports. |
| Later qualitative North Kivu backlog period, 18 June-13 July 2026 | Median 5.9% (range 1.3-12.8%; 16 intervals) | 38/67 on 15 June; 71/124 on 1 July; counts not stated on 13 July | 56.7%, 57.3%, and 58.2% at the three respective dates | Not estimable | Backlog reported qualitatively without a numeric stock; outcome dates were not identical to every laboratory interval. |
| Ituri comparison period, 31 May-13 July 2026 | Median 30.6% (range 13.3-68.5%; 31 eligible intervals from 6 June) | 46/299 on 31 May; 114/646 on 11 June; 157/767 on 15 June; counts not stated on 12-13 July | 15.4%, 17.6%, 20.5%, 34.3%, and 34.9% at the respective dates | Not estimable | Higher positivity and greater testing volume; cumulative CFR values were cross-sectional and not period-specific risks. |
| Early Haut-Uele laboratory reporting, 21-22 July 2026 | 25.0% and 50.0% (20 and 12 samples) | Not stated; nearest outcome observation was 13 July | 92.9% on 13 July, percentage only | Not estimable | Outcome observation preceded laboratory positivity by eight days and was not treated as contemporaneous. |
Table 3.
Operational interpretive framework.
| Observed pattern | Plausible operational interpretation | Required corroborating information |
| Rising positivity with falling testing volume | Selective testing, limited reach, delayed detection, or an emerging cluster | Alert volume, sampling proportion, access constraints, and case-investigation activity |
| High or rising positivity with increasing backlog | Possible diagnostic bottleneck with delayed confirmation | Pending-sample magnitude and age, reagent availability, transport, staffing, and platform uptime |
| Falling positivity with increasing testing volume | Possible broadening of surveillance or case investigation | Expansion of sampling sites, alerts investigated, and changes in testing strategy |
| Rising positivity in a newly reporting area | Geographic expansion, delayed detection, or selective sampling | First-detection dates, onset distribution, mobility, and sampling strategy |
| Low positivity with substantial or aged backlog | Slow exclusion of suspected cases; low positivity may be falsely reassuring | Backlog age, turnaround time, testing volume, and unresolved suspected cases |
Table 4.
Selected operational interpretation periods.
| Period and setting | Observed evidence | Framework classification | Operational interpretation |
| 31 May-11 June 2026, North Kivu | Same-day pending results 42-193; three reports indicated delays >5 days | Documented laboratory backlog episode | The magnitude of the daily pending-sample stock was reported, but positivity was unavailable for most of the period and the series was incomplete. WHO Weekly BVD Report 02 documented active stockouts by 24 May. Report 03 stated that earlier stockouts had been resolved by 31 May but that turnaround times remained prolonged in North Kivu; the daily same-day pending series then increased from 2 to 11 June. |
| 18 June-13 July 2026, North Kivu | Positivity 1.3-13.1% with recurrent qualitative reporting of unanalysed samples | Partial match: low positivity with laboratory constraint | Backlog magnitude and age were not quantified. WHO Weekly BVD Report 05, covering data through 14 June, reported reagent delivery and testing of backlogged samples before this qualitative period began. The later period was therefore analysed separately, although complete clearance and continuity with the earlier quantified stock could not be established. |
| 21-22 July 2026, Haut-Uele | Positivity 25.0% and 50.0% on 20 and 12 tests | Full match: high positivity with low volume in a newly reporting area | The estimates were imprecise and reflected early expansion of reporting. |
| 29 June-1 July 2026, Ituri | Positivity increased from 26.6% to 63.3% as volume rose 70.3%, then fell to 37.9% | No single framework match | The rapid change was retained as contextual evidence and was not attributed to one mechanism. |
Table 5.
Sensitivity analyses.
| Analysis | Status | Result | Interpretation |
| S1: Reported vs recalculated positivity | Estimable | 75 observations; 11 differed after rounding; mean absolute difference 0.02 percentage points; maximum 0.4 | No material change |
| S2: Exclusion of low-certainty observations | Limited | No records excluded because extraction certainty was not discriminating | Uninformative contrast |
| S3: Denominator composition | Not estimable | Indeterminate and repeat-test counts not reported consistently | Influence could not be quantified |
| S4: Original vs revised reports | Partially estimable | Revision and supersession markers incomplete; no consecutive duplicate primary records | Complete comparison not possible |
| S5: Explicit 24-hour observations | Estimable | 73/75 retained; 2.7% coverage loss | Primary findings unchanged |
| S6: Repeat and indeterminate tests | Not estimable | Counts not consistently separated | Effect could not be quantified |
| S7: Data-derived thresholds | Estimable | Thresholds 12.3 percentage points and 46.0%; 68.1% exact category agreement across 72 transitions | Moderate threshold sensitivity |
Disclaimer/Publisher’s Note: The statements, opinions and data contained in all publications are solely those of the individual author(s) and contributor(s) and not of MDPI and/or the editor(s). MDPI and/or the editor(s) disclaim responsibility for any injury to people or property resulting from any ideas, methods, instructions or products referred to in the content. |
© 2026 by the authors. Licensee MDPI, Basel, Switzerland. This article is an open access article distributed under the terms and conditions of the Creative Commons Attribution (CC BY) license (http://creativecommons.org/licenses/by/4.0/).
Copyright: This open access article is published under a Creative Commons CC BY 4.0 license, which permit the free download, distribution, and reuse, provided that the author and preprint are cited in any reuse.


