

Submitted:
17 July 2026
Posted:
03 August 2026
You are already at the latest version
Abstract
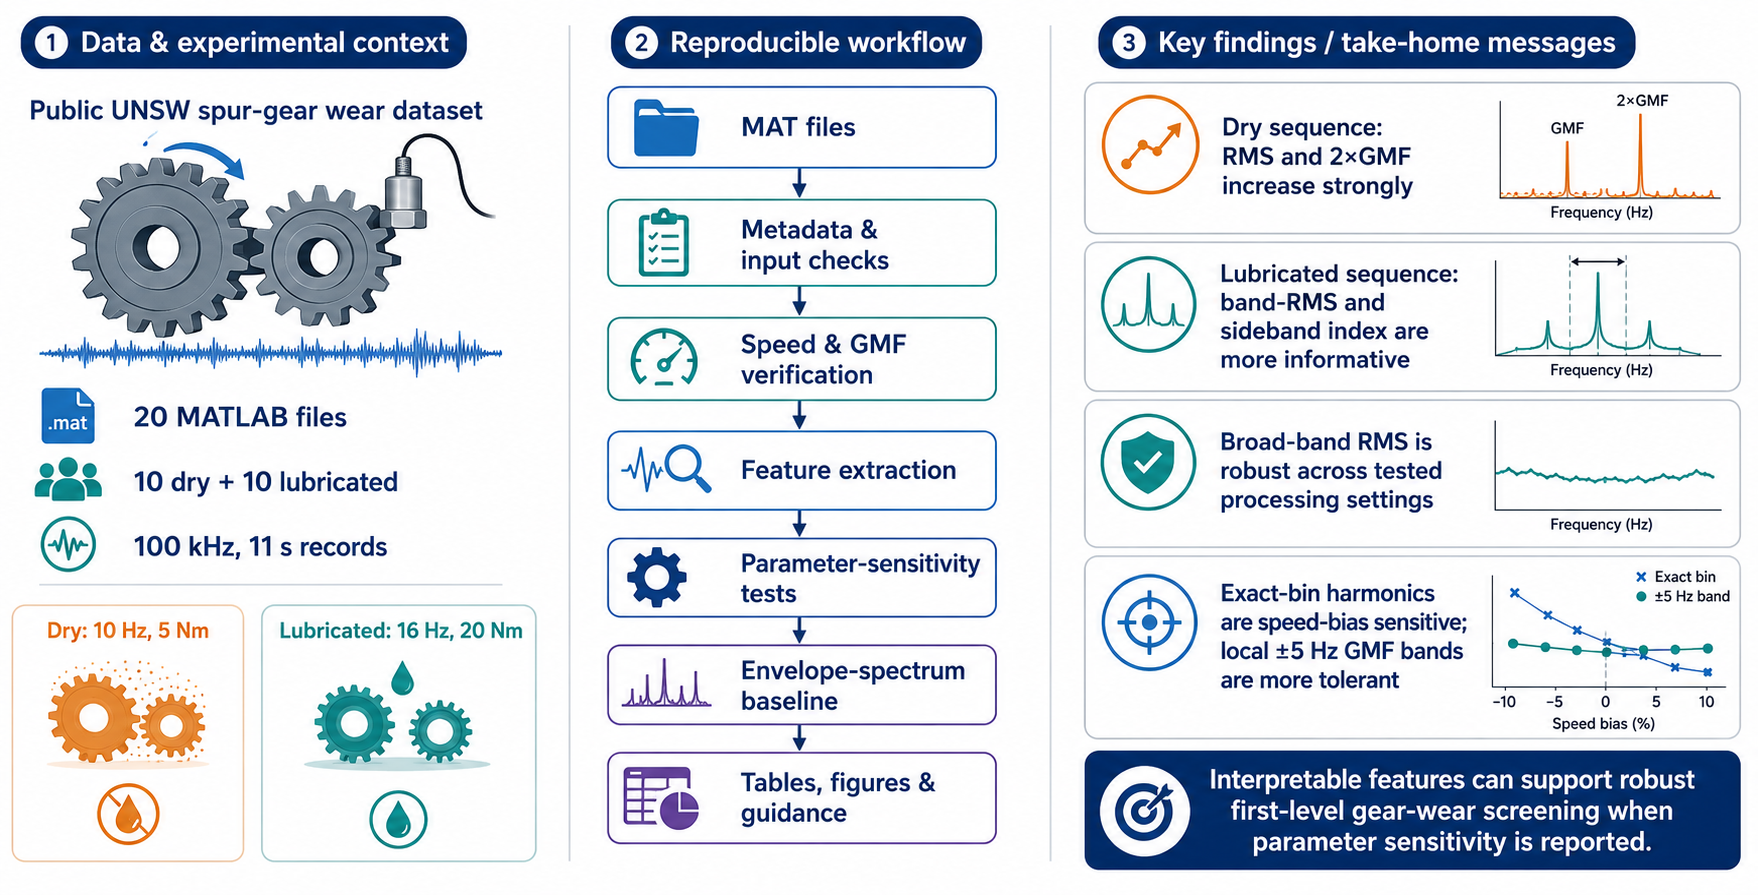
Public run-to-failure datasets support transparent condition monitoring, but the sensitivity of simple vibration features to analysis choices is rarely reported. This study presents a reproducible raw-signal-to-result workflow for 20 MATLAB files from the public University of New South Wales spur-gear wear dataset. Feature sensitivity is evaluated for spectral window, record length, Welch segment length, sideband order, local harmonic-band width, and small speed-reference biases; a Hilbert-envelope spectrum provides a selective demodulation baseline. In the dry sequence, both vibration-channel root-mean-square values increased more than threefold, and the second gear-mesh harmonic increased by a factor of 3.53. In the lubricated sequence, global RMS changed weakly, whereas the 2–13 kHz and 20–37 kHz band-RMS measures and first-harmonic sideband index had Spearman correlations of 0.782, 0.758, and 0.830. Broad-band RMS trends remained positive across all tested windows, record lengths, and Welch settings. Exact-bin harmonics were sensitive to speed-reference bias, whereas a ±5 Hz local-band RMS retained the dry second-harmonic correlation of 0.842 over ±0.1% bias. The lubricated 2–13 kHz envelope first-order index was strongly negative (ρ = −0.782), indicating complementary rather than consistently superior behavior. The contribution is a reproducible parameter-robustness map and practical guidance for selecting interpretable first-level gear-wear indicators.
Keywords:
condition monitoring
; gear mesh frequency
; gear wear
; parameter sensitivity
; reproducible signal processing
; run-to-failure dataset
; sideband analysis
; vibration screening
1. Introduction
Gear wear is a relevant degradation mechanism in mechanical power-transmission systems. Repeated rolling-sliding contact can produce profile change, abrasive wear, fatigue pitting, and more severe surface damage, thereby modifying gear-mesh excitation and the measured vibration response. Vibration analysis is consequently a central data source in condition-based maintenance and transmission health monitoring [1,2,3,4].
Abrasive wear and fatigue pitting do not necessarily produce the same vibration signature. Broad material removal can alter the effective tooth profile and deterministic mesh components, whereas localized or distributed pitting may be expressed more strongly through random, modulated, or cyclostationary components. Recent controlled-degradation experiments have also emphasized the effects of operating condition, assembly variability, and data leakage when evaluating wear-sensitive indicators [5]. Global root-mean-square (RMS), gear-mesh harmonics, sidebands, band-limited energy, and transient-sensitive methods can therefore show different sensitivities depending on the dominant degradation process and the analysis settings [4,6,7,8,9,10].
The public University of New South Wales (UNSW) spur-gear run-to-failure dataset provides a useful benchmark for examining these effects using measured signals. Previous studies based on the same campaign have used cyclostationary vibration analysis, absolute transmission error, tribological image analysis, and coupled dynamic-tribological model updating [6,7,11,12,13]. Those studies provide the physical and experimental context for the present work.
Advanced techniques are essential when the objective is mechanism identification or quantitative wear assessment, but they may be unnecessary for an initial engineering screen. A first-level workflow should make every processing step traceable, verify the operating condition before interpreting spectral features, and report whether its conclusions are stable under plausible parameter choices. These requirements are consistent with established principles for reproducible computational research and reliable scientific software [14,15].
The question addressed here is therefore not only whether conventional vibration features change during the two run-to-failure sequences, but also whether their monotonic conclusions persist when the spectral window, usable record length, power-spectral-density resolution, sideband order, harmonic-band width, and speed reference are varied.
The study makes four contributions: (1) a reproducible raw-signal-to-result implementation for the 20 analyzed files; (2) a one-factor-at-a-time parameter-sensitivity map for physically interpretable features; (3) a comparison with a Hilbert-envelope spectrum baseline; and (4) practical guidance distinguishing robust screening indicators from settings that require accurate speed tracking or more advanced diagnostics. The dry and lubricated sequences are evaluated separately because their speed, load, lubrication state, and degradation mechanisms are not experimentally isolated.
2. Background and Related Work
2.1. Vibration-Based Gear Wear Monitoring
Vibration-based condition monitoring is widely used because it can respond directly to changes in the mechanical state of rotating equipment and can be implemented intermittently or online [1,2]. In geared systems, the measured response contains deterministic mesh components, shaft-order modulation, structural transfer-path effects, broadband energy, and random components associated with contact and surface condition. The usefulness of any single indicator therefore depends on both the physical degradation process and the measurement configuration [3,4,9].
Conventional indicators such as RMS and gear-mesh harmonics can reveal large changes in vibration intensity or tooth-profile-related excitation. More selective techniques, including envelope demodulation, spectral kurtosis, time-frequency analysis, and cyclostationary processing, are valuable when localized or non-stationary components are masked by deterministic vibration [2,3,8,9,10]. The present study uses envelope-spectrum analysis as a comparison baseline rather than claiming to benchmark every advanced method.
2.2. Cyclostationary Analysis of Fatigue Pitting and Abrasive Wear
Feng et al. proposed a method based on second-order cyclostationarity, meaning that second-order signal statistics vary periodically with the gear-meshing cycle, to identify gear wear mechanisms and track wear evolution. Their main idea was that fatigue pitting and abrasive wear generate different surface morphologies, which in turn affect the carrier-frequency content of gear-mesh-cyclic second-order cyclostationary components [6].
The study associated the 2–13 kHz region with fatigue-pitting-related behavior and the 20–37 kHz region with abrasive-wear-related behavior [6]. The present study does not reproduce the cyclostationary decomposition. Instead, it evaluates conventional band-limited RMS and envelope-spectrum indicators in those frequency regions while explicitly testing parameter sensitivity.
2.3. Absolute Transmission Error for Gear Wear Assessment
Chin et al. introduced absolute transmission error as a tool for assessing gear wear. Transmission error is closer to the gear-mesh source than casing vibration and is less affected by the structural transfer path. Their rephasing method used the hunting-tooth period to interpret the zero-frequency shift as an indicator of average material removal [12]. This approach is powerful for quantitative wear-depth assessment, but it requires reliable shaft phase references and careful alignment.
2.4. Tribological and Model-Based Approaches
Chang et al. related macropit development to wear-particle evolution using tooth moulding, oil sampling, microscopy, and image processing [13]. Feng et al. later integrated a 21-degree-of-freedom gearbox model, tribological wear models, and vibration-based model updating to estimate tooth-profile change and pitting density [7]. These approaches provide deeper physical interpretation than a conventional screening workflow, but they also require additional measurements, modelling assumptions, and calibration.
2.5. Research Gap and Positioning
The UNSW campaign has already supported advanced and physically informed analyses. The remaining gap addressed here is narrower but practically important: published feature trends are often reported for a single parameterization, even though exact-bin harmonics, normalized sidebands, and band-energy measures can react differently to record length, spectral window, frequency resolution, and speed-reference error. The present study therefore focuses on feature robustness and reproducible implementation rather than proposing a new wear mechanism or prognostic model.
3. Materials and Methods
3.1. Dataset and Test Conditions
The analysis used 20 MATLAB-format measurement files from the public UNSW spur-gear run-to-failure dataset [11]. Ten files belonged to the dry sequence and ten to the lubricated sequence. Each file contained the sampling frequency Fs, vibration channels vib1 and vib2, the input-shaft tachometer tacIN, and the output-shaft encoder encOUT. Every vibration record contained 1,100,000 samples, corresponding to an 11 s window at 100 kHz.
The test rig comprised a single-stage spur gearbox with a 19-tooth driving pinion and a 52-tooth driven gear. The dry test was conducted at 10 Hz input-shaft speed and 5 Nm brake load without lubrication. The lubricated test was conducted at 16 Hz and 20 Nm with oil-bath lubrication. Because speed, load, and lubrication differ simultaneously, the sequences are not treated as a controlled one-factor comparison.

Table 1.
Summary of the analyzed measurement snapshots and test conditions.
| Item | Dry sequence | Lubricated sequence |
|---|---|---|
| Number of files used | 10 | 10 |
| Input speed | 10 Hz | 16 Hz |
| Brake load | 5 Nm | 20 Nm |
| Lubrication | No lubrication | Oil bath |
| Sampling frequency | 100 kHz | 100 kHz |
| Measurement window | 11 s | 11 s |
| Pinion teeth | 19 | 19 |
| Driven gear teeth | 52 | 52 |
| Approximate gear mesh frequency (GMF) | 190 Hz | 304 Hz |
3.2. File Ordering and Relative Progression
The filenames encoded the test condition and running time; for example, Dry-10Hz_5Nm_01h28m.mat was interpreted as a dry measurement recorded after approximately 1 h and 28 min. The complete file inventory is provided in Supplementary Table S0. Running time was normalized separately within each sequence using Equation (1).
Here, t denotes the snapshot running time, while the minimum and maximum running times correspond to the first and last snapshots within the respective sequence. The normalized variable was used only for visualization and rank-correlation calculations. It is not interpreted as a calibrated health index, wear depth, or life fraction.
3.3. Signal-Integrity and Tachometer Verification
The expected variables, sampling frequency, signal length, and record duration were checked before feature extraction. Tachometer rising edges were detected at a fixed threshold of 0.5 in the supplied signal units. The input-shaft rotational frequency was estimated from the median interval between consecutive rising edges, assuming one pulse per revolution. Approximately 110 pulses were detected in the dry records and 174 pulses in the lubricated records.
The gear mesh frequency was calculated from the verified input-shaft frequency and the 19-tooth pinion according to Equation (2).
3.4. Baseline Vibration-Feature Extraction
The vibration signals were demeaned and processed independently. Root-mean-square, peak-to-peak, standard deviation, crest factor, impulse factor, and shape factor were calculated in the time domain. For harmonic amplitudes, a full-record Hann-windowed fast Fourier transform was used. The one-sided amplitude spectrum was corrected by the coherent gain of the window, and amplitudes were read at the frequency bin nearest to the tachometer-derived GMF and its harmonics.
Broad-band RMS measures were calculated from a Welch power-spectral-density estimate using a Hann window, 32,768-sample segments, 50% overlap, and density scaling. Spectral power was integrated over 0–1 kHz, 2–13 kHz, and 20–37 kHz and then square-rooted. Local harmonic-band RMS was evaluated from a full-record Hann periodogram to retain the approximately 0.091 Hz frequency resolution; the baseline half-width was ±5 Hz around the selected harmonic.
The baseline sideband index used the first five input-shaft orders on both sides of the central harmonic. For harmonic h, Equation (3) uses compact symbols for the central-harmonic amplitude and its paired sideband amplitudes. The baseline setting was K = 5.
Table 2.
Baseline vibration-feature groups and definitions.
| Feature group | Features / definition |
|---|---|
| Time-domain | RMS, peak-to-peak, standard deviation, crest factor, impulse factor, and shape factor |
| Exact-bin gear-mesh | 1×–4×GMF amplitudes from the coherent-gain-corrected Hann spectrum |
| Local gear-mesh energy | Periodogram-based RMS within ±5 Hz of selected GMF harmonics |
| Band-limited RMS | Welch-integrated RMS in 0–1 kHz, 2–13 kHz, and 20–37 kHz |
| Sideband | Mean of ±1 to ±5 input-shaft-order amplitudes around selected GMF harmonics, normalized by the central harmonic |
| Envelope baseline | Normalized first input-shaft-order amplitude of the Hilbert envelope in the 2–13 kHz and 20–37 kHz carrier bands |
3.5. Parameter-Sensitivity Design
A one-factor-at-a-time assessment was performed around the baseline configuration. Spectral-window sensitivity was evaluated using boxcar, Hann, and Hamming windows. Record-length sensitivity used centered 1, 2, 5, and 11 s segments. Sideband-order sensitivity used K = 1, 2, 3, and 5. Welch segment lengths of 8192, 16,384, 32,768, and 65,536 samples were tested for the broad-band RMS measures. Local harmonic-band half-widths of ±2, ±5, and ±10 Hz were evaluated from the full-resolution periodogram.
Speed-reference sensitivity was assessed by imposing relative biases of −0.10%, −0.05%, −0.02%, 0%, +0.02%, +0.05%, and +0.10% on the verified input-shaft frequency before locating exact-bin harmonics, sidebands, and the ±5 Hz local harmonic band. This range is small in shaft-speed terms but shifts the second GMF harmonic by several full-record FFT bins, making it suitable for distinguishing speed-sensitive point estimates from frequency-tolerant band measures.
3.6. Envelope-Spectrum Comparison Baseline
For comparison with a more selective demodulation method, vib1 was bandpass filtered in the 2–13 kHz and 20–37 kHz regions using a fourth-order Butterworth filter applied in zero-phase form. The analytic signal was calculated using the Hilbert transform. The envelope was transformed with a coherent-gain-corrected Hann spectrum, and the first input-shaft-order amplitude was normalized by the mean envelope level. The normalized envelope index for carrier band b was therefore defined by Equation (4), where μ denotes the temporal mean of the envelope in carrier band b.
The comparison evaluates whether the conventional indicators retain progression information relative to a demodulation-based measure; it is not intended as a complete benchmark of cyclostationary or model-based diagnostics.
3.7. Trend and Robustness Assessment
Within each sequence, the initial value, final value, final-to-initial change factor, and Spearman rank correlation with running-time order were calculated. Because only ten snapshots were available per sequence, the coefficients are interpreted descriptively. A leave-one-snapshot-out analysis recalculated each correlation after omitting one observation in turn and recorded the minimum, maximum, and sign consistency.
For each parameter family, the minimum and maximum Spearman correlations across the tested settings were used as a robustness range. A stable positive range indicates that the qualitative trend does not depend on the tested setting, whereas a range crossing zero indicates parameter-dependent interpretation.
3.8. Software Environment and Reproducibility
The complete raw-signal extraction and analysis script is supplied with the submission and regenerates the processed feature table, parameter-sensitivity tables, robustness summaries, and Figure 1, Figure 2, Figure 3, Figure 4, Figure 5, Figure 6, Figure 7, Figure 8, Figure 9 and Figure 10 from the public MATLAB files. The workflow was verified using Python 3.13.5, NumPy 2.3.5, pandas 2.2.3, SciPy 1.17.0, and Matplotlib 3.10.8. The raw files are not redistributed but are referenced by DOI.
4. Results
4.1. Time-Domain Vibration Trends
The dry sequence showed a pronounced increase in vibration intensity. Vib1 RMS increased from 0.01785 to 0.06095, a factor of 3.41, while vib2 RMS increased from 0.00189 to 0.00629, a factor of 3.33. Their Spearman correlations were 0.782 and 0.830, respectively. Figure 3 displays the channels on separate scales.
The lubricated sequence exhibited weaker global-RMS progression. Vib1 RMS increased by a factor of 1.22 with a Spearman correlation of 0.127, while vib2 RMS increased by a factor of 1.17 with a correlation of 0.491. Thus, global vib1 RMS did not provide a stable monotonic indicator for the selected lubricated snapshots.
4.2. Gear-Mesh and Band-Limited Features
Under dry conditions, the vib1 second GMF harmonic increased from 0.00227 to 0.00802, a factor of 3.53, with a Spearman correlation of 0.745. The corresponding ±5 Hz local-band RMS increased by a factor of 3.27 and had a correlation of 0.842. The local measure therefore produced a stronger and more speed-tolerant monotonic trend than the exact-bin amplitude.
For the dry sequence, vib1 band-limited RMS increased by factors of 3.44 in 2–13 kHz and 2.63 in 20–37 kHz, with correlations of 0.770 and 0.818. In the lubricated sequence, the same bands produced correlations of 0.782 and 0.758, while the first-harmonic sideband index increased from 0.0626 to 0.1566 and had a correlation of 0.830.
4.3. Main Trend and Leave-One-Out Summary
All conventional dry-sequence indicators retained their correlation sign in every leave-one-snapshot-out calculation. In the lubricated sequence, the band-limited RMS measures and sideband index also retained 100% sign consistency, whereas vib1 RMS changed sign in two omissions. The complete leave-one-out results are provided in Supplementary Table S3.
Table 3.
Main feature trends in the dry sequence.
| Feature | Initial | Final | Change factor | Spearman ρ |
|---|---|---|---|---|
| Vib1 RMS | 0.01785 | 0.06095 | 3.41× | 0.782 |
| Vib2 RMS | 0.00189 | 0.00629 | 3.33× | 0.830 |
| Vib1 2×GMF exact-bin amplitude | 0.00227 | 0.00802 | 3.53× | 0.745 |
| Vib1 2×GMF local-band RMS (±5 Hz) | 0.00268 | 0.00876 | 3.27× | 0.842 |
| Vib1 band-limited RMS, 2–13 kHz | 0.01048 | 0.03609 | 3.44× | 0.770 |
| Vib1 band-limited RMS, 20–37 kHz | 0.00236 | 0.00621 | 2.63× | 0.818 |
Table 4.
Main feature trends in the lubricated sequence.
| Feature | Initial | Final | Change factor | Spearman ρ |
|---|---|---|---|---|
| Vib1 RMS | 0.02821 | 0.03431 | 1.22× | 0.127 |
| Vib2 RMS | 0.00240 | 0.00281 | 1.17× | 0.491 |
| Vib1 2×GMF exact-bin amplitude | 0.00543 | 0.00868 | 1.60× | 0.261 |
| Vib1 2×GMF local-band RMS (±5 Hz) | 0.00704 | 0.00854 | 1.21× | -0.055 |
| Vib1 band-limited RMS, 2–13 kHz | 0.01051 | 0.01329 | 1.26× | 0.782 |
| Vib1 band-limited RMS, 20–37 kHz | 0.00111 | 0.00356 | 3.21× | 0.758 |
| Vib1 1×GMF sideband index (K=5) | 0.06258 | 0.15662 | 2.50× | 0.830 |
4.4. Parameter Sensitivity Excluding Speed-Reference Bias
Figure 8 and Table 5 summarize the correlation ranges obtained by varying the spectral window, record length, sideband order, Welch segment length, and local harmonic-band width. The broad-band RMS measures were the most stable features: their correlations remained positive for every tested non-speed setting in both sequences. The lubricated sideband index also remained positive, with correlations between 0.661 and 0.867. In contrast, the lubricated exact-bin second-harmonic amplitude ranged from −0.115 to 0.261, indicating that its weak baseline trend was not robust to record length and window choice.
Table 5.
Non-speed parameter-sensitivity ranges of selected indicators.
| Sequence | Feature | Baseline ρ | Parameter range of ρ | Positive-sign settings |
|---|---|---|---|---|
| Dry | 2×GMF exact-bin amplitude | 0.745 | 0.661 to 0.818 | 100% |
| Dry | 1×GMF sideband index | 0.588 | 0.491 to 0.794 | 100% |
| Dry | Band RMS 2–13 kHz | 0.770 | 0.733 to 0.770 | 100% |
| Dry | Band RMS 20–37 kHz | 0.818 | 0.818 to 0.842 | 100% |
| Dry | 2×GMF local-band RMS (±5 Hz) | 0.842 | 0.818 to 0.842 | 100% |
| Lubricated | 2×GMF exact-bin amplitude | 0.261 | -0.115 to 0.261 | 71% |
| Lubricated | 1×GMF sideband index | 0.830 | 0.661 to 0.867 | 100% |
| Lubricated | Band RMS 2–13 kHz | 0.782 | 0.733 to 0.782 | 100% |
| Lubricated | Band RMS 20–37 kHz | 0.758 | 0.733 to 0.770 | 100% |
| Lubricated | 2×GMF local-band RMS (±5 Hz) | -0.055 | -0.055 to 0.042 | 67% |
4.5. Sensitivity to Speed-Reference Bias
The exact-bin features were more sensitive to small errors in the speed reference than the broad-band measures. Across ±0.1% imposed bias, the dry exact-bin second-harmonic correlation ranged from 0.067 to 0.867, and the dry sideband correlation ranged from −0.176 to 0.612. The lubricated exact-bin second-harmonic correlation ranged from −0.818 to 0.261. By contrast, the dry ±5 Hz second-harmonic local-band RMS retained ρ = 0.842 at every tested bias. This result supports local integration when small speed-reference errors or within-record drift may shift a narrow spectral line between bins.
4.6. Comparison with the Envelope-Spectrum Baseline
The conventional features were not uniformly inferior to the envelope-spectrum baseline. In the dry sequence, the 2–13 kHz envelope first-order index had ρ = 0.624, below the corresponding band-RMS correlation of 0.770 and the local second-harmonic RMS correlation of 0.842. In the lubricated sequence, the 2–13 kHz envelope first-order index had a strong negative correlation of −0.782, while the band RMS and sideband index increased with correlations of 0.782 and 0.830. The opposite sign indicates that envelope modulation depth and total carrier-band energy describe complementary aspects of the evolving signal.
Table 6.
Conventional and envelope-spectrum trend comparison, including leave-one-out (LOO) sign consistency.
Table 6.
Conventional and envelope-spectrum trend comparison, including leave-one-out (LOO) sign consistency.
| Sequence | Indicator | Final/initial | Spearman ρ | LOO sign consistency |
|---|---|---|---|---|
| Dry | Vib1 band-limited RMS, 2–13 kHz | 3.44× | 0.770 | 100% |
| Dry | Vib1 band-limited RMS, 20–37 kHz | 2.63× | 0.818 | 100% |
| Dry | Vib1 1×GMF sideband index (K=5) | 10.09× | 0.588 | 100% |
| Dry | Vib1 envelope-spectrum 1× order index, 2–13 kHz | 1.48× | 0.624 | 100% |
| Dry | Vib1 envelope-spectrum 1× order index, 20–37 kHz | 1.62× | -0.055 | 50% |
| Lubricated | Vib1 band-limited RMS, 2–13 kHz | 1.26× | 0.782 | 100% |
| Lubricated | Vib1 band-limited RMS, 20–37 kHz | 3.21× | 0.758 | 100% |
| Lubricated | Vib1 1×GMF sideband index (K=5) | 2.50× | 0.830 | 100% |
| Lubricated | Vib1 envelope-spectrum 1× order index, 2–13 kHz | 0.49× | -0.782 | 100% |
| Lubricated | Vib1 envelope-spectrum 1× order index, 20–37 kHz | 0.08× | 0.042 | 60% |
5. Discussion
5.1. Dry-Sequence Interpretation
The dry sequence produced broad agreement among global RMS, the exact second harmonic, local harmonic-band energy, and both high-frequency band-RMS measures. Previous studies characterized this sequence as abrasive-wear dominated and associated it with tooth-profile change [6,7]. Profile change can alter mesh stiffness and deterministic excitation, which is consistent with the simultaneous growth of mesh-related and broadband components. The present analysis does not independently measure the tooth surface, so this remains a literature-supported interpretation.
5.2. Lubricated-Sequence Interpretation
The lubricated sequence showed why global RMS alone is insufficient. Global vib1 RMS was weak and not leave-one-out sign-stable, whereas the two band-RMS measures and the sideband index were positive and robust under the non-speed parameter variations. The original campaign associated the lubricated sequence with fatigue-pitting behavior [6,13]. Such damage may alter modulation and high-frequency energy before producing a large average-profile change. Nevertheless, the dry and lubricated tests also differ in speed and load, so the contrast cannot be attributed solely to lubrication or mechanism.
5.3. Parameter Robustness and Engineering Implications
The most important methodological result is that feature robustness is feature- and sequence-dependent. Broad-band RMS measures were stable across the tested spectral windows, centered record lengths, and Welch resolutions because they integrate energy over wide intervals. The lubricated sideband index remained positive across window, record-length, and K settings, but the dry sideband index was more sensitive to speed-reference bias because normalization by a small central harmonic can amplify bin-selection changes.
Exact-bin harmonic amplitude is attractive because it is simple and physically direct, but the speed-bias experiment demonstrates that a narrow point estimate can change substantially when the predicted line moves by only a few frequency bins. Local harmonic-band RMS mitigated this limitation in the dry sequence. The ±5 Hz second-harmonic band retained the same ρ = 0.842 across ±0.1% bias and across the tested local-band widths. This does not make local-band RMS universally diagnostic—the lubricated local harmonic measures remained weak—but it provides a practical speed-tolerant alternative for deterministic dry-wear trends.
5.4. Relationship to Envelope Demodulation
The envelope-spectrum comparison shows that greater processing selectivity does not guarantee a larger or same-direction monotonic trend. The lubricated 2–13 kHz envelope first-order component decreased strongly while total band energy and the normalized GMF sideband index increased. These indicators emphasize different quantities: carrier-band energy, modulation around a mesh harmonic, and shaft-order content of the demodulated envelope. A layered screening workflow should therefore treat them as complementary rather than interchangeable.
5.5. Practical Feature-Selection Guidance
A first-level screen should prioritize features whose conclusions are stable under plausible analysis choices, while retaining at least one mesh-related and one broadband indicator. Table 7 summarizes the recommended use of the demonstrated features.
5.6. Relationship to Previous Studies and Intended Use
Cyclostationary analysis, absolute transmission error, tribological imaging, and dynamic-tribological model updating have extracted deeper information from this campaign [6,7,12,13]. The present contribution is different: it quantifies how much confidence can be placed in conventional trend conclusions before escalating to those methods. The workflow is intended for education, benchmarking, reproducible method comparison, and engineering triage under approximately repeatable operating conditions.
6. Limitations
First, the analysis contains only 20 snapshots from two run-to-failure sequences. The records are densely sampled in time, but the degradation histories are sparsely sampled. The results demonstrate feature screening and parameter sensitivity rather than continuous prognostics.
Second, the dry and lubricated sequences differ simultaneously in lubrication state, speed, and load. Between-sequence differences cannot be attributed to one factor. Mechanism-related explanations rely on the published characterization of the original campaign [6,7,13].
Third, the data originate from one laboratory spur-gear rig. No independent run, second gearbox, or variable-duty validation is included. The parameter ranges show numerical robustness within the present dataset but do not establish transferability to industrial gearboxes.
Fourth, vibration amplitudes are reported in the numerical units supplied by the dataset because no additional calibration factor was applied. Running time is an ordering proxy rather than a measured wear-depth label.
Fifth, the sensitivity study is one-factor-at-a-time and does not examine all parameter interactions. The centered-segment record-length test also does not represent every possible segment location. The envelope baseline is a conventional demodulation comparison, not a complete benchmark against cyclostationary or physics-based methods.
Finally, Spearman correlations describe monotonic association and do not establish diagnostic specificity, uncertainty bounds, alarm thresholds, remaining useful life, or causal wear-mechanism identification.
7. Conclusions
This study developed a reproducible raw-signal-to-result workflow and a parameter-sensitivity assessment for interpretable vibration features using 20 public dry and lubricated spur-gear wear snapshots.
The dry sequence exhibited broad changes across RMS, exact and local gear-mesh measures, and high-frequency band RMS. The lubricated sequence required frequency-selective and modulation-sensitive indicators because global vib1 RMS was weak and not leave-one-out sign-stable.
Broad-band RMS trends were the most stable across spectral window, record length, and Welch resolution. The lubricated sideband index also remained positive across non-speed settings. Exact-bin harmonic features were sensitive to small speed-reference biases, whereas the ±5 Hz local second-harmonic RMS retained the dry-sequence correlation of 0.842 over ±0.1% bias. This identifies local harmonic integration as a practical speed-tolerant alternative when deterministic mesh components are relevant.
The Hilbert-envelope comparison provided complementary information but was not consistently more monotonic than the conventional features. The main contribution is therefore not a new wear law or severity estimator, but a reproducible robustness map showing which interpretable indicators can support first-level screening and which require careful parameter control or diagnostic escalation.
Supplementary Materials
The following supporting information can be downloaded at the website of this paper posted on Preprints.org, Tables S0–S15 in comma-separated value (CSV) format, covering the file inventory, baseline raw-signal features, main trends, leave-one-snapshot-out results, parameter-sensitivity values, envelope-demodulation values, and compact summaries; Document S1, Supporting_Information_Applied_Sciences_parameter_robustness.docx; extract_and_analyze_raw_signals.py, the complete raw-signal processing and figure-generation script; analysis_metadata.json; README.txt; and requirements.txt.
Author Contributions
Conceptualization, K.H.; methodology, K.H.; software, K.H.; formal analysis, K.H.; investigation, K.H.; data curation, K.H.; visualization, K.H.; writing—original draft preparation, K.H.; writing—review and editing, K.H. The author has read and agreed to the published version of the manuscript.
Funding
This research was funded by the Ministry of Culture and Innovation through the University Research Scholarship Programme (EKÖP), grant number EKÖP-26-3-I-SZE-17.
Institutional Review Board Statement
Not applicable.
Informed Consent Statement
Not applicable.
Data Availability Statement
The raw MATLAB-format vibration measurements are publicly available in the UNSW Gear Wear Run-to-Failure Dataset on Mendeley Data (Version 2), https://doi.org/10.17632/p2yryg9k6z.2 [11]. The complete raw-signal processing code, processed feature tables, parameter-sensitivity results, and figure-generation files are supplied with this submission. The public raw files are not redistributed.
Conflicts of Interest
The author declares no conflict of interest. The funder had no role in the design of the study; in the collection, analysis, or interpretation of data; in the writing of the manuscript; or in the decision to publish the results.
Acknowledgments
This research was carried out at the Vibro-Acoustics and Rotor Dynamics Research Group within the Audi Hungaria Faculty of Engineering at Széchenyi István University, Győr, Hungary. During manuscript preparation, the author used OpenAI ChatGPT (GPT-5.5 Thinking; accessed 11 July 2026) for language refinement, structural editing, terminology consistency, and assistance in organizing the documented analysis workflow. The author reviewed and verified all AI-assisted content and takes full responsibility for the publication.
Abbreviations
The following abbreviations are used in this manuscript:
| Abbreviation | Definition |
| DOI | Digital object identifier |
| EKÖP | University Research Scholarship Programme |
| GMF | Gear mesh frequency |
| LOO | Leave one out |
| RMS | Root mean square |
| UNSW | University of New South Wales |
References
- Jardine, A.K.S.; Lin, D.; Banjevic, D. A review on machinery diagnostics and prognostics implementing condition-based maintenance. Mech. Syst. Signal Process. 2006, 20, 1483–1510. [Google Scholar] [CrossRef]
- Randall, R.B. Vibration-Based Condition Monitoring: Industrial, Aerospace and Automotive Applications; John Wiley & Sons: Chichester, UK, 2011. [Google Scholar]
- Samuel, P.D.; Pines, D.J. A review of vibration-based techniques for helicopter transmission diagnostics. J. Sound. Vib. 2005, 282, 475–508. [Google Scholar] [CrossRef]
- Feng, K.; Ji, J.C.; Ni, Q.; Beer, M. A review of vibration-based gear wear monitoring and prediction techniques. Mech. Syst. Signal Process. 2023, 182, 109605. [Google Scholar] [CrossRef]
- Bachar, L.; Matania, O.; Cohen, R.; Bortman, J. Anomaly detection of gear wear: Introducing a novel health indicator through experimentation and physical investigation. Struct. Health Monit. 2026, 25, 1409–1423. [Google Scholar] [CrossRef]
- Feng, K.; Smith, W.A.; Borghesani, P.; Randall, R.B.; Peng, Z. Use of cyclostationary properties of vibration signals to identify gear wear mechanisms and track wear evolution. Mech. Syst. Signal Process. 2021, 150, 107258. [Google Scholar] [CrossRef]
- Feng, K.; Smith, W.A.; Randall, R.B.; Wu, H.; Peng, Z. Vibration-based monitoring and prediction of surface profile change and pitting density in a spur gear wear process. Mech. Syst. Signal Process. 2022, 165, 108319. [Google Scholar] [CrossRef]
- Antoni, J. The spectral kurtosis: A useful tool for characterising non-stationary signals. Mech. Syst. Signal Process. 2006, 20, 282–307. [Google Scholar] [CrossRef]
- Dalpiaz, G.; Rivola, A.; Rubini, R. Effectiveness and sensitivity of vibration processing techniques for local fault detection in gears. Mech. Syst. Signal Process. 2000, 14, 387–412. [Google Scholar] [CrossRef]
- Staszewski, W.J.; Tomlinson, G.R. Application of the wavelet transform to fault detection in a spur gear. Mech. Syst. Signal Process. 1994, 8, 289–307. [Google Scholar] [CrossRef]
- Feng, K.; Borghesani, P.; Chang, H.; Chin, Z.Y.; Peng, Z.; Smith, W. Gear Wear Run-to-Failure Dataset; Mendeley Data, Version 2. 2021. [Google Scholar] [CrossRef]
- Chin, Z.Y.; Smith, W.A.; Borghesani, P.; Randall, R.B.; Peng, Z. Absolute transmission error: A simple new tool for assessing gear wear. Mech. Syst. Signal Process. 2021, 146, 107070. [Google Scholar] [CrossRef]
- Chang, H.; Borghesani, P.; Peng, Z. Investigation on the relationship between macropits and wear particles in a gear fatigue process. Wear 2021, 484–485, 203724. [Google Scholar] [CrossRef]
- Sandve, G.K.; Nekrutenko, A.; Taylor, J.; Hovig, E. Ten simple rules for reproducible computational research. PLoS Comput. Biol. 2013, 9, e1003285. [Google Scholar] [CrossRef] [PubMed]
- Wilson, G.; Aruliah, D.A.; Brown, C.T.; Chue Hong, N.P.; Davis, M.; Guy, R.T.; et al. Best practices for scientific computing. PLoS Biol. 2014, 12, e1001745. [Google Scholar] [CrossRef] [PubMed]
Figure 1.
Raw-signal processing chain including baseline feature extraction, parameter-sensitivity testing, envelope-spectrum comparison, and reproducible reporting.
Figure 1.
Raw-signal processing chain including baseline feature extraction, parameter-sensitivity testing, envelope-spectrum comparison, and reproducible reporting.
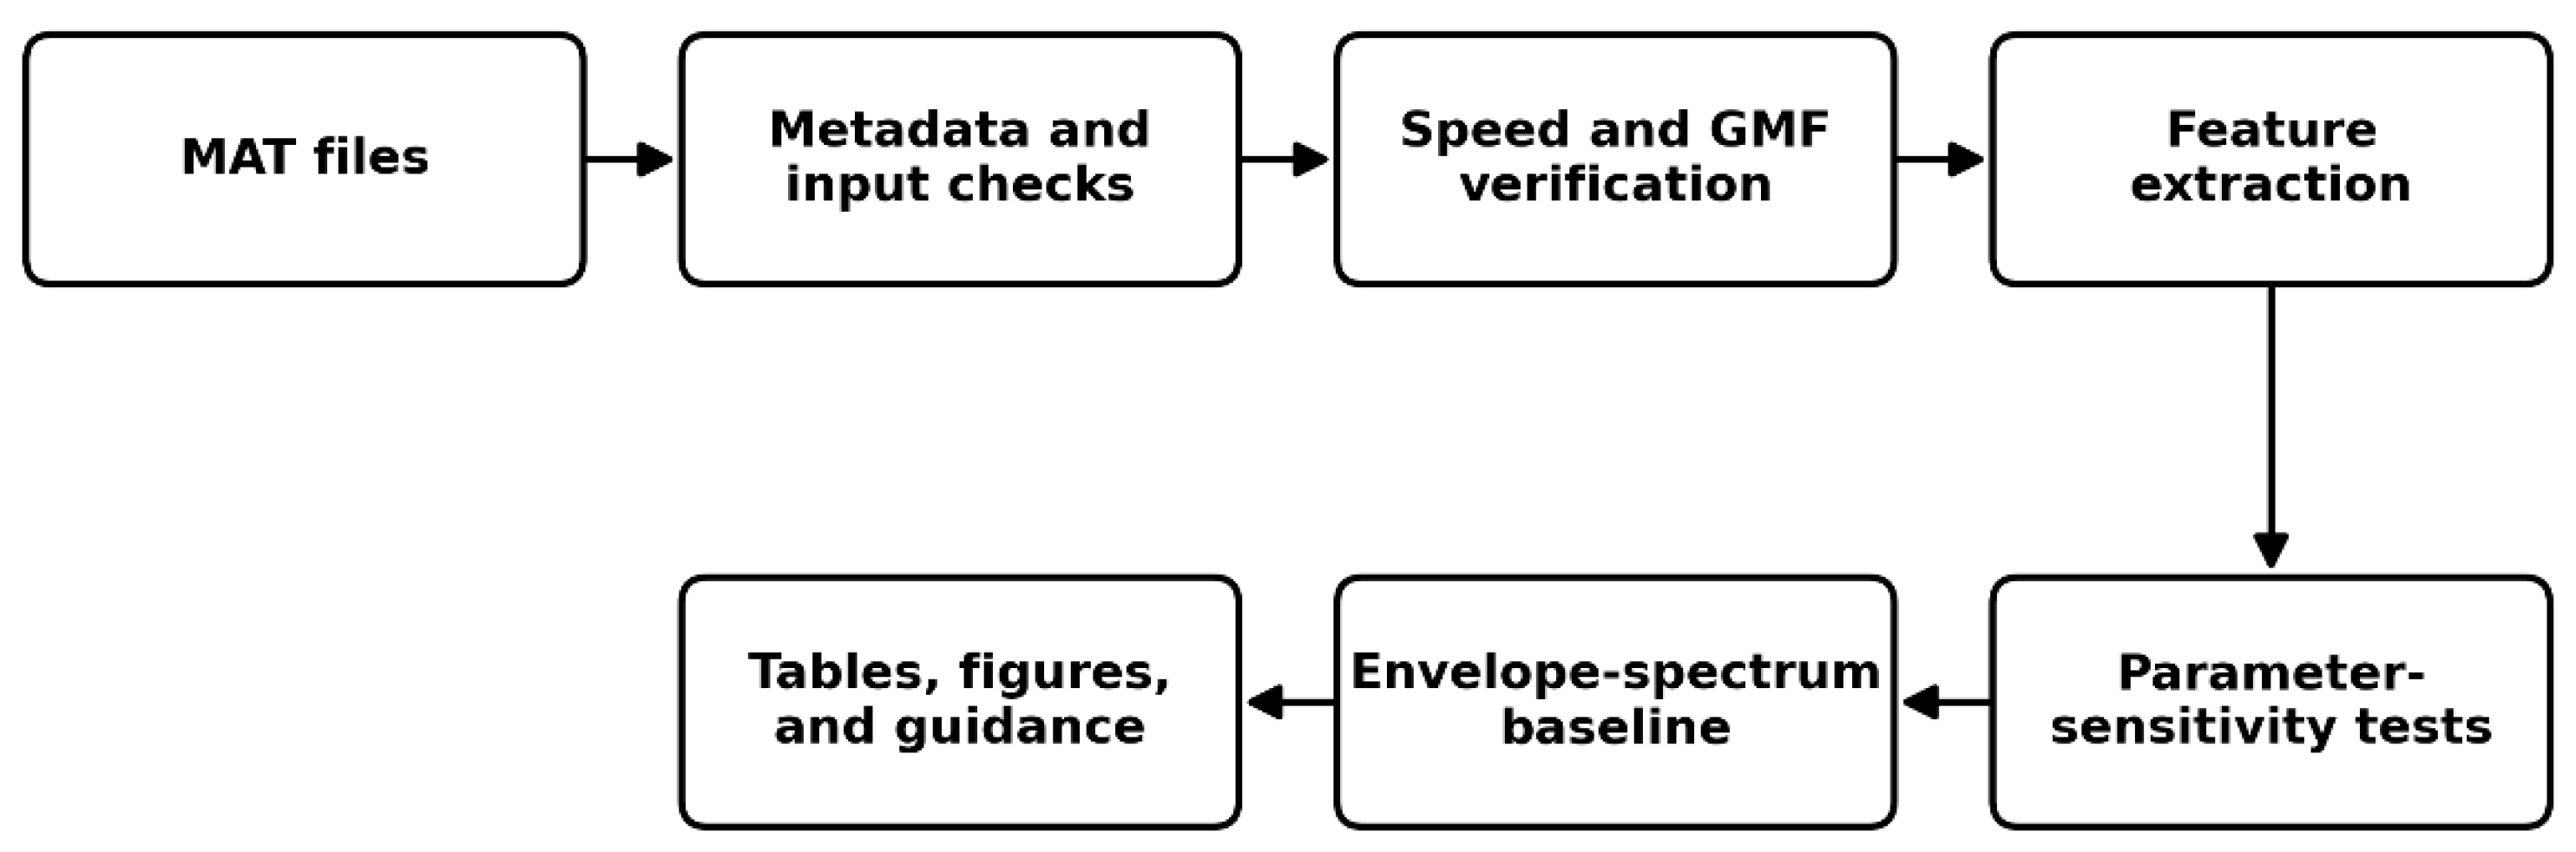
Figure 2.
Tachometer-based input-shaft speed verification for (a) the dry sequence and (b) the lubricated sequence. Dashed lines indicate the nominal rotational frequencies.
Figure 2.
Tachometer-based input-shaft speed verification for (a) the dry sequence and (b) the lubricated sequence. Dashed lines indicate the nominal rotational frequencies.
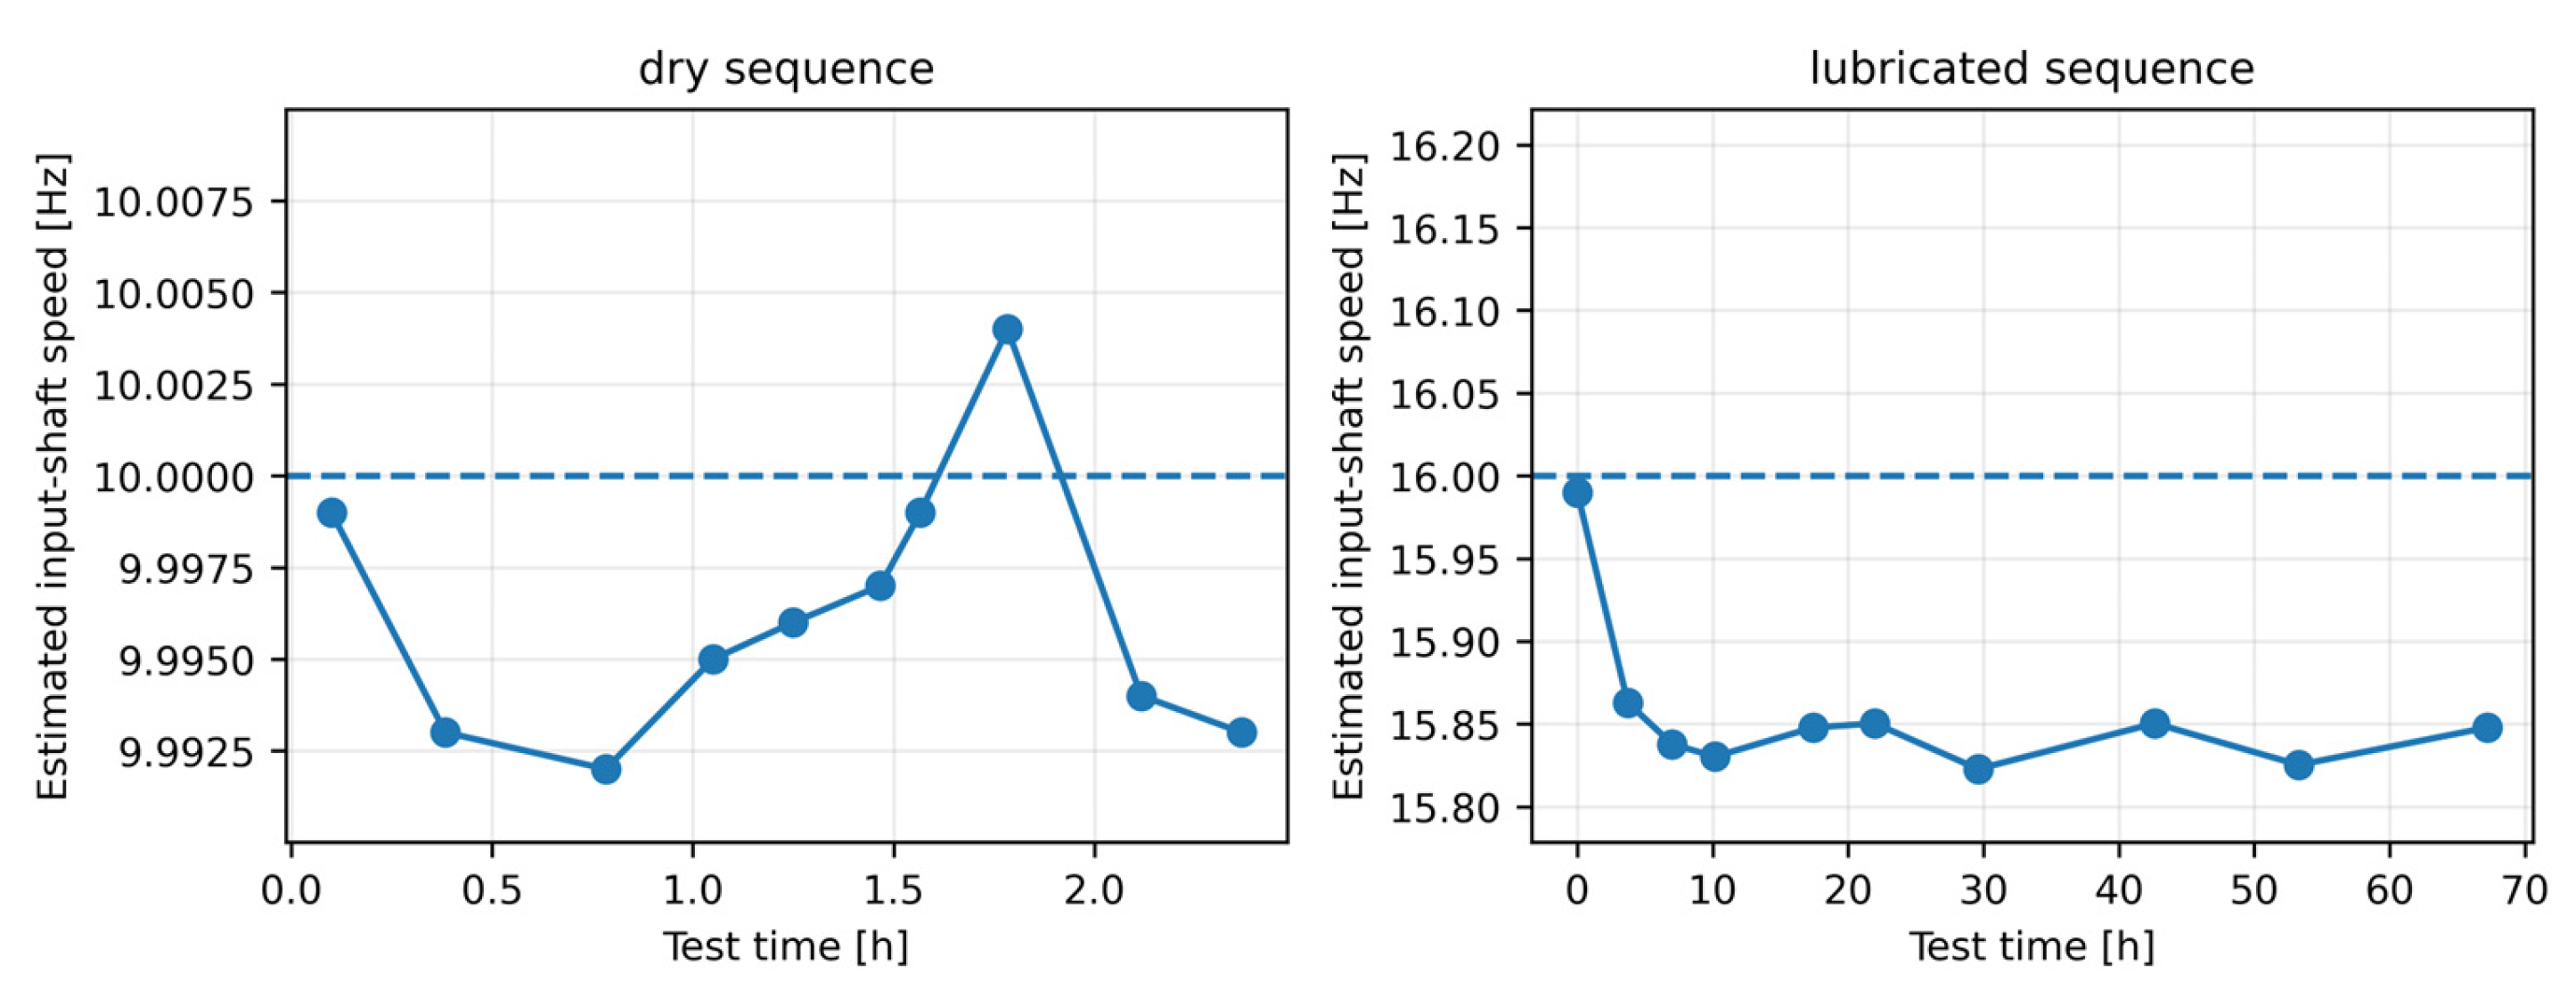
Figure 3.
RMS trends of (a) vib1 and (b) vib2 during the dry sequence. Signal amplitudes are reported in dataset units because no additional sensor-calibration factor was applied.
Figure 3.
RMS trends of (a) vib1 and (b) vib2 during the dry sequence. Signal amplitudes are reported in dataset units because no additional sensor-calibration factor was applied.
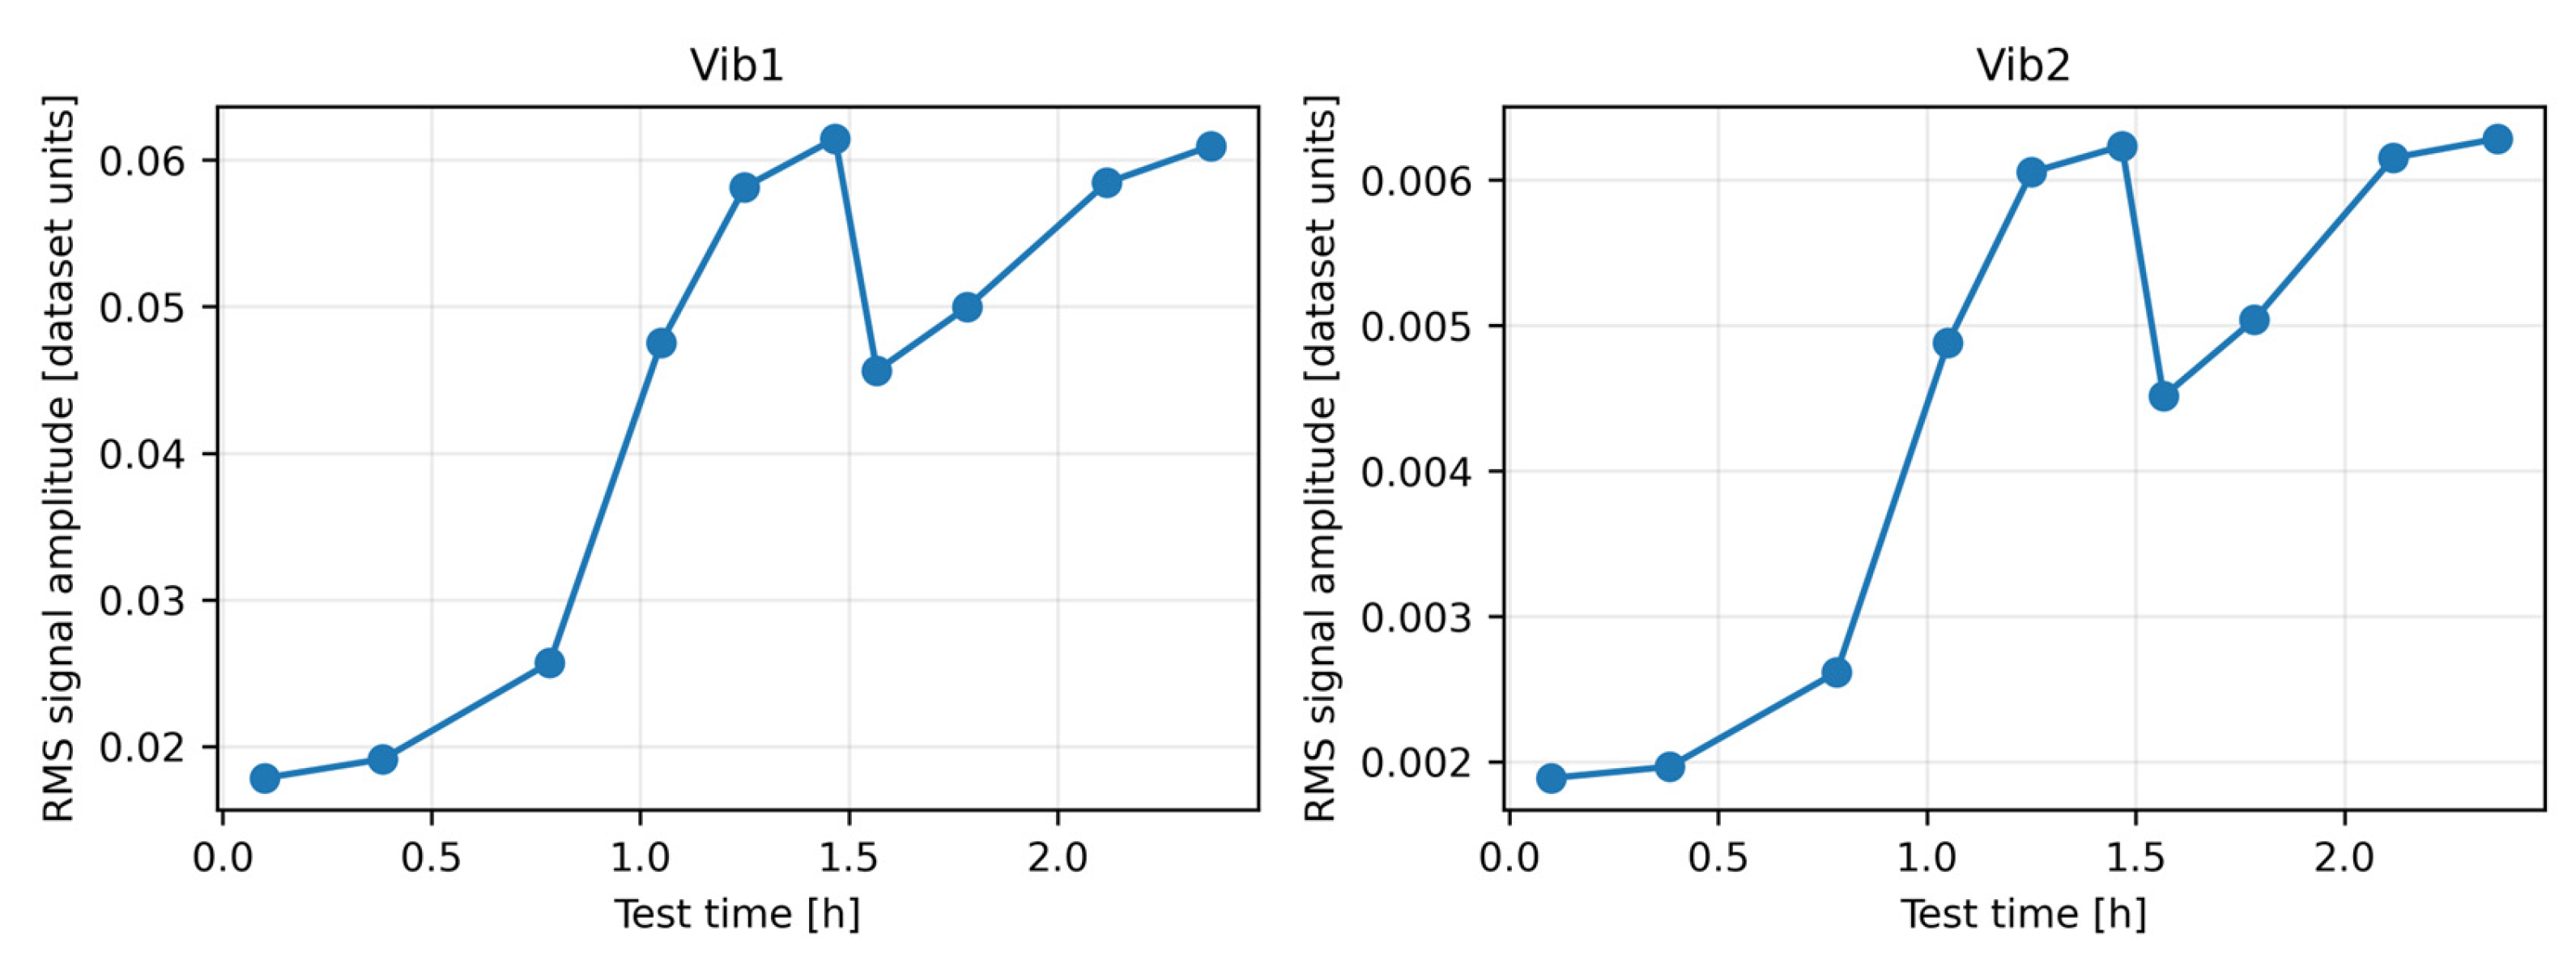
Figure 4.
RMS trends of (a) vib1 and (b) vib2 during the lubricated sequence, showing the limited monotonic contrast of global RMS.
Figure 4.
RMS trends of (a) vib1 and (b) vib2 during the lubricated sequence, showing the limited monotonic contrast of global RMS.
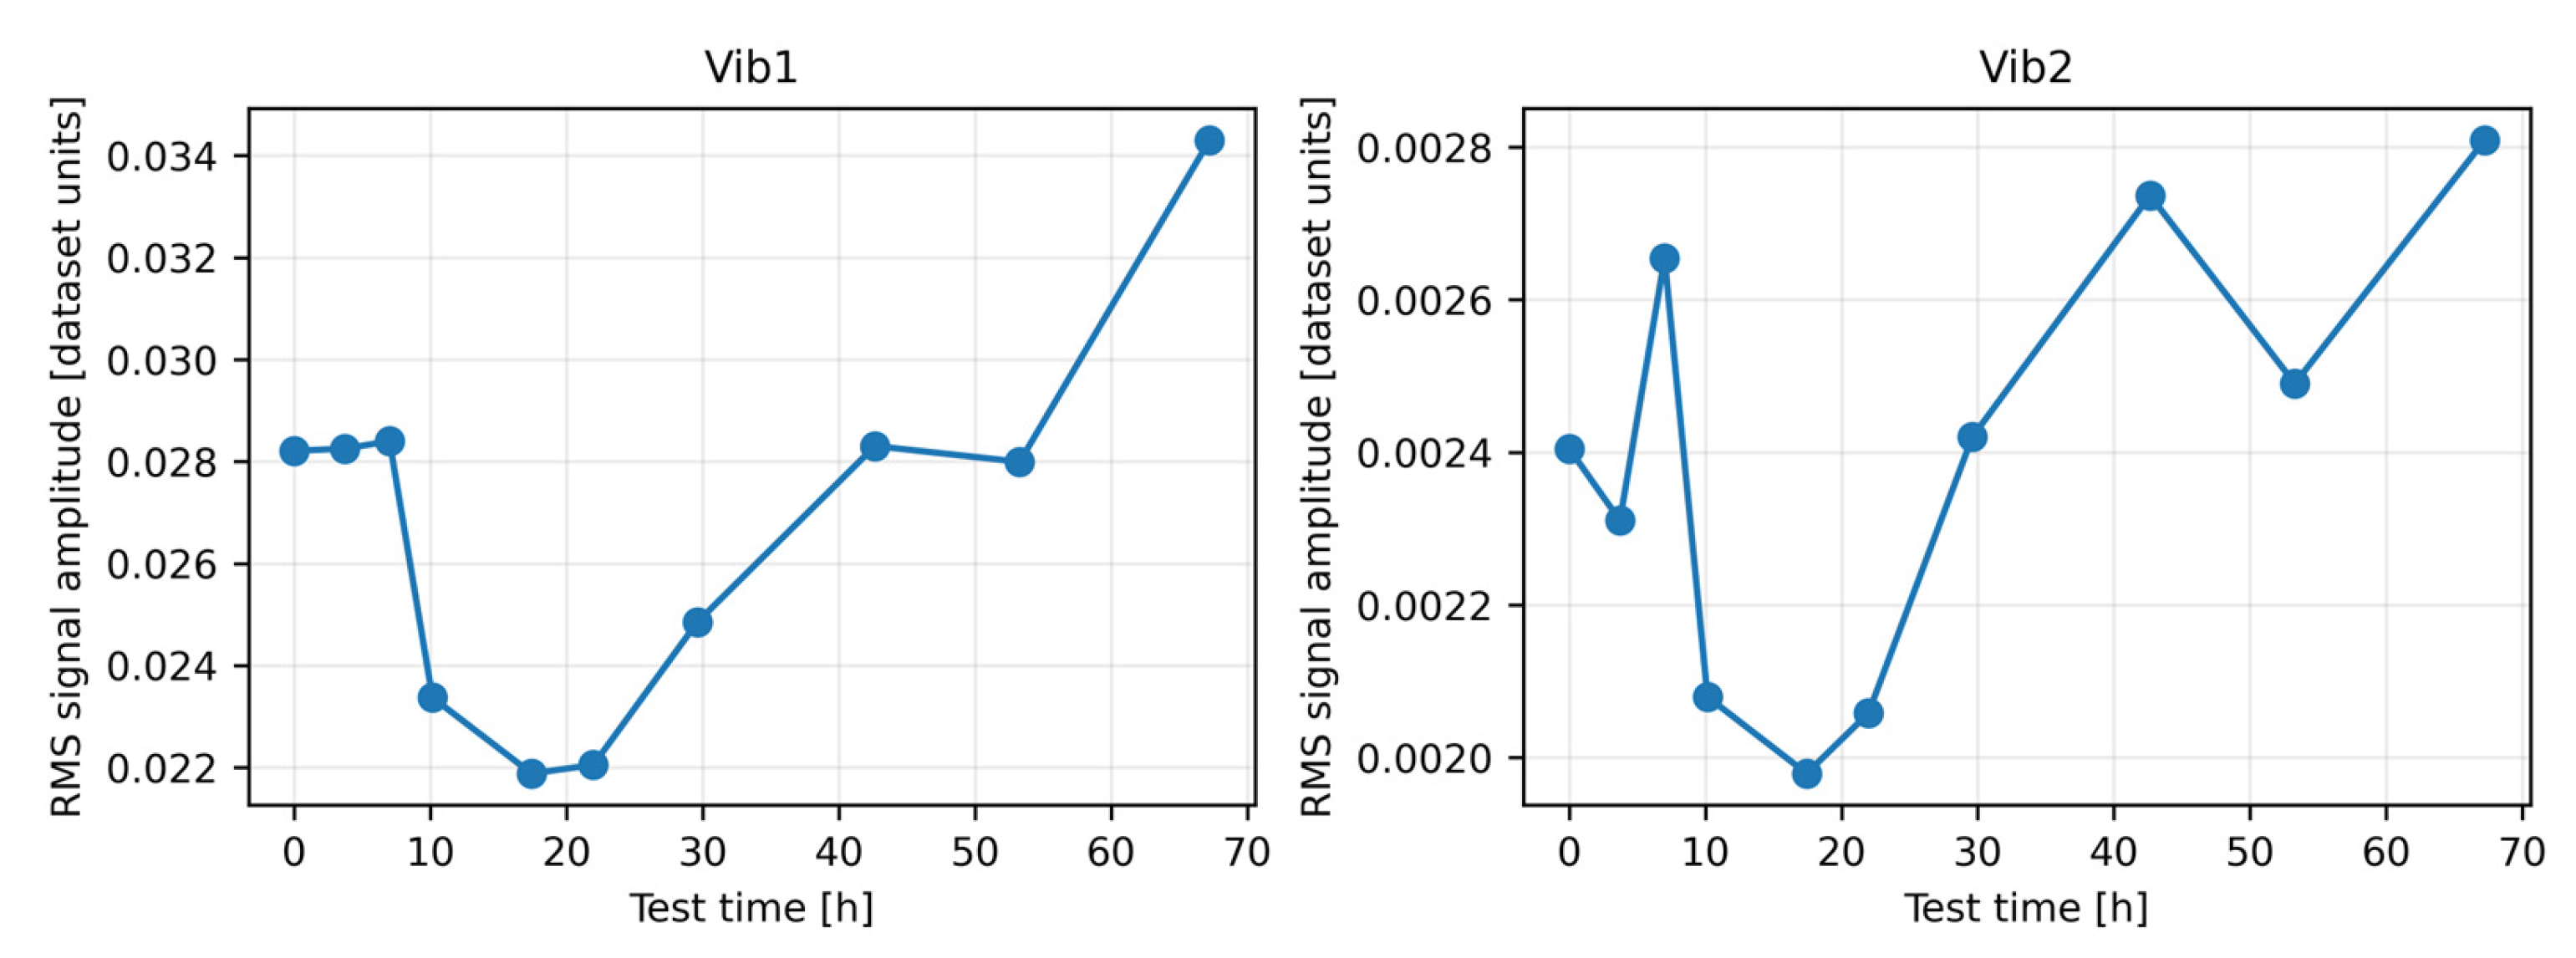
Figure 5.
Evolution of the first and second exact-bin gear-mesh harmonic amplitudes in vib1 during the dry sequence.
Figure 5.
Evolution of the first and second exact-bin gear-mesh harmonic amplitudes in vib1 during the dry sequence.
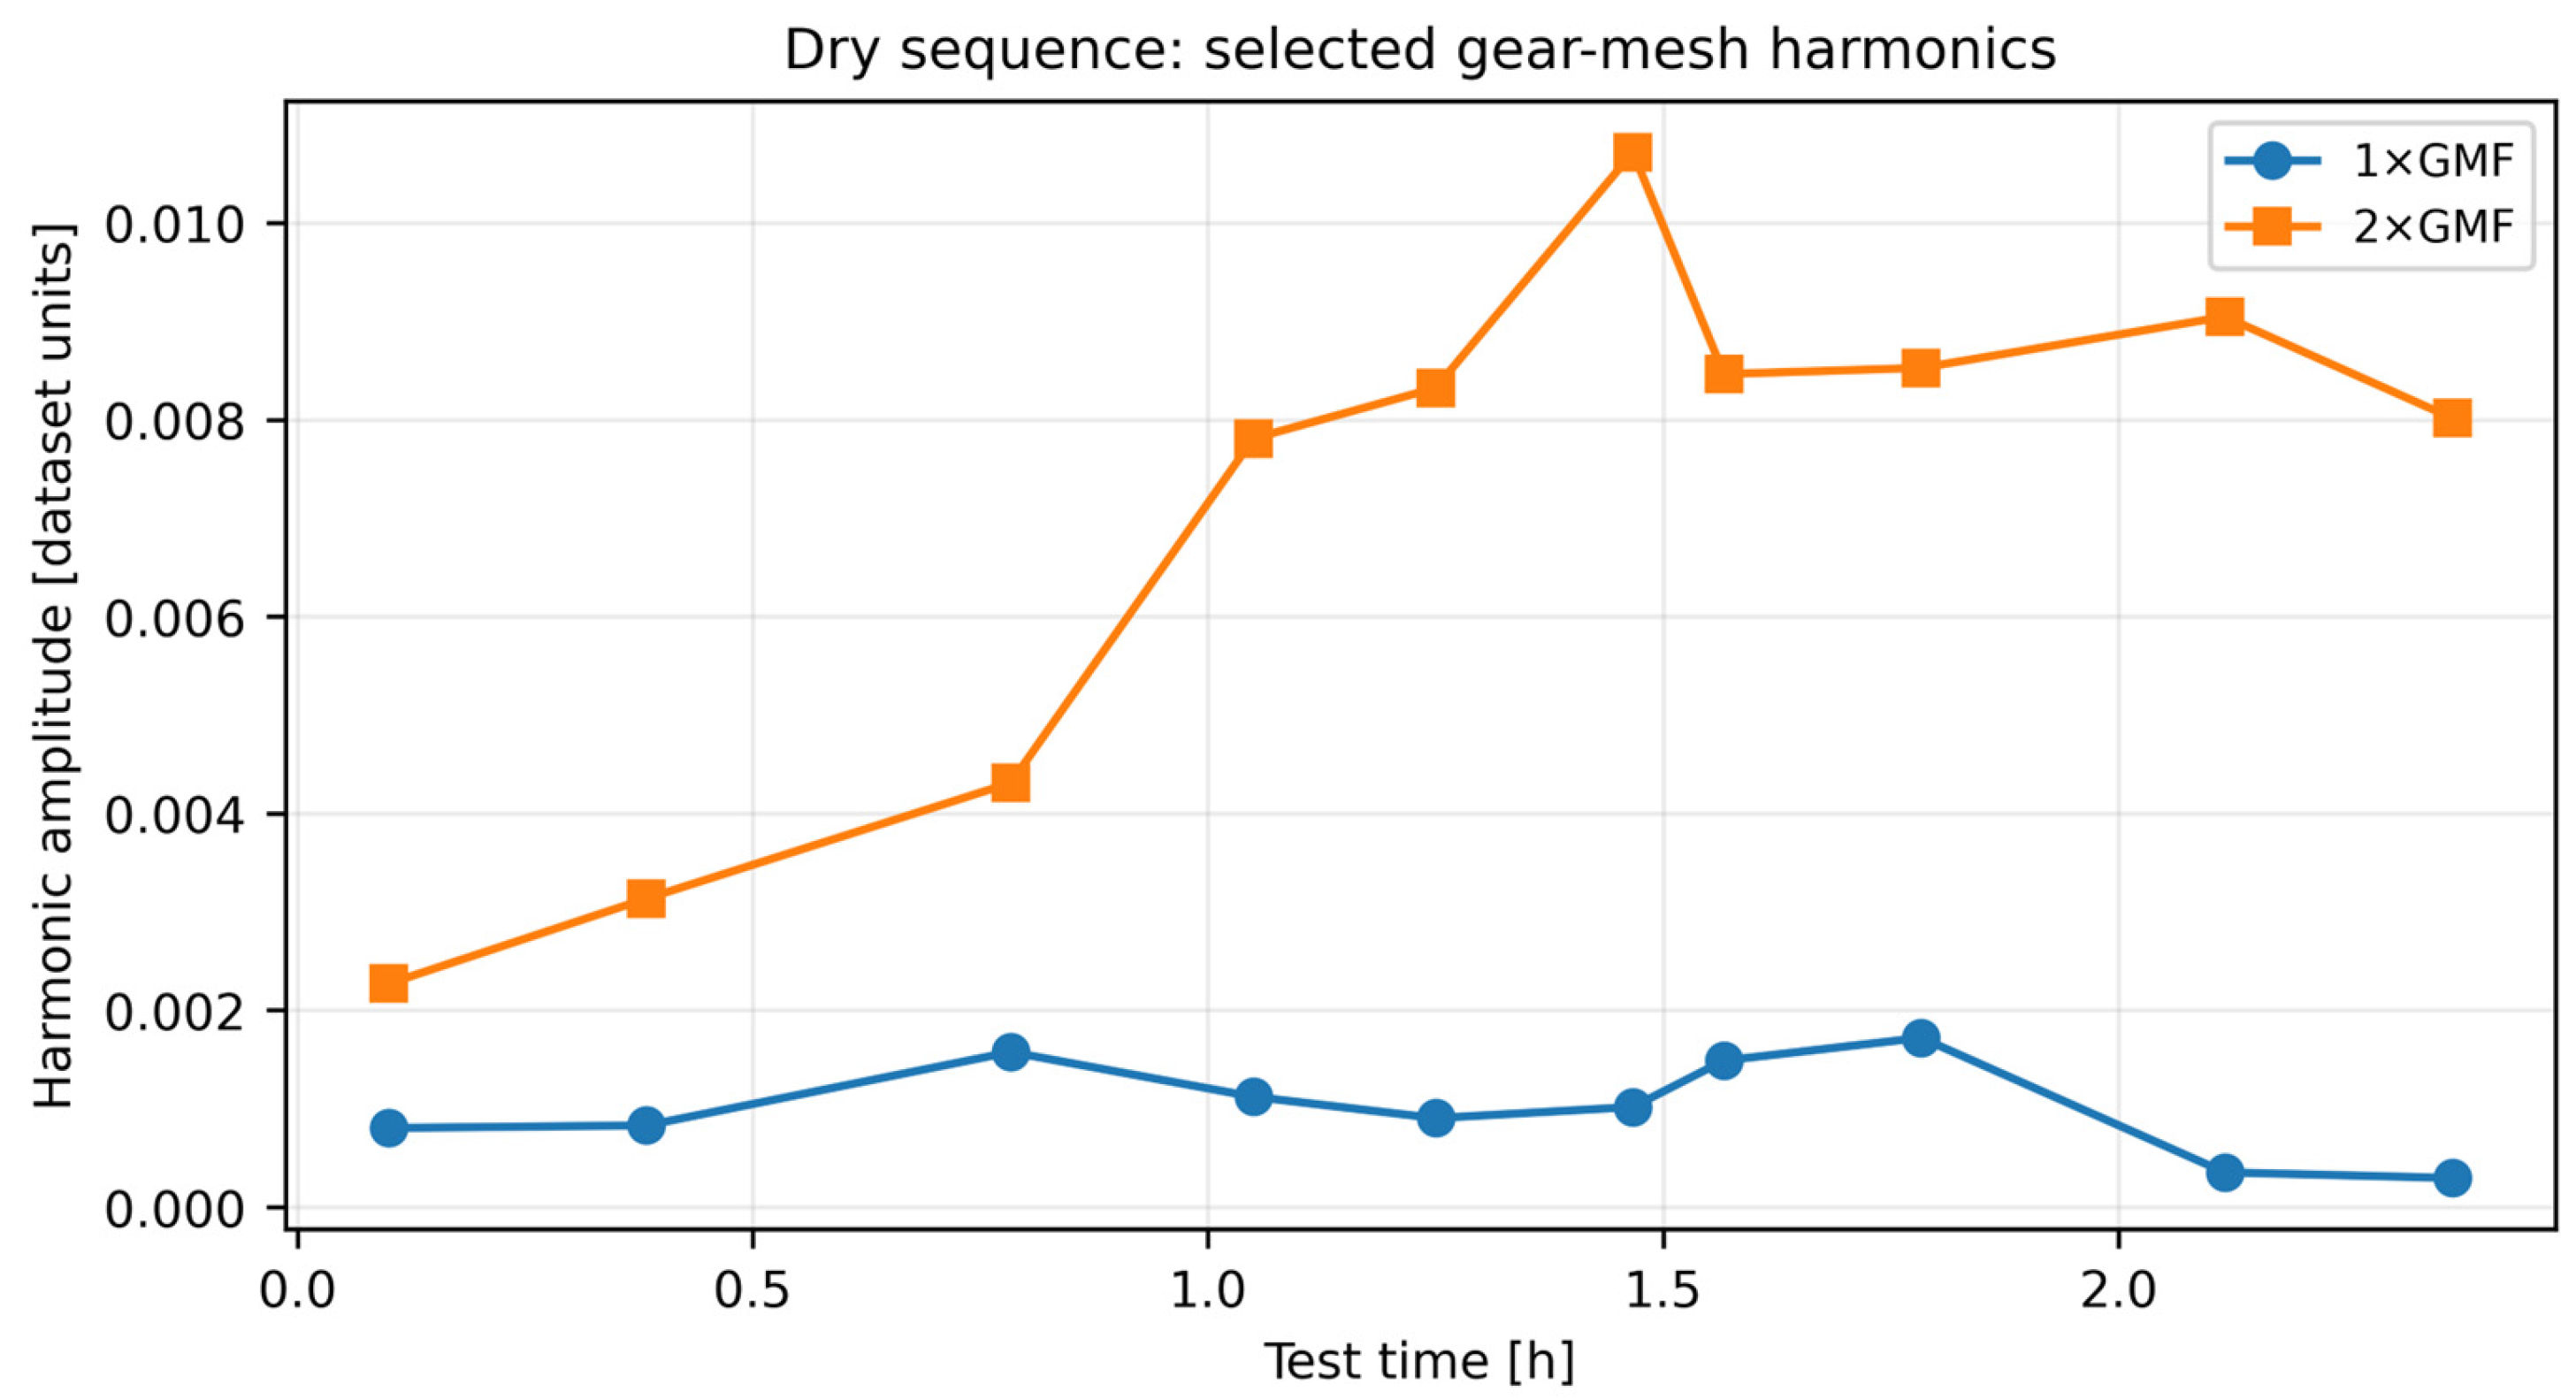
Figure 6.
First-harmonic GMF sideband index using K = 5 during the lubricated sequence.
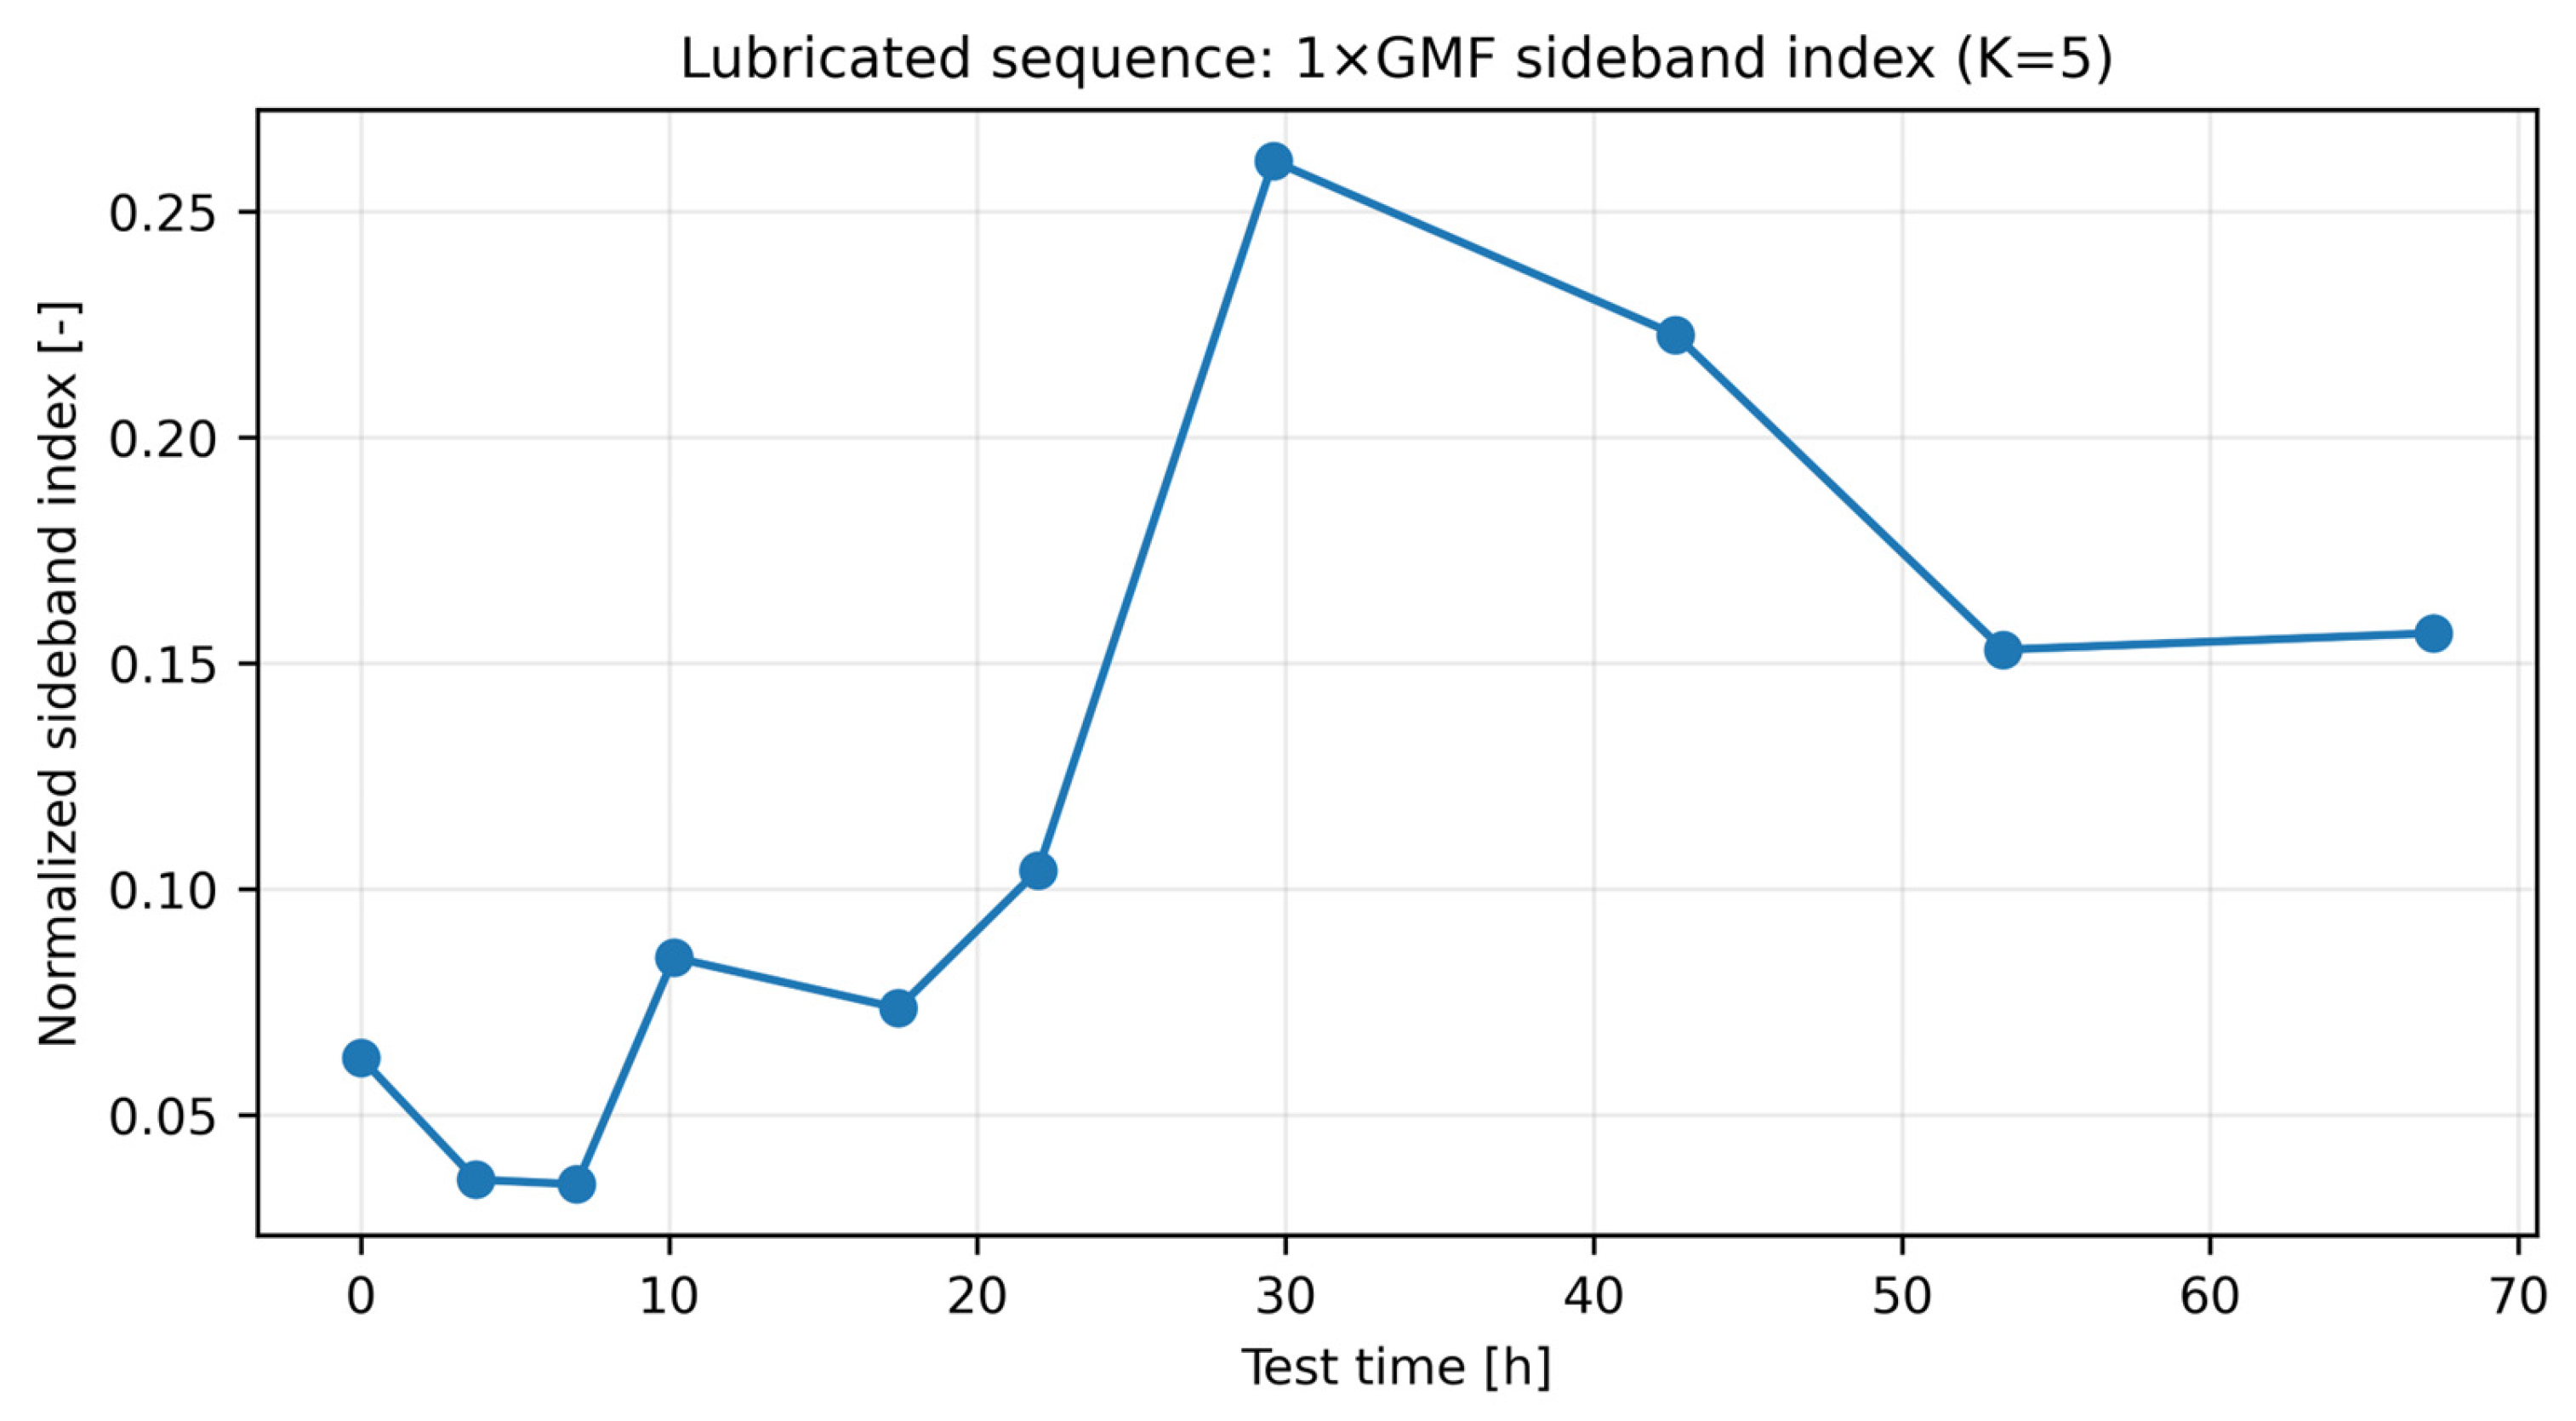
Figure 7.
Band-limited RMS trajectories for the dry and lubricated sequences. Each trajectory was independently min–max normalized within its own sequence; the normalized values do not represent a common absolute wear scale.
Figure 7.
Band-limited RMS trajectories for the dry and lubricated sequences. Each trajectory was independently min–max normalized within its own sequence; the normalized values do not represent a common absolute wear scale.
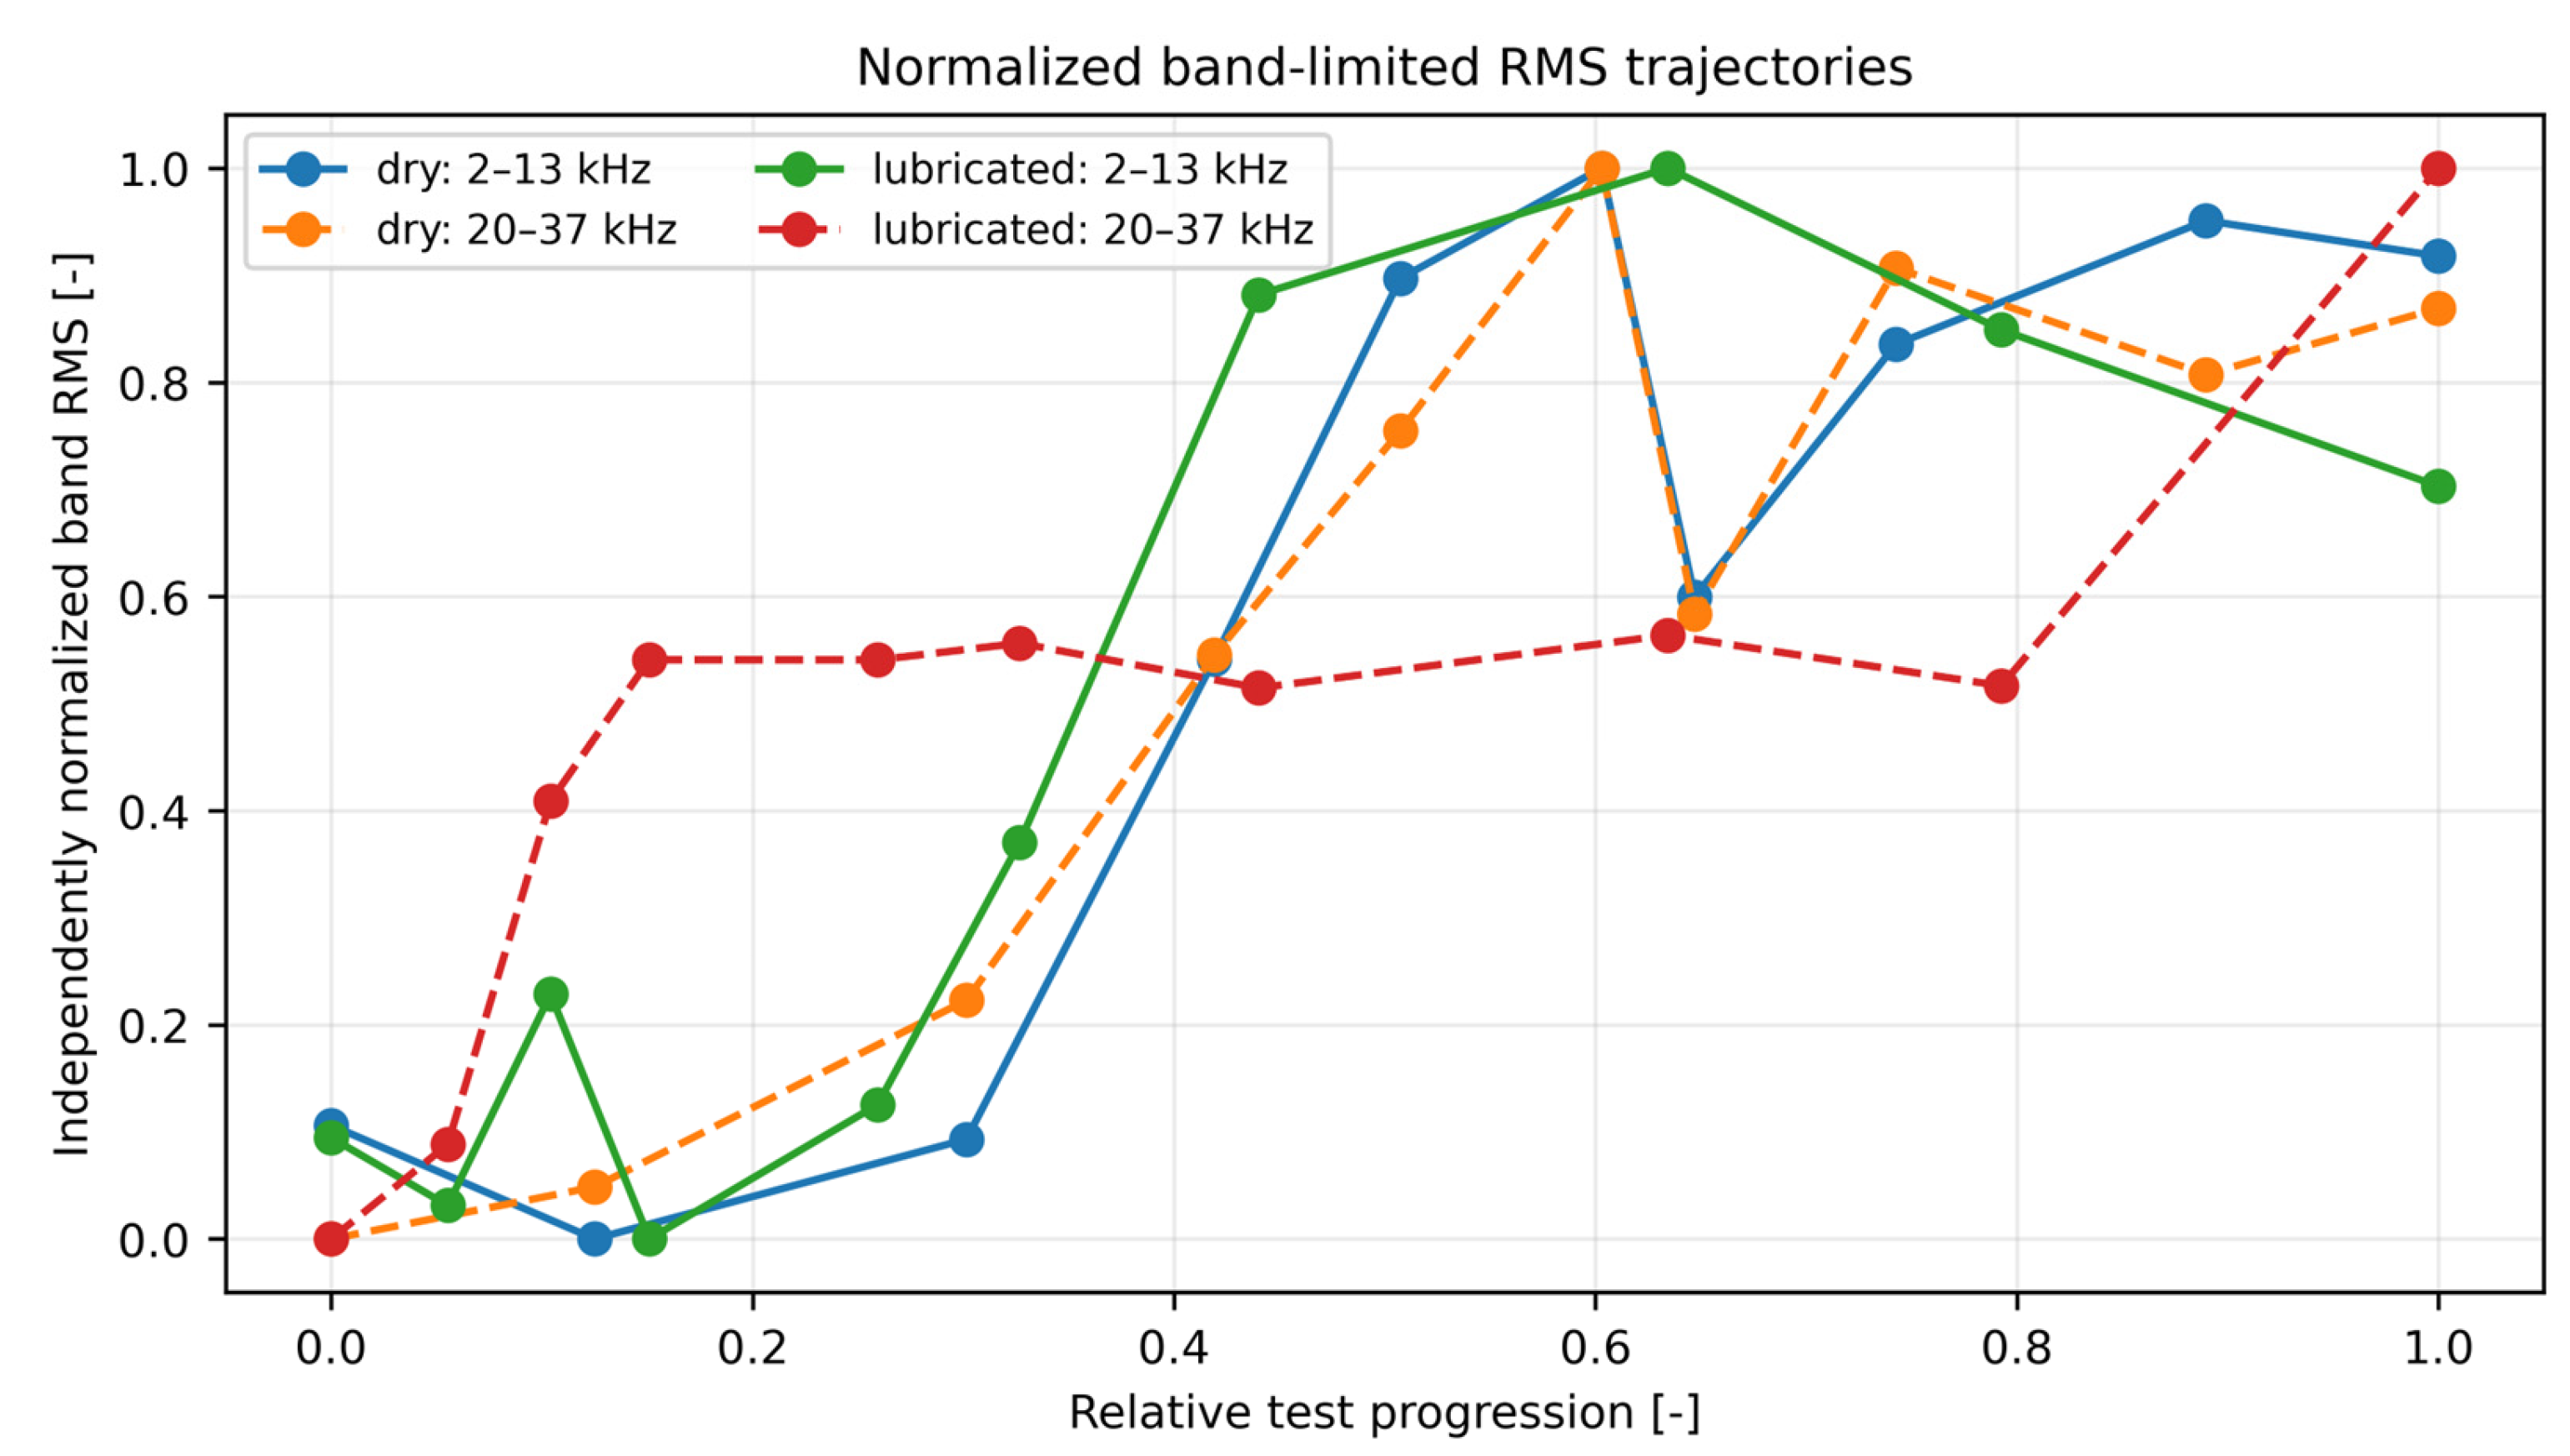
Figure 8.
Baseline Spearman correlations and non-speed parameter ranges. Ranges combine the applicable window, record-length, sideband-order, Welch-resolution, or local-bandwidth settings for each feature.
Figure 8.
Baseline Spearman correlations and non-speed parameter ranges. Ranges combine the applicable window, record-length, sideband-order, Welch-resolution, or local-bandwidth settings for each feature.
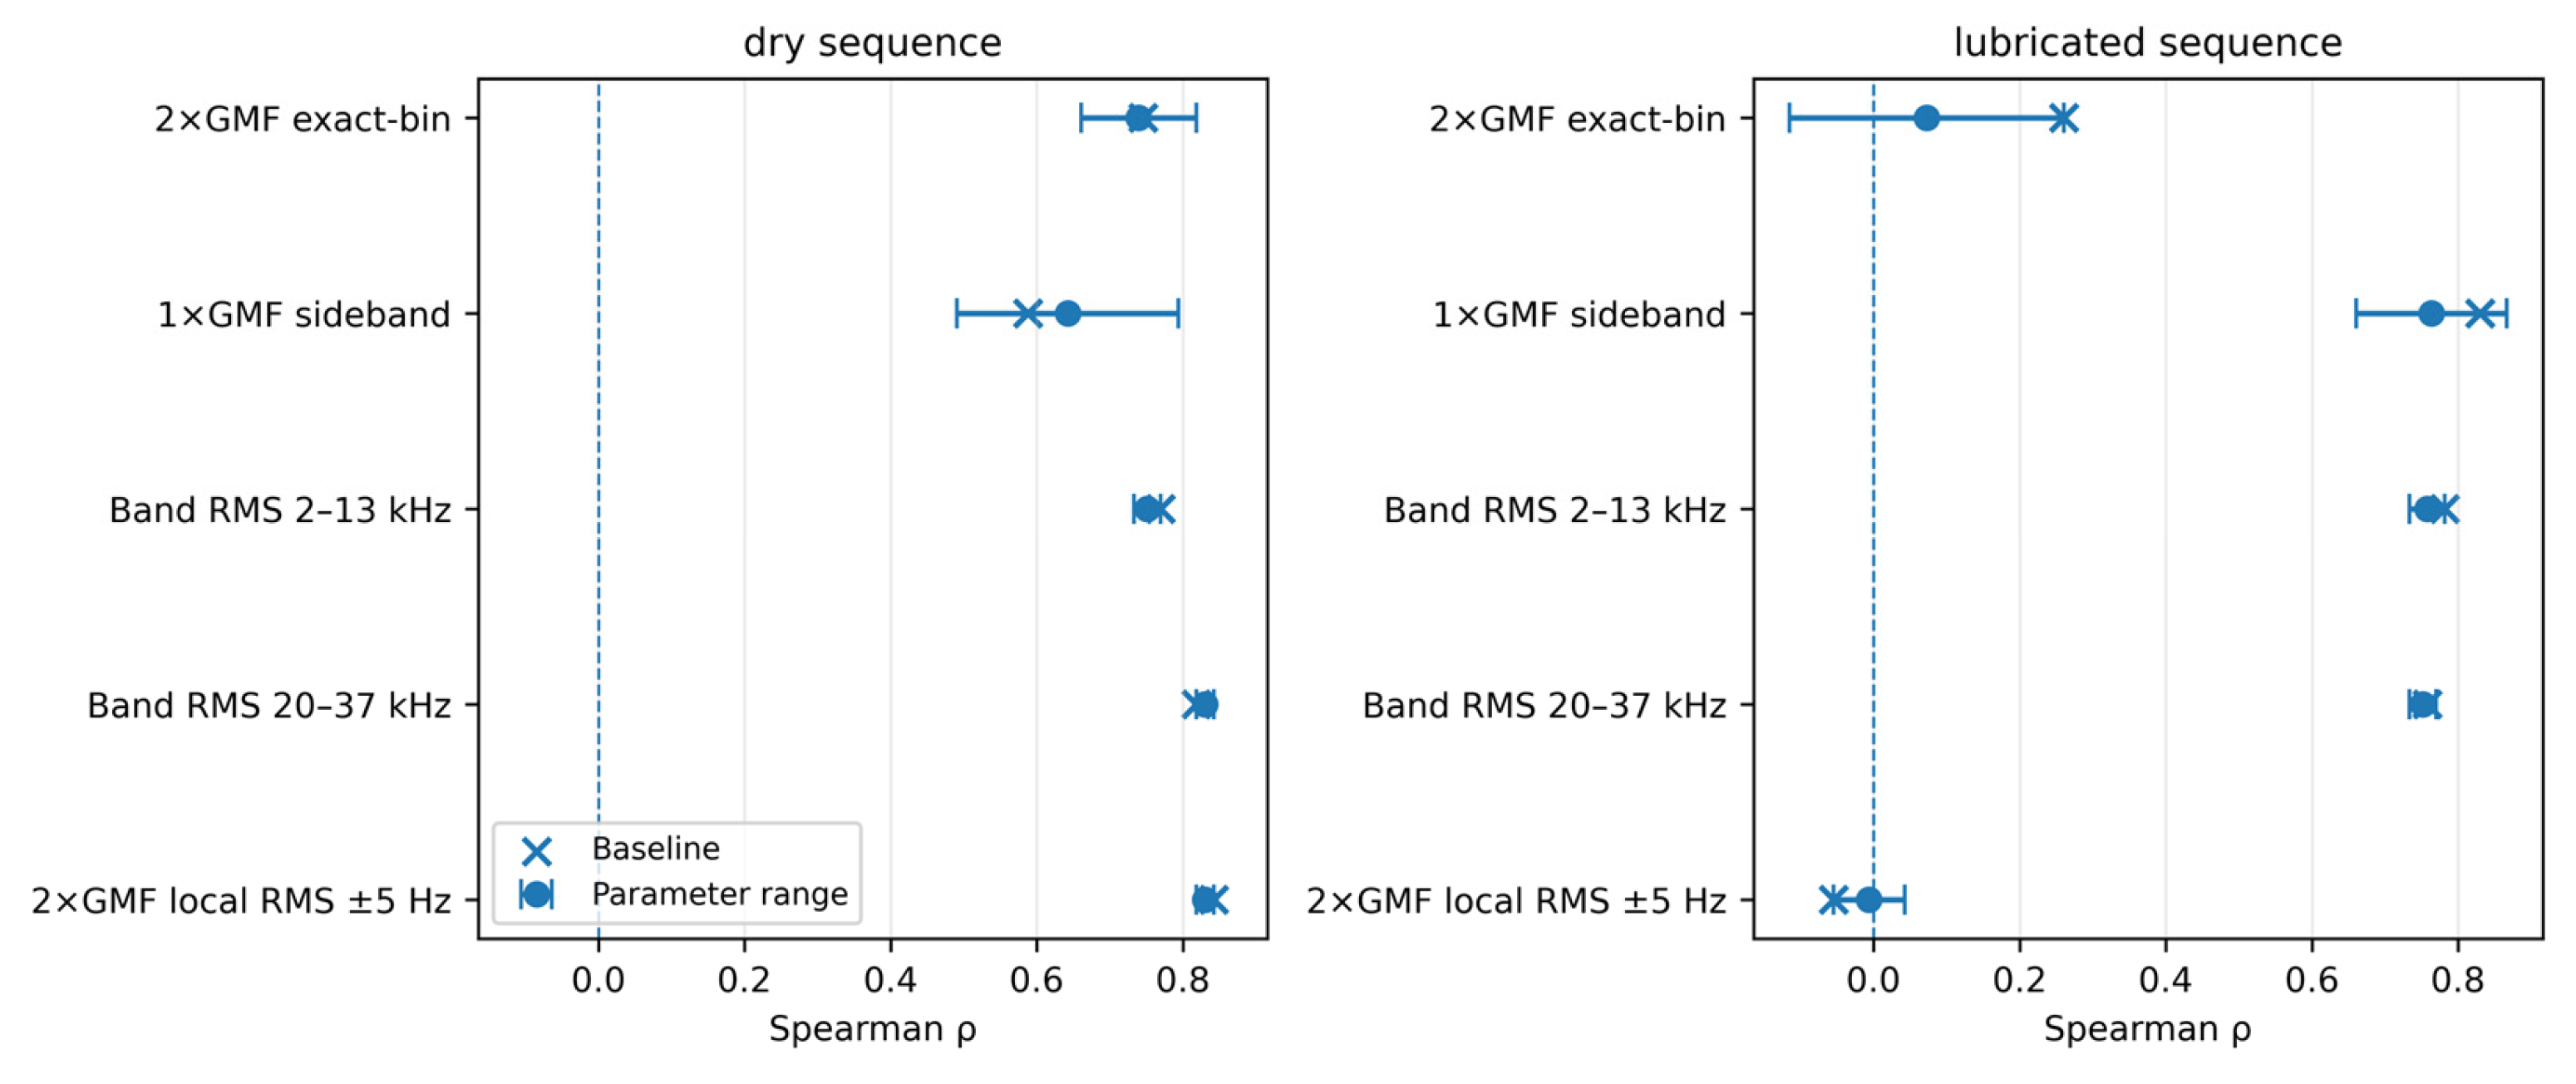
Figure 9.
Sensitivity of Spearman trend correlations to imposed speed-reference bias. Exact-bin harmonic and sideband measures are compared with the ±5 Hz second-harmonic local-band RMS.
Figure 9.
Sensitivity of Spearman trend correlations to imposed speed-reference bias. Exact-bin harmonic and sideband measures are compared with the ±5 Hz second-harmonic local-band RMS.
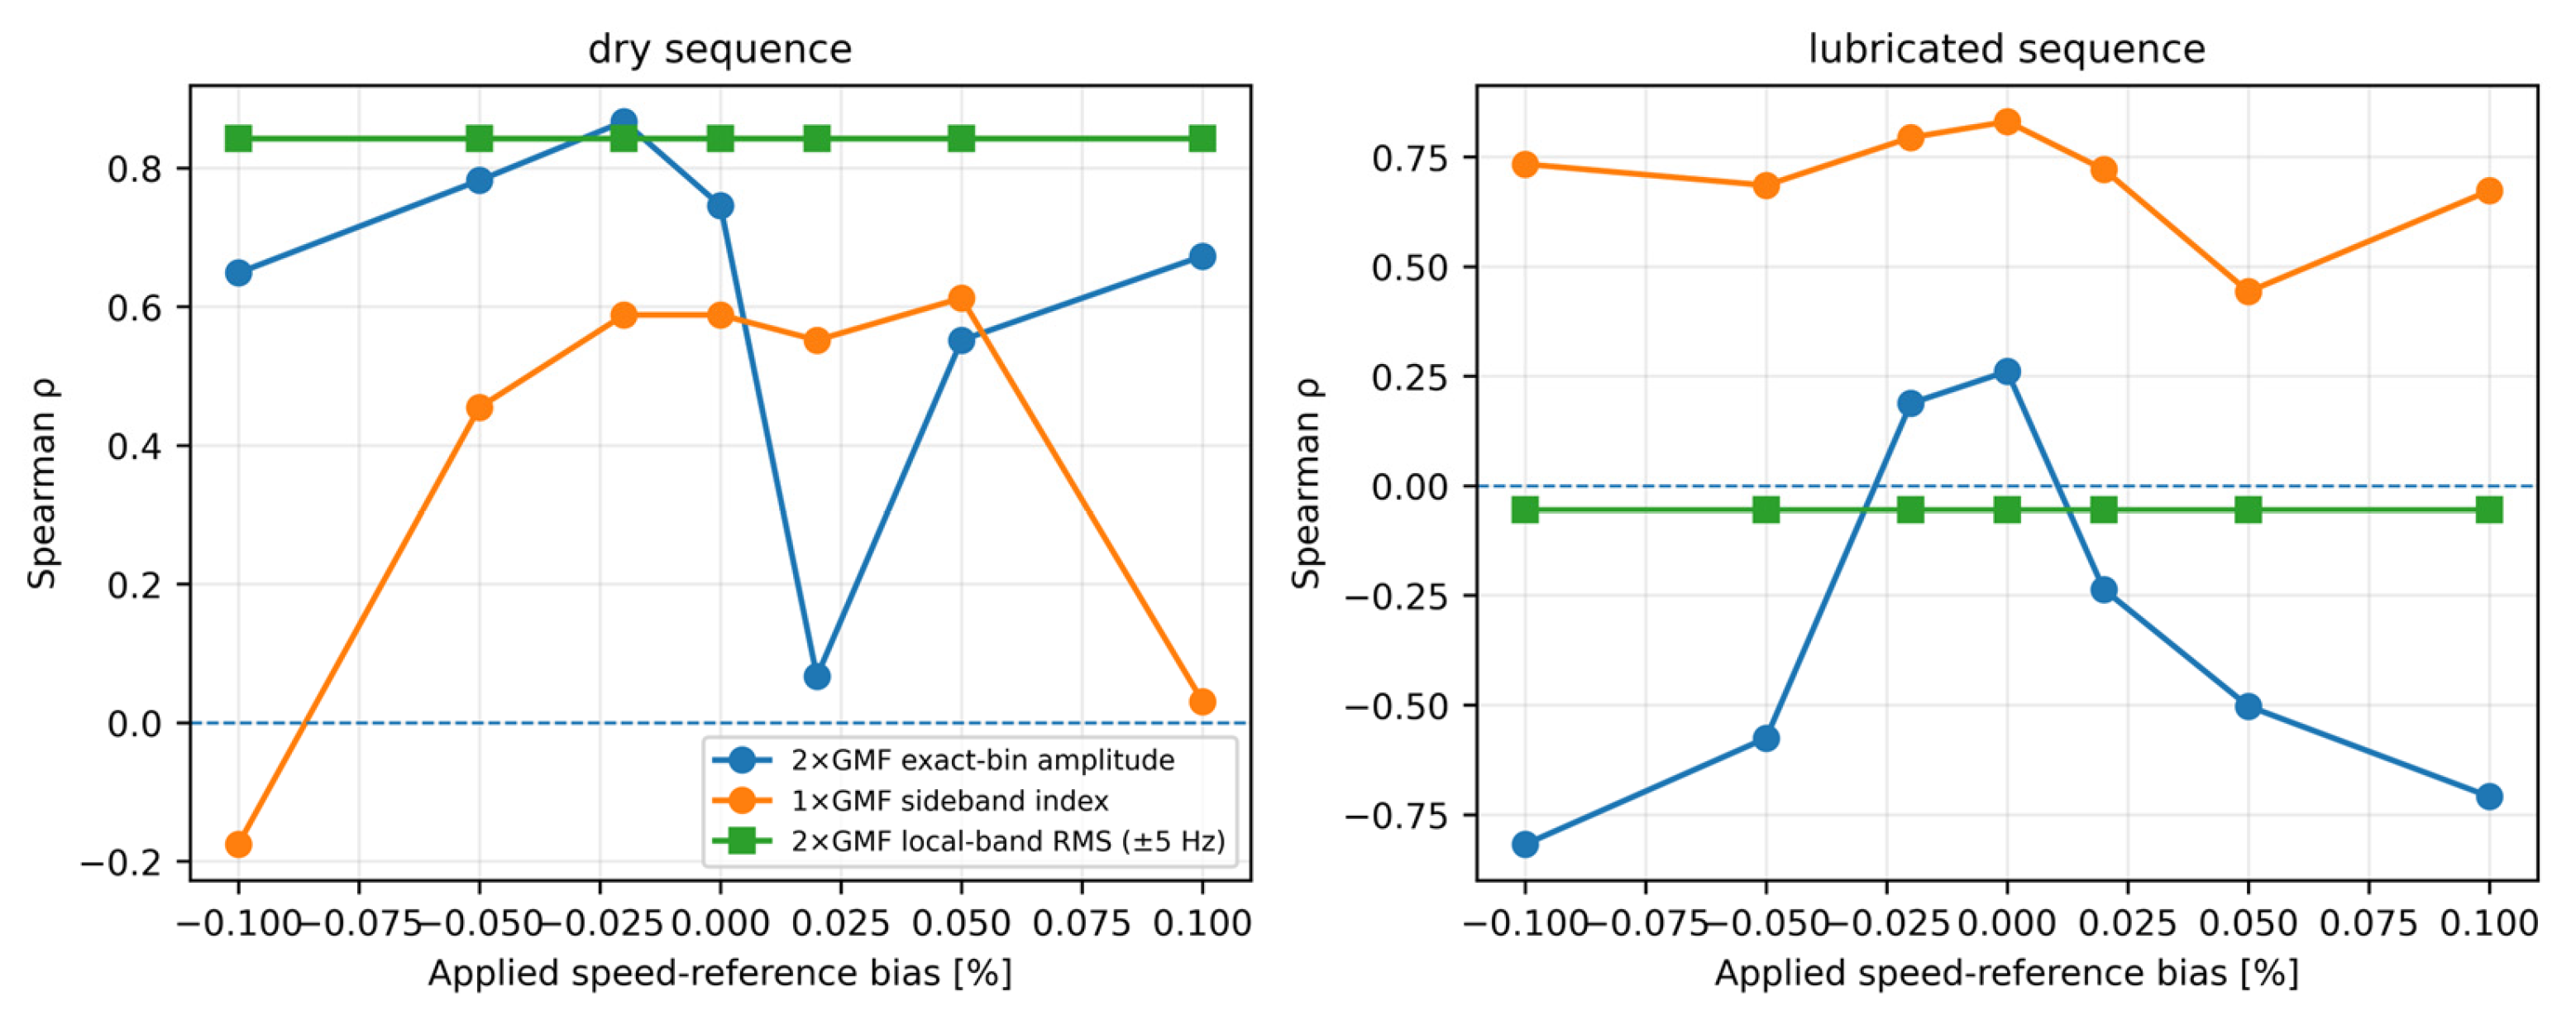
Figure 10.
Signed Spearman correlations of conventional band and sideband indicators compared with normalized first-order Hilbert-envelope spectrum indices.
Figure 10.
Signed Spearman correlations of conventional band and sideband indicators compared with normalized first-order Hilbert-envelope spectrum indices.
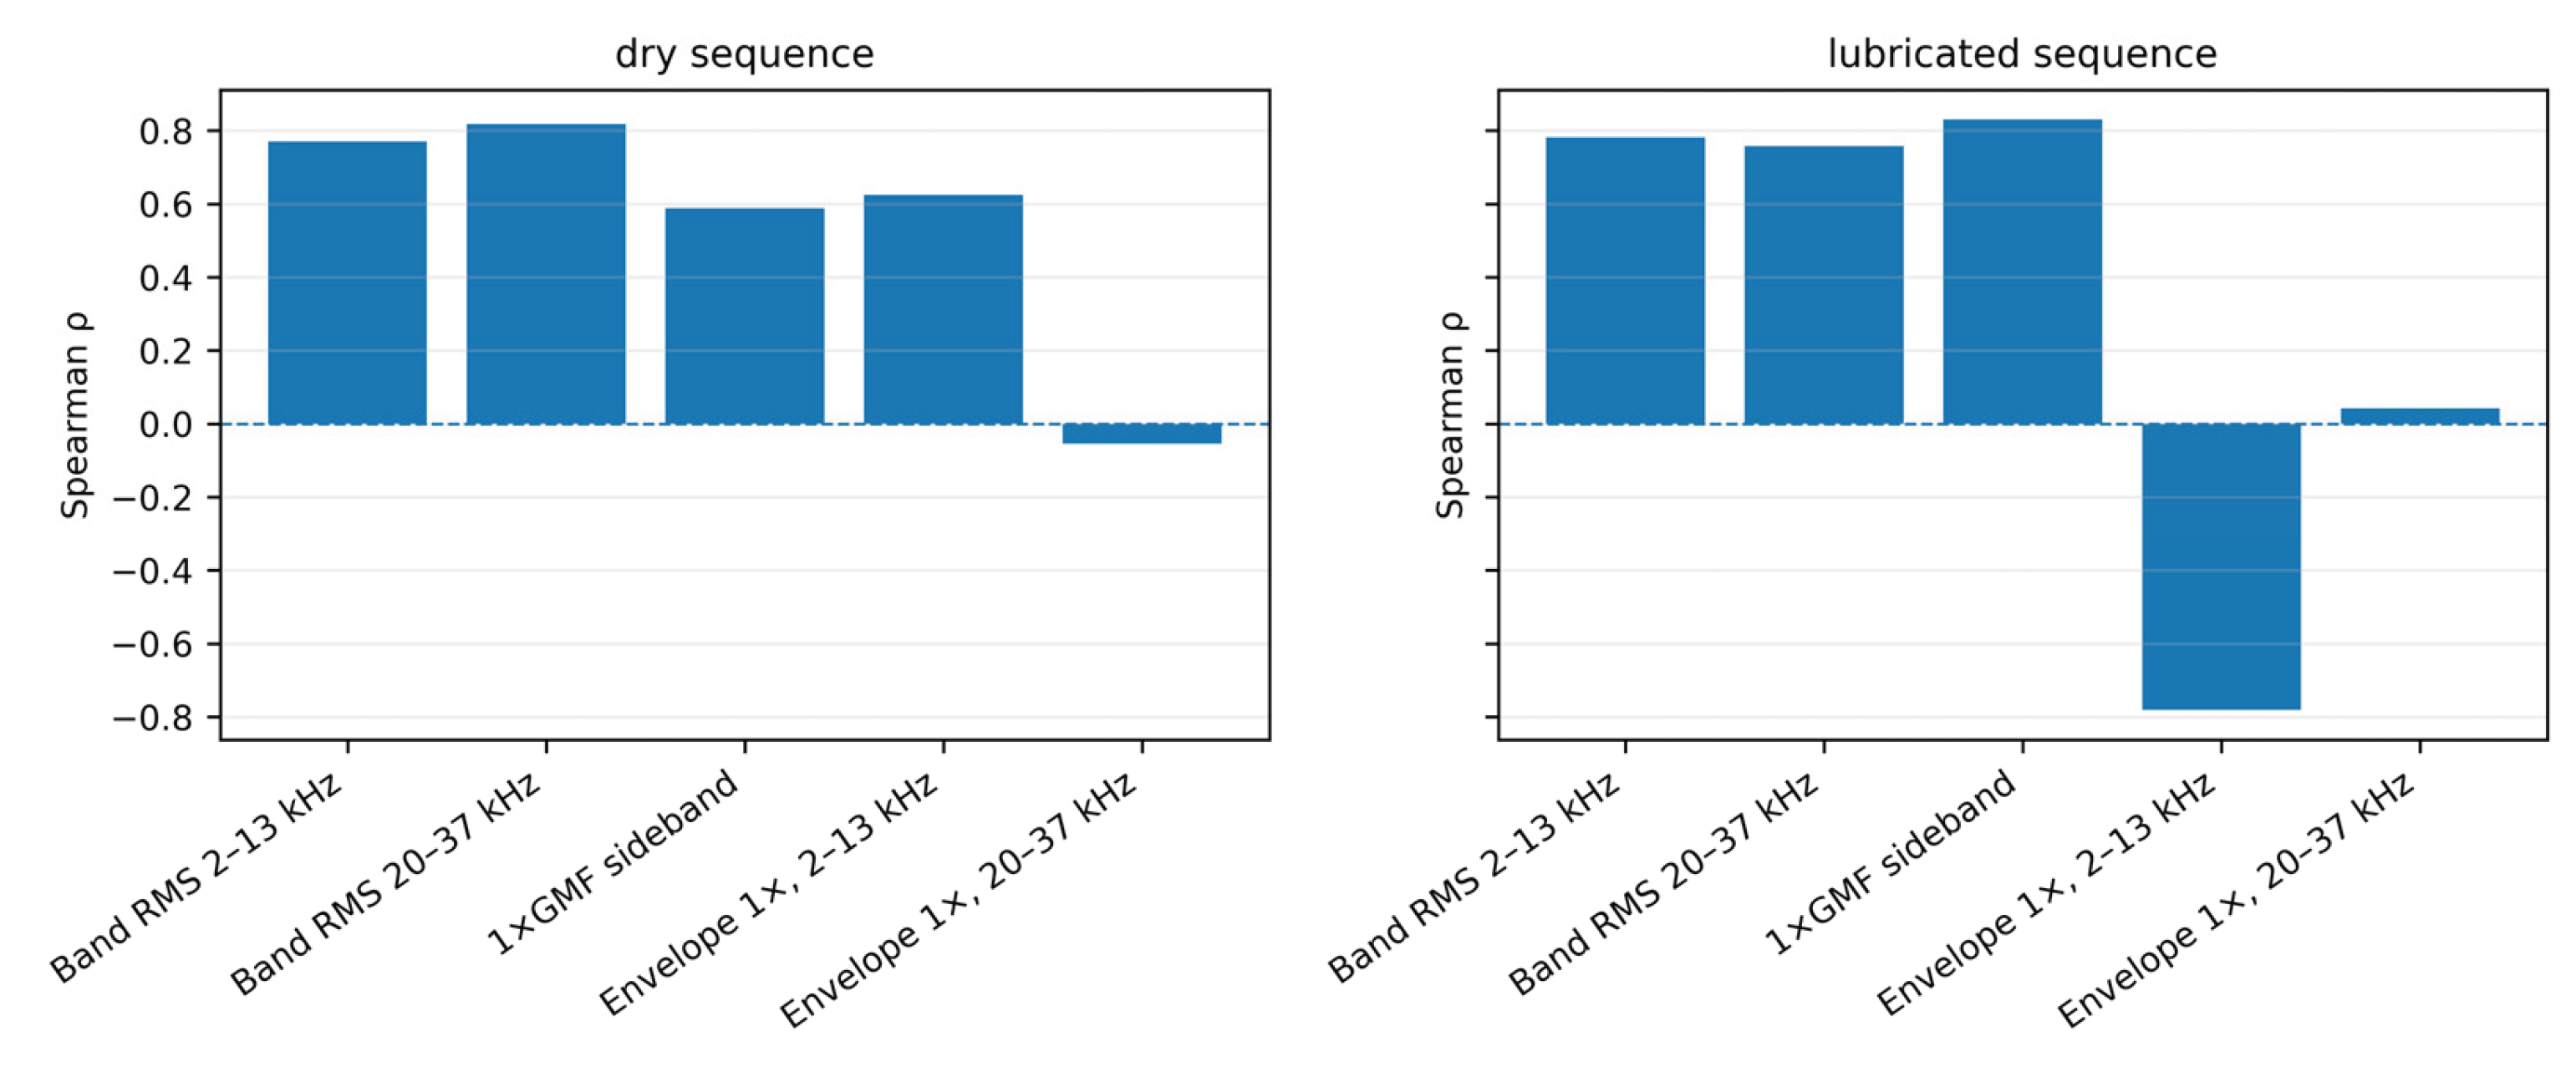
Table 7.
Practical feature-selection guidance for first-level vibration screening.
| Screening objective | Recommended indicator(s) | Interpretation caution |
|---|---|---|
| Rapid overall change check | RMS from both vibration channels | Sensitive to operating condition, sensor path, and broadband disturbances |
| Deterministic mesh-related change | Exact GMF amplitude plus ±5 Hz local harmonic-band RMS | Exact-bin amplitude requires accurate speed; local band is more frequency tolerant |
| Frequency-localized broadband change | Band-limited RMS in documented intervals | Bands are setup-specific and do not identify a wear mechanism by themselves |
| Mesh-order modulation | Normalized sideband index with documented K | Inspect the central harmonic and verify speed-reference sensitivity |
| Demodulation comparison | Envelope-spectrum shaft-order index | Trend direction can differ from total band energy |
| Minimum robust panel | RMS + local GMF-band RMS + one broad-band RMS + sideband index | Use agreement, robustness, and operating-condition stability; do not convert directly to wear depth |
| Escalation trigger | Contradictory, parameter-sensitive, or variable-duty trends | Apply order tracking, cyclostationary, transmission-error, tribological, or model-based analysis |
Disclaimer/Publisher’s Note: The statements, opinions and data contained in all publications are solely those of the individual author(s) and contributor(s) and not of MDPI and/or the editor(s). MDPI and/or the editor(s) disclaim responsibility for any injury to people or property resulting from any ideas, methods, instructions or products referred to in the content. |
© 2026 by the authors. Licensee MDPI, Basel, Switzerland. This article is an open access article distributed under the terms and conditions of the Creative Commons Attribution (CC BY) license (http://creativecommons.org/licenses/by/4.0/).
Copyright: This open access article is published under a Creative Commons CC BY 4.0 license, which permit the free download, distribution, and reuse, provided that the author and preprint are cited in any reuse.