

Submitted:
31 July 2026
Posted:
03 August 2026
You are already at the latest version
Abstract
Unavailability of inexpensive, reliable and smart health monitoring system for the soil and growing agricultural crop in developing countries like India is the major constraint for economic productivity and self-sufficiency in agro-products. To address such a burning issue, the present paper proposes an IoT based solar powered, inexpensive smart sensory system, for in situ and ex situ health monitoring of agricultural soil and growing crops. Here, the proposed system uses a single sensing mechanism to monitor the nitrate concentration in the roots of the crop as well as pH of soil. Additionally, the system has been integrated to measure all the ambient parameters detrimental to plant and soil health. The features including auto compensation of the measured parameters against temperature and humidity variations, auto calibration of the sensory systems adds smartness to the device. All the measurands were compared with the respective standard instruments and for all the measurements, readings were highly correlated with R2-value ranging from 0.98 to 0.99.The performance of the device was checked in the field and the results obtained were very satisfactory.
Keywords:
agricultural
; health
; IoT
; sensory system
; solar power
I. Introduction
Agricultural health has become one of the growing topics of interest and research throughout the world in the past few decades. India is the 7th largest country worldwide exporting $39 billion worth of agricultural products which has become the basis of Indian economy, potential source of livelihood of majority Indian population [1]. There is a huge demand for the agricultural sector to produce enough agricultural products to cater the rising Indian population. Various revolutions have brought the much needed increase in productivity of agro products but at certain costs. The rising population of our country has forced the producers to use excess of artificial chemicals to enhance the overall productivity.
Use of excess fertilizers directly or indirectly transmits them into the vegetables and fruits which affect the human health and are associated with chronic health problems, such as Alzheimer’s disease, diabetes mellitus etc.[2]. They further affect water bodies leading to eutrophication in fresh water, acidification of soil. The cumulative effect elevate the concentrations of major dominating pollutants like nitrates [3], ammonium [4] ions etc. in the growing agro plants, communicating a major threat to health of humankind.
It becomes much more imperative now for the end consumers as well as the producers to know the condition of agro plant’s and whether fertilizers are properly optimized or not. The overuse of these artificial inputs has immensely contributed in the ground water pollution, as well [5].
In the modern era with the advancement of technology in every field and plant’s health coming under scope of scrutiny, it becomes even more important to detect the plant’s health and adopt measures to optimize the production. It becomes further necessary to bring into notice the degrading quality of agro-products which are consumed by the end consumers as well as the producers. The list of dependence on agricultural sector by other sectors are expanding day by day. To name such a few are processed food industries, fast food chains, dairy industries, sugar industries, edible and non edible units, cold chains for veggies and fruits etc. [6].
The device proposed in this paper is empowered by many smart features and minimum number of sensors that include auto compensation of soil and plant’s parameters against the temperature and humidity variations, auto audio alarm generation in case of signal failure, auto calibration of the parameters and monitoring the system’s performance etc. Narrow artificial intelligence is the basis of smartness of the system. The device is very cost efficient, portable, solar powered, and is capable to transfer information to the remote places through IoT mechanism.
After surveying similar works in this field, to the best of our knowledge, our device is the first to implement the measurement of both nitrate concentration of plant roots and pH level of soil inexpensively using the same sensing mechanism as proposed in this paper. Integration of our device with important features for accurate agro health prediction separates our device from the rest in the market. Our device offers a lot in terms of implementing the use of renewable energy source i.e. solar power to recharge the batteries and sending data to cloud platform as well as android app using IoT for further analysis. Below mentioned points are the contributions of this paper:
- Fabrication, testing and evaluation of a simple and inexpensive optical sensing system
- Accurate demonstration of optical sensing system to monitor nitrate concentration of crop roots and pH level of soil
- Assemblage and integration of the inexpensive device with sensors, solar panels, rechargeable batteries and various electronic components in minimized physical area
- Developing flawless and advanced algorithm using all the measured parameters to predict future actions for plant and soil health care
- Discussion of all the on field results obtained from experimentations using the proposed device
The paper is arranged as follows: Section 2 looks at the related work on agro health monitoring, Section 3 deals with the materials required, system overview, methods and calibration procedure needed for each stage, Section 4 lists out the results from various experimentations for checking the device’s performance, Section 5 concludes the entire work and provides insights into the possible future works for improving the device.
II. Related Work
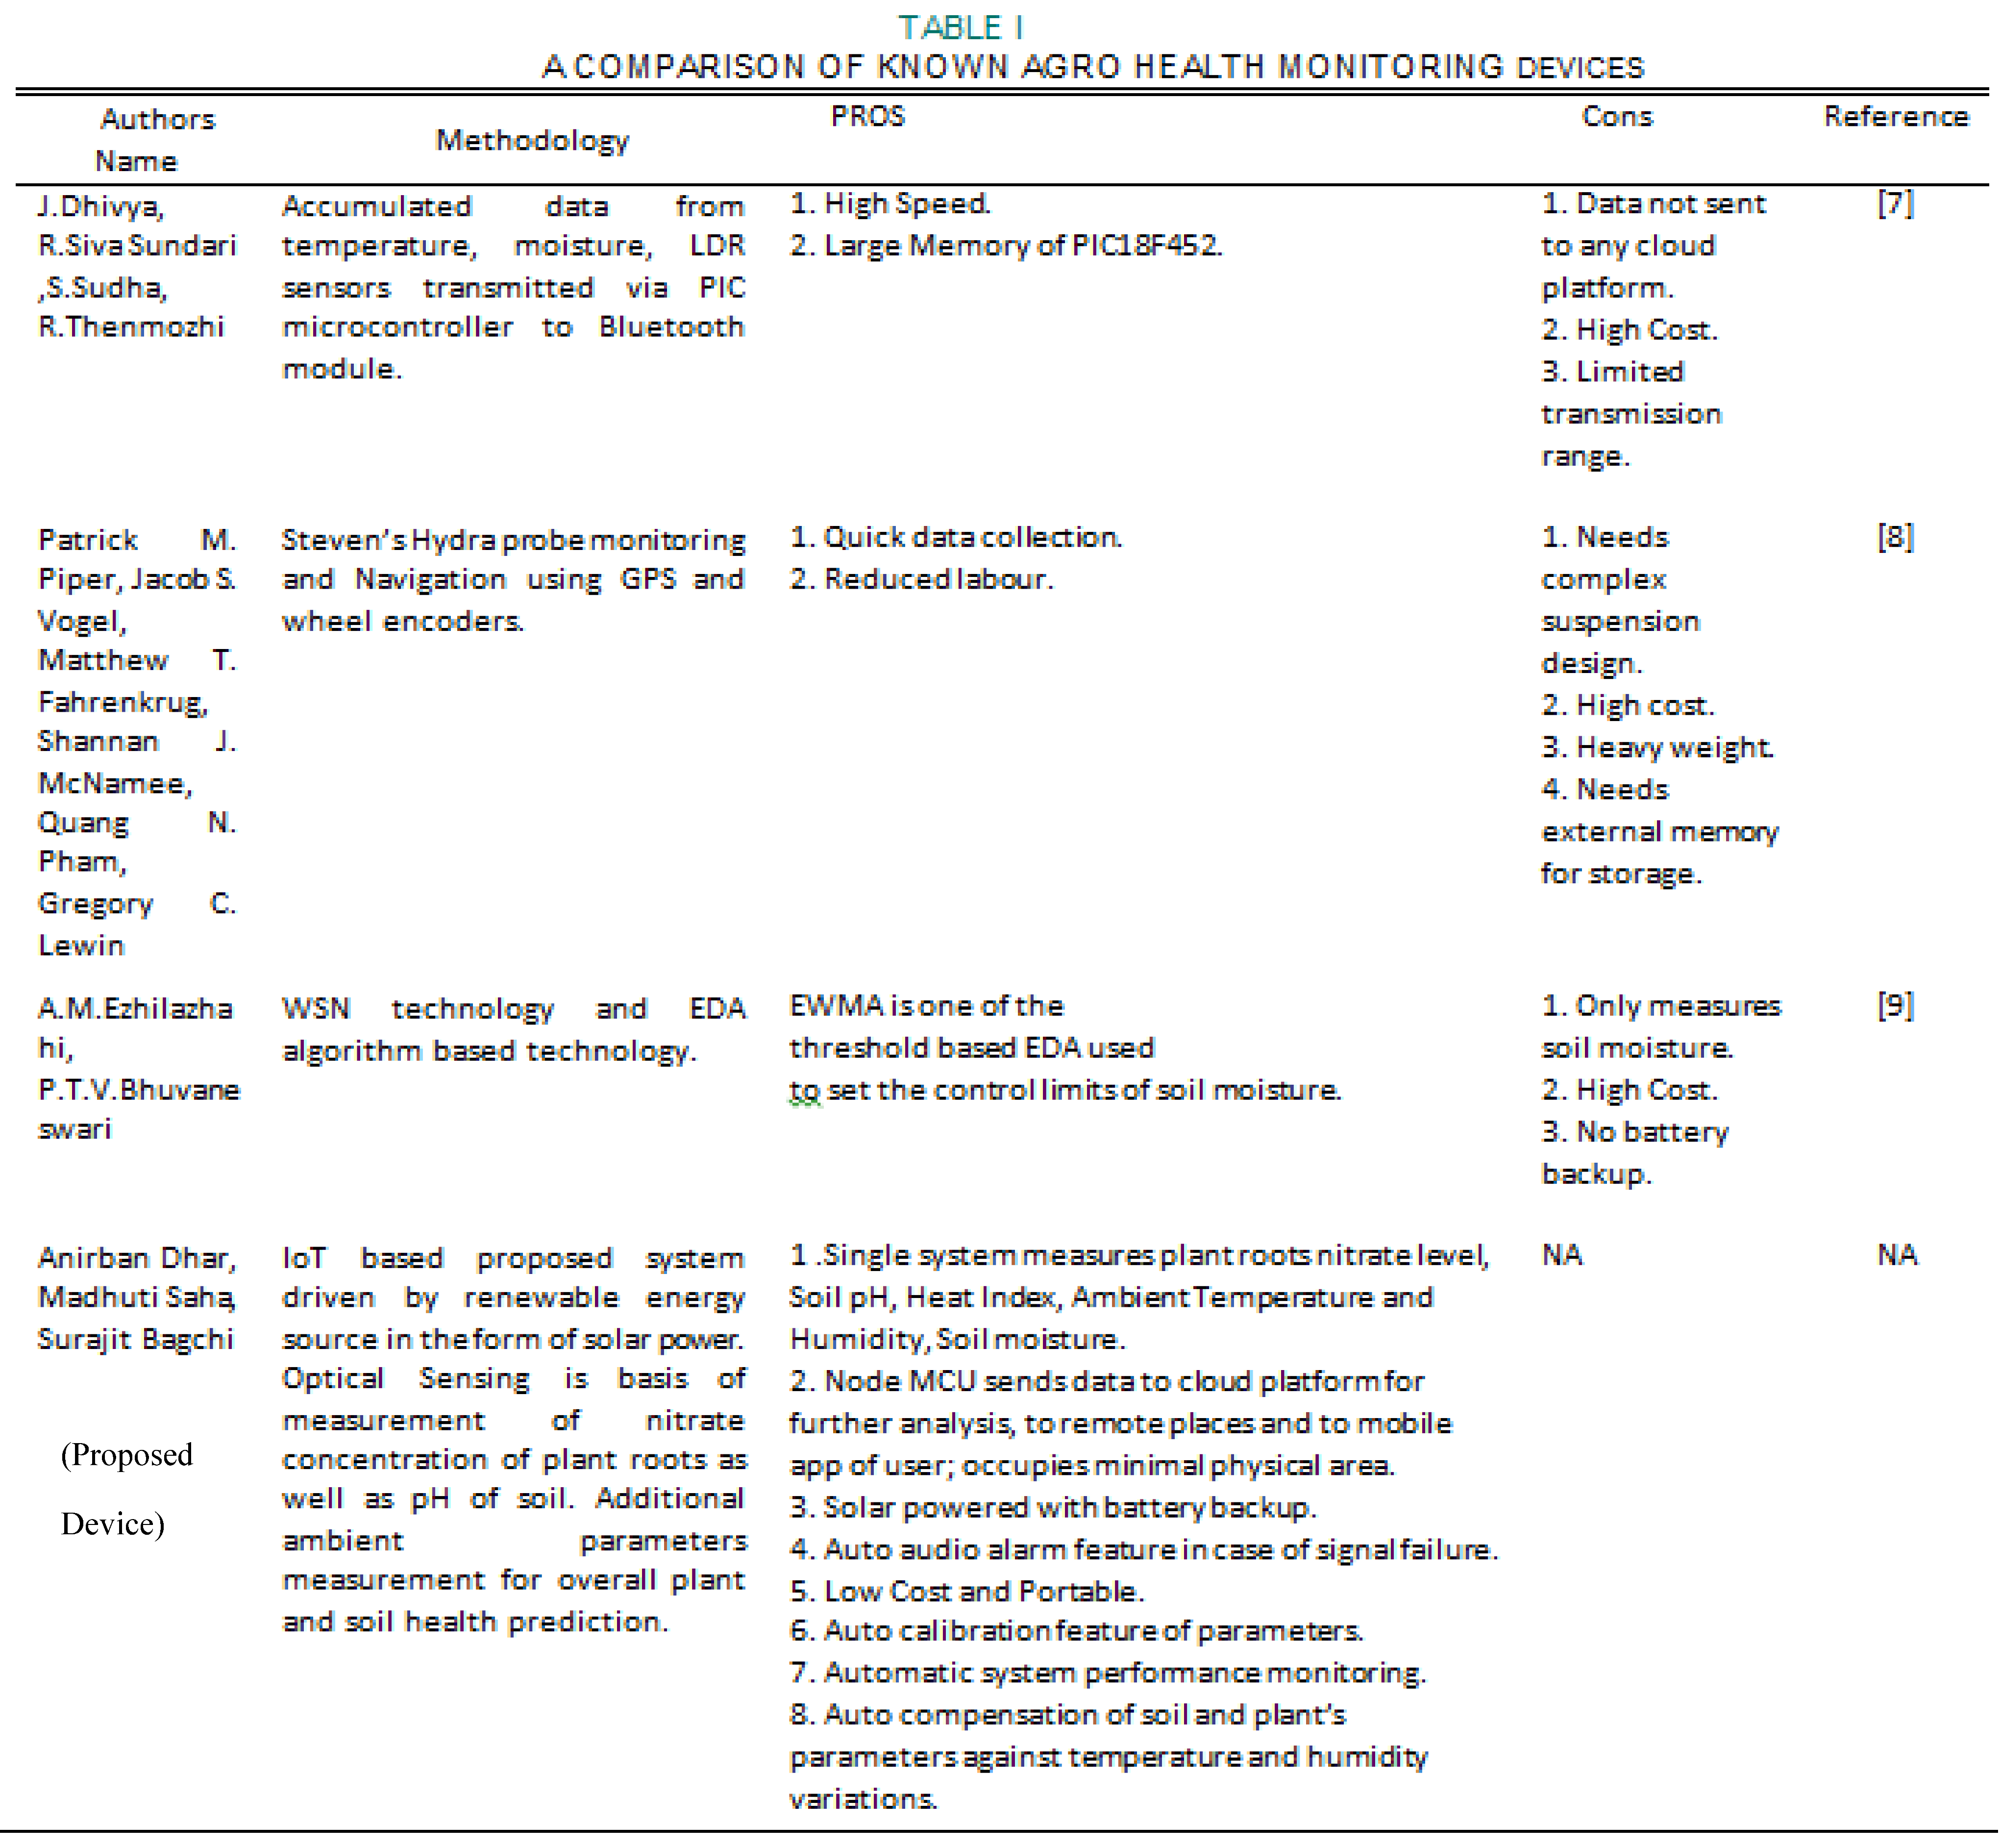
The situation has been addressed by many researchers proposing various technological mechanisms. J.Dhivya et al. [7] proposed a multiple sensor driven soil health monitoring system using a Programmable Intelligent Computer (PIC) microcontroller and bluetooth assembly with various sensors connected to the microcontroller. These sensors need to be kept in the soil for analysis. However the high cost and limited transmission range of accessibility restricts the device’s use. P.M. Piper et al. [8] developed an autonomous soil monitoring robot which uses Steven’s hydra probe. But it’s complex structure and high cost makes it less affordable as well as difficult to use. A.M.Ezhilazhahi et al. [9] developed a device operated by Raspberry Pi with the help of WSN technology and Estimation of Distribution (EDA) algorithm which sets up the threshold value of soil moisture. The system only measures soil moisture content with no battery recharging option and is very costly.
The major issues in the existing systems boils down to their high cost, making them far less affordable as well as their complex physical structure making their use very difficult to a layman. No battery backup option ,lesser data transmission range and no feature of transfering data wirelessly to remote places and local authority for proper future predicitve actions make their prototype implausible.The researchers in this domain have predicted agro health on the basis of measuring only a few parameters which is very impractical. Barely details are available about existing systems having any smart features like auto compensation of soil and plant’s parameters against temperature and humidity variations, auto audio alarm generation due to signal failure or auto calibration of parameters and system performance monitoring.
The device proposed in this paper is inexpensive,highly affordable,portable,simply structured, easy to use and have smart features that haven’t been found in the existing systems.The proposed solution transmits data wirelessly to remote locations and authority via IoT mechanism for appropriate future actions.Our device implements detection of both plant root’s nitrate concentration and soil pH level using the mechanism only proposed in this paper and uses minimum number of sensors to measure a variety of parameters to give an accurate insight into agro health.Further, the system is incorporated with renewable energy source in the form of solar power as well as battery backup option which are very much needed in places where farmers live. Table I summarises the comparative analysis of the related works with our proposed system.
III. Materials and Methods
This section lists out the chemicals used during the experimentations, components and testing equipment needed, a brief of experimental setup of proposed device, various parameter detection mechanisms and the calibrating of the sensing systems.
A. Materials Used:
-
Chemicals: The following laboratory grade chemicals were purchased from the local market:
- ➢
- Brucine Sulphate
- ➢
- Sulphuric Acid
- ➢
- Sodium Nitrate
-
Electrical And Electronics Component: The following electrical and electronics components were used in the proposed device:
- ➢
- Node MCU
- ➢
- 4:1 Multiplexer
- ➢
- Solar Panels (6V,150mA)
- ➢
- Rechargeable batteries(1600mAh, 1.2V)
- ➢
- Soil Moisture Sensor (Operating voltage: 3.3V~5V, Dual output mode)
- ➢
- DHT Sensor (Power Supply: 3.3~5.5V DC, Measurement Range Humidity 20-90%RHTemperature 0~50℃,)
- ➢
- Optical Sensing system comprising of RGB LED and LDR (RGB LED:ForwardVoltage(RGB):(2.0V,3.2V,3.2V),Luminosity(RGB):800mcd,4000mcd,900mcd;LDR: Dark resistance:1-20 Mohm, Maximum Operating Temperature: +800 °C (Approx.))
-
Testing Equipment: The following testing equipment were used:
- ➢
- Digital Multimeter (Sigma Instruments make, 3 ½ Digit LCD display)
- ➢
- UV-VIS Double Beam Spectrophotometer (LABPRO make, 320*240 Graphic LCD display, Wavelength Range:190-1100nm, Spectral Bandwidth:1nm)
- ➢
- Digital pH meter (Systronics make, 3 ½ Digit Red LED 7 segment display)
B. Experimental Setup of the Proposed Device
The proposed solar panel driven device supports 3 distinct sensing setups measuring 6 distinct parameters electrically coupled to a Node MCU microcontroller with one analog input through one 4:1 multiplexer as shown in the block diagram in Figure 1. The sensing arrangement has an optical sensing system to efficiently compute pH-value of the soil extract as well as the nitrate level of plant root extract, a DHT sensor to precisely measure ambient temperature, humidity and heat index, a soil moisture sensor to measure the moisture content of the soil. The overall setup of the proposed device is shown in Figure 2(a) and 2(b). Figure 3 shows the detailed internal circuitry of the proposed device. The use of a white light source has increased the sensitivity of LDR in optical sensing system.
C. Soil Moisture Detection Mechanism
The sensing part comprises of a pair of electrodes that reliably detects the possible presence of water in the fertile soil. On the basis of resistance offered, the soil moisture content is accurately measured. More electric current passes through the moist or wet soil path between the electrode pair. A dry fertile soil offers more resistance due to presence of less amount of water in the soil [10]. The sensor probes made of Nickel are coated with immersion Gold to prevent it from oxidation and increase the longevity as well [11].
D. Plant Roots Nitrate Detection Mechanism
Plant root nitrate detection is accomplished with the help of the optical sensing system that typically comprises of an optical transceiver, using a RGB LED and a LDR assemblage in a compact manner.
Following steps describes the sensing mechanism.
Steps:
- Various plant root samples were taken. Plant root extract was made and put in a micro centrifuge tube.
- 100 microliters of Brucine Sulphate (a complex compound) and 2mL of sulphuric acid were added in the sample. A yellow coloured solution was formed. The yellow colour is due to a complex compound formation [12].
- The micro centrifuge tube was kept in a holder and then it was illuminated using a white light source as shown in Figure 4(a) and 4(b).
- The sensing system was kept over the illuminated sample as shown in Figure 4(c) and 4(d).
- A change in color was sensed by the optical sensing system. The intensity of the colour change of the sample is proportional to the nitrate level of the plant root.
E. Soil pH Detection Mechanism
The same optical sensing system used for measuring nitrate levels in the growing or cultivated plants, is used here as well to detect the soil pH. Following steps describes the sensing mechanism.
Steps:
- Various soil samples were collected.
- Individual soil extracts were made, and the residues separated.
- A set of pH papers were taken and dipped into the each individual soil extracts.
F. Ambient Temperature and Humidity Detection
A DHT sensor is opted to sense the ambient temperature, humidity, heat index of any local area. Temperature is measured by a NTC thermistor embedded [13] inside it and humidity is measured by a capacitive based humidity [13] sensing element. Heat index is calculated using the values of humidity and temperature [14].
G. Calibration of Nitrate Sensing System
Seven different standardized samples with known concentration (mg/mL) of Sodium Nitrate salt were prepared. According to the procedure, discussed in the nitrate detection mechanism in the plant’s root, Brucine Sulphate and Sulphuric acid solutions were added in the standard nitrate samples. The colour change was observed afterwards. The proposed sensing system detects the colour change to provide the appropriate electrical signals. Thereafter, the sample was studied in a UV-VIS Double Beam Spectrophotometer, used as a standard instrument, at 420 nm and the respective optical readings were obtained in the form of optical density. The readings from the spectrophotometer and the proposed sensing system were plotted to get a calibration curve as shown in Figure 6 using MS Excel, version 10. The calibration curve shows highly linear value with R2-value of 0.9886.
H. Calibration of pH Sensing System
The proposed pH-sensing system was calibrated following the 3-point calibration procedure. Three standard buffer solutions with pH values 4, 7 and 9 were prepared. All the 3 buffer solutions were tested for the standard pH meter and the proposed sensing system at 27 °C. The 3 data pairs were plotted to get a calibration curve as shown in Figure 7 using MS Excel, version 10. The calibration curve shows highly linear value with R2 -value of 0.9824.
IV. Results and Discussions
This section evaluates the performance of the device in real sampling locations, with results presented below. The proposed device investigated all the performance parameters to check the overall working and validate it’s on field application.
A. Device’s Performance
The system could automatically calibrate every time when it was started and has programmed to take the readings after every 1 second. After a certain time interval of standby, the battery automatically gets disconnected from the circuit to reduce the power consumption of the system. The power gating algorithm was successfully implemented. With the completion of the calibration process successfully the samples were checked and tested. The results obtained were satisfactory.
B. Soil Moisture Detection
The soil moisture sensor is compatible with and self calibrated according to the NodeMCU environment as claimed by the manufacturer. The sensor yielded varying results for dry and wet soil indicating the proper moisture content of the soil [10]. We have performed the experiments majorly in Dhapa, Kolkata, West Bengal where the soil is predominantly alluvial type [15] with bulk density of the soil top layer varying in the range 1.65-1.88(t/m3) [16]. We have studied the average temperatures for 5 consecutive days in morning, afternoon and evening in the month of July and noted the readings as 32.4oC, 35.9oC, 26.5oC respectively. We barely found any effect of day temperature variations on the sensor readings and it eventually gave consistent readings of soil moisture content.
C. Nitrate Detection
Various nitrate sample solutions of plant roots were taken and then the nitrate concentration of those solutions were measured. 5 extracted solutions for 5 different roots were prepared with addition of appropriate chemicals and the colour change in each of the sample was measured with standard spectrophotometer and the proposed device. The data pairs were plotted as shown in Figure 8 using MS Excel, version 10. Satisfactory outcomes were obtained with R2 value of 0.9915. The intensity of yellow colour of the sample shows nitrate level of plant root.
D. pH Detection
For pH detection 5 different standard solutions of soil samples were taken and then the pH of those solutions were measured. The pH sensing system was calibrated by taking some soil extract samples. The pH of the extract was measured by a standardized pH meter and the proposed device. The obtained data pairs were plotted using MS Excel, version 10 as shown in Figure 9. The results obtained were very highly accurate and linear with R2 value of 0.9899. The reading obtained from the proposed device by analysing the colour of pH paper completely matched with pH meter reading. The reason of yellowness of green leaves of a plant was also explored by going through the literature study [17]. The reason found was the deficiency of iron content in the plant which in turn occurs due to lower pH value of the soil. This attribute can be added to the device to detect the iron deficiency of the plant. We tried to simulate the effect of seasonal variations or sunlight variations during various times of a day on the soil pH. Any changes in sunlight intensity or seasonal changes will alter the soil moisture content which in turn will affect the soil pH. We dissolved known volume of water and known weight of soil. The residue portion was separated using filter paper. The pH values of liquid portion at different soil molar concentrations (mg/mL) were plotted as shown in Figure 10. We noticed a non linear relation. Data as in Figure 10 will make the local authority or farmer aware so that they can take necessary control action to improve the soil pH.
E. Ambient Temperature, Humidity and Heat Index Measurement
DHT sensor was used to measure ambient temperature, humidity and heat index .The sensor is very much compatible and calibrated with the NodeMCU environment as claimed by the manufacturer. The results obtained were perfectly alright. It is known that there is a dependence of pH value on ambient temperature [18]. By measuring the ambient temperature the proposed device was able to compensate the pH value for any ambient temperature changes.
F. IoT Operation
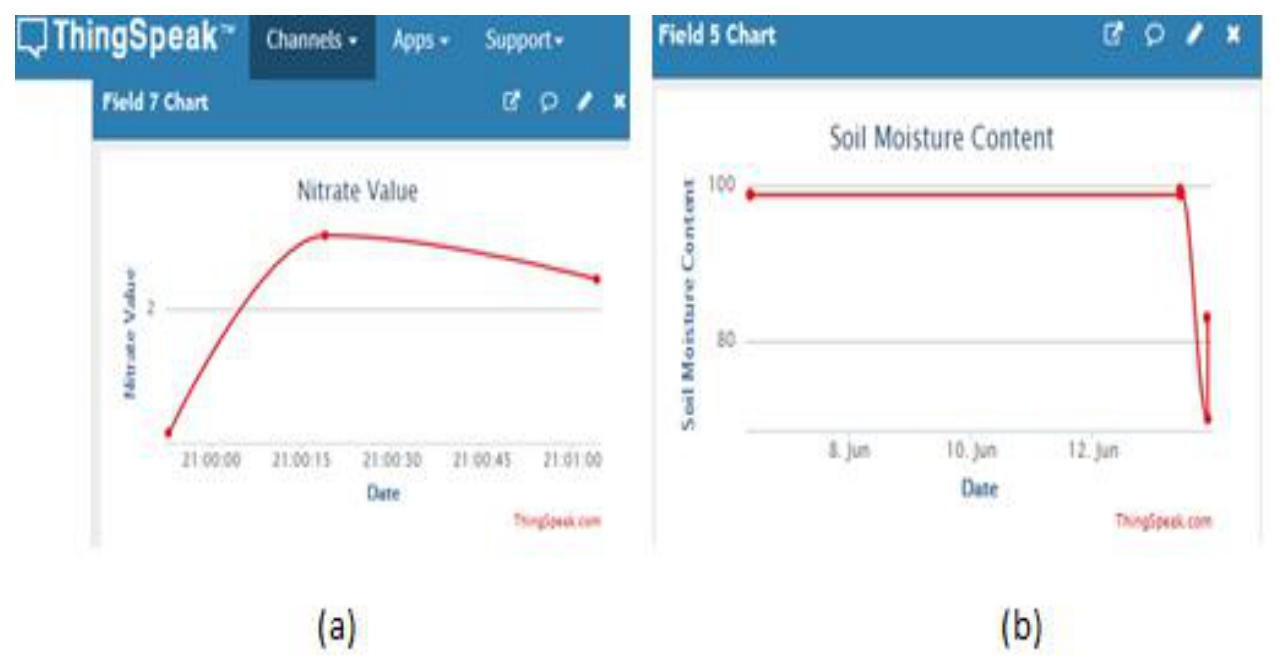
The data acquired by the NodeMCU from the proposed sensing system were then sent to a cloud platform called Thingspeak as shown in Figure 11(a) and 11(b). The graphs show the patterns of the measured parameters taken over a time interval indicate the feature of remote monitoring of the soil and plant parameters of the system.
G. Solar Panel Operation
The proposed sensing system has auto checking feature of backup battery voltage powered by solar panel. When the battery voltage goes down below a threshold voltage (4V) then an audio alarm is initiated to notify the user. The auto monitoring of backup voltage source was successful. We have used 4 batteries and if the voltage provided by batteries goes below 4V then system gets automatically connected to solar panels for recharging. Assuming that the load is connected to source continuously,
Energy consumption of the entire system,
((1.2V*4)-4V) * (1600mAh) =1.28W-h
After experimentations we have seen that the maximum current drawn by the system is almost 0.1053A.
Time for complete discharge of batteries till 4V,
1.28W-h/ (0.1053A*((1.2V*4)-4V)) = 15minutes and 11 seconds
V. Conclusion and Future Work
An IoT based Solar Powered, Smart Health Monitoring System for Soil and Growing Agro-plants has been successfully implemented. The optical sensing system in the proposed device performed satisfactorily with respect to successfully measure nitrate levels of plant roots extract and pH level of soil. The R2-values obtained from the calibration curves for nitrate and pH were 0.9886 and 0.982 respectively indicating the successful implementation and reliable functioning of the device. The other additional parameters were measured accurately and reliably with proposed system as well. The device can be modified with the inclusion of a feature to monitor the organic or inorganic nature of soil. Further the device can help increase the productivity enhanced by detecting the N-P-K ratio to analyse the overall macro nutrients balance.
Acknowledgments
The authors are grateful to Mr. Anupam Biswas of Mechanical department, Dr. Abhishek Mukherjee of Biotechnology department and Mr. Saumitra Kumar Mandal of Chemistry department for sustained assistance in the fabrication of the optical sensing system, nitrate testing of plants and soil pH testing respectively.
References
- “India’s Agricultural Exports Climb to Record High,” USDA, USA, Aug., 2014,pp 1. Available online: https://www.fas.usda.gov/sites/default/files/2015-02/india_iatr_august_2014.pdf (accessed on 13 April 2021).
- B. Khiatah,The Health Impacts of Chemical Fertilisers,Amos Institute. Available online: https://amosinstitute.com/blog/the-health-impacts-of-chemical-fertilizers/ (accessed on 18 July 2020).
- P. Smith, What are some of environmental effects of phosphate fertilizers?, Quora,Sept. 2019. Available online: https://www.quora.com/What-are-some-of-the-environmental-effects-of-phosphate-fertilizers (accessed on 28 July 2020).
- K. Caines, The effect of Household Ammonia on Plant Growth, SFGATE, Dec. 2018. Available online: https://homeguides.sfgate.com/effect-household-ammonia-plant-growth-102287.html#:~:text=Upon%20application%2C%20diluted%20ammonia%20makes,getting%20the%20nutrients%20they%20need (accessed on 28 July 2020).
- Berg, M.; Meehan, M.; T. Scherer,Environmental Implications of Excess Fertilizer and Manure on Water Quality,North Dakota State University,Oct. 2017. Available online: https://www.ag.ndsu.edu/publications/environment-natural-resources/environmental-implications-of-excess-fertilizer-and-manure-on-water-quality/nm1281.pdf (accessed on 29 July 2020).
- M. Dash,Which industries depend on agricultural products?,Quora, June 4,2017. Available online: https://www.quora.com/Which-industries-depend-on-agricultural-products (accessed on 18 July 2020).
- Dhivya, J.; SivaSundari, R.; Sudha, S.; Thenmozhi, R. Smart sensor based soil monitoring system. IJAREEIE 2016, vol.5(no.4), 1–6. Available online: https://www.ijareeie.com/upload/2016/april/78_Smart.pdf (accessed on Apr.14 2021). [CrossRef]
- Piper, P. M.; Vogel, J. S.; Fahrenkrug, M. T.; McNamee, S. J.; Pham, Q. N.; Lewin, G. C. Designing an autonomous soil monitoring robot. 2015 Systems and Information Engineering Design Symposium, Charlottesville, VA, USA, 2015; pp. 137–141. [Google Scholar] [CrossRef]
- Ezhilazhahi, M.; Bhuvaneswari, P. T. V. IoT enabled plant soil moisture monitoring using wireless sensor networks; ICSSS: Chennai, India, 2017; pp. 345–349. [Google Scholar] [CrossRef]
- MisterBotBreak. How to use a Soil Moisture Sensor,Arduino Project Hub,Mar.21,2019. Available online: https://create.arduino.cc/projecthub/MisterBotBreak/how-to-use-a-soil-moisture-sensor-ce769b (accessed on 18 July 2020).
- Soil Moisture Sensor Module,Components101,Apr.16,2020. Available online: https://components101.com/modules/soil-moisture-sensor-module (accessed on 17 February 2021).
- McComas, J.G. Determination of nitrate by anion exchange with ultraviolet detection. M.S. thesis, Dept. Chem.,Iowa State Univ., Ames,Iowa, 1976. Available online: https://www.osti.gov/servlets/purl/7349431/ (accessed on 27 September 2020).
- “Arduino-Humidity Sensor,”. Available online: https://www.tutorialspoint.com/arduino/arduino_humidity_sensor.htm#:~:text=The%20DHT%2D22%20(also%20named,this%20sensor%20with%20Arduino%20UNO (accessed on 18 July 2020).
- Sunbeam, M.D.N. What is the heat index and how is it calculated?,Quora,Jul.2016. 29 July 2020. Available online: https://www.quora.com/What-is-the-heat-index-and-how-is-it-calculated.
- Kolkata Municipal Corporation. Ground Water Information Booklet. Available online: https://libraryguides.vu.edu.au/ieeereferencing/webbaseddocument (accessed on Apr. 13 2021).
- “Geotechnical Investigations and Site Classification of Kolkata”,Kolkata,West Bengal,India. Available online: http://wbdmd.gov.in/writereaddata/Chapter-6A.pdf.
- “Why plant leaves turn yellow and how to fix them”. Available online: https://www.pennington.com/all-products/fertilizer/resources/why-plant-leaves-turn-yellow-and-how-to-fix-them (accessed on 18 July 2020).
- westlabblogcanada,How does temperature affect pH,westlab,Nov.15,2017. Available online: https://www.westlab.com/blog/2017/11/15/how-does-temperature-affect-ph#:~:text=*pH%20decreases%20with%20increase%20in,hydrogen%20ions%20over%20hydroxide%20ions.&text=At%20100%C2%B0C%2C%20a,scale%20at%20this%20higher%20temperature (accessed on 18 July 2020).
Figure 1.
Block Diagram of Experimental Setup.
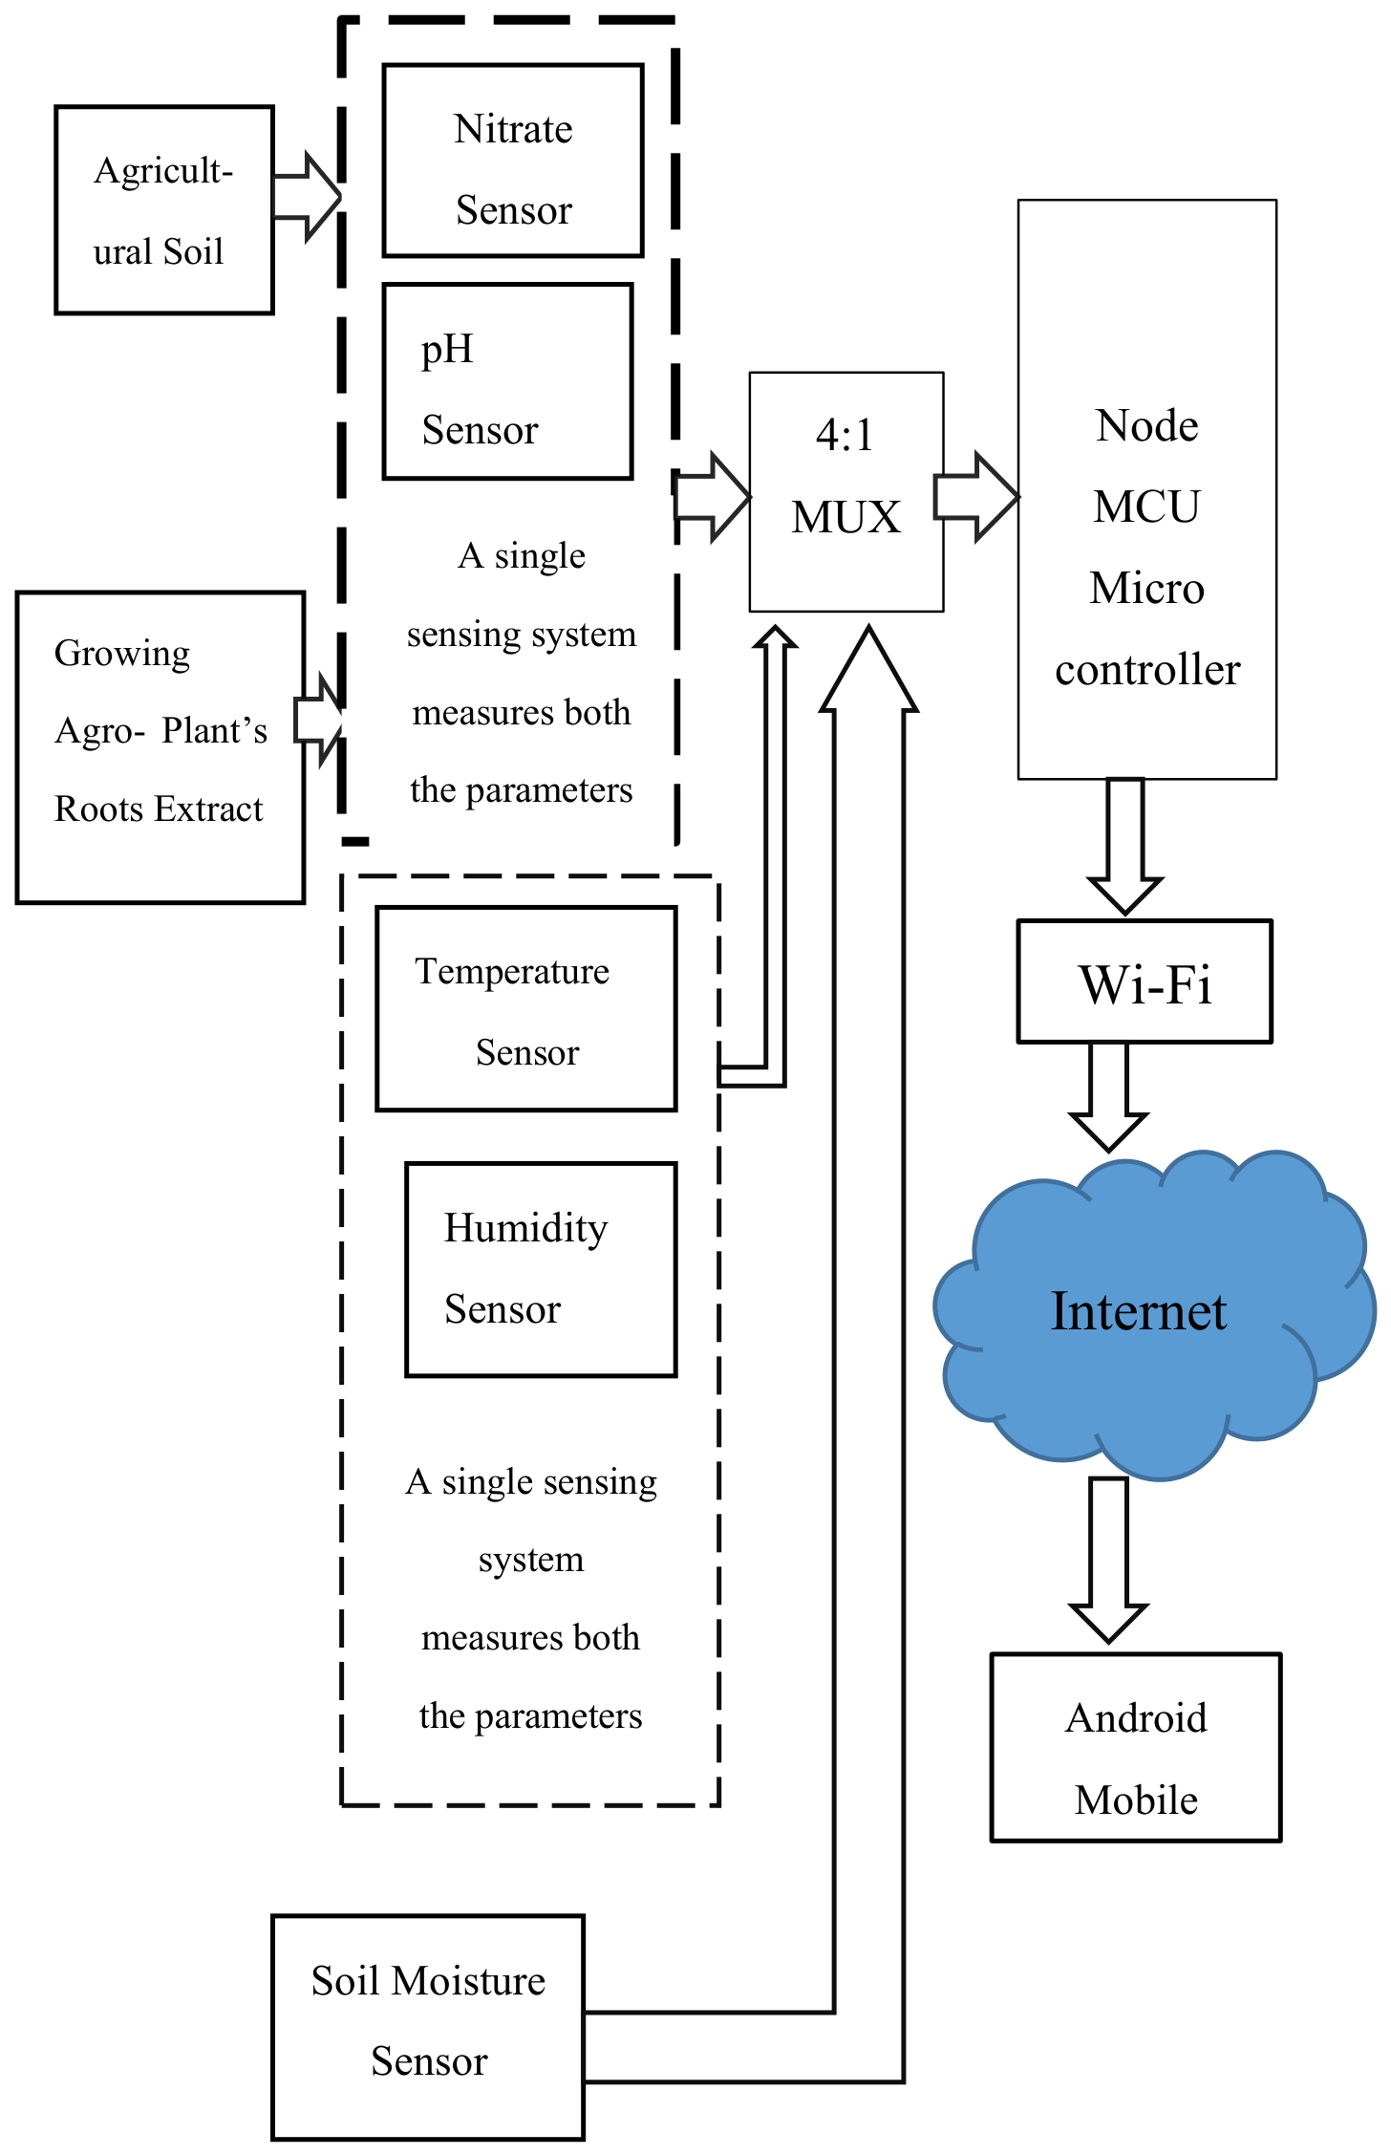
Figure 2.
(a) Overall setup of the proposed device without solar panel lid (b) Proposed device setup with solar panel lid. SMS: Soil Moisture Sensor; OS: Optical Sensor; SP: Solar Panels; ICPD: Inner Circuitry of Proposed Device.
Figure 2.
(a) Overall setup of the proposed device without solar panel lid (b) Proposed device setup with solar panel lid. SMS: Soil Moisture Sensor; OS: Optical Sensor; SP: Solar Panels; ICPD: Inner Circuitry of Proposed Device.
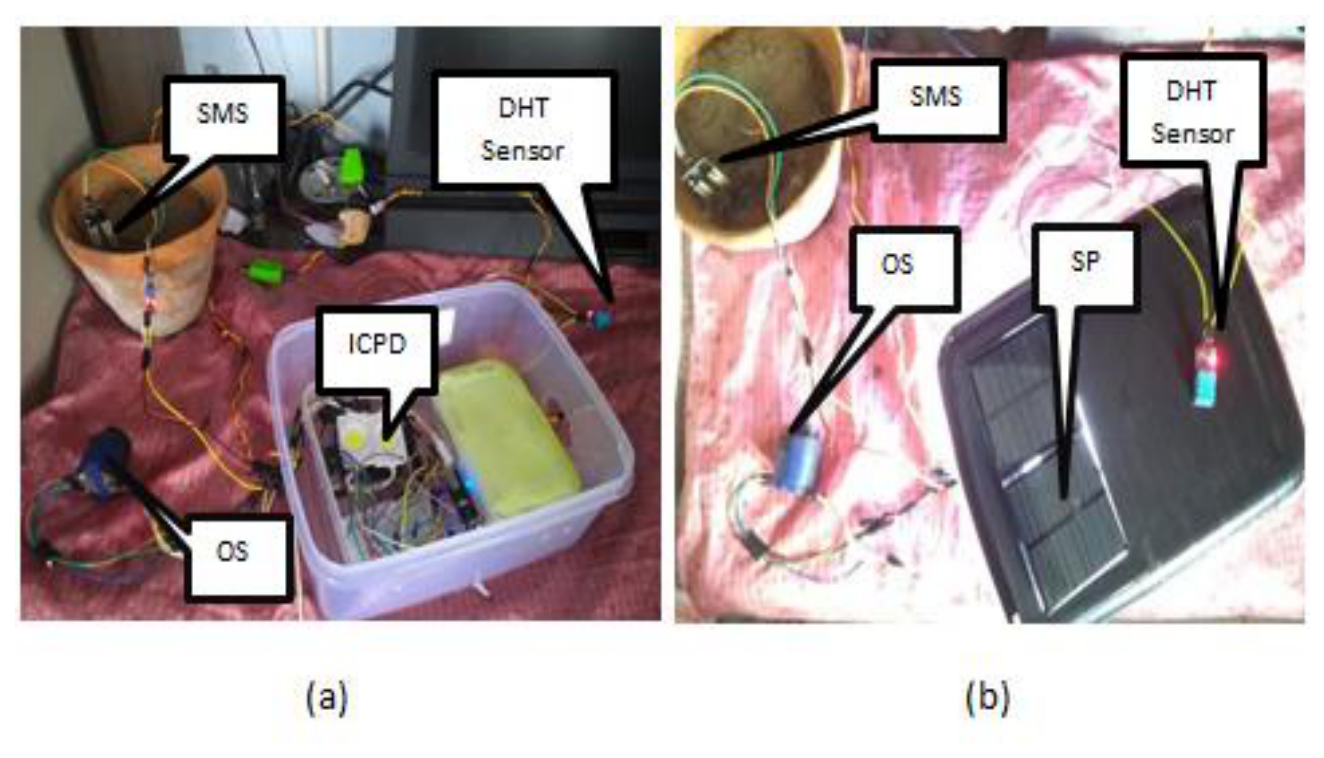
Figure 3.
Internal Circuitry of the proposed device; WL: White Light; WLIB: White Light inside the Box; MUX: Multiplexer; NM: Node MCU.
Figure 3.
Internal Circuitry of the proposed device; WL: White Light; WLIB: White Light inside the Box; MUX: Multiplexer; NM: Node MCU.
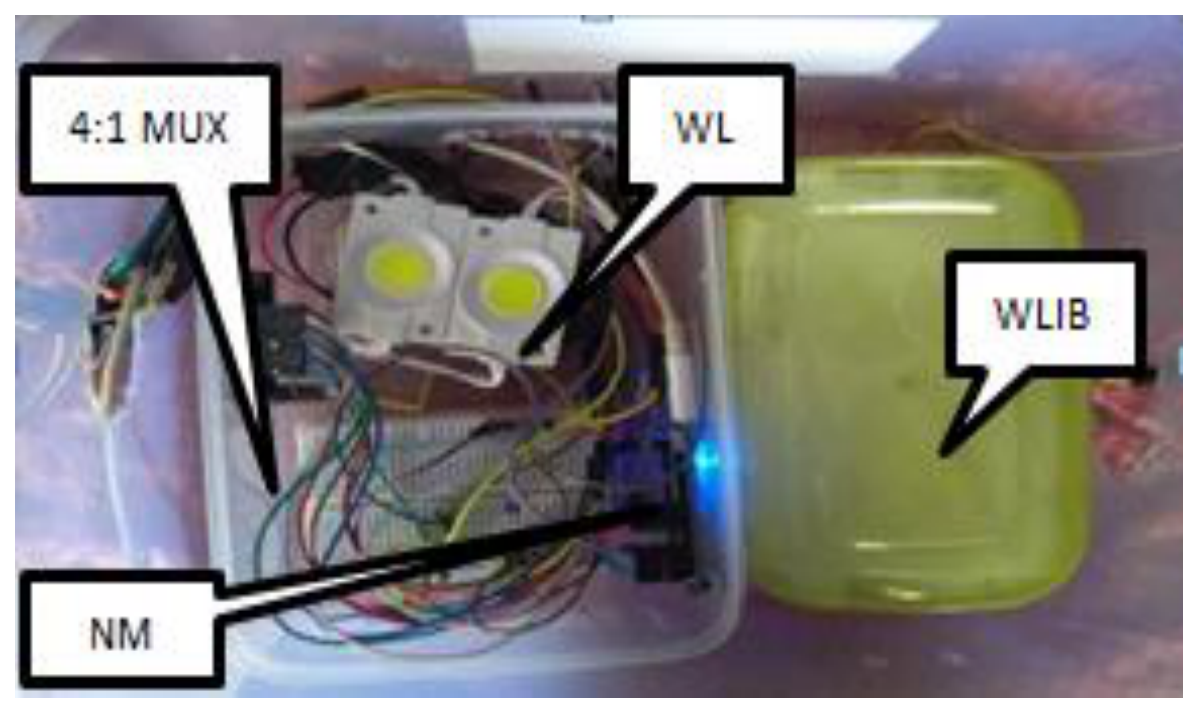
Figure 4.
(a) Holder for keeping micro centrifuge tube (b) Process of keeping the micro centrifuge tube in the holder (c) Sensing system about to be put over the micro centrifuge tube (d) Sensor kept over the micro centrifuge tube for analysis.
Figure 4.
(a) Holder for keeping micro centrifuge tube (b) Process of keeping the micro centrifuge tube in the holder (c) Sensing system about to be put over the micro centrifuge tube (d) Sensor kept over the micro centrifuge tube for analysis.
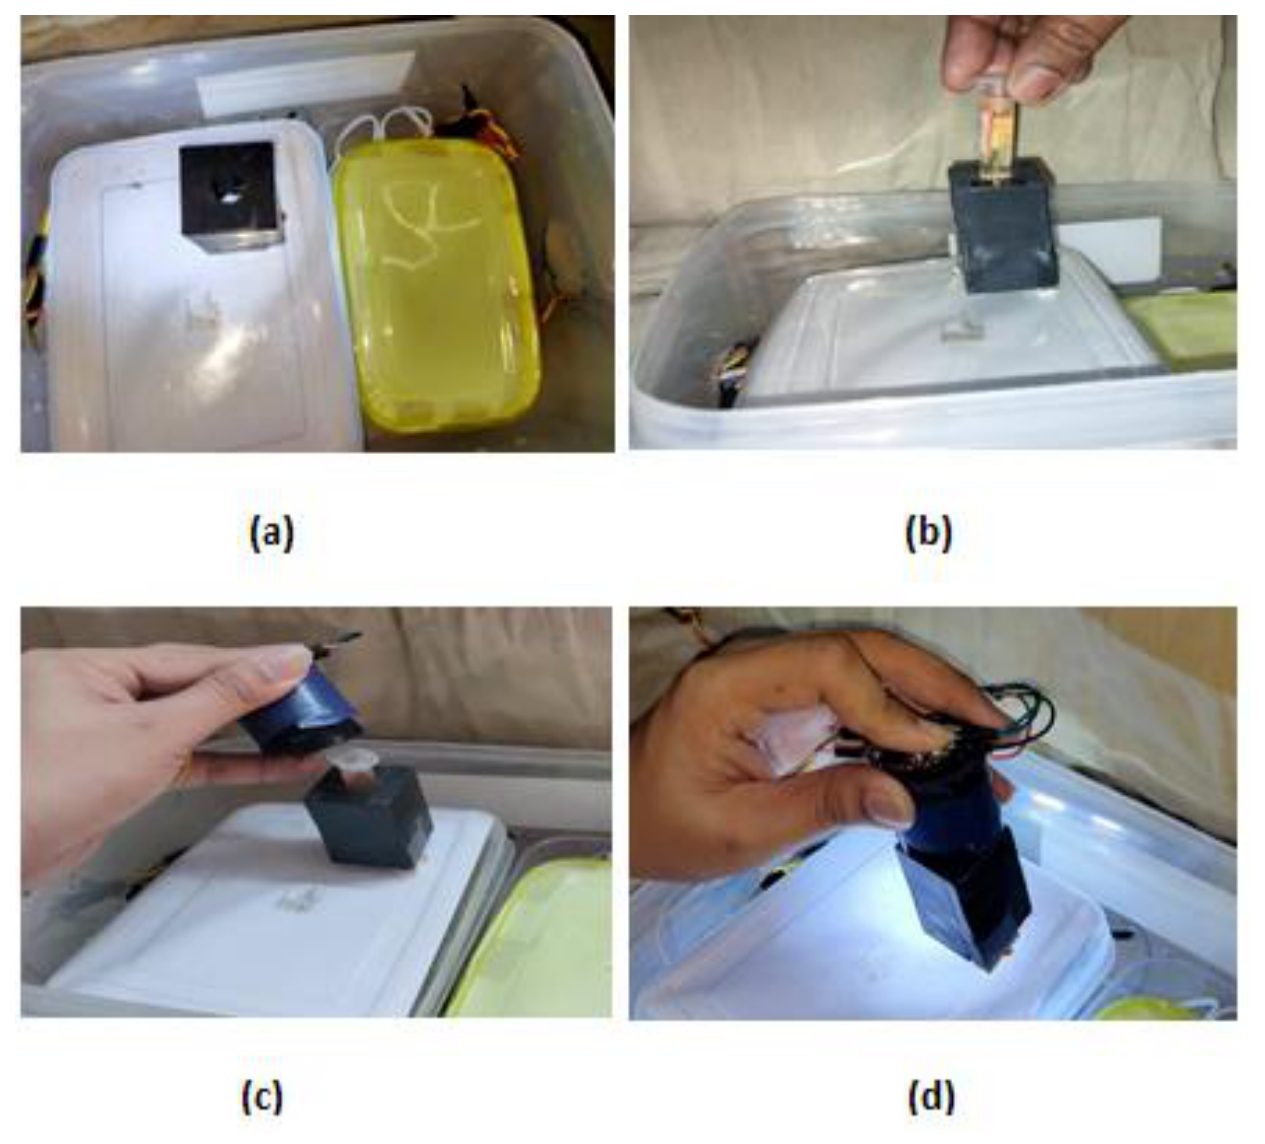
Figure 5.
(a)pH papers after being dipped in soil samples having pH of nearly 4 and 8 respectively. One of the pH paper is kept over illuminated surface (b) Sensing system being kept over the pH paper for analysis.
Figure 5.
(a)pH papers after being dipped in soil samples having pH of nearly 4 and 8 respectively. One of the pH paper is kept over illuminated surface (b) Sensing system being kept over the pH paper for analysis.
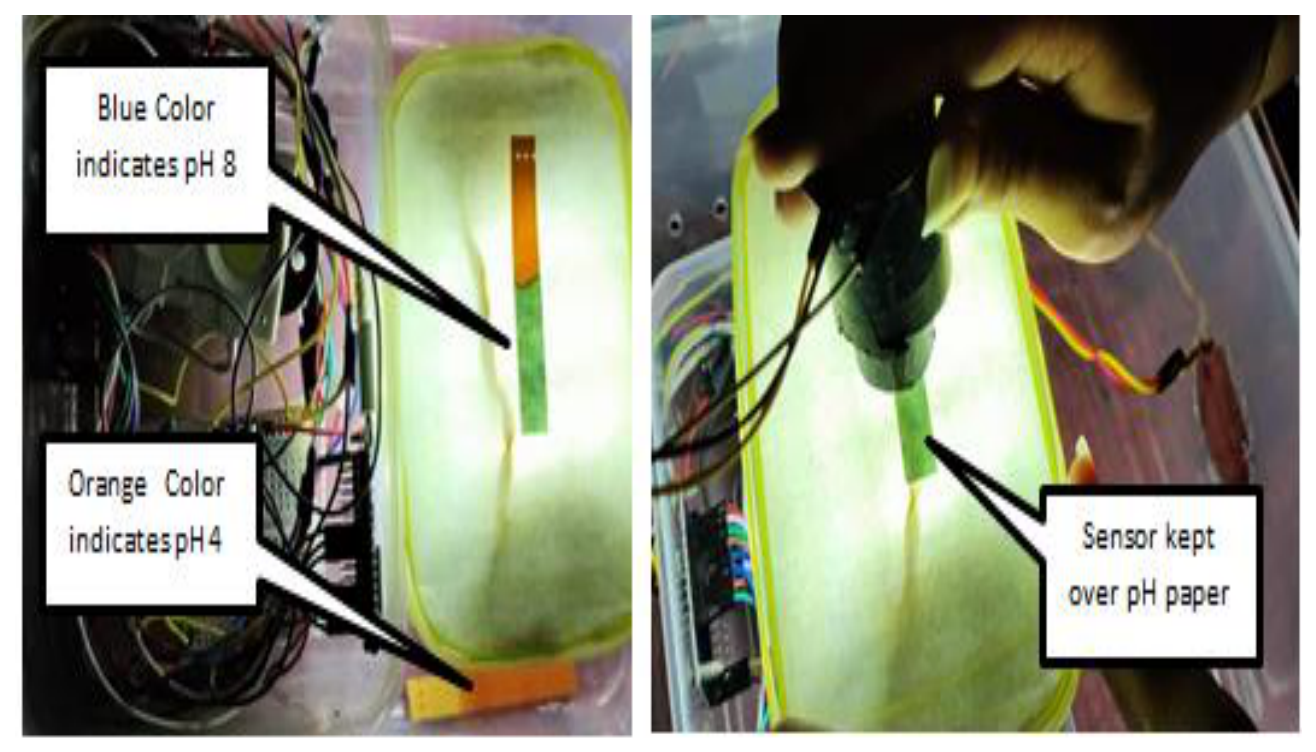
Figure 6.
A Calibration Curve showing relation of O.D. and nitrate concentration.
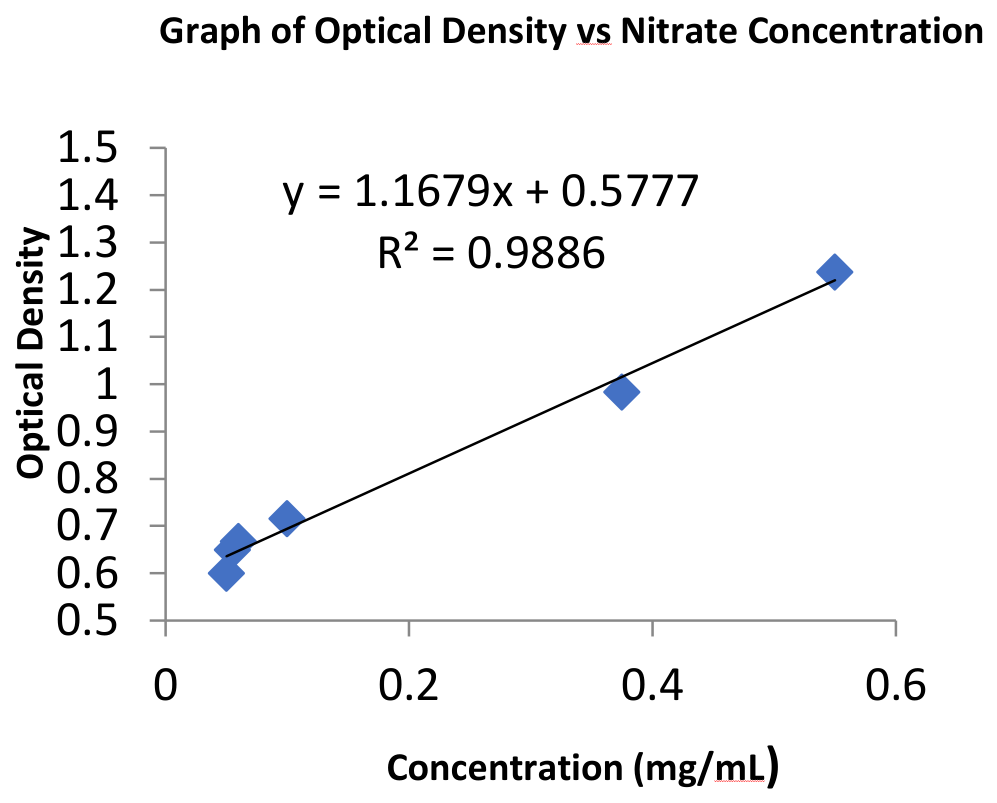
Figure 7.
Calibration curve of pH.
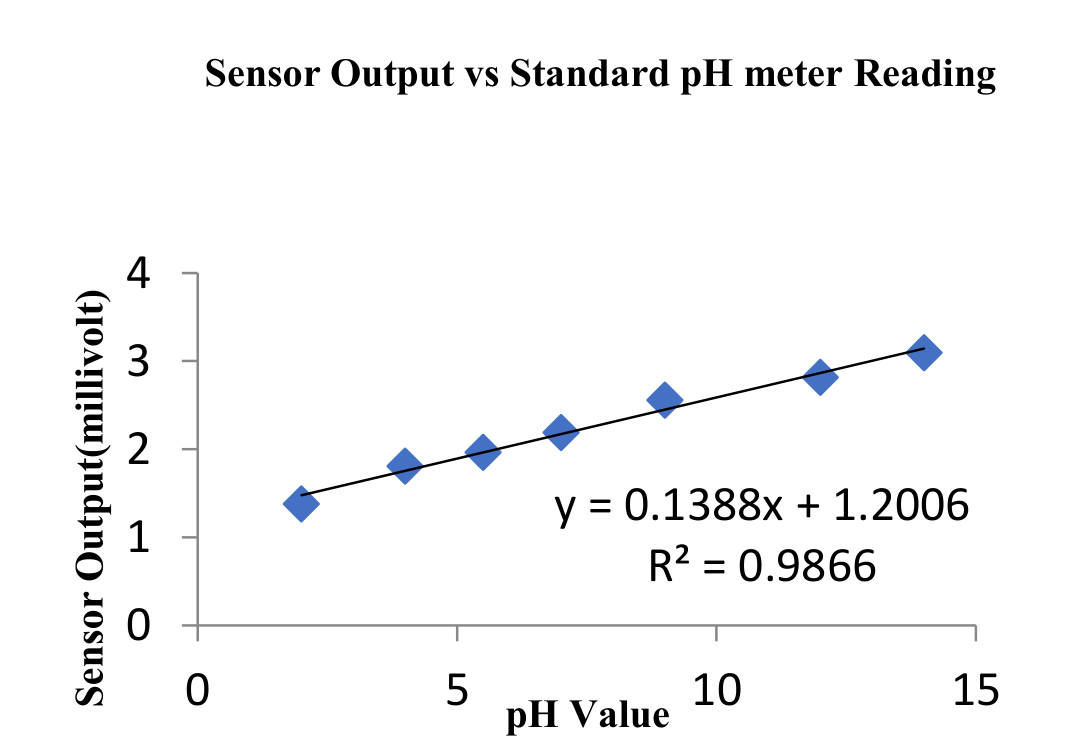
Figure 8.
Nitrate concentration measurement with unknown samples.
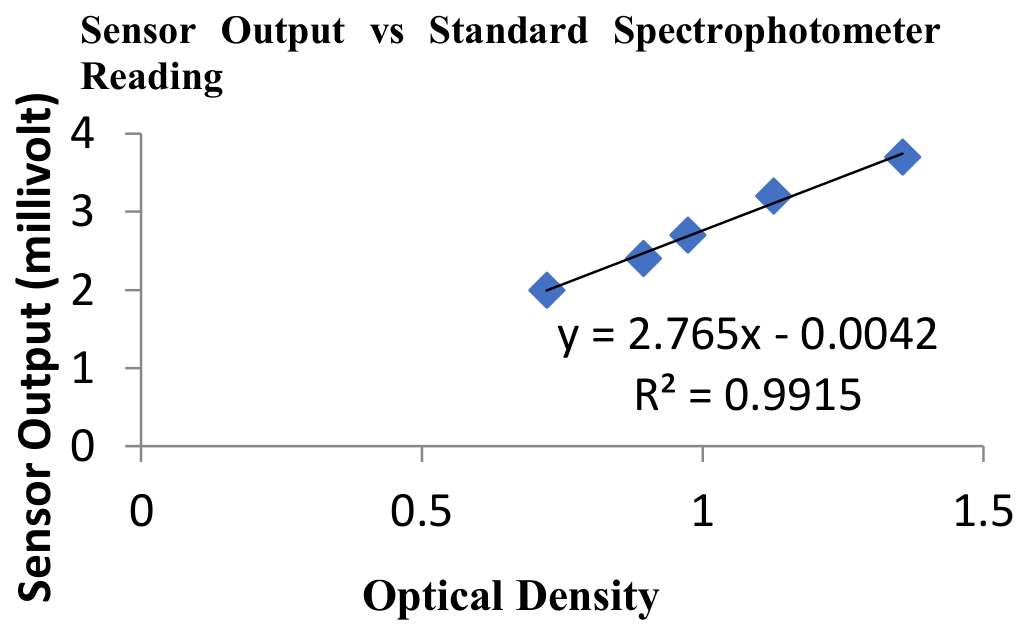
Figure 9.
pH measurement with unknown samples.
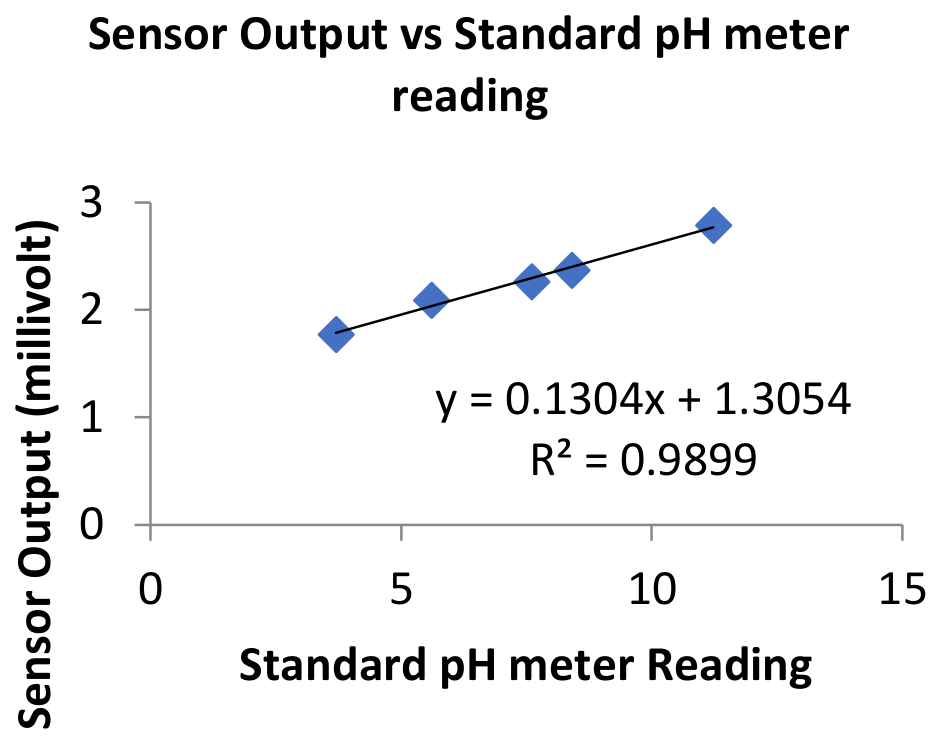
Figure 10.
Graph of Soil pH at various concentration of soil.
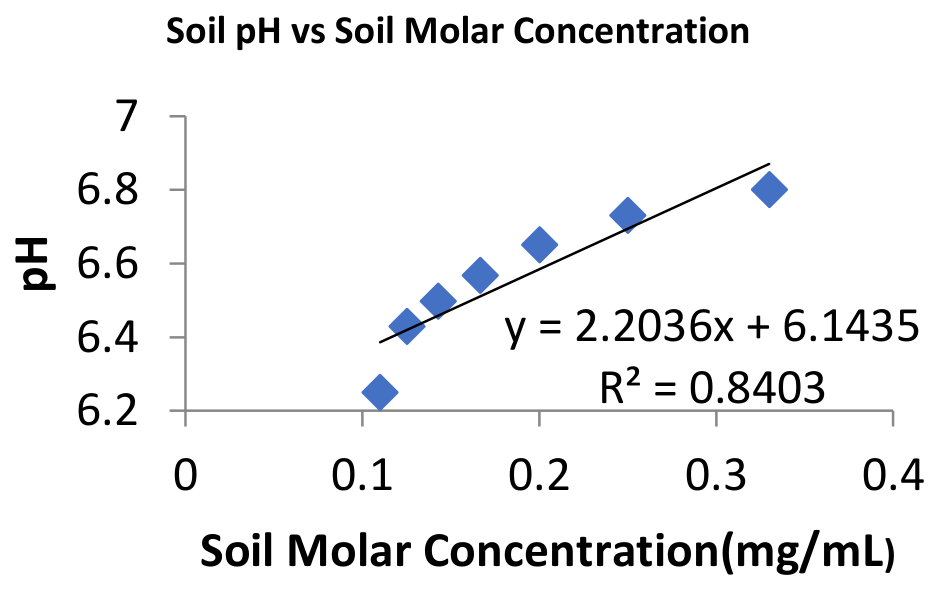
Figure 11.
(a) Thingspeak graph of nitrate levels. (b) Thingspeak graph of soil moisture content.
Disclaimer/Publisher’s Note: The statements, opinions and data contained in all publications are solely those of the individual author(s) and contributor(s) and not of MDPI and/or the editor(s). MDPI and/or the editor(s) disclaim responsibility for any injury to people or property resulting from any ideas, methods, instructions or products referred to in the content. |
© 2026 by the authors. Licensee MDPI, Basel, Switzerland. This article is an open access article distributed under the terms and conditions of the Creative Commons Attribution (CC BY) license (http://creativecommons.org/licenses/by/4.0/).
Copyright: This open access article is published under a Creative Commons CC BY 4.0 license, which permit the free download, distribution, and reuse, provided that the author and preprint are cited in any reuse.