
Submitted:
02 August 2026
Posted:
03 August 2026
You are already at the latest version
Abstract
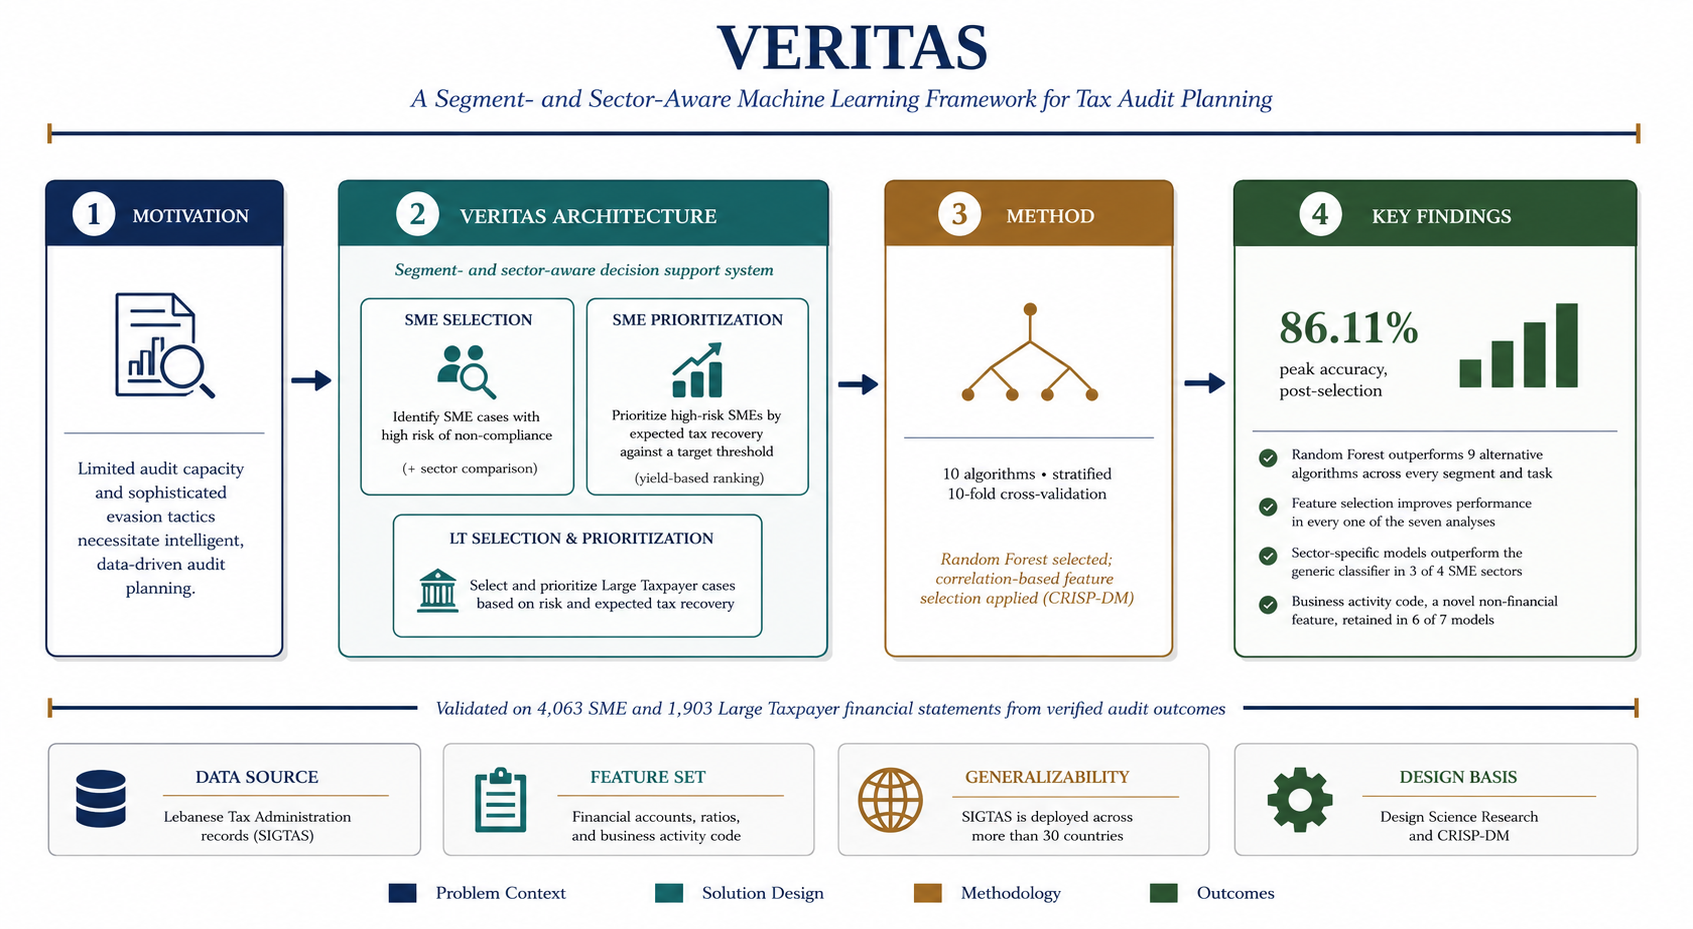
Innovations in artificial intelligence are reshaping how tax administrations approach compliance and audit planning, yet existing AI-based fraud detection studies largely treat the taxpayer population as homogeneous or remain conceptual frameworks awaiting empirical validation. This gap is consequential because audit resources are limited, evasion tactics are increasingly sophisticated, and misallocating scarce audit capacity carries a direct fiscal cost. To address it, this study presents VERITAS, a machine learning-based decision support system operationalizing a segment- and sector-aware architecture for corporate income tax audit planning: a single-layer model for Large Taxpayer case selection, and a novel two-layered model for small and medium enterprises (SMEs) that filters evasion-suspect cases before prioritizing them by expected tax-recovery yield against a target threshold. Ten classification algorithms were compared across 4,063 SME and 1,903 Large Taxpayer financial statements, with correlation-ranked feature selection subsequently applied to each. Random Forest consistently outperformed all alternatives across every segment, sector, and task examined; feature selection improved performance in every case; sector-specific modeling outperformed a generic classifier in three of four SME sec-tors; and a novel business-activity-code feature was retained in most analyses. These findings position VERITAS as a practical innovation in tax audit practice: a deployable, generalizable template for AI-driven audit planning built entirely from data tax administrations already collect.
Keywords:
artificial intelligence
; machine learning
; data mining
; auditing
; tax evasion detection
; audit case selection
; sector-aware modeling
; decision support systems
; tax administration 3.0
1. Introduction
Tax fraud remains one of the most persistent threats to fiscal stability and public trust in institutions worldwide, undermining government revenues and distorting the macroeconomic conditions on which sound public finance depends (Belahouaoui & Alm, 2025). Detecting and deterring such fraud is therefore a central objective for tax administrations seeking to safeguard revenue and sustain compliance (Murorunkwere et al., 2022).
Auditing is the key business process that serves to deter and detect noncompliance with tax laws and regulations. However, the resource constraints make it impossible to audit every taxpayer (Seidman et al., 2025). The tax authorities, therefore, rely on audit planning, or audit-case selection, a very challenging task which is quite similar to looking for a needle in a haystack (Wedick, 1983). Audit planning involves screening huge amounts of taxpayer data to identify possible tax evaders. The complex nature of this task combined with the uncertainty that governs the decision-making process and the massive amounts of data available for screening makes it impossible to perform using traditional reporting or query tools (Gupta & Nagadevara, 2007), especially that the taxpayers have continually devised more sophisticated methods of evasion — methods that are, by design, difficult for conventional audit techniques to detect (de la Feria, 2018). Thus, improving this selection process has become one of the most indispensable solutions to increase tax revenues and enforce tax compliance, specifically in case of income tax, which is the largest and most consistent source of government revenue in most economies (Smelser & Baltes, 2011).
In response, tax authorities have prioritized digital transformation within their audit functions, moving well beyond automating routine administrative work toward building real-time detection systems capable of detecting anomalies, behavioral inconsistencies, and latent tax risk (OECD, 2016). This shift is consistent with the OECD's (2020) Tax Administration 3.0 vision, which considers digital transformation as a central pre-requisite for building tax systems that are data-driven and organized around smooth and seamless engagement with taxpayers. Within this vision, artificial intelligence (AI) plays a pivotal role: it improves liability assessment, supports decision-making, and allows administrations to process vast volumes of fiscal data with a level of efficiency unattainable through manual review alone, thereby strengthening oversight while reducing the burden on both taxpayers and auditors (Belahouaoui & Alm, 2025). Machine learning, in particular, has proven effective at large-scale pattern recognition and automated risk profiling — tasks that historically demanded extensive human resources and specialized domain expertise (Anjarwi, 2026), reshaping how tax authorities engage taxpayers, allocate scarce audit resources, and manage compliance risk (Rahman et al., 2024)
The adoption of AI-based fraud detection varies considerably across countries, with developed countries taking the lead (OECD, 2024). In the United States, for example, the Internal Revenue Service's Return Review Program applies machine learning to more than 200 million tax returns annually, and has been credited with a 40% increase in fraudulent-return detection alongside a 35% reduction in false positives between 2020 and 2023 (Adelekan et al., 2024). More broadly, comparative studies suggest that AI-powered fraud detection systems can outperform traditional rule-based approaches substantially, with some implementations reporting improvements in detection rates of up to 85% (Ariyibi et al., 2024).
Despite this growing body of evidence, much of the existing literature remains conceptual or descriptive, documenting the promise of AI in tax administration without detailing the process of embedding such systems within a given administration's operational and data constraints (Belahouaoui & Alm, 2025). This gap is compounded by a broader tendency in the field to treat the taxpayer population as a single, undifferentiated group, rather than exploring how predictive performance differs across meaningfully different segments — such as small and medium-sized enterprises (SMEs) and LTs (LTs) — whose scale, data richness, and audit economics vary considerably.
A related, and thus far largely unexamined, dimension of this same problem concerns sector heterogeneity within a segment. Remarkably, a limited number of recent studies have initiated inspecting whether fraud patterns differ across sectors (Baumohl et al., 2025; Yang, 2025). However, the comparison was conducted as a standalone analytical exercise on a general corporate taxpayer population, rather than as a structural feature embedded within a broader, deployable audit-planning framework — leaving open whether the same sector-level differentiation extends to SME populations specifically, and to a different national and regulatory context.
Taken together, these observations point to two methodological and theoretical gaps that persist in the literature on AI-driven tax audit selection. First, there is limited focus on integrating predictive results into a broader audit strategy aligned with tax administration priorities: most studies prioritize model performance in isolation, without translating predictions into structured audit pathways that balance compliance enforcement against revenue optimization. Second, taxpayer heterogeneity — at both the segment level (SME vs. LT) and, as discussed above, the sector level within a segment — is often collapsed into a single, generic classifier rather than treated as a structural design consideration.
This paper responds to the gaps outlined above by presenting VERITAS (Verified Evasion Risk Identification for Tax Administration Systems), a sector-aware intelligent decision support system (IDSS) designed to improve auditing and audit planning by predicting corporate income tax evasion. Instead of treating the taxpayer population as homogeneous, VERITAS framework constitutes two separate predictive components adapted to match the diverse nature of SMEs and large taxpayers (LTs). The LT component supports audit planning through a single predictive layer that identifies corporations likely to yield higher tax recoveries if audited, directly targeting revenue impact. The SME component, on the other hand, addresses the far larger and more heterogeneous population of SME corporations through a novel two-layered approach: a first layer classifies cases as evasion-suspect or not, and a second layer prioritizes the cases flagged by the first according to their likely tax-recoveries yield. Within the SME component specifically, this study extends the sector-comparison approach of Yang (2025) and Baumohl et al. (2025) to an SME population and a new national and regulatory context, embedding the comparison directly into the audit case selection layer rather than treating it as a standalone analysis: sector-specific classifiers, trained separately on the manufacturing, sales, services, Real Estate, and other major sectors composing Lebanon's SME population, are evaluated against a single pooled model trained across all sectors, to determine which approach is better to adopt by tax authorities in practice.
To ensure empirical validity and avoid the labeling bias, the framework is validated completely based on verified audit outcomes provided by the Lebanese Tax Administration: financial statements filed for fiscal years 2010–2013, audited between 2014 and 2018, which is the most recent complete audit cycle before Lebanon's 2019 economic and financial crisis (France-Presse, 2020), and therefore the last available data reflecting a stable, normal-economy relationship between financial statement features and evasion behavior. While the case studies are grounded in the Lebanese context, this reflects a broader premise underlying VERITAS's design: data mining for tax audit selection is not only about learning the patterns of a single country's data, but about generalizing an auditing logic that reasonably extends across jurisdictions, since evaders operating under comparable economic and reporting conditions tend to evade in structurally comparable ways. This premise is further supported by VERITAS's reliance on SIGTAS (Standard Integrated Government Tax Administration System) as its sole data source, which is a platform deployed by tax administrations in more than 30 countries(Government of the Virgin Islands, 2023). Consequently, VERITAS's underlying feature set is not Lebanon-specific, but already available across a substantial number of tax administrations worldwide, complementing the behavioral similarity argument made above.
Building on the gaps and design principles outlined above, this study aims to answer the following research questions (RQs), each corresponding to a specific predictive component of VERITAS: RQ1 addresses the SME component's first-layer audit case selection, RQ2 addresses the sector-aware comparison embedded within that same layer, RQ3 addresses the SME component's second-layer audit case prioritization, and RQ4 addresses the LT component's single-layer audit planning approach.
RQ1: Can machine learning classifiers, trained on verified audit outcomes, reliably distinguish compliant from non-compliant SME taxpayers to support audit case selection?
RQ2: Within the SME component, does a sector-aware modeling approach — training separate classifiers for each major sector — outperform a single generic classifier trained across all sectors, extending prior sector-comparison findings (Yang, 2025; Baumohl et al., 2025) to an SME population, and does this performance difference vary meaningfully by sector?
RQ3: Among SME taxpayers flagged as likely evaders, can a second predictive layer effectively prioritize cases by their likely tax-recoveries yield, to support audit planning under limited audit capacity?
RQ4: Can a similar predictive approach identify large-taxpayer corporations likely to yield a specified tax recoveries if audited, supporting revenue-maximizing audit case selection for this segment?
The remainder of this paper is organized as follows. Section 2 introduces the concepts of auditing and audit planning and examines the role of data mining in supporting these decisions. Section 3 presents the conceptual design of VERITAS, detailing the function of each component. Section 4 describes the CRISP-DM–based Real Estate of the classification models addressing RQ1 (SME selection), RQ2 (SME prioritization), and RQ3 (large-taxpayer audit planning), using real, audited data extracted from the Lebanese Tax Administration's databases — comprising 4,063 SME corporations and 1,903 large-taxpayer corporations, each described by 41 features, several of which have not previously been used in the income tax evasion detection literature. Section 5 reports the results of this comparison across ten classification algorithms using 10-fold cross-validation, the effect of feature selection on the best-performing model, and, addressing RQ4, a comparison of generic and sector-aware modeling approaches within the SME component across its major sectors.
2. Related Works
The computing revolution of the 1990s enabled the tax administration to adopt AI-based sophisticated classification techniques (R. C. F. Wu, 1994). Since then, empirical studies applying these techniques to audit case selection have since been conducted across a wide range of countries: Taiwan (Chou, 2014; R. C. F. Wu, 1994; R. S. Wu et al., 2012), Italy (Bonchi et al., 1999; Dias et al., 2016; Pisani & Sisti, 2007), Portugal (Almeida, 2009; Dias et al., 2016; Serrano et al., 2012), India (Gupta & Nagadevara, 2007; Mehta et al., 2019), Morocco (Ameur & Tkiouat, 2012; Jihal et al., 2018), Zambia (Mwanza & Phiri, 2016), the United States (Bloedorn et al., 2005; Hsu et al., 2009; Quinn et al., 2014), Brazil (Da Silva et al., 2015), Iran (Rad & Shahbahrami, 2016; Rahimikia et al., 2017), Belgium (De Fortuny et al., 2013), Spain(Pérez López et al., 2019), Chile (González & Velásquez, 2013), China (Yu et al., 2003), Ireland (Cleary, 2011), and Lebanon (Dbouk & Zaarour, 2017), among others.
This body of work has consistently demonstrated that classification techniques outperform manual or purely statistical audit selection (Hsu et al., 2009; Pisani & Sisti, 2007; R. C. F. Wu, 1994), though a smaller number of studies have modeled sector-specific populations directly (Dbouk & Zaarour, 2017; Rahimikia et al., 2017; Yu et al., 2003)without treating sector differentiation as a systematic design question. Moreover, more recent studies have continued to refine algorithmic performance using contemporary classification techniques and real government audit data (Abdul Rahman R. et al., 2020; Alrasheedi et al., 2025; Murorunkwere et al., 2022). Furthermore, two recent studies are especially relevant to the present work, as both explicitly examine sector-level variation in fraud patterns. First, Yang (2025) compared SVM, XGBoost, and Random Forest on 3,232 tax records from manufacturing and service sectors, finding that Random Forest performed best in both, but that the two sectors were predicted by different risk signals. Baumohl et al. (2025) took this further methodologically: using a dataset built exclusively from verified Slovak tax audit outcomes, the authors compared a full-sample model against a sector-segmented model, finding XGBoost achieved the strongest full-sample F1-score (0.75), with sector-specific performance varying considerably. Both studies demonstrate that sector-level differentiation matters empirically, but both were conducted on a general corporate taxpayer population, as a standalone comparison rather than a structural feature of a broader audit-planning system, and neither examined whether the same pattern holds within an SME population specifically.
A closely related precedent, and one of the earliest attempts at threshold-based classification specifically, comes from Gupta and Nagadevara (2007), who reclassified dealers by recovery amount (Rs 5.00 lakhs or more) as a distinct target class within their broader audit-selection model. This model was ultimately discarded, as it did not achieve a prediction recall greater than 42%. This establishes that threshold-based prioritization, which constitutes the design underlying both VERITAS's SME prioritization layer and its LT component, is not a new idea, but one with a documented history of difficulty using the classifiers and feature sets available at the time.
More recently, Chan et al. (2022) proposed a related two-layer approach, but structured differently: one layer for classification, and a second for regression rather than classification. The authors applied a two-stage neural network pipeline to California state tax records, first classifying audit leads as positive or negative using a dollar-value yield threshold, then predicting expected audit yield for positive cases using gradient-boosted trees. The classification stage achieved a precision of 40.1% and a recall of 58.7% (F1-score = 0.42) on data from the California Department of Tax and Fee Administration, with the corresponding regressor producing a mean absolute error of $155,490 on estimated audit gains.
Beyond machine learning problems, recent studies have proposed broader frameworks for integrating AI into tax administration rather than validating a specific predictive model. Azenzoul et al. (2026) introduced the AI-Driven Tax Audit Model (ATAM), which frames AI adoption as a governance and design problem, balancing algorithmic efficiency and financial risk mitigation against equity and explainability. While Belahouaoui & Alm (2025) proposed the Adaptive AI Tax Oversight (AATO) framework, structuring AI's role in tax fraud detection around data aggregation, anomaly detection, predictive analysis, adaptive learning, and decision support. Both frameworks are conceptual: neither has been implemented or tested on real tax data, and both explicitly call for empirical validation in future work.
Taken together, this literature establishes that data mining–based audit selection is a mature and internationally validated approach, that recent algorithmic studies continue to improve predictive performance, and that governance-level frameworks for structuring AI's role in tax administration are now emerging (Azenzoul et al., 2026; Belahouaoui & Alm, 2025). Yet two gaps remain evident. First, the majority of studies, including both sector-aware studies above, evaluate a standalone predictive model rather than integrating predictions into a broader audit-planning architecture aligned with a tax administration's actual decision structure; the two governance frameworks that do address system-level design (ATAM, AATO) remain conceptual, with neither implemented nor validated on real data. Second, while Yang (2025) and Baumohl et al. (2025) demonstrate that sector-level differences in fraud patterns are empirically real, both examine only a general corporate taxpayer population but do not test whether this same differentiation holds within an SME population specifically, leaving open whether the same differentiation holds for SMEs, and for a different national and regulatory context.
VERITAS advances this literature by embedding sector-aware and generic classifiers within a segment-specific, layered decision support architecture rather than a standalone predictive model, spanning distinct audit case selection, prioritization, and revenue-optimization decisions for both SMEs and LTs. Within the SME component, it extends this sector-comparison approach to a population neither prior study examined, providing the first systematic evaluation of sector-specific classifiers against a single pooled model within an SME context.
3. VERITAS Framework
Figure 1 depicts the conceptual design of VERITAS. The system is mainly formed of three layers: 1) Data Collection Layer, 2) Data Processing Layer, and 3) Knowledge Presentation Layer. Using a layered approach for designing a predictive DSS is inspired by Bâra & Lungu (2012).
3.1. The Data Collection Layer
The Data Collection Layer is responsible for acquiring data from the tax administration's operational database, SIGTAS (Standard Integrated Government Tax Administration System), which holds financial statement data and previous audit results. SIGTAS is currently the system's sole data source. In principle, VERITAS could be extended to draw on other sources like: Internet-based data, cadastral records, banks, governmental institutions, and syndicates, as depicted in Figure 1, to enrich its predictive power. However, integrating such sources would require new legislation and considerable additional time and effort, whereas VERITAS is designed to be a prompt, applicable solution built on data and IT infrastructure already available within the current legal framework. SIGTAS was therefore chosen as the system's only data source, with the remaining sources shown in Figure 1 representing a future extension path rather than data currently feeding the Data Processing Layer's classifiers.
This choice also supports VERITAS's generalizability beyond Lebanon: SIGTAS is not unique to the Lebanese Tax Administration, but is currently deployed by tax administrations in more than 30 countries (Government of the Virgin Islands, 2023). Consequently, any tax administration already running SIGTAS could, in principle, populate the same feature set VERITAS relies on without new data infrastructure
3.2. The Data Processing Layer
The Data Processing Layer retrieves data from the Data Collection Layer and applies data mining classification algorithms to generate predictions, forming the core of VERITAS's design novelty. As shown in Figure 1, this layer is organized around two sub-components — one for SMEs and one for LTs, reflecting a deliberate design choice: the two segments differ enough in scale and characteristics that a single, undifferentiated audit case selection approach would not serve both well. Beyond this segment-level division, Figure 1 also maps the Data Processing Layer's outputs onto three distinct decisions, each tied to a specific business process and owned by a specific role within the tax administration (Table 1).
This mapping reflects a core design principle of VERITAS as a decision support system, consistent with Simon's (1960) characterization of managerial decision-making as fundamentally a problem of information processing under limited capacity. Rather than producing one homogeneous output, VERITAS is designed to support distinct decisions, owned by distinct roles, at different points in the audit workflow, extending each decision-maker's capacity to process taxpayer information, rather than replacing their judgment. First, the SME sub-component's first layer supports the Tax Controller's non-compliance detection decision directly within the auditing process, while its second layer supports the Tax-Compliance Head of Department's audit case prioritization decision within audit planning. The LT sub-component combines both decisions into a single layer, reflecting the comparatively smaller, more concentrated large-taxpayer population described below. The third decision is evaluating audit planning strategies, which sits above both sub-components and belongs to the Director of Revenue, representing a strategic, forecasting-oriented use of VERITAS's outputs rather than case-level audit selection itself.
3.2.1. The SME Component
The SME population's large size and diversity make audit planning especially difficult, since the tax administration's resources allow only a small percentage of SMEs to be audited each season. Selecting cases to audit is therefore costly to get wrong in either direction: auditing a compliant taxpayer wastes time and resources, while failing to audit an actual evader forgoes potential tax revenue.
To address this, the SME component uses a two-layered approach. The first layer functions as a general fraud detection tool, supporting the Tax Controller's non-compliance detection decision: using data derived from financial statements and previous audit outcomes, a machine learning classifier predicts whether a taxpayer is likely to have committed tax under-statement, regardless of the size of the potential fraud. This layer can also support tax auditors directly in their regular auditing processes, independent of formal audit planning.
Because the number of cases flagged by the first layer may exceed the tax administration's auditing capacity, a second layer performs further prioritization, supporting the Tax-Compliance Head of Department's audit case prioritization decision. Here, the decision-maker specifies a minimum tax recoveries target that an audit should be expected to produce; a second machine learning classifier then predicts, among the cases already flagged as likely evaders by the first layer, which are most likely to meet or exceed that target if audited. This two-layer design allows the SME component to first cast a wide net for likely evasion, then narrow that pool to the cases most worth the tax administration's limited audit capacity.
From an audit-planning standpoint, what the Tax-Compliance Head of Department actually needs from this second layer is a decision, not a number: is a given case likely to clear the recovery threshold or not. A precise forecast of the exact recovery amount would offer no additional operational value over this binary judgment, since audit case lists are built by selecting cases above a cut-off, not by ranking exact yield predictions to the nearest currency unit. The second layer is therefore designed as a classification task rather than a regression task, matching the model's output to the decision it is meant to support, rather than asking it to solve a harder problem than the business question requires.
This design choice is also consistent with the practical track record of recovery-based prediction in this literature. Gupta and Nagadevara (2007) attempted threshold-based classification of tax recoveries and found it could not exceed 42% recall using the data available to them. Chan et al. (2022) went a step further methodologically, pairing a classification stage with a regression stage to estimate exact audit yield, yet their classification stage alone still returned a weak F1-score, before the added burden of yield estimation was even introduced. Read together, these precedents indicate that recovery-threshold prediction is already a demanding task in its simpler, classification form; compounding it with a regression requirement — one this study's business question does not call for in the first place — would add difficulty without adding decision-relevant value.
3.2.2. The LT Component
The LTs Office governs the taxation of around 1500 registered corporations, which is relatively small compared to the 93,875 SMEs distributed across Lebanon's regional offices. This makes the large-taxpayer audit planning process comparatively less complex that that of SMEs, though its no less important. In fact, in 2008, LTs, despite representing only 7% of Lebanese taxpayers, accounted for approximately 87% of the country's income tax base (Antoun, 2008).
Given this concentration of revenue within a comparatively small and closely monitored population, the LT component combines audit case selection and prioritization into a single decision layer, oriented directly toward maximizing revenue impact. Specifying a minimum tax adjustment target, the decision-maker relies on a machine learning classifier to predict which corporations, out of the full LTs Office population, are most likely to produce that target if audited — directly targeting audit case selection toward the cases with the greatest expected fiscal return.
3.3. The Knowledge Presentation Layer
The Knowledge Presentation Layer provides the interface through which the Data Processing Layer's predictions reach their intended users. As established in Section 3.2 (Table 1), VERITAS is designed around three decision-makers (the Tax Controller, the Tax-Compliance Head of Department, and the Director of Revenue) each accessing the system through a common, user-friendly interface, but drawing on different outputs depending on the decision at hand.
In routine use, this access follows the tax administration's quarterly audit planning cycle. Each fiscal season, the Tax-Compliance Head of Department retrieves a prioritized list of audit candidates for the upcoming period, drawing on the SME or LTs component depending on the population under review. Independently of this seasonal cycle, the Tax Controller can consult the system's non-compliance detection output directly in the course of regular auditing work, without waiting for a formal planning round. At a more strategic level, and specific to the SME component, the Director of Revenue uses the Knowledge Presentation Layer to evaluate audit planning strategies over time. Because the SME prioritization layer's tax-recoveries target is a configurable input rather than a fixed rule, the Director can compare the volume and expected yield of flagged cases under different target levels, helping to decide which threshold best balances available audit capacity against expected revenue, which is a forecasting and strategic-planning use of VERITAS's outputs distinct from case-level audit selection.
Beyond this periodic, decision-maker-initiated use, the Knowledge Presentation Layer also supports real-time application. Because financial declarations are submitted electronically through Lebanon's e-declaration portal, VERITAS can screen a declaration for signs of fraud immediately upon submission, rather than waiting for the next scheduled audit cycle. A high-risk submission allows the tax administration to intervene sooner than the standard cycle would otherwise permit, for example, through a compliance notice or a behavioral nudge prompting voluntary correction before formal selection would occur.
4. Materials and Methods
Since the primary output of this research is VERITAS system design, this study adopts Design Science Research (DSR) as its guiding methodology, drawing on two complementary frameworks from the DSR literature. Following Vaishnavi & Kuechler (2004), the research process is structured through five sequential phases, namely: Problem Awareness, Suggestion, Development, Evaluation, and Conclusion, of which Section 3 corresponds to Suggestion, and the sections that follow correspond to Development and Evaluation. To situate this process within its broader research context, Figure 2 additionally maps the study onto the Information Systems Research Framework (Hevner et al., 2004),which positions the design and evaluation of an artifact between two governing forces: the practical Environment that motivates the research, and the theoretical Knowledge Base that informs and is, in turn, enriched by it.
Beyond VERITAS's system design as the primary artifact, this study produces a secondary artifact: the tax evasion detection models embedded within the system’s components. For building these classification models, this study's empirical development and evaluation follow the CRoss-Industry Standard Process for Data Mining (Wirth & Hipp, 2000), illustrated in Figure 3, which comprises six phases: business understanding, data understanding, data preparation, modeling, evaluation, and deployment. The deployment phase was not empirically implemented; deployment considerations are instead discussed in Section 6.3 to illustrate the framework's practical applicability. Business understanding, data understanding, and data preparation are common across all three components and are described once, in Section 4.1, Section 4.2 and Section 4.3; the modeling and evaluation setup is then presented separately for each component, and for the sector-aware comparison specific to SME Case Selection (Section 4.5), with results reported in Section 5.
In addition, this study adopts a mixed-methods approach, combining qualitative techniques — desk research, literature review, document analysis, and expert interviews — with quantitative analysis of secondary data and machine learning classification. Desk research and literature review informed the problem identification and gap analysis presented in Section 1 and Section 2. Document analysis was applied to the Tax Administration's internal database structure to identify the variables available for constructing this study's datasets (Section 4.3), and expert interviews with a domain expert informed the tax-recovery target thresholds used in the prioritization components (Section 4.1).
Quantitative secondary data analysis was then conducted on the resulting datasets (Section 4.2), within which inductive learning, supervised learning, and classification methods were used to construct the tax evasion detection models (Section 4.4), consistent with the Develop/Build activity of Figure 2's IS Research component. Correlation-based feature evaluation and correlation-based feature selection were subsequently applied to refine these models (Section 4.6), and comparative research was conducted both within this study, across taxpayer segments, sectors, and tasks (Section 5), and against the wider literature (Section 6.1). Together, these methods operationalize the Build–Evaluate cycle depicted in Figure 2 for the tax evasion detection models specifically, assessed against the measures detailed in Section 4.5.
4.1. Business Understanding
The Lebanese Tax Administration levies corporate income tax annually, based on a financial declaration each corporation files reporting the accounting basis for its tax liability. A corporation is considered to be evading tax when this declaration understates its true financial position, reducing its tax payable.
VERITAS applies machine learning classifiers to predict which corporations are most likely to yield a positive audit outcome, demonstrated through three components corresponding to the two layers of the SME component and the single layer of the LT component. Table 2 summarizes the business question addressed by each component, directly reflecting the strategic objectives, business processes, and problem space, specifically enhancing compliance and increasing tax revenue, addressed through tax evasion detection processes designed to overcome the limitations of manual auditing.
4.2. Data Understanding
Data source and scope. All datasets are constructed from real financial statements filed for fiscal years 2010–2013, audited by the Lebanese Tax Administration between 2014 and 2018 — the most recent complete audit cycle preceding Lebanon's 2019 economic and financial crisis. Restricting the study to this period ensures the modeled relationships reflect a stable, normal-economy relationship between financial statement features and evasion behavior, rather than the extreme currency devaluation and reporting disruption that followed. For SMEs, only corporations registered in the Beirut regional office are included, as this office covers the largest and most significant share of Lebanese SME activity. For LTs, all registered corporations are included except banks and insurance companies, which file under a separate financial statement format.
Target variables. All target variables in this study are derived exclusively from verified, post-audit tax recovery outcomes, rather than from taxpayers merely unflagged by the tax authority — avoiding the type I/type II misclassification risk that affects studies relying on indirect labeling assumptions (Baumohl et al., 2025). Each component uses a target variable derived from post-audit tax recovery outcomes. SME Case Selection uses a binary Status variable (Compliant / Non-Compliant), based on whether any positive tax recovery resulted from audit. SME Case Prioritization and LT Case Selection use a binary Under-Statement variable (Above Target / Below Target), based on whether the resulting tax recovery met or exceeded a target threshold — set at $2,000 for SME Case Prioritization and $33,000 for LT Case Selection, reflecting the substantially larger scale of LT audit yields relative to SMEs. SME Case Prioritization is trained only on the subset of SME financial statements with a positive tax recovery ("positive-yielding" cases), while LT Case Selection is trained on the full set of audited large-taxpayer financial statements.
Feature vector. All models are trained on a common 41-feature vector constructed from the corporate income tax financial declaration, comprising a balance sheet and an income statement. Consistent with prior literature on financial statement fraud detection (Baumohl et al., 2025; Gepp, 2015), the feature vector combines three categories of predictors: (i) raw financial accounts (e.g., fixed assets, inventories, receivables, cash, total assets, turnover, gross profit); (ii) financial ratios spanning liquidity, activity, solvency, and profitability dimensions, computed from these accounts (e.g., ROA, current ratio, debt-to-equity); and (iii) a single non-financial variable — business activity code, representing the corporation's principal economic sector — included because it is already used informally by tax auditors in case selection.
The inclusion of business activity code responds directly to a specific limitation identified in the recent literature. Baumohl et al. (2025) conclude from their own results that relying solely on financial variables may not be sufficient for effective income tax fraud detection, and explicitly call for future research to identify and integrate more complex indicators — including non-financial variables such as governance, behavioral, or demographic indicators — to increase the predictive power of fraud detection models. Business activity code constitutes exactly this kind of non-financial indicator. Unlike governance, behavioral, or demographic data, however, it requires no new data collection: it is already recorded as part of standard taxpayer registration, making it a practical first candidate for extending a purely financial feature vector. While industry-type variables have been used as predictive features in general financial statement fraud detection (Abdul Rahman et al., 2020) and in sector-segmented tax fraud models as a dataset-splitting criterion (Yang, 2025; Baumohl et al., 2025), business activity code has not, to our knowledge, previously been incorporated as an individual predictive feature within a classifier's own feature vector in the tax evasion detection literature.
The complete feature list with abbreviations is provided in Table 3.
4.3. Data Preparation
The initial datasets were constructed by consolidating six source tables from the tax administration's database: Document, Taxpayer, Tax_Account, Enterprise, Audit_Case, and Audit_Plan, from which 13 balance-sheet variables, 8 income-statement variables, and 1 taxpayer-identification variable (later dropped) were extracted, along with the post-audit tax recoveries used to derive each case study's target variable. Financial ratios were then computed from these accounts. After removing duplicate and noisy instances, the final SME dataset comprised 4,063 audited financial statements (drawn from 70,135 declarations across 22,688 audit plans), and the final large-taxpayer dataset comprised 1,903 audited financial statements (drawn from 5,184 declarations across 2,358 audit plans).
4.4. Modeling Approach
Because no single machine learning algorithm performs best across all data mining tasks (Witten & Frank, 2011), ten classification algorithms available in WEKA were evaluated for each case study: Random Forest (RF), J48 (Decision Tree C4.5 Algorithm), Decision Table (DT), PART, IBk (k-nearest neighbors), Logistic Regression (LR), SMO (support vector machine), Multilayer Perceptron (neural network), BayesNet, and Naïve Bayes. Model performance was assessed using stratified 10-fold cross-validation, which reduces the risk of overfitting to any single train-test split while preserving each class's proportion across folds, which is an important safeguard given the class imbalance present in each case study's dataset (Kohavi, 1995).
Moreover, SME Selection goes a step further, comparing a generic classifier trained on the full, pooled SME dataset — referred to hereafter as the generic dataset — against classifiers trained separately for each of the SME population's major economic sectors. Based on the business activity code feature, the SME dataset was partitioned into four sector-based groupings — Manufacturing (317 instances), Sales (1,057 instances), Services (1,687 instances), and Real Estate (636 instances). The remaining instances comprised energy production and other small, heterogeneous business-activity codes too fragmented individually to support reliable sector-specific modeling.
4.5. Evaluation
All five measures identified in the Knowledge Base — accuracy, recall, precision, F-score, and the ROC curve — were adopted in this study's evaluation framework, with accuracy designated as the primary metric and the F-measure as the secondary metric. Accuracy reports the overall proportion of correctly classified cases, offering the most direct, interpretable measure of classifier performance for tax administration decision-makers. The F-measure serves as the secondary metric (Bekkar et al., 2013), since it jointly captures precision and recall and is not inflated by majority-class prediction, providing an important check on accuracy specifically where class imbalance could otherwise make a weaker classifier appear stronger than it is. Precision and recall are reported alongside both metrics, and the Area Under the ROC Curve (AUC) is reported for the best-performing classifier in each case, since precision, recall, and AUC together reveal the specific error trade-offs — false negatives (missed evaders) versus false positives (wasted audit resources) — that are material to audit planning but are not visible from accuracy or F-measure alone.
4.6. Feature Selection
A common problem that arises while undergoing data mining projects is high feature dimensionality, also referred to as the “curse of dimensionality”. High feature dimensionality can subject the model to over-fitting (Tang et al., 2014). Feature selection aims to reduce the dimensionality of the data by eliminating irrelevant or redundant features in a dataset, which in turn allows an easier understanding of the data, improves the performance of the model, and allows reducing the storage and time needed for the data mining process (Guyon & Elisseeff, 2003; Hall & Holmes, 2003). Correlation Feature Evaluation evaluates the features by measuring the correlation between each feature and the target class based on Pearson’s correlation method (Gnanambal et al., 2018).
Following the initial classifier comparison on the full 41-feature vector (Section 4.4), feature selection procedure was applied to identify a reduced, higher-performing feature subset for each case study's best-performing classifier. Features were first ranked by their correlation with the case study's target variable. Starting from the complete 41-feature set, features were then removed one at a time in ascending order of correlation strength — eliminating the weakest-correlated feature first — with classifier accuracy re-evaluated using stratified 10-fold cross-validation after each removal. The feature subset yielding the highest cross-validated accuracy across this backward elimination sequence was retained as the final feature set for each case study.
5. Results
5.1. SME Selection
5.1.1. Generic Model
The generic dataset comprised 2,587 compliant and 1,476 non-compliant SME cases. Figure 4 compares the performance of the ten classification algorithms tested on the full 41-feature vector. Random Forest achieved the highest accuracy (81.9%) and F-measure (74.5%) among the ten algorithms tested, with a precision of 76.5% and a recall of 72.6%. Figure 5 shows the corresponding ROC curve for the Random Forest classifier, with an AUC of 0.89.
5.1.2. Sector-Specific Models
The generic dataset was partitioned by business activity code into four sector-based groupings — Manufacturing (317 instances), Sales (1,057 instances), Services (1,687 instances), and Real Estate (636 instances) — together with a residual Others category (366 instances) too small and heterogeneous to model independently. The ten algorithms and stratified 10-fold cross-validation procedure applied to the generic model (Section 5.1) were subsequently applied within each of the four modeled sectors (Table 5, Table 6, Table 7 and Table 8).
Random Forest achieved the highest accuracy in every sector, though the margin separating it from the nearest competing algorithm varied considerably. In Manufacturing (Table 4), it reached 85.17% accuracy and 77.3% F-measure (precision = 80.0%, recall = 74.8%), with IBk (82.9% accuracy) and MLP (82.6% accuracy) trailing closely behind — the narrowest competitive field observed among the four sectors. In Sales (Table 5), Random Forest led at 82.02% accuracy and 78.0% F-measure (precision = 79.8%, recall = 76.2%); BayesNet recorded the highest recall in this sector (82.1%) but at a comparatively low precision (73.1%), reflecting a markedly different error profile from Random Forest's more even balance. In Services (Table 6), Random Forest's lead widened: 81.6% accuracy and 72.7% F-measure (precision = 74.2%, recall = 71.3%), against a next-best accuracy of 77.77% (Decision Table) — the largest first-to-second-place gap recorded across the four sectors. In Real Estate (Table 7), Random Forest again led (80.18% accuracy, 70.0% F-measure; precision = 75.0%, recall = 65.6%), with J48 and BayesNet tied on accuracy (75.78%) but diverging on F-measure (64.7% and 67.7%, respectively).
Figure 5, Figure 6, Figure 7 and Figure 8 present the corresponding ROC curves for Random Forest in each sector, with AUC values of 0.910 (Manufacturing), 0.896 (Sales), 0.892 (Services), and 0.866 (Real Estate). All four exceed the 0.5 chance baseline by a wide margin, with Manufacturing showing the strongest discriminative performance and Real Estate the weakest of the four sectors examined.
5.2. SME Prioritization Case Study
This layer was trained on the subset of 1,476 positive-yielding SME cases, of which 959 produced a tax recovery at or above the specified threshold and 517 fell below it. Figure 8 compares classifier performance. As illustrated in Table 8, Random Forest achieved the highest accuracy (71.5%) and F-measure (80.2%), with a precision of 73.2% and a recall of 88.6%. Figure 10 shows the corresponding ROC curve for Random Forest, with an AUC of 0.7439.
Figure 9.
The ROC curve of the Random Forest Classifier, SME Prioritization, full feature set.

5.3. LT Selection & Prioritization Case Study
Of the 1,903 large-taxpayer cases, 969 produced a tax recovery at or above the specified threshold and 934 fell below it. As shown in Table 9, Random Forest achieved the highest accuracy (72.83%) and F-measure (73.3%), with a precision of 73.4% and a recall of 73.2%. IBk followed closely (71.78% accuracy, 72.2% F-measure) — a notably tighter margin between the top two algorithms, across all four metrics, than in either SME layer. Figure 11 shows the corresponding ROC curve for Random Forest, with an AUC of 0.805.
5.4. Correlation-Based Feature Selection
Table A1 reports the feature subset selected by correlation-ranked backward elimination for each dataset, alongside classifier accuracy before and after selection. Feature selection improved accuracy in every dataset examined, with gains ranging from 0.11 percentage points (Positive Yielding) to 0.94 percentage points (Manufacturing), while reducing the feature set from 41 to between 30 and 36 variables depending on the dataset. Several features recur across nearly every selected subset — Turnover (T), Cost of Sales (CoS), Gross Profit (GP), Operating Expenses (OEXP), and Input Tax Payable (InTaxPay) — while business activity code (BAC) is retained in six of the seven datasets, dropped only for Manufacturing.
6. Discussion
6.1. Discussion of Empirical Findings
SME Selection. Random Forest reliably distinguished compliant from non-compliant SME taxpayers using verified audit outcomes, achieving 81.9% accuracy and a 74.5% F-measure on the full feature vector (AUC = 0.892). Correlation-ranked feature selection then improved this further, to 82.3% accuracy and 74.9% F-measure, while reducing the feature set from 41 to 36 variables — the first of several instances in this study where a smaller, more parsimonious feature set outperformed the full financial declaration, a finding discussed more fully below. This result is notable less for its magnitude than for its balance: precision (76.5%) and recall (72.6%) are sufficiently close that the classifier cannot be characterized as exploiting the dataset's class imbalance (2,587 compliant vs. 1,476 non-compliant, a ratio of approximately 1.75:1) by defaulting toward the majority class — a pattern clearly visible, by contrast, in Logistic Regression and Naïve Bayes, whose comparatively high precision paired with markedly weaker recall indicates exactly this kind of imbalance-driven shortcut.
Set against the literature, the most directly comparable benchmark is Baumohl et al. (2025), whose Slovak dataset — like this study's — is built exclusively from verified tax audit outcomes rather than indirectly inferred labels. Their full-sample model achieved an F1-score of 0.75, closely aligned with, and marginally exceeded by, this study's post-selection F-measure of 74.9% — a margin achieved, notably, using fewer features than the full declaration, rather than by adding complexity. From an audit-planning perspective, this balanced error profile supports deploying the model as a general-purpose compliance screen applicable across the full SME population: because neither false positives nor false negatives dominate its behavior, and because it operates on a reduced feature set, its output can be used directly by the Tax Controller without requiring either manual correction or the full financial declaration to be collected and validated in advance.
Sector-Aware Versus Generic Modeling. Sector-specific modeling outperformed the generic benchmark in every sector examined except Real Estate. Manufacturing, Sales, and Services each showed sector-specific accuracy gains after feature selection (86.11%, 82.87%, and 82.8%, respectively, against the generic model's 82.3%), while Real Estate underperformed it (80.66%). Feature selection's contribution here is worth stressing in its own right: every sector-specific model, including Real Estate's weaker one, improved on its own full-feature baseline after selection, and Manufacturing — the sector with the largest performance gain overall — did so using only 32 of 41 features, the most aggressive reduction observed across this study. This pattern cannot be attributed to sector heterogeneity in the conventional sense: Real Estate is, in fact, one of the more categorically homogeneous sectors examined in this study, comprising only two closely related activities: built and non-built property trade. Its weaker performance is more plausibly explained by the distinctive financial structure of property transactions, in which income arises largely from infrequent, high-value asset sales rather than continuous revenue flow, producing greater period-to-period volatility in financial ratios even within a categorically homogeneous population. This interpretation is corroborated by Real Estate's distinct correlation profile, namely: Accounts Receivable, Operating Expenses, and Tax Payable, predominantly balance-sheet and liability-related figures, rather than the Turnover/Cost of Sales revenue-flow pairing dominant across every other sector.
This mixed pattern revealing that sector-specific modeling helped in three of four sectors, and clearly underperformed in one, is itself a direct extension of Baumohl et al. (2025), whose Slovak sector-segmented models likewise outperformed a full-sample benchmark in some sectors but not others, without the authors examining an SME population specifically, applying feature selection at the sector level, or offering a structural explanation for which sectors benefit and which do not. VERITAS's contribution here is threefold: it identifies when sector-specific modeling should be expected to help (tracing Real Estate's shortfall to transaction-driven volatility rather than heterogeneity or sample size); it shows that feature selection compounds this benefit further, since every sector's model improved after selection regardless of whether the sector itself outperformed the generic benchmark; and it demonstrates that this improvement is achieved with a smaller data footprint than the full declaration in every case. From an operational standpoint, these results reframe sector-specific, feature-selected modeling as the default expectation for a tax administration with sufficient per-sector data, rather than a marginal refinement, with the full-feature generic model retained specifically as a fallback for sectors — such as Real Estate — whose transaction-driven financial volatility constrains what a sector-restricted model can reliably capture regardless of feature set.
SME Prioritization. A second predictive layer, applied only to cases the first layer had already flagged as evasion-suspect, effectively separated higher-yield from lower-yield cases (Random Forest: 71.5% accuracy, 80.2% F-measure before feature selection, improving to 71.7% accuracy and 80.3% F-measure after selection retained 36 of 41 features). Though the smallest of the four post-selection gains observed in this study, its consistency matters: feature selection improved performance in every single analysis conducted, without exception, a result that should not be taken for granted, since feature selection can just as easily degrade performance where a dropped variable carried genuine signal. The gap between F-measure and accuracy here is informative rather than a cause for concern: F-measure is computed solely from the positive ("Above Target") class, while accuracy reflects performance across both classes. With recall at 88.6% against precision of 73.2%, the classifier correctly identifies an estimated 850 of the 959 genuinely high-yield cases in this dataset — precisely the profile this layer should exhibit, since a missed high-yield case at this stage is a permanently lost opportunity, whereas an over-flagged lower-yield case still proceeds to audit and recovers a smaller-than-anticipated adjustment rather than none at all.
Because this specific task is not one Baumohl et al. (2025) examine, the more relevant benchmarks are the two studies that attempted comparable threshold-based prioritization directly. Gupta and Nagadevara (2007) reclassified dealers by recovery amount and could not exceed 42% recall, ultimately discarding the resulting model. Chan et al. (2022), applying a structurally comparable two-stage classify-then-prioritize architecture to California state tax records, reported an F1-score of only 0.42 (40.1% precision, 58.7% recall) at the classification stage, though their considerably narrower, single-industry dataset limits the comparability of this figure. Against both precedents, VERITAS's SME prioritization layer achieves a substantially stronger F-measure of 80.3%, suggesting that the combination of a richer, subsequently refined feature vector, exclusively verified audit-based labeling, and a modern ensemble method contributes meaningfully to this improvement. Operationally, this translates into a budgetable expectation: a tax administration adopting this layer should anticipate that a meaningful share of the prioritized SME caseload will fall short of the target adjustment, and should size audit capacity and expected-revenue projections accordingly.
LT Selection & Prioritization. A comparable approach identified large-taxpayer corporations likely to yield the specified adjustment (Random Forest: 72.83% accuracy, 73.3% F-measure before feature selection, rising to 73.7% accuracy and 74.1% F-measure after selection retained 33 of 41 features — the largest post-selection F-measure gain observed among the three original case studies), with precision (73.4%) and recall (73.2%) nearly identical before selection — the most balanced profile among the four analyses conducted in this study. This reflects the LTs population's smaller, more concentrated size (1,903 cases, evenly split between 969 above threshold and 934 below), which supports a genuinely even-handed classifier, in contrast to the deliberately recall-favoring calibration appropriate to SME prioritization's much larger and more imbalanced candidate pool. Measured once more against Baumohl et al.'s (2025) verified-audit F1-score of 0.75, VERITAS's LTs component, after feature selection, closes most of the gap (74.1% vs. 75%) — a remaining shortfall plausibly attributable to this component's smaller training population relative to both Baumohl et al.'s Slovak sample and VERITAS's own SME layers, rather than to any deficiency in the underlying approach, and one that feature selection meaningfully narrowed rather than left unaddressed.
This population's characteristics also account for a further, favorable finding: the margin separating Random Forest from the next-best algorithm, IBk, narrows considerably here (1.05 accuracy points) relative to the SME generic model (2.8 points). Rather than indicating any weakness specific to Random Forest, this convergence between two methodologically distinct algorithms strengthens confidence that the underlying classification signal reflects a genuine property of the data. Operationally, this balanced profile is well matched to the LTs Office's audit economics: given a small, already closely monitored population under dedicated institutional oversight, a model that weighs false positives and false negatives with approximately equal severity is the appropriate calibration. It is also worth noting that this component's raw performance figures, while the lowest nominal figures reported among the four analyses, correspond to the most demanding task examined in this study, and that feature selection's largest proportional gain occurring precisely here — on the hardest task, with the smallest population — underscores its practical value: where data is most limited, a carefully reduced feature set appears to matter most.
6.2. Theoretical Implications
This study contributes to the tax fraud detection literature in a way that is distinct from, and complementary to, both the algorithm-focused studies and the framework-level proposals reviewed in Section 2. Where prior algorithmic studies (e.g., Murorunkwere et al., 2022; Yang, 2025; Baumohl et al., 2025) benchmark classifiers on a single, undifferentiated taxpayer population, and framework-level proposals such as ATAM (Azenzoul et al., 2026) and AATO (Belahouaoui & Alm, 2025) — both, notably, published in this journal — remain conceptual and explicitly call for empirical validation, this study operationalizes a segment-specific architecture and validates it end-to-end on real audit data from a national tax administration.
Beyond architecture, the feature selection results (Table 10) surface a technical finding worth highlighting in its own right. Across all seven analyses — the generic model, four sectors, and both prioritization layers — a consistent core of features recurs in nearly every selected subset: Turnover (T), Cost of Sales (CoS), Gross Profit (GP), Operating Expenses (OEXP), and Income Tax Payable (InTaxPay). Sector- and segment-specific differences instead emerge in which ratios supplement this core — Manufacturing's selected set uniquely includes ROA, EBIT/TA, and GP/TA, while Real Estate's diverges most from every other analysis, consistent with its distinct correlation profile noted in section 6.1.
A closer reading of these same results surfaces a second, more specific pattern concerning the business activity code (BAC) feature. BAC is retained by correlation-ranked feature selection in six of the seven analyses conducted — the generic model, Sales, Services, Real Estate, SME Prioritization, and LTs — and is dropped in exactly one: Manufacturing. This is not coincidental; it reflects a coherent statistical mechanism. BAC's predictive value derives from the variance it carries across a training population's business activities. In the generic model, SME Prioritization, and LTs — none of which are restricted to a single sector — this cross-sector variance is exactly the kind of signal a correlation-based selector would retain, consistent with this study's own premise that sector membership carries evasion-relevant information. What is more revealing is that BAC is also retained within three of the four sector-restricted datasets (Sales, Services, Real Estate). Since each of these datasets is already limited to a single broad sector, BAC's residual predictive value here implies that "Sales," "Services," and "Real Estate" are themselves coarse aggregations of more granular underlying business activity classifications, and that this finer-grained heterogeneity — invisible at the sector level but present in the underlying BAC codes — continues to carry evasion-relevant signal even after sector-level segmentation. Manufacturing's exception is informative rather than anomalous: it suggests Manufacturing, as classified in Lebanon's business activity coding scheme, is comparatively more internally homogeneous — its constituent activities behave similarly enough with respect to evasion risk that finer-grained activity distinctions add no further discriminative power once sector membership is already fixed, consistent with Manufacturing also producing the largest sector-specific performance gain over the generic model.
More broadly, Random Forest's consistent advantage over nine alternative algorithms across every segment, sector, and task examined — spanning sample sizes from 317 to over 4,000 cases — adds to the accumulating cross-country evidence (Murorunkwere et al., 2022; Yang, 2025) that ensemble tree-based methods are a robust default for tax fraud classification. Technically, this advantage likely stems from Random Forest's capacity to combine many moderately informative, individually noisy financial ratios without requiring an analyst to pre-specify their interactions — a property that matters more as the feature space grows (as in this study's 41-feature vector) than in simpler, low-dimensional settings.
6.3. Practical and Operational Implications
Optimizing Audit Resource Allocation. Beyond its methodological contributions, VERITAS's results carry direct fiscal implications for audit resource allocation. Implementing these models can meaningfully lower the opportunity cost inherent in every audit decision, which arises from two distinct error types: auditing a compliant taxpayer wastes scarce audit resources on a case that yields no recoveries (a false positive), while failing to audit an actual evader forgoes government revenue that could otherwise have been recovered (a false negative). Of the two, the latter carries the higher fiscal cost, since uncollected tax revenue represents a direct and often irrecoverable loss to public finances, whereas a wasted audit, while inefficient, does not itself erode the tax base. VERITAS's recall-dominant performance in both prioritization components is therefore particularly relevant from a fiscal standpoint, as it reflects a bias toward minimizing the more costly of the two errors.
Generalizability across tax administrations. While VERITAS is validated using data from the Lebanese Tax Administration, its architecture is designed to generalize to other jurisdictions facing a common structural problem: a large, heterogeneous population of SMEs and a much smaller, higher-value population of LTs, both requiring audit selection under binding resource constraints. First, the model relies only on data virtually any tax administration already collects as part of standard corporate income tax filing, and this is further supported by VERITAS's reliance on SIGTAS — deployed by tax administrations in more than 30 countries (Government of the Virgin Islands, 2023) — meaning any administration already running SIGTAS could, in principle, populate the same feature set without new data infrastructure. Second, the segment-specific architecture reflects a structural distinction in scale and audit economics common across most tax systems, not one specific to Lebanon. Third, the tax-recoveries thresholds are explicit, user-configurable parameters, allowing the core classification approach to be transferred to a different jurisdiction or reused within Lebanon as revenue targets change, without redesigning the underlying architecture.
Operational efficiency through feature selection. Beyond predictive performance, the feature selection results carry a direct operational implication: every analysis retained fewer than 41 features (30–36 depending on sector) while matching or improving on full-feature performance. For a tax administration, this means the data actually required to run VERITAS in production is smaller than the full financial declaration — reducing the data collection, validation, and maintenance burden associated with operating the system, and simplifying the audit trail a Tax Controller would need to justify a flagged case.
A diagnostic for sector-specific deployment. The BAC and sector-performance findings above point to a coherent operational diagnostic: a tax administration considering sector-specific deployment should examine both a candidate sector's sample size and whether BAC remains predictive within it once sector membership is fixed, using both signals jointly to decide where differentiation is worth the added modeling and maintenance cost — rather than adopting or rejecting sector-specific modeling uniformly across its entire taxpayer base.
Deployment guidance by component. Taken together, this suggests a practical adoption sequence: deploy sector-specific, correlation-selected models as the default SME Selection Layer wherever a sector has sufficient scale and internal consistency (as in Manufacturing, Sales, and Services), reserving the generic model as a fallback for sectors like Real Estate; calibrate the SME and LT prioritization thresholds against the administration's own audit capacity and cost data, expecting a recall-favoring error profile for SME prioritization specifically; and revisit all of the above periodically as new audit cycles complete, since the relationships learned here reflect a specific pre-crisis period in Lebanon's economic history (Section 6.4).
Moreover, an important fiscal implication lies in the segment-specific treatment of LTs. Since LTs’ tax revenues account a significant proportion of the country's income tax revenue (See Section 3.2.2), treating LTs as a distinct modeling segment rather than folding them into a generic, pooled classifier alongside SMEs is strongly recommended. Since, given this revenue concentration, even a marginal improvement in audit-case targeting within the large-taxpayer segment yields a disproportionately larger effect on total tax revenue collected than an equivalent improvement applied to the SME population. This reinforces the rationale behind VERITAS's segment-specific architecture: the fiscal return on predictive accuracy is not uniform across taxpayer segments, and audit planning resources and by extension, the priority given to model refinement should be allocated accordingly.
Real Estate as a priority despite weaker model performance. The diagnostic proposed above — using sample size and BAC's residual predictivity to guide sector-specific deployment — should not be read as a recommendation to deprioritize sectors where it counsels against a dedicated model. Real Estate is the clearest case in point: its weaker sector-specific performance reflects genuine within-sector heterogeneity in financial reporting patterns, not an absence of underlying evasion risk. Given real estate's well-documented international profile as a channel for tax evasion and money laundering, and Lebanon-specific evidence implicating the tax code's capital gains treatment and land administration practices specifically, a tax administration should treat Real Estate's comparatively weak classification performance as a signal to invest in richer data and features for this sector — potentially incorporating property registry or transaction-level information beyond the financial statement variables used here — rather than as a signal that the sector is lower priority.
6.4. Limitations
Several limitations should be considered when interpreting these results. First, the case studies rely on financial statements filed for fiscal years 2010–2013, audited between 2014 and 2018 — the most recent complete audit cycle preceding Lebanon's 2019 economic and financial crisis, and the most recent period for which complete, finalized audit outcomes were available at the time of this study. Because the target variable in every case study depends on a completed audit rather than merely a filed return, this reflects a lag between filing and validated ground truth common to audit planning research generally; periodic retraining as newer audit cycles are completed would be a natural and expected part of operational deployment, rather than a correction of a flaw in the current dataset.
Second, the sector-aware comparison (Section 5.2) was restricted to the four SME sectors large enough to support reliable independent modeling; a fifth, heterogeneous "Others" category, spanning energy production and other small, fragmented business-activity codes, was retained only within the generic model. Extending sector-aware modeling to smaller or more fragmented sectors would likely require pooling several fiscal years of data, or a different modeling approach suited to small-sample settings.
Third, as with any supervised approach trained on previously audited cases, VERITAS's classifiers can only learn to detect evasion patterns resembling those the tax administration has already caught — a form of selection bias inherent to this class of methods that future work combining supervised and anomaly-based approaches could help address.
7. Conclusions and Future Works
This paper presented VERITAS, a machine learning-based decision support system designed to improve audit planning by predicting corporate income tax evasion. Motivated by a gap in the tax fraud detection literature between studies that benchmark predictive models in isolation and conceptual frameworks that have yet to be empirically validated, VERITAS operationalizes a segment-specific architecture — a single-layer model for LTs focused on revenue-maximizing case selection, and a novel two-layered model for SMEs that first filters evasion-suspect cases before prioritizing them by expected tax-recovery yield, with sector-aware modeling embedded within its first layer — and validates this architecture end-to-end on real, audit-verified data from the Lebanese Tax Administration (4,063 SME and 1,903 LT financial statements, each described by a 41-feature vector spanning financial accounts, financial ratios, and a novel non-financial business-activity-code feature). Across every segment, sector, and task examined, Random Forest consistently delivered the strongest performance among ten algorithms compared, and correlation-ranked feature selection improved results in every single analysis while simultaneously reducing the required feature set — a pattern of consistency that indicates the underlying classification signal reflects a genuine, generalizable property of tax audit data, rather than an artifact specific to any one dataset, sector, or modeling choice.
Beyond predictive accuracy, this study's principal contribution is architectural and methodological. It demonstrates that a tax administration need not choose between the empirical rigor of verified, audit-confirmed labeling and the practical constraints of limited data infrastructure, since VERITAS is built entirely from a standard corporate income tax declaration and requires no data a tax administration does not already collect. Its threshold-based design ties model output directly to fiscal materiality rather than to an abstract risk score, and its reliance on SIGTAS — an infrastructure already deployed across more than 30 countries — means that what other administrations stand to adopt is the underlying segment-specific architecture itself, not merely a set of parameters trained on Lebanese data. This distinction matters: it reframes VERITAS's contribution from a single validated model toward a transferable design logic, applicable wherever a comparable structural divide exists between a small, high-value population of LTs and a much larger, more heterogeneous population of SMEs.
This study also advances the literature empirically, in ways that extend beyond demonstrating feasibility. Measured against Baumohl et al. (2025), the closest and most methodologically comparable benchmark in this literature by virtue of its shared reliance on exclusively verified audit outcomes, VERITAS performs competitively in SME case selection and substantially outperforms earlier attempts at threshold-based case prioritization specifically — a task this study's results suggest has proven genuinely difficult to solve well, given that both Gupta and Nagadevara (2007) and Chan et al. (2022) reported considerably weaker results on structurally comparable problems. The finding that sector-aware modeling improved on a generic benchmark in three of four sectors examined, while underperforming in the fourth for reasons traceable to the transactional, rather than continuous-revenue, structure of that sector's underlying economic activity, further extends this literature's still-nascent understanding of when, and why, sector-level differentiation should be expected to add value — a question prior sector-aware studies have documented empirically without offering a comparable structural explanation.
Taken together, these findings support a central claim of this paper: that AI-driven audit planning can be operationalized as a deployable, empirically validated, segment- and sector-aware system, built from data a tax administration already holds, rather than remaining either a conceptual proposal awaiting implementation or a predictive exercise disconnected from the operational structure of audit planning itself. In this sense, the contribution of this paper is not a tool built for one country's tax administration, but a demonstration, grounded in real and rigorously validated data, of how such a system can be designed, deployed, and adapted by other resource-constrained tax administrations facing a structurally similar fiscal and administrative challenge.
Several directions for future research follow directly from this study's scope and limitations. First, since VERITAS's architecture is designed to generalize beyond Lebanon, the most direct empirical test of that claim would be applying the same architecture, retrained on local data, within a different national tax administration — ideally one also operating SIGTAS or a comparably structured filing system — to assess whether the segment-specific design premise, and the conditional benefit of sector-aware modeling established here, replicate outside the Lebanese context. Second, while this study evaluated feature importance through correlation-based selection, it did not decompose individual predictions into feature-level contributions. Applying SHapley Additive exPlanations (SHAP) (Lundberg & Lee, 2017) to VERITAS's classifiers would extend this study's feature-selection findings into case-level explainability. Third, business activity code's consistent contribution to predictive performance in this study, read alongside Baumohl et al.'s (2025) call for non-financial indicators in fraud detection, suggests that further non-financial variables warrant investigation. Fourth, Real Estate's distinct outcome in this study — weaker sector-specific performance attributable to transaction-driven financial volatility rather than sector heterogeneity — points to a specific, testable extension: incorporating property registry or transaction-level data (e.g., individual sale dates and values) alongside the annual financial-ratio variables used here, to assess whether richer, transaction-timed features can close the performance gap this study identifies for property-based income. Finally, as newer audit cycles are completed, retraining VERITAS on post-crisis Lebanese data would allow direct assessment of whether the relationships this study identifies hold under different economic conditions, and would help distinguish genuine structural signal from patterns specific to the pre-crisis period examined here.
Author Contributions
Conceptualization, M.K.; methodology, M.K.; software, M.K; validation, M.K, H.H.; formal analysis, M.K, H.H.; investigation, H.H.; resources, M.K.; data curation, M.K.; writing—original draft preparation, M.K; writing—review and editing, M.K and H.H..; visualization, M.K.; supervision, M.K.; project administration, M.K.; funding acquisition, N/A All authors have read and agreed to the published version of the manuscript.
Funding
This research received no external funding.
Institutional Review Board Statement
Not applicable.
Informed Consent Statement
Not applicable.
Data Availability Statement
The administrative tax data used in this study contain confidential taxpayer information and are not publicly available due to legal and data protection restrictions imposed by the Lebanese Tax Administration. Data may be made available by the corresponding author upon reasonable request.
Conflicts of Interest
The authors declare no conflicts of interest.
Acknowledgments
During the preparation of this study, the author(s) used ClaudeAI for the purposes of enhancing English. The authors have reviewed and edited the output and take full responsibility for the content of this publication.
Appendix A
Table A1.
Selected features and classifier accuracy before and after correlation-ranked feature selection, by component and sector.
Table A1.
Selected features and classifier accuracy before and after correlation-ranked feature selection, by component and sector.
| Dataset | Selected Features | Accuracy before FS | Accuracy after FS |
|---|---|---|---|
| Generic | 36 Features Selected: OEXP, GP, T, REC, REC/TA, CoS, InTaxPay, INV/TA, TL+Eq, TA, CASH, FA, CA/TA, PAY, TL, CA, RES, CASH/TA, CL, Eq, CAP, LD, FA/TA, BAC, OP, EBT, SAL/Eq, INV, NP, TL/Eq, TA/Eq, NP/SAL, INV/CL, RE, SAL/TA, LD/TA. | 81.93% | 82.3% |
| Manufacturing | 32 Features Selected: T, CoS, GP, OEXP, CA, INV, REC, CASH, CL, PAY, InTaxPay, REC/TA, INV/CL, TL+Eq, TA, TL, INV/TA, RES, FA, CAP, CASH/TA, OP, LD, EBT, NP, ROA, EBIT/TA, Eq, RE/TA, LD/TA, GP/TA, SAL/TA | 85.17% | 86.11% |
| Sales | 30 Features Selected: T, CoS, GP, OEXP, REC, TA, TL+Eq, CASH, CA, PAY, TL, REC/TA, CL, InTaxPay, INV/TA, CA/TA , FA, SAL/TA , INV, Eq, RES, FA/TA , CASH/TA, RE, CAP, BAC, LD, TA/Eq, TL/Eq , OP | 82.02% | 82.87% |
| Services | 36 Features Selected: T, CoS, GP, OEXP, REC/TA, TA, TL+Eq, CA, PAY, CL, REC, TL, FA, BAC, InTaxPay, CASH/TA, CASH, INV, RES, SAL/Eq, FA/TA, SAL/TA, LD, INV/TA, CA/CL, GP/TA, CAP, Eq, TL/Eq, EBIT/TA, TA/Eq, RE/TA, NP, LD/TA, OP, RE. | 81.6% | 82.8% |
| Real Estate | 35 Features Selected: BAC, FA, REC, CASH, CA, TA, CAP, RES, NP, Eq, LD, PAY, TL+Eq, T, CoS, GP, OEXP, OP, EBT, InTaxPay, CA/CL, NP/SAL, REC/TA, INV/TA, FA/TA, TA/Eq, CA/TA, RE/TA, ROA, SAL/TA, EBIT/TA, TL, CASH/TA, LD/TA, TL/Eq | 80.18 % | 80.66% |
| Positive Yielding | 36 Features Selected: OEXP, TL+Eq, TA, CA, TL, CL, GP, REC/TA, T, BAC, REC, CoS, PAY, INV, CASH/TA, CA/TA, InTaxPay, CASH, FA, FA/TA, INV/TA, CAP, RE/TA, Eq, INV/CL, RE, SAL/TA, NP, EBT, TL/Eq, TA/Eq, ROA, LD, NP/SAL, RES, and OP. | 71.5% | 71.68% |
| LTs | 33 Features Selected: CL, TL, PAY, InTaxPay, REC, TA, T, TL+Eq, GP, OEXP, CA, OP, FA, EBT, CASH, NP, Eq, CoS, RES, INV, CAP, LD, NP/SAL, TL/Eq, TA/Eq, BAC, INV/CL, GP/TA, SAL/TA, INV/TA, RE, RE/TA and CASH/TA. | 72.83% | 74.1% |
References
- Rahman, R.A.; Masrom, S.; Omar, N.; Zakaria, M. An application of machine learning on corporate tax avoidance detection model. IAES Int. J. Artif. Intell. (IJ-AI) 2020, 9, 721–725. [Google Scholar] [CrossRef]
- Adelekan, O.A.; Adisa, O.; Ilugbusi, B.S.; Obi, O.C.; Awonuga, K.F.; Asuzu, O.F.; Ndubuisi, N.L. EVOLVING TAX COMPLIANCE IN THE DIGITAL ERA: A COMPARATIVE ANALYSIS OF AI-DRIVEN MODELS AND BLOCKCHAIN TECHNOLOGY IN U.S. TAX ADMINISTRATION. Comput. Sci. IT Res. J. 2024, 5, 311–335. [Google Scholar] [CrossRef]
- Almeida, M. P. S. B. Classification for fraud detection with social network analysis. Masters Degree Dissertation, Universidade Tecnica de Lisboa, 2009. [Google Scholar]
- Alrasheedi, M.A.; Ijaz, S.; Alrashdi, A.M.; Lee, S.-W. Advanced Tax Fraud Detection: A Soft-Voting Ensemble Based on GAN and Encoder Architecture. Mathematics 2025, 13, 642. [Google Scholar] [CrossRef]
- Ameur, F.; Tkiouat, M. Taxpayers fraudulent behavior modeling: The use of datamining in fiscal fraud detecting Moroccan case. Appl. Math. 2012, 3(10), 1207–1213. [Google Scholar]
- Anjarwi, A.W. The digital transformation of tax audits: how AI, big data, blockchain, and advanced analytics are reshaping tax evasion detection. J. Bus. Anal. 2026, 1–12. [Google Scholar] [CrossRef]
- Antoun, R. Innovating the organizational structure of the Ministry of Finance in Lebanon. In Innovations in Governance in the Middle East, North Africa, and Western Balkans: Making Governments Work Better in the Mediterranean Region; United Nations, 2008; pp. 117–139. [Google Scholar]
- Ariyibi, K.O.; Bello, O.F.; Ekundayo, T.F.; Oladepo, O.I.; Wada, I.U.; Makinde, E.O. Leveraging Artificial Intelligence for enhanced tax fraud detection in modern fiscal systems. GSC Adv. Res. Rev. 2024, 21, 129–137. [Google Scholar] [CrossRef]
- Azenzoul, A.; Mahouat, N.; Vandapuye, S.; Slimane, S.N.; Jbene, M.; Mokhlis, K. From Predictive Accuracy to Algorithmic Justice: Mapping the Multidimensional Impact of AI in Tax Auditing. J. Risk Financ. Manag. 2026, 19, 354. [Google Scholar] [CrossRef]
- Bâra, A.; Lungu, I. Improving Decision Support Systems with Data Mining Techniques. In Advances in Data Mining Knowledge Discovery and Applications; 2012; pp. 397–418. [Google Scholar]
- Baumöhl, E.; Antol, R.; Výrost, T.; Bačo, T. Machine Learning Meets Tax Fraud: Insights from Slovakia. Èkon. Cas. 2025, 73, 181–209. [Google Scholar] [CrossRef]
- Bekkar, M.; Djemaa, H. K.; Alitouche, T. A. Evaluation measures for models assessment over imbalanced data sets. J. Inf. Eng. Appl. 2013, 3(10). [Google Scholar]
- Belahouaoui, R.; Alm, J. Tax Fraud Detection Using Artificial Intelligence-Based Technologies: Trends and Implications. J. Risk Financ. Manag. 2025, 18, 502. [Google Scholar] [CrossRef]
- Bloedorn, E.; Rothleder, N. J.; Debarr, D.; Rosen, L. Relational graph analysis with real-world constraints: An application in irs tax fraud detection. Twentieth International Conference on Artificial Intelligence (AAAI-15), 2005. [Google Scholar]
- Bonchi, F.; Giannotti, F.; Mainetto, G.; Pedreschi, D. Using Data Mining Techniques in Fiscal Fraud Detection. International Conference on Data Warehousing and Knowledge Discovery; LOCATION OF CONFERENCE, COUNTRYDATE OF CONFERENCE; pp. 369–376.
- Chou, T. Performance comparison of three data mining models for business tax audit. Int. J. Sci. Knowl. 2014, 5(7), 8–15. [Google Scholar]
- Cleary, D. Predictive analytics in the public sector: Using data mining to assist better target selection for audit. J. E-Gov. 2011, 9(2), 132–140. [Google Scholar]
- da Silva, L.S.; Carvalho, R.N.; Souza. [CrossRef]
- Dbouk, B.; Zaarour, I. Towards a machine learning approach for earnings manipulation detection. Asian J. Bus. Account. 2017, 10(2), 172–179. [Google Scholar]
- de Fortuny, E.J.; Stankova, M.; Moeyersoms, J.; Minnaert, B.; Provost, F.; Martens, D. Corporate residence fraud detection. KDD '14: The 20th ACM SIGKDD International Conference on Knowledge Discovery and Data Mining; LOCATION OF CONFERENCE, United StatesDATE OF CONFERENCE; pp. 1650–1659.
- de la Feria, R. Tax Fraud and the Rule of Law (18; 02). 2018. [Google Scholar]
- Dias, A.; Pinto, C.; Batista, J.; Neves, M. E. Signaling tax evasion, financial ratios and cluster analysis. Working papers No. 51/2016. OBEGEF- Observatório de Economia e Gestão de Fraude., 2016. [Google Scholar]
- France-Presse. Lebanon to default on debt for first time amid financial crisis. The Guardian, 2020; 7. Available online: https://www.theguardian.com/world/2020/mar/07/lebanon-to-default-on-debt-for-first-time-amid-financial-crisis%0D.
- González, P.C.; Velásquez, J.D. Characterization and detection of taxpayers with false invoices using data mining techniques. Expert Syst. Appl. 2013, 40, 1427–1436. [Google Scholar] [CrossRef]
- Government of the Virgin Islands. Statement by Premier Wheatley on Standard Integrated Government Tax Administration System; 7 September 2023; https://Bvi.Gov.vg/Media-Centre/Statement-Premier-Wheatley-Standard-Integrated-Government-Tax-Administration-Syste. [Google Scholar]
- Gupta, M.; Nagadevara, V. Audit selection strategy for improving tax compliance: Application of data mining techniques. Foundations of Risk-Based Audits. In Proceedings of the Eleventh International Conference on e-Governance, 2007; pp. 28–30. [Google Scholar]
- Hall, M. A. Correlation-based feature selection for machine learning. PhD Dissertation, University of Waikato, 1999. [Google Scholar]
- Hsu, K. W.; Pathak, N.; Srivastava, J.; Tschida, G.; Bjorklund, E. Data mining based tax audit selection: A case study from Minnesota Department of Revenue. In Proceedings of the 15th ACM SIGKDD Conference on Knowledge Discovery and Data Mining, 2009. [Google Scholar]
- Hsu, K.-W.; Pathak, N.; Srivastava, J.; Tschida, G.; Bjorklund. [CrossRef]
- Jihal, H.; Talhaoui, M.A.; Daif, A.; Azzouazi, M. Predictive Analytics as A Service on Moroccan Tax Evasion. Int. J. Eng. Technol. 2018, 7, 90–92. [Google Scholar] [CrossRef]
- Kohavi, R. A study of cross-validation and bootstrap for accuracy estimation and model selection. In Proceedings of the 14th International Joint Conference on Artificial Intelligence (IJCAI’95), 1995; pp. 1137–1145. [Google Scholar]
- Mehta, P.; Mathews, J.; Rao, S.K.V.; Kumar, K.S.; Suryamukhi, K.; Babu, C.S. Identifying Malicious Dealers in Goods and Services Tax. 2019 IEEE 4th International Conference on Big Data Analytics (ICBDA); LOCATION OF CONFERENCE, ChinaDATE OF CONFERENCE; pp. 312–316.
- Murorunkwere, B.F.; Tuyishimire, O.; Haughton, D.; Nzabanita, J. Fraud Detection Using Neural Networks: A Case Study of Income Tax. Futur. Internet 2022, 14, 168. [Google Scholar] [CrossRef]
- Mwanza, M.; Phiri, J. Fraud Detection on Bulk Tax Data Using Business Intelligence Data Mining Tool: A Case of Zambia Revenue Authority. IJARCCE 2016, 5, 793–798. [Google Scholar] [CrossRef]
- OECD. Advanced analytics for better tax administration; 2016. [Google Scholar]
- OECD. Tax administration 3.0: The digital transformation of tax administration. 2020. [Google Scholar] [CrossRef]
- OECD. Tax Administration 2024: Comparative Information on OECD and other Advanced and Emerging Economies; 2024. [Google Scholar]
- López, C.P.; Rodríguez, M.J.D.; Santos, S.d.L. Tax Fraud Detection through Neural Networks: An Application Using a Sample of Personal Income Taxpayers. Futur. Internet 2019, 11, 1–13. [Google Scholar] [CrossRef]
- Pisani, S.; Sisti, P. De. Risk analysis applied to tax evasion using data mining methodology; 2007. [Google Scholar]
- Quinn, T. S.; Flesher, T. K.; Johnson, J. D.; Flesher, F. L. Neural networks : An interdisciplinary tax research methodology. J. Account. Financ. 2014, 14(1), 51–74. [Google Scholar]
- Rad, M.S.; Shahbahrami, A. High performance implementation of tax fraud detection algorithm. 2015 Signal Processing and Intelligent Systems Conference (SPIS); LOCATION OF CONFERENCE, IranDATE OF CONFERENCE; pp. 6–9.
- Rahimikia, E.; Mohammadi, S.; Rahmani, T.; Ghazanfari, M. Detecting corporate tax evasion using a hybrid intelligent system: A case study of Iran. Int. J. Account. Inf. Syst. 2017, 25, 1–17. [Google Scholar] [CrossRef]
- Rahman, S.; Sirazy, M. R. M.; Das, R.; Khan, R. S. An exploration of artificial intelligence techniques for optimizing tax compliance, fraud detection, and revenue collection in modern tax administrations. Int. J. Bus. Intell. Big Data Anal. 2024, 7((3) 7(3).), 56–80. [Google Scholar]
- Seidman, J.K.; Sinha, R.K.; Stomberg, B. Tax audits and the policing of corporate taxes: Insights from tax executives. Contemp. Account. Res. 2025, 42, 1744–1775. [Google Scholar] [CrossRef]
- Serrano, A.; Costa, J.; Cardonha, C.; Fernandes, A.; Júnior, R.S. Neural Network Predictor for Fraud Detection: A Study Case for the Federal Patrimony Department. The Seventh International Conference on Forensic Computer Science; LOCATION OF CONFERENCE, COUNTRYDATE OF CONFERENCE; pp. 61–66.
- Hershauer, J.C.; Simon, H.A. The New Science of Management Decision. Acad. Manag. Rev. 1978, 3, 161. [Google Scholar] [CrossRef]
- Smelser, N. J.; Baltes, P. B. International Encyclopedia of the Social & Behavioral Sciences (11th Edition); 2011. [Google Scholar]
- Vaishnavi, V.; Kuechler, W. Design research in information systems; Association for Information Systems. AIS, 2004. [Google Scholar]
- Wedick, J. L. Looking for a needle in a haystack: How the IRS selects returns for audit. Tax. Advis. 1983, 14(11), 675. [Google Scholar]
- Wirth, R.; Hipp, J. CRISP-DM: Towards a standard process model for data mining. In Proceedings of the 4th International Conference on the Practical Applications of Knowledge Discovery and Data Mining, 2000; pp. 29–39. [Google Scholar]
- Witten, I.H.; Frank, E.; Hall, M.A. Data Mining: Practical Machine Learning Tools and Techniques, 3rd ed.; Morgan Kaufmann/Elsevier: Burlington, NJ, USA, 2011; ISBN 978-0-12-374856-0. [Google Scholar]
- Wu, R.C. Integrating Neurocomputing and Auditing Expertise. Manag. Audit. J. 1994, 9, 20–26. [Google Scholar] [CrossRef]
- Wu, R.-S.; Ou, C.; Lin, H.-Y.; Chang, S.-I.; Yen, D.C. Using data mining technique to enhance tax evasion detection performance. Expert Syst. Appl. 2012, 39, 8769–8777. [Google Scholar] [CrossRef]
- Yu, F.; Qin, Z.; Jia, X.-L. Data mining application issues in fraudulent tax declaration detection. 2003 International Conference on Machine Learning and Cybernetics, LOCATION OF CONFERENCE, ChinaDATE OF CONFERENCE; pp. 2202–2206.
Figure 1.
VERITAS Framework.

Figure 2.
The information systems research framework (adapted from (Hevner et al., 2004)), applied to this study.
Figure 2.
The information systems research framework (adapted from (Hevner et al., 2004)), applied to this study.

Figure 3.
CRISP-DM Methodology (adapted from (Wirth & Hipp, 2000)).

Figure 4.
The ROC curve of the Random Forest Classifier, SME Generic Model, full feature set.

Figure 5.
The ROC curve of random forest-based classifier, Manufacturing Sector.

Figure 6.
The ROC curve of the random forest-based classifier, Sales Sector.

Figure 7.
The ROC curve of the random forest-based classifier, Services Sector.

Figure 8.
The ROC curve of the Random Forest Classifier, Real Estate Sector.

Figure 10.
The ROC curve of the Random Forest Classifier, LT Selection & Prioritization, full feature set.
Figure 10.
The ROC curve of the Random Forest Classifier, LT Selection & Prioritization, full feature set.

Table 1.
Decisions supported by the Data Processing Layer.
| Decision | Business Process | Decision-Maker |
|---|---|---|
| Non-Compliance Detection / Audit Case Selection | Auditing | Tax Controller |
| Audit Case Prioritization | Audit Planning | Tax-Compliance Head of Department |
| Evaluating Audit Planning Strategies | Forecasting and Strategic Planning | Director of Revenue |
Table 2.
Business questions addressed by each case study.
| Case Study | Business Question |
|---|---|
| SME Selection | Which SME corporations exhibit the highest likelihood of income tax evasion? |
| SME Prioritization | Among possible tax-evading SME corporations, which are likely to yield a tax recovery at or above the specified target threshold if audited? |
| LT Selection & Prioritization | Which LT corporations are likely to yield a tax recovery at or above the specified target threshold if audited? |
Table 3.
Feature list and their abbreviations.
| # | Name | Abbreviation |
|---|---|---|
| 1 | Fixed Assets | FA |
| 2 | Inventories | INV |
| 3 | Accounts Receivable | REC |
| 4 | Cash | CASH |
| 5 | Current Assets | CA |
| 6 | Total Assets | TA |
| 7 | Capital | CAP |
| 8 | Retained Earning | RE |
| 9 | Reserves | RES |
| 10 | Net Profit | NP |
| 11 | Equity | EQ |
| 12 | Long-term debt | LD |
| 13 | Accounts Payable | PAY |
| 14 | Current Liabilities | CL |
| 15 | Total Liabilities and Equity | TL+Eq |
| 16 | Total Debt | TD |
| 17 | Turnover | T |
| 18 | Cost of Sales | CoS |
| 19 | Gross Profit | GP |
| 20 | Operational Expenses | OEXP |
| 21 | Operational Profit | OP |
| 22 | Earnings before Taxes | EBT |
| 23 | Income Tax Payable | Tax Payable |
| 24 | Net profit/Sales | NP/SAL |
| 25 | Gross Profit/Total Assets | GP/TA |
| 26 | Net Profit/Total Assets | NP/TA(ROA) |
| 27 | Earnings before Interest and Tax/Total Assets | EBIT/TA |
| 28 | Accounts Receivable to Total Assets/liquidity | REC/TA |
| 29 | Inventories/Total Assets | INV/TA |
| 30 | Fixed Assets/Total Assets | FA/TA |
| 31 | CurrentAssets/Total Assets/liquidity | CA/TA |
| 32 | Cash/Total Assets | CASH/TA |
| 33 | Retained Earnings/Total Assets | RE/TA |
| 34 | Total Assets/Equity | TA/Eq |
| 35 | Long-term debt/Total Assets | LD/TA |
| 36 | Total Liabilities/Equity | TL/Eq |
| 37 | Sales/Equity | SAL/Eq |
| 38 | Sales/Total Assets | SAL/TA |
| 39 | Inventories/Current Liabilities | INV/CL |
| 40 | Current Assets/Current Liabilities | CA/CL |
| 41 | Business Activity Code | Business Code |
Table 4.
Classifier performance — SME Generic Model, full feature set.
| Algorithm | Accuracy | F-measure | Precision | Recall |
|---|---|---|---|---|
| Random Forest | 81.9% | 74.5% | 76.5% | 72.6% |
| BayesNet | 77.3% | 71.7% | 65.5% | 79.2% |
| J48 | 78.4% | 69.6% | 71.1% | 68.1% |
| Decision Table | 78.4% | 68.0% | 73.4% | 63.4% |
| PART | 77.7% | 67.8% | 71.4% | 64.5% |
| IBk | 73.2% | 62.5% | 63.5% | 61.6% |
| MLP | 74.8% | 60.8% | 69.8% | 53.9% |
| Logistic | 76.0% | 58.6% | 78.6% | 46.7% |
| Naïve Bayes | 74.3% | 54.4% | 76.4% | 42.3% |
| SMO | 69.5% | 34.1% | 79.1% | 21.7% |
Table 5.
Classifier performance — Manufacturing Sector, full feature set.
| Algorithm | Accuracy | F-measure | Precision | Recall |
|---|---|---|---|---|
| Random Forest | 85.17% | 77.3% | 80.0% | 74.8% |
| IBk | 82.9% | 74.8% | 74.8% | 74.8% |
| MLP | 82.6% | 73.4% | 76.0% | 71.0% |
| BayesNet | 82.01% | 75.3% | 70.2% | 81.3% |
| Decision Table | 81.38% | 70.9% | 75.0% | 67.3% |
| PART | 81.07% | 73.2% | 70.1% | 76.6% |
| SMO | 81.07% | 67.7% | 81.3% | 57.0% |
| Logistic | 80.44% | 69.3% | 73.7% | 65.4% |
| J48 | 79.8% | 71.2% | 68.7% | 73.8% |
| Naïve Bayes | 79.4% | 69.2% | 70.2% | 68.2% |
Table 6.
Classifier performance — Sales sector, full feature set.
| Algorithm | Accuracy | F-measure | Precision | Recall |
|---|---|---|---|---|
| Random Forest | 82.02% | 78.0% | 79.8% | 76.2% |
| MLP | 80.5% | 75.0% | 80.7% | 70.1% |
| BayesNet | 79.9% | 77.4% | 73.1% | 82.1% |
| Decision Table | 79.4% | 74.4% | 77.6% | 71.4% |
| SMO | 78.4% | 69.3% | 85.4% | 58.3% |
| PART | 78.4% | 74.0% | 74.4% | 73.7% |
| Logistic | 77.9% | 70.8% | 79.2% | 63.9% |
| J48 | 77.5% | 73.6% | 72.3% | 75.1% |
| IBk | 75.6% | 70.1% | 72.0% | 68.3% |
| Naïve Bayes | 74.8% | 62.3% | 83.0% | 49.9% |
Table 7.
Classifier performance — Services sector, full feature set.
| Algorithm | Accuracy | F-measure | Precision | Recall |
|---|---|---|---|---|
| Random Forest | 81.6% | 72.7% | 74.2% | 71.3% |
| Decision Table | 77.77% | 65.4% | 70.1% | 61.2% |
| J48 | 77.5% | 65.4% | 69.4% | 61.9% |
| PART | 76.9% | 65.2% | 67.5% | 63.1% |
| BayesNet | 76.23% | 69.8% | 61.8% | 80.3% |
| Logistic | 74.5% | 52.1% | 73.1% | 40.5% |
| MLP | 74.2% | 61.1% | 63.3% | 59.0% |
| IBk | 73.5% | 60.4% | 62.0% | 58.8% |
| SMO | 72.02% | 39.8% | 75.7% | 27.0% |
| Naïve Bayes | 70.95% | 42.6% | 65.9% | 31.5% |
Table 8.
Classifier performance — Real Estate sector, full feature set.
| Algorithm | Accuracy | F-measure | Precision | Recall |
|---|---|---|---|---|
| Random Forest | 80.18% | 70.0% | 75.0% | 65.6% |
| J48 | 75.78% | 64.7% | 66.5% | 62.9% |
| BayesNet | 75.78% | 67.7% | 63.9% | 71.9% |
| Decision Table | 73.89% | 59.5% | 65.6% | 54.5% |
| IBk | 73.89% | 62.4% | 63.3% | 61.6% |
| PART | 73.58% | 52.8% | 71.2% | 42.0% |
| Logistic | 73.58% | 52.8% | 71.2% | 42.0% |
| MLP | 70.91% | 49.6% | 63.6% | 40.6% |
| Naïve Bayes | 70.75% | 42.6% | 69.0% | 30.8% |
| SMO | 65.88% | 21.1% | 56.9% | 12.9% |
Table 9.
Classifier performance — SME Prioritization, full feature set.
| Algorithm | Accuracy | F-measure | Precision | Recall |
|---|---|---|---|---|
| Random Forest | 71.5% | 80.2% | 73.2% | 88.6% |
| SMO | 64.8% | 78.7% | 64.9% | 99.8% |
| Decision Table | 67.3% | 77.2% | 70.6% | 85.2% |
| PART | 66.7% | 77.0% | 69.8% | 85.9% |
| Logistic | 65.5% | 76.9% | 68.1% | 88.3% |
| MLP | 64.6% | 76.0% | 67.9% | 86.3% |
| J48 | 66.6% | 75.7% | 71.8% | 80.1% |
| BayesNet | 64.4% | 71.7% | 74.1% | 69.4% |
| IBk | 61.4% | 70.2% | 70.4% | 70.0% |
| Naïve Bayes | 42.2% | 26.0% | 77.3% | 15.6% |
Table 10.
Classifier performance — LT Selection & Prioritization, full feature set.
| Algorithm | Accuracy | F-measure | Precision | Recall |
|---|---|---|---|---|
| Random Forest | 72.83% | 73.3% | 73.4% | 73.2% |
| IBk | 71.8% | 72.2% | 72.5% | 71.8% |
| PART | 63.5% | 66.8% | 62.3% | 72.0% |
| J48 | 65.8% | 66.4% | 66.4% | 66.5% |
| Decision Table | 64.4% | 63.9% | 66.1% | 61.8% |
| BayesNet | 62.8% | 61.7% | 64.9% | 58.8% |
| Logistic | 62.5% | 59.3% | 66.4% | 53.6% |
| MLP | 59.6% | 51.2% | 66.5% | 41.6% |
| SMO | 55.0% | 30.5% | 71.5% | 19.4% |
| Naïve Bayes | 63.5% | 66.8% | 62.3% | 72.0% |
Disclaimer/Publisher’s Note: The statements, opinions and data contained in all publications are solely those of the individual author(s) and contributor(s) and not of MDPI and/or the editor(s). MDPI and/or the editor(s) disclaim responsibility for any injury to people or property resulting from any ideas, methods, instructions or products referred to in the content. |
© 2026 by the authors. Licensee MDPI, Basel, Switzerland. This article is an open access article distributed under the terms and conditions of the Creative Commons Attribution (CC BY) license (http://creativecommons.org/licenses/by/4.0/).
Copyright: This open access article is published under a Creative Commons CC BY 4.0 license, which permit the free download, distribution, and reuse, provided that the author and preprint are cited in any reuse.