

Submitted:
01 August 2026
Posted:
03 August 2026
You are already at the latest version
Abstract
In summer 2026, record-low Danube water levels at Paks, Hungary, twice curtailed the Paks Nuclear Power Plant. Using 46 years of daily discharge and water-level records (1981–2026), we test whether the stage–discharge relationship shifted independently of discharge. The published discharge series proves to be a periodically revised rating-curve product, not an independent measurement – confirmed by a 2022 bulk reprocessing and the operator’s own statement that discharge derives from water level – so we reconstruct roughly 11–12 rating epochs, not thousands of daily observations. Water level at a fixed reference discharge (1300 m3/s) has declined 16–17 cm per decade (95% CI −19 to −14), confirmed at a shallower rate (−8.6 to −14.0 cm/decade) in the least circular subset of years. Three comparison stations show a spatially coherent pattern: a stabilized step at the 1992 upstream diversion, a plateaued unrelated historical decline further upstream in Austria, and two stations – including Paks – still declining. The 1980s-vintage rating curve would place the 2026 low-water stage roughly 65 cm higher at the same discharge. We find no evidence that upstream water management retained water during the 2026 drought. Hungary’s current river-basin management plan treats the plant’s thermal discharge as a pressure on the river but, on our review, never the reverse relationship demonstrated here.
Keywords:
Danube River
; stage–discharge relationship
; rating-curve non-stationarity
; riverbed degradation
; channel incision
; hysteresis
; nuclear power plant cooling water
; hydrological drought
; river basin management
1. Introduction
In April 2022, Hungary’s Third River Basin Management Plan (VGT3, adopted by Government Resolution 1242/2022 (IV. 28.)) explicitly named the Paks Nuclear Power Plant among the country’s significant individual pressures on surface waters, on the basis of its cooling-water thermal discharge into the Danube [1]. The plan treats this relationship in one direction only: it regulates how the plant affects the river. It does not consider the reverse relationship, namely whether ongoing changes in the river’s own state might affect the plant. In the summer of 2026, that omission became operationally concrete.
Between late June and late July 2026, the Danube at Paks fell to a series of record-low water levels, reaching a daily-mean stage of −129.5 cm on 31 July (down from −124.4 cm the day before), well below the previous historical minimum of −97 cm (26 October 2018). The Paks Nuclear Power Plant curtailed output twice during this period, for two physically distinct reasons that were often conflated in public discussion, per the plant operator’s own public statements [2,3], corroborated independently by contemporaneous Hungarian and international press reporting [4]. The first curtailment (27 June–3 July 2026, approximately 240 MW) was explicitly attributed by the plant to the statutory 30°C limit on the temperature of cooling water returned to the fully mixed river cross-section; output was restored once measured river temperature fell below the plant’s own, more conservative 29.5°C internal action threshold. The second episode (27–31 July 2026) involved sequential reductions and a full shutdown of one reactor block, attributed instead to the minimum submergence depth required by the cooling-water intake pumps at record-low water levels, that is, a hydraulic/geometric constraint unrelated to thermal compliance. These two constraints, together with the plant’s water volume requirement (which has never been the binding constraint, since Danube discharge has remained orders of magnitude above the plant’s ∼100 m3/s withdrawal even during the 2026 minimum), are frequently treated as a single undifferentiated “water crisis” in public discourse, when in fact they are three physically independent limits governed by different variables and mitigated by different engineering responses.
Figure 1 shows the severity of the 2026 episode directly, alongside the two most relevant prior comparison years.
Figure 2 places this severity against the corresponding discharge record, since water level and temperature are not the same thing as flow volume.
Underlying all three constraints, however, is a more fundamental question that has received comparatively little quantitative attention: is the record-low water level itself a purely climatic phenomenon, or does it partly reflect a longer-term, non-climatic shift in how the river’s water level relates to its discharge? If the stage–discharge (rating) relationship at Paks has moved downward over time, such that a given discharge now produces a lower water level than it once did, then part of the 2026 record is attributable to channel change (e.g., bed incision associated with reduced sediment supply or historical channel regulation) rather than to discharge alone, with direct consequences for how future low-flow risk to water-dependent infrastructure should be assessed.
A growing body of literature documents ongoing Danube channel incision in Hungary, including at or near the Paks reach. Goda, Kalocsa, and Tamás [5] identified riverbed erosion across extended stretches of the Hungarian Danube dating to the early twentieth century, attributing it to a combination of channel regulation, industrial dredging, and reduced sediment load. Tamás et al. [6] and Đorđević et al. [7], analyzing a common ten-gauge, 70-year (1950–2019) hydrological dataset spanning Budapest to Slankamen, report a persistent decline in low-water levels and a corresponding increase in channel cross-sectional area through the Dunaföldvár–Paks–Baja–Mohács reach, including a Paks-specific water-level trend of roughly −20 to −21 cm/decade. Molnár, Baranya, and Török [8], combining a 125-year (1901–2025) gauge record with direct comparison to national riverbed resurveys from 1969, 1997, and 2016, report a Paks-gauge low-water trend of −2.55 cm/yr (whole-period, ≈−25.5 cm/decade) with a steeper recent segment (≈−44.9 cm/decade), and attribute the process to a combination of nineteenth-century channel regulation, twentieth-century dredging, and post-1992 sediment retention following the Gabčíkovo (Bos) barrage diversion upstream. Molnár et al. [8] additionally present an illustrative, though not formally statistical, comparison of six archived rating curves at Dunaújváros (1921–2008), and note explicitly, without further investigation, that their own discharge series is itself derived from stage via a periodically updated rating relationship rather than measured directly.
These studies establish the direction and approximate order of magnitude of the phenomenon convincingly, and, in Molnár et al.’s case, flag the same data-provenance concern this paper resolves. None, however, isolates the discharge-independent component of the trend at Paks specifically with a formally quantified rating-curve reconstruction: the Paks-specific figures in the literature are raw regressions of an annual water-level statistic against time, which conflate any long-term change in the discharge regime itself with genuine change in channel geometry, and none of the four preceding studies subjects its own discharge data to a provenance check of the kind this paper applies. A method that instead asks “how has the water level at a fixed discharge changed over time,” combined with an explicit accounting of how that discharge series was itself produced, separates these components and puts the resulting effect size on a defensible statistical footing.
Nor is the underlying data-quality concern a new, or even recent, observation for this reach. Szilagyi et al. [9], working at Hungary’s National Hydrological Forecasting Center (VITUKI) and using Paks as one of their study stations, developed an alternative stage-forecasting method explicitly because available rating curves for the Hungarian Danube “may be somewhat uncertain,” recommending their approach “for rating-curve falsification.” An even earlier precedent exists: Kovács [10] already discusses the Paks discharge rating curve, transposed from Budapest gauge data, as part of a broader methodological treatment of Hungarian rating-curve construction, more than seven decades before the present study. The problem this paper resolves has been a recognized, if not always explicitly named, feature of Hungarian hydrometric practice at this station for most of the record’s length.
This paper addresses these gaps. Using 46 years of daily discharge and water-level records at the Paks gauge (1981–2026), we first establish how the published discharge series is actually produced, then reconstruct the evolution of the station’s rating relationship accordingly, testing whether, and by how much, the water level at fixed discharge has shifted. We extend the same method to three further stations spanning a range of positions relative to the 1992 diversion, apply the result counterfactually to the 2026 episode, test for evidence of anomalous upstream water retention, and compare the resulting picture against prior literature, an independent bathymetric survey, and Hungary’s current river-basin management framework. Throughout, we restrict our interpretation to the physical mechanism connecting river morphology, discharge, and water level; we deliberately do not weigh in on responsibility, causation attribution to any single upstream actor, or policy response, both because our data cannot support such claims and because the subject remains one of active public debate in Hungary.
The remainder of the paper is organized as follows: Section 2 describes the study reach, comparison stations, and data; Section 3 details the rating-curve provenance diagnostics and the statistical methods; Section 4 presents the results; Section 5 discusses the findings in relation to prior literature, independent corroborating evidence, and the river-basin-management gap; Section 6 concludes.
2. Study Area and Data
2.1. Study Reach
The Danube at Paks (river-km ≈1531) lies within the free-flowing, unimpounded reach between Bratislava/Vienna and the Iron Gate, and specifically within the Budapest–Dunaföldvár–Paks–Baja–Mohács sub-reach previously studied by Tamás et al. [6] and Đorđević et al. [7]. Approximately 320 river-km upstream, the Gabčíkovo hydropower scheme’s Čunovo diversion weir (river-km 1851.75, commissioned unilaterally by Czechoslovakia/Slovakia on 24–25 October 1992 as “Variant C” after Hungary suspended the jointly planned Gabčíkovo–Nagymaros project) diverts approximately 80–90% of the river’s discharge into a power canal, releasing the remainder into the historical channel (Öreg-Duna) through a compensating structure. No impoundment exists on the Danube’s Hungarian section itself; discharge arriving at the Hungarian border passes through to Paks and beyond without local storage capacity.
2.2. Primary Station and Data
Daily mean water level (H, cm, local gauge datum) and discharge (Q, m3/s) for the Paks gauge (station identifier Tsz 549) were obtained from data.vizugy.hu, the public data service of Hungary’s National Directorate General for Water Management (OVF), covering 1980–2026; because a full calendar year of discharge is available only from 1981 onward, the epoch-based trend analysis (Section 3.2) uses 1981–2026. Only 5 days are missing across the full record; 2026 is a partial year (through 30–31 July, n≈210–213 depending on the series). The station, like all Hungarian Danube gauges, is operated under OVF’s national water-management system.
2.3. Comparison Stations
The identical method (Section 3.1–3.3) was applied to three further stations, chosen to span a range of positions relative to the 1992 diversion:
- Rajka (Tsz 1, river-km 1848.3), Hungary, 3.4 km below the Čunovo diversion, on the reduced-flow historical channel; discharge from 1954, water level from 1949.
- Dunaújváros (Tsz 547, river-km 1580.6), Hungary, 49 km upstream of Paks; discharge from 1953, water level from 1900.
- Hainburg an der Donau, Austria (HZB-Nr. 207274, river-km 1883.96, gauge established 1828), 32 km above the diversion and hydraulically isolated from it; discharge 1977–2023, water level 1954–2023. Source: eHYD, Austria’s federal hydrographic data portal.
A separate set of four stations was used for the cross-border water-balance analysis (Section 3.6), which asks a different question (whether flow allocation between the diversion’s two outlets is anomalous during low-flow episodes) and does not require the same multi-decade rating-curve reconstruction: Rajka (as above); Komárom (Tsz 5, Hungary, downstream of where the power-canal outflow rejoins the historical channel; discharge 1980–2026, 2020 unavailable); Bratislava-Devín, Slovakia (SK5127_HYDRO, river-km 1879.8, upstream of Čunovo; source: DanubeHIS, the ICPDR’s Danube Hydrological Information System, merged validated-archive and telemetric records, 2006–2026); and Wildungsmauer, Austria (HZB-Nr. 207373, river-km 1894.72, 43 km above the diversion; discharge 1996–2023 validated archive plus 2025–2026 provisional telemetric data, calendar year 2024 unavailable; source: eHYD). Wildungsmauer’s water-level record was additionally used for a supplementary rating-curve check (Section 4.3) once an unrelated station-side artifact in its early record was identified and excluded. Devín’s suitability as an unaffected reference is not merely assumed: Blaškovičová et al. [11] report that the Čunovo/Gabčíkovo backwater compromised the stage–discharge relation at the downstream Bratislava–Nový Most gauge (river-km ≈1869, 11 km below Devín) to the point that Slovakia’s hydrological service switched its official discharge computation to the upstream Devín station for this reason; that is, Devín’s selection as the operational upstream reference already embeds an institutional determination that it lies outside the backwater’s influence.
2.4. Ancillary Data
Near-riverbed water temperature at Paks (data code 89, an undocumented series identified via the data provider’s own API schema, 2002–2026) supports the thermal case study (Section 3.7). Historical rating-curve and gauge-datum documentation was obtained from OVF’s digitized Vízrajzi Évkönyv (Hydrological Yearbook) archive and public statements from OVF. Independent bathymetric survey data come from the Paks II nuclear power plant environmental impact study [12] (Ch. 11). All raw data and analysis scripts accompanying this study are documented in the project’s data and code repository (see Data and Code Availability, below).
3. Methods
3.1. Data Provenance: Is the Published Discharge Series an Independent Measurement?
Before testing for a stage–discharge shift, we first characterized how the Paks discharge series is actually produced, since the validity of any “discharge-controlled” analysis depends on Q being genuinely independent of H. Three lines of evidence indicate it is not:
- 1.
- Residual scatter. The standard deviation of H about a smoothly fitted function of Q is implausibly small in most years (0.3–0.8 cm; as low as 0.13 cm in 2021–2022) for an independently gauged lowland river, which can exhibit loop hysteresis of tens of centimeters between rising and falling limbs.
- 2.
- Record-level provenance check. Querying the data provider’s own undocumented record-level metadata endpoint (identified via its API schema) revealed that every daily discharge value from 1981 through 2017, that is, 37 years of record, was overwritten in a single bulk operation on 13 April 2022, by one automated account. A genuinely measured 1990 reading would not carry a 2022 modification timestamp; this is direct evidence of retroactive recomputation.
- 3.
- Operator confirmation. OVF states publicly that discharge is “formed from the processed water-level series,” with the stage–discharge relationship reviewed annually by the end of May; OVF reports 700–1100 field gaugings per year system-wide. A separate, dated technical report on the Danube’s 2024 flood [13] states explicitly that the rating curve applied to the Paks reach was revised in 2023 to a three-variable K(H) formulation, replacing the previously used curve: direct, independently dated confirmation of a specific revision event, additional to the 2022 database-reprocessing event described in (2). This is consistent with, and independently confirms, the mechanism inferred from (1) and (2).
Figure 3 (Section 3.3) shows this first line of evidence directly at daily resolution: 2022’s near-deterministic Q–H relationship there is the visual signature of exactly this implausibly small residual scatter, contrasted against 2018, one of the minority of years with genuine, visually apparent hysteresis.
We therefore treat the Paks discharge record as a periodically revised rating-curve product grounded in the authority’s own field gaugings, rather than as a series of independent daily measurements, and design the statistical analysis in Section 3.2–3.3 accordingly. This reframing does not undermine the underlying physical claim (a downward-revised, field-gauging-grounded rating curve is genuine evidence of channel change, arguably stronger evidence than a raw statistical association), but it requires that uncertainty be quantified at the level of rating epochs, not daily observations.
3.2. Rating-Curve Epoch Reconstruction
We fit H as a function of Q using a log-quadratic functional form, selected by AIC over linear and log-linear alternatives. We then apply changepoint detection (the Pettitt test, PELT, and binary segmentation, cross-checked for mutual agreement) to the annual series of H at a fixed reference discharge (Q = 1300 m3/s, chosen for coverage in 45 of the 46 years; 2026, the exceptionally low-flow terminal year, is the one year in which this discharge was not directly observed, so its epoch-mean value involves a modest upward extrapolation from that epoch’s own observed range, symmetric to the downward extrapolation documented for the 2026 counterfactual in Section 4.4) to identify discrete rating epochs. The primary segmentation (PELT, moderate penalty) yields 11 breaks (12 epochs) over 1981–2026. We compute the linear trend across epoch-mean values against epoch mid-year (ordinary least squares, degrees of freedom equal to the number of epochs minus two) and confirm with the Mann-Kendall trend test. As a check immune to any circularity in the changepoint procedure itself, we additionally compute the trend using non-data-adaptive, fixed 5-year calendar bins.
3.3. Hysteresis-Based Circularity Diagnostic
For each year, we compare the residual of H (from the fitted Q relationship) between days of rising and falling discharge using Welch’s t-test. A year with a statistically significant rising/falling-limb separation exhibits behavior inconsistent with H having been computed from Q for that period; a year without one is consistent with Q having been computed from H. We note that even the most clearly qualifying years show hysteresis magnitudes on the order of a few centimeters (one to two orders of magnitude below the tens-of-centimeters benchmark used in Section 3.1 to characterize genuinely independent gauging), so this diagnostic should be read as ranking years by their relative freedom from the rating-curve circularity described above, not as identifying years with fully independent daily measurement. We use the subset of years classified as high-hysteresis (p < 0.05, a threshold at which p < 0.01 yields an identical classification) as an additional, circularity-resistant test of the epoch-level trend.
Figure 3 illustrates the diagnostic itself with two contrasting years: 2022, in which rising- and falling-limb days fall on an indistinguishable curve (the same near-deterministic pattern cited in Section 3.1 as direct visual evidence for that section’s implausibly-small-residual-scatter claim), and 2018, in which they visibly separate.
3.4. Multi-Station Replication
We apply the method of Section 3.2 and Section 3.3 to the three comparison stations described in Section 2.3, to test whether the Paks result reflects a spatially specific pattern relative to the 1992 diversion or a general upstream phenomenon unrelated to it.
3.5. Counterfactual Application to 2026
Using the fitted rating curves from the earliest (1982–1986) and most recent (2022–2026) epochs, we compute the stage that each day’s actual 2026 discharge would have produced under the earliest-epoch curve, and compare this counterfactual value to the stage actually observed.
3.6. Cross-Border Water Balance
To test for evidence of anomalous water retention in the Slovak reach during low-flow episodes, we cross-correlate discharge at Rajka (the historical-channel release immediately below the diversion) against total downstream flow at Komárom (after the power-canal outflow rejoins) and, separately, against upstream reference stations (Devín; Wildungsmauer; see Section 2.3 on Devín’s documented independence from the Čunovo backwater). Travel-time lags are estimated by cross-correlation (1–3 days, station-pair dependent) rather than assumed. We compute the historical (post-1993) baseline relationship between these series and test whether the low-flow episodes of 2018, 2022, and 2026 deviate from it, conditional on that day’s actual upstream discharge (since the compensating-flow regime is expected to act as a floor rather than a fixed proportion).
3.7. Thermal Case Study
We apply the previously derived heat-balance relationship for the plant’s four operating blocks, (from , where P = 4000 MW is the plant’s aggregate waste-heat rejection to the river at full load across four blocks, = 1000 kg/m3, and c = 4186 J/(kg·K)), to observed 2026 discharge and measured near-riverbed water temperature, and compare the predicted fully mixed cross-section temperature against the plant’s own reported curtailment episodes and internal action threshold.
4. Results
4.1. Rating-Curve Epoch Structure and the Core Stage–Discharge Shift
The 12-epoch segmentation shows stepping from approximately 61 cm (1982–1986) to approximately −2 cm (2022–2026), in discrete steps of roughly 3–12 cm rather than a smooth trend, with two brief upward reversals (1996–1998, 2022–2026) visible at this finer resolution rather than a monotonic decline. Across four alternative segmentation choices, namely the primary 12-epoch segmentation, a conservative 6-epoch (Pettitt) segmentation, a fine 14-epoch (binary segmentation) partition, and the non-adaptive fixed 5-year calendar bins, the trend converges on −16 to −17 cm/decade (95% CI approximately −19 to −14 cm/decade). Significance ranges from (Mann-Kendall, applied to the coarser 6-epoch segmentation, where it also reaches its maximum attainable rank agreement, , because the two brief reversals are absorbed into the same epoch as the surrounding decline at that resolution and are not separately visible) to (ordinary least squares on the finer 14-epoch partition, which has more points to estimate the trend against). This is the headline effect size; it explicitly supersedes any daily-observation-count-based estimate, for the reasons given in Section 3.1. A post-1992 sub-window (1993–2026) shows a modestly steeper, directionally consistent rate (−17 to −19 cm/decade) with overlapping confidence intervals relative to the full-period estimate: a consistent signal, not a sharp discontinuity.
Figure 4 shows the epoch structure underlying this result directly: the twelve detected epochs and their per-epoch mean values, plotted against the changepoints that define them.
Figure 5 shows the same shift directly as a rating curve rather than as an abstract trend statistic: the fitted stage–discharge relationship for three representative epochs from the same 12-epoch segmentation, plotted together on one panel.
4.2. Hysteresis-Subset Robustness Check
Thirteen of 46 tested years (1981–2026) qualify as high-hysteresis: 1987, 2007, 2013, 2014, 2016–2020, and 2023–2026. These years cluster heavily in 2013–2026 (11 of 13); 1987 and 2007 qualify formally but with small hysteresis magnitude (<0.4 cm), likely detectable only due to large daily sample size. The trend restricted to this subset is −14.0 cm/decade (95% CI −16.3 to −11.7, , OLS; Mann-Kendall ), closely consistent with the full-record estimate. A conservative sensitivity subset (large-effect-only, |hysteresis| > 2 cm, n = 10, spanning only 2013–2026) gives a shallower but still clearly significant −8.6 cm/decade (95% CI −14.2 to −3.1, ). Leverage checks (dropping 1987 and/or 2007 individually) confirm the direction and significance are robust across every configuration tested; only the magnitude varies with how much pre-2013 data is included. Because this subset is specifically the portion of the record least susceptible to the rating-curve circularity described in Section 3.1, it provides supporting evidence, from years relatively less exposed to that circularity, that the decline through 2013–2026, the period most relevant to the 2026 record low, is real.
Figure 6 shows this robustness check directly against the full-record trend.
We separately verified that gauge-datum relocation is not a competing explanation, using an internal-consistency check rather than a policy statement: the Paks II environmental impact study’s own multi-vintage rating-curve figure (1903–2011) shows the curves shifting downward and rightward in the low- and medium-water range while the uppermost flood-stage range is unchanged, explicitly attributed there to channel-bottom subsidence rather than a datum change [12] (Ch. 11, Fig. 11.7.3-15/16). A gauge-datum relocation would shift the entire stage record uniformly, including flood levels; the fact that only the low/medium range moved is inconsistent with a datum artifact and consistent with the physical incision documented throughout this paper. This is consistent with our own archival cross-check of Paks’s gauge-datum history, which finds no correction since the 1940s, and with the fixed “0” point (85.38 m above Baltic datum) reported for the Paks watermark post since 1876 in the same source.
4.3. Multi-Station Comparison
Table 1 summarizes the stage–discharge shift results across all four stations, ordered by river-km.
At Rajka, the October 1992 diversion produces an unambiguous, dramatic signature, with discharge falling 75–85% and stage falling approximately 230 cm within five days (25–30 October 1992); this signature is completely absent at Paks over the same days, consistent with the disturbance’s local, immediate hydraulic origin rather than with instantaneous propagation 320 km downstream. Once this transient is excluded, the post-1995 Rajka record shows no further significant trend.
Figure 7 shows this contrast at daily resolution.
The same contrast is visible immediately upstream of the diversion. The Bratislava/Nový Most discharge record analyzed in Section 5.5 (17 km above Čunovo) shows no significant break of any kind at 1992 across 124 years of annual-mean discharge (Pettitt test, for the single most likely changepoint location anywhere in 1901–2024). Using a wider daily-resolution event window than Table 1’s five-day comparison above (1–24 October vs. 25 October–7 November 1992), Bratislava’s discharge rises by approximately 60% over the same days that Rajka’s falls by approximately 70%: an unrelated upstream rain event at Bratislava coinciding, by chance, with the diversion’s onset at Rajka. The diversion’s hydraulic signature is therefore confined to its immediate downstream vicinity in both directions from the structure, corroborating the interpretation above from an independent station pair and event window.
At Hainburg, no dominant changepoint occurs at the October 1992 boundary (a small, borderline-significant step of −9.6 cm, , is present but dwarfed by larger breaks elsewhere in the record (1987/88, five years before the diversion, and 1999/2000, seven years after it)), consistent with Hainburg’s hydraulic isolation from the diversion. Hainburg’s own decline instead coincides in timing with the documented Austrian Danube hydropower cascade upstream (ten run-of-river plants ≥10 MW, commissioned 1956–1999, from Jochenstein through Freudenau) [14]; having front-loaded through that construction period, it has not declined further since Freudenau’s 1999 commissioning. Its hysteresis signature differs qualitatively from Paks’s: Hainburg shows genuine, statistically strong hysteresis through most of 1977–2001, converging to Paks-like near-zero hysteresis only after approximately 2006, which is the reverse of what would be expected if Hainburg’s discharge series shared Paks’s rating-curve-derivation pattern throughout. Wildungsmauer, 11 km further upstream than Hainburg and equally isolated from the diversion, shows the same-direction decline at roughly half Hainburg’s magnitude once an unrelated station-side artifact (an abrupt, corroborated-in-both-Q-and-H step between 2003 and 2004, almost certainly a local datum or rating-table discontinuity rather than a physical signal) is excluded and the analysis restricted to its internally homogeneous 2004–2023 window; given the shorter, interrupted record, this is best read as directionally consistent corroboration rather than a fifth independently weighted estimate.
Dunaújváros requires a caveat similar to the one already applied to Paks’s own headline estimate (Section 4.2). A provenance check analogous to the one performed for Paks found that Dunaújváros’s entire 1954–2001 archive was migrated in a single database event in 2013, ruling out a later bulk rewrite as the explanation for the shift in hysteresis behavior around 1997–1998 (unlike the mechanism identified for Paks), and indicating that whatever changed in the underlying measurement or reporting practice at that time was already present in the originally published record, plausibly connected to the 1997 national riverbed resurvey or the contemporaneous transition to acoustic Doppler gauging. Restricting the epoch-level trend to this more recent, less circular 1998–2026 window yields −14.4 to −17.5 cm/decade: roughly half the full-record estimate, and statistically indistinguishable from Paks’s own −16 to −17 cm/decade, rather than the steeper figure the full-record estimate alone would suggest.
4.4. Counterfactual Application to 2026
Applying the 1982–1986 epoch’s fitted rating curve to the discharges actually observed in 2026 yields a median counterfactual stage 65.9 cm higher than what was actually observed across the full 2026 record (210 days through 30 July), and 65 cm higher specifically on the 27–31 July hydraulic-shutdown dates. The implied shift is directionally consistent, and of comparable magnitude, at 2026’s much lower discharge range (Q = 600–900 m3/s: −12 to −18 cm/decade depending on the fitted functional form, bracketing the Q = 1300 headline estimate), but because the 1982–1986 epoch contains no observed daily discharge below 902 m3/s, the counterfactual values for the lowest-discharge days of 2026 (699–825 m3/s) are extrapolations beyond that epoch’s observed range, not directly observed comparisons. No documented threshold exists for the minimum submergence depth that triggered the plant’s cooling-water intake pump safety cutoff during the 27–31 July episode; we therefore report the counterfactual stage difference on its own terms and do not claim it would have averted that specific episode. For context, this 65 cm shift is a substantial fraction of the plant’s own most conservative design margin: the Paks II environmental impact study’s hydrology chapter establishes a 1-in-20,000-year design low-water level of 83.78 m above Baltic datum at the Paks watermark post (Gaussian, Gamma, and Gumbel distribution fits to the homogeneous 1965–2012 low-water series, with the Gaussian fit adopted as the design basis, discussed further below) [12] (Ch. 11). The actual 2026 minimum (−129.5 cm on the local gauge, equivalent to 84.09 m above Baltic given the gauge’s fixed 85.38 m datum) remained only about 30 cm above this threshold: a record event approaching within roughly a third of a metre of a criterion explicitly sized around a 1-in-20,000-year return period, and doing so well before accounting for the further channel subsidence this same report’s own forecast projects through 2120 (−0.4 to −2.3 cm/yr under its logarithmic-to-linear scenario range, mean of methods −1.3 cm/yr), which will continue eroding that margin independent of any further hydrological extreme.
Figure 8 shows the counterfactual result at daily resolution across the full 2026 record, rather than as a single summary statistic.
Figure 9 places this margin in a longer temporal context, plotting the observed annual low-water stage at Paks (1981–2026) against the same design line and the environmental impact study’s own three subsidence-forecast branches (logarithmic, mean-of-methods, linear), anchored at the observed 2012 value, the assessment’s own forecast baseline year.
A Gaussian distribution was fitted to the 1981–2012 annual low-water minima; this is a shorter window than the assessment’s own official 1965–2012 low-water (KV) statistic, and it derives from this paper’s own daily-mean water-level reconstruction rather than from that statistic, so the exercise is an order-of-magnitude reproduction rather than an exact replication. The fit gives the 2018 minimum (−97 cm) a nominal return period of roughly years and the 2026 minimum (−129.5 cm) roughly years: two nominally rare events eight years apart, occurring six and fourteen years respectively after a fit window that closed in 2012. This is a stage/geometry finding, not a discharge one: the lowest daily discharge observed at Paks in 2026 (≈699 m3/s) remained above the same report’s own 1-in-20,000-year design low-water discharge rate for this profile (579 m3/s at the Danube ∼1530 river-km/Paks cross-section [12] (Ch. 11)), so 2026 does not contradict the discharge design basis, even as the stage statistics computed from the non-stationary rating relationship documented in this paper approach it. Repeating the fit with a Gumbel distribution (which the same report found fit the underlying 1965–2012 low-water data better, yet retained the Gaussian fit “to be on the safer side” [12] (Ch. 11, p. 94)) confirms, on our own data, that the Gaussian choice is indeed the more conservative one at this station’s extreme low-water tail, though the Gumbel-based return periods for the same two events are correspondingly many orders of magnitude larger, underscoring how sensitive nominal return-period statements are to distributional choice at this sample size.
4.5. Cross-Border Water Balance
We find no evidence of anomalous upstream (Slovak) water retention during any of the three low-flow episodes examined. In 2022’s July–August drought, the old-bed (Rajka) flow share was significantly elevated relative to its flow-conditional historical norm (), not depressed; 2018 tracked close to the historical norm (); the 2026 estimate showed the same elevated-share pattern. This is corroborated by a direct primary source: OVF reported Gabčíkovo operating on only 1 of 8 turbines in late July 2026, with old-bed flow (≈400 m3/s) exceeding the power-canal tailrace flow (≈250 m3/s), a reversal of the typical ratio.
Figure 10 shows this elevated old-bed share directly, across the full seasonal cycle and against the historical envelope.
A dedicated check of winter 2025–2026 addresses a storage-and-release explanation directly: inflow at both true-upstream stations was itself unusually low that winter ( relative to the historical December–February baseline, among the lowest of the last eight winters), leaving no surplus to bank.
Figure 11 shows this winter comparison directly, alongside all other winters in the two true-upstream stations’ overlapping record.
The same no-surplus-to-bank signature holds on the Alpine side of the wider catchment, an unrelated hydropower system: winter 2025–2026 inflow was also anomalously low, not high ( to ), at the Salzach (Burghausen) and Inn (Wasserburg), tributaries carrying major seasonal-storage hydropower infrastructure, arguing against a reservoir-timing explanation there as well [15]. The elevated old-bed share observed in spring–summer 2026 instead reflects a reallocation within an already-depleted total flow budget: old-bed release rising relative to inflow while total downstream flow (Komárom, combining both channels) stays at its own historical baseline (), consistent with reduced power-canal routing (fewer turbines operating) rather than with the release of a previously stored volume. Independently, genuinely upstream stations confirm the 2026 deficit originates above the diversion: July 2026 mean discharge was 926 m3/s at Devín (32% below the prior 2007–2025 minimum) and 873 m3/s at Wildungsmauer (31% below the prior 1996–2023 minimum). Pavla Pekárová of the Slovak Academy of Sciences’ Institute of Hydrology characterized the 2026 low flow at Bratislava/Devín, where discharge records extend to 1876, as unprecedented in that record: “Takýto nízky prietok Dunaja v stanici Bratislava/Devín v mesiaci júl sa v histórii pozorovaní od roku 1876 ešte nevyskytol” [“Such a low Danube discharge at the Bratislava/Devín station in the month of July has not occurred in the history of observations since 1876”] [16]. The Devín–Paks and Wildungsmauer–Paks discharge relationships during 2026 are statistically indistinguishable from their historical baselines ( and respectively, full-year; both smaller in magnitude on the lowest-flow days specifically): the 2026 deficit propagates from the true upstream reference to Paks proportionally, with no evidence of anomalous gain or loss along the reach.
Figure 12 shows this proportional propagation directly for Wildungsmauer, the more distant of the two true-upstream reference stations, across the full 2026 record.
4.6. Thermal Case Study
The heat-balance model predicts a peak fully mixed cross-section temperature of 29.50°C on 1 July 2026, matching the plant’s own reported 29.5°C internal action threshold almost exactly and remaining just 0.5°C below the 30°C statutory limit, and aligns with the reported 27 June–3 July curtailment/restoration dates to within approximately one day. For the 27–31 July episode, the model correctly predicts no approach to the 30°C threshold (predicted mixed temperature ≈25–27°C), consistent with the independently reported hydraulic (pump-submergence) rather than thermal cause of that specific episode.
Figure 13 shows the full backtest across both 2026 episodes, with measured discharge shown alongside.
5. Discussion
5.1. A Degradation Wave, Not a Uniform Trend
The four-station comparison (Section 4.3) resolves an ambiguity that a single-station result cannot: whether the Paks decline reflects a phenomenon specific to the Hungarian, diversion-affected reach or a generic feature of Danube hydrometry. Both extremes are ruled out. Hainburg and Wildungsmauer, hydraulically isolated from the 1992 diversion, nonetheless show real declines in the same direction as Paks; the phenomenon is consequently not unique to the diversion-affected reach. But their decline is front-loaded to 1977–1996 and has been flat for roughly 26 years, coinciding with the documented completion of the upstream Austrian hydropower cascade in 1999 (Freudenau, the tenth and final plant in the chain); Rajka, immediately below the 1992 diversion, shows one abrupt step at the moment of diversion and has otherwise been stable since 1995. Paks and Dunaújváros, by contrast, are still declining through the most recent years of record. Dunaújváros’s full-record effect size is nominally larger than Paks’s, but, as with Paks’s own headline estimate, the most recent, least circularity-affected portion of its record (1998–2026) yields a rate statistically indistinguishable from Paks’s, so this comparison should be read as “both still actively declining at a broadly similar recent rate,” not as a clean, monotonically increasing gradient of decline rate with proximity to a single disturbance.
Figure 14 makes this shape contrast explicit in a way Table 1’s summary effect sizes cannot: the two stations reach a similar total magnitude of decline, but along qualitatively different trajectories.
We are deliberately imprecise above about what “the disturbance” is, because the evidence does not support pinning the wave to a single dated event. The 1992 diversion produces an unambiguous, near-instantaneous signature at Rajka, immediately adjacent to it, but Section 4.1 shows the post-1992 sub-window at Paks itself is only modestly steeper than the full-period trend, with overlapping confidence intervals (a consistent signal, not a sharp discontinuity), and Section 5.2 documents nineteenth-century channel regulation and twentieth-century dredging as independently established, much older causes of incision on this same reach. Read together, the four-station pattern is consistent with a degradation process, set in motion well before 1992 and plausibly compounded rather than initiated by the 1992 diversion, that has already run its course at the two locations closest to (Rajka) or entirely unconnected with (Hainburg, Wildungsmauer) the diversion, while remaining active further along the affected reach (Dunaújváros, Paks). A specific alternative deserves mention here rather than being left for the reader to raise: Section 5.2 notes that twentieth-century dredging was concentrated “particularly on the Dunaföldvár–Uszód section”, that is, on the reach lying between Dunaújváros and Paks, which offers a plausible, more local explanation for why these two stations, rather than any other pairing, show the most active recent decline, independent of any wave-propagation argument. This is not merely qualitative: the Paks II environmental impact study documents approximately 5 million m3 of gravel dredged for industrial purposes from the Dunaföldvár–Uszód section (rkm ∼1536–1557, immediately upstream of Paks), separately from the 1985 halt of industrial dredging on the adjacent 1505–1536 river-km reach, itemized in the same report at 4.97 million m3 over 1997–2013, tapering to near zero by 2011–2013 [12] (Ch. 11, Table 11.7.2-1). The two explanations are not mutually exclusive and our data cannot distinguish between them. The defensible claim from the spatial comparison is therefore narrower than a single named cause: not that the Paks phenomenon is unique in the Danube basin, but that its continuation, past the point where an unrelated, general historical process had already stabilized further upstream, is distinctive and, on current evidence, ongoing.
A separate line of evidence bears on interpreting the 2026 event specifically, though it speaks to a different mechanism than the spatial pattern above: the water-balance analysis of Section 4.5 finds no support for anomalous upstream retention during 2026, or during the 2018 and 2022 comparison droughts. Because no impoundment exists on the Hungarian section of the Danube, this is best read as ruling out one alternative explanation for the 2026 event, rather than as informative about Hungary’s own water security specifically: whatever discharge crosses the border passes through Paks in close to real time regardless of how it was managed further upstream. On the evidence available, 2026 was a genuine, region-wide hydrological deficit reaching the true upstream reference stations, not a downstream-specific or cross-border-management-specific phenomenon.
5.2. Relation to Prior Literature, Mechanism, and Independent Corroboration
The Paks-specific effect size obtained here (−16 to −17 cm/decade, discharge-controlled) is smaller than raw, discharge-uncontrolled low-water trend estimates reported for the same or comparable stations: Goda et al. [5] (≈−17.4 cm/decade, 1901–2005, from their Figure 6), Tamás et al. [6] and Đorđević et al. [7] (≈−20 to −21 cm/decade, 1950–2019), Molnár et al. [8] (−25.5 cm/decade whole-period, 1901–2025), and the Paks II environmental impact study’s own linear fits to raw annual low- and medium-water stage at Paks over 1965–2012, independently of any of the above (−23.3 and −24.3 cm/decade respectively) [12] (Ch. 11, Table 11.7.1-1). This ordering is broadly consistent with discharge-conditioning removing a hydrological component present in the raw trend estimates, though period and method differences are fully confounded across these studies (in particular, Goda et al.’s near-identical figure spans a different and longer window than ours) and this comparison should be read as a consistency check on order of magnitude, not as validation of a clean methodological hierarchy. Molnár et al. [8] is the closest prior work: Paks/Dunaföldvár-named, grounded in national bed resurveys (1969, 1997, 2016) that show the Adony–Paks reach as the most intensely incising on the Hungarian Danube (average −5.5 cm/yr, maximum −10.3 cm/yr between survey years); their own Q-h rating-curve comparison is, however, illustrative only, conducted at Dunaújváros rather than Paks, without formal changepoint or interval estimation, and without the provenance diagnostics applied here despite their explicit acknowledgment that their own discharge series shares the same derivation. The present study is therefore best framed not as the first demonstration that Paks-reach channel change is occurring (that is now well established across several independent lines of evidence) but as a Paks-specific, daily-resolution, formally interval-estimated quantification that additionally resolves, rather than merely flags, the rating-curve circularity affecting every discharge-based estimate in this literature, including its own.
On mechanism, the historical (pre-1992) origin of channel incision on this reach is well documented: nineteenth-century channel regulation shortened the river by approximately 40% and roughly doubled the channel gradient, and twentieth-century industrial gravel dredging, particularly on the Dunaföldvár–Uszód section, is independently documented as a contributing cause [12], consistent with Goda et al.’s [5] multi-cause account. Post-1992 sediment retention behind the Gabčíkovo/Čunovo diversion is a plausible additional contributing factor at Paks, though, as Section 5.1 makes clear, the reach-level evidence does not support attributing the entire, still-continuing Paks decline to this single cause. A geomorphologically consistent, opposite-sign signature near the dam itself lends indirect support to a genuine, basin-connected sediment-transport disruption: Blaškovičová [17] (see also [11]) report that, at Bratislava, inside the Čunovo backwater, post-1992 water levels at fixed discharge below 1000 m3/s are more than 2 m higher than before the diversion, an effect that diminishes with increasing discharge and disappears above 8000 m3/s (consistent with a backwater mechanism rather than a channel-wide change). Cross-sectional bed-level monitoring at multiple points across the same profile confirms the sign reversal directly: at one representative shallow-bank location, the bed shifted from an eroding trend of −7.3 cm/yr before 1992 to an aggrading trend of +2.2 cm/yr after (most monitored points across the same profile show the same reversal in direction (pre-dam erosion of roughly 1–7 cm/yr turning to aggradation of 1–6 cm/yr), with the remaining verticals showing their erosion rates shrinking to near zero); this is the expected signature of sediment trapping immediately upstream of a diversion structure, as opposed to sediment starvation far downstream of one.
Independent, non-statistical corroboration for the Paks-reach finding specifically comes from the Paks II environmental impact study [12], which reaches a consistent conclusion from its own 1965–2015 gauge analysis at Dunaföldvár, Paks, and Dombori, attributing the sustained decline in low- and medium-water levels primarily to riverbed subsidence and citing the Danube’s official flood-bed management plan. The same report documents a dedicated repeat bathymetric survey immediately in front of the plant site (38 cross-sections, bimonthly, 2015–2016): during an unusually persistent low-flow period (July 2015–January 2016), the surveyed bed deepened continuously, with lowering exceeding 0.5 m over a significant portion of the reach before medium water arrived. This finding should be read as direct evidence that the bed at Paks is actively mobile and sediment-starved during low-flow conditions (likely short-term scour, plausibly partially reversible on the subsequent high-water period), rather than as an independent estimate of the secular rate: naively annualized, 0.5 m in seven months would imply a rate roughly fifty times larger than the −16 to −17 cm/decade result of Section 4.1, and the two should not be conflated.
5.3. Broader Hydrological Context
The Paks reach lies in a lowland alluvial setting where the Danube is in hydraulic continuity with the surrounding, dominantly fine sandy Quaternary aquifer; at this site, the connection has been documented to extend 300–1000 m from the channel, with river-to-aquifer infiltration occurring above a stage of 88.0 m Baltic datum [12]. For comparison, Danube regulation is separately reported to have caused a quantified groundwater storage loss of 0.3–0.4 km3 in the Szigetköz floodplain following the Gabčíkovo diversion [18], direct evidence that river regulation can affect adjacent groundwater over distances larger than a generic “few kilometers” heuristic would suggest. The two figures are not directly comparable, however: Szigetköz is underlain by coarse gravel and gravelly sand (higher hydraulic conductivity, favoring more extensive propagation), whereas the Paks reach is dominantly finer, sandy alluvium, so the Szigetköz distance should not be read as recalibrating the locally documented 300–1000 m figure at Paks; each is the site-appropriate estimate for its own setting, and both illustrate the same general principle that Danube regulation can influence adjacent groundwater beyond commonly assumed distances where conditions permit. A persistent lowering of stage at a given discharge, the finding of this paper, therefore also lowers the riparian groundwater head the river sustains near Paks and shortens the duration for which floodplain side-arms remain hydraulically connected to the main channel, an effect quantified immediately downstream of Paks by Molnár et al. [8], who report a 25–45% reduction, relative to 1901–1925, in the duration of the water levels needed to sustain that connectivity in the Gemenc floodplain. The consequences of the shift reported here are thus not confined to the main channel.
This local, river-driven mechanism should be distinguished from a separate, independently documented regional phenomenon: shallow groundwater levels across parts of the Hungarian Great Plain, most notably the Danube–Tisza Interfluve (DTK) and the Nyírség, have been in sustained decline since approximately the late 1970s, attributed primarily to a persistent precipitation-regime shift rather than to groundwater extraction [19,20]. Whether this regional decline and the river-channel change documented in this paper share any common driver is not established by either body of work: the regions showing the clearest regional groundwater decline are, if anything, reported elsewhere in the same literature as buffered by lateral recharge from surrounding higher terrain rather than as an extension of a river-connected signal, and no residence-time argument connecting a decadal river signal to deeper regional flow-system dynamics is available in the sources consulted; deep, gravity-driven regional flow systems generally operate on timescales far longer than a four-decade river record. We therefore treat the Danube–aquifer connectivity mechanism described above as an established, local, river-driven pathway, and flag the broader question of a shared regional driver as a genuinely open one, beyond what a single-gauge analysis can resolve.
A parallel check on the Tisza at Záhony (Tsz 1518, 1980–2025, the uppermost Hungarian gauge and upstream of any major flow-regulating structure on this river) found no evidence of the Paks-style rating-curve circularity: residual scatter of stage about a fitted discharge curve was tens of centimeters, not the sub-centimeter values diagnostic of a smoothly derived series at Paks [15]. Naive whole-record regression nonetheless suggested a continuing decadal decline in discharge, but changepoint analysis (Pettitt test, PELT, binary segmentation) instead identifies a single step change around 2010, with flat, statistically non-significant trends within the periods before and after it (all ); this timing coincides with the severe 2010 Tisza-basin floods followed immediately by the 2011–2012 drought, a documented regional hydro-climatic transition, rather than a continuing secular process. We flag this only as a plausible parallel caution against naive trend-fitting, not as independent confirmation of the Paks mechanism, since the underlying cause here (an abrupt climatic regime shift) differs from the Paks case (periodic rating-curve revision); a second Tisza gauge downstream of two major flow-regulating barrages was excluded from this comparison for that reason.
5.4. The VGT3/VGT4 Institutional Gap
Hungary’s currently adopted river basin management plan (VGT3, 2022) states directly: “Magyarországon 9 eromuvi használt hutovíz bevezetés van a felszíni vizekbe, ezek közül a Paksi Atomeromu számít jelentos egyedi terhelésnek” [“Hungary has 9 power-plant cooling-water discharges into surface waters; among these, Paks Nuclear Power Plant counts as a significant individual pressure”] [1], subject to a specific national regulatory measure. This is a documented, in-plan treatment of the plant’s thermal discharge as a pressure on the river. We found no treatment, in either VGT3 or the current discussion-draft for the next planning cycle (JVK4, Jelentos Vízgazdálkodási Kérdések, “Significant Water Management Issues,” December 2025), of the inverse relationship demonstrated in this paper: that ongoing changes in the river’s own morphology and flow regime bear on the security of the water supply the plant depends on. This omission is worth noting specifically because VGT3’s own stated methodology for detecting channel change (comparing the sign of discharge and water-level trends at 18 Danube gauges since 1980, where opposing signs indicate probable channel change) is conceptually the same diagnostic logic applied in this paper; the planning instrument already describes the tool that would be needed to surface this finding.
A parallel, narrower institutional gap concerns the design-basis low-water statistics discussed in Section 4.4. We found no evidence, in the sources reviewed for this paper, that the Paks II environmental impact study’s 1965–2012 stationary low-water fit has been recomputed since its original 2014 publication, despite twelve to fourteen additional years of Danube record, including the 2018 and 2026 events themselves, becoming available in the interim. The post-2012 discharge-controlled decline documented in Section 4.1 (−16 to −17 cm/decade) falls between the same report’s own mean-of-methods (−1.31 cm/yr) and pessimistic linear (−2.27 cm/yr) subsidence-forecast branches, and the raw, discharge-uncontrolled low-water trend estimates discussed in Section 5.2 run steeper still; on the evidence reviewed here, the post-2012 record has tracked the more pessimistic end of the assessment’s own forecast envelope rather than its optimistic branch.
5.5. Limitations
2026 is a partial year in this analysis (through 30–31 July), and, as an active, ongoing low-water episode at the time of writing, its full-year characteristics cannot yet be assessed. The epoch-based approach adopted in Section 3.1 and Section 3.2 mitigates but does not eliminate residual autocorrelation concerns; confidence intervals reported here should be read as approximate rather than exact. The 2026 counterfactual (Section 4.4) required extrapolation beyond the earliest epoch’s observed discharge range for the lowest-flow days specifically, and the reported design-basis comparison should be treated with corresponding caution, since it is itself anchored to the 1982–1986 epoch rather than to the site’s original 1970s design-era conditions, for which no comparable rating-curve reconstruction was available. Dunaújváros’s post-1998 hysteresis shift is plausibly, but not directly, connected to the 1997 national riverbed resurvey or a contemporaneous change in gauging technology (Section 4.3); the underlying cause was not independently confirmed. A longer (1900–2024) daily discharge record for the Danube at Bratislava (GRDC station 6142200, corresponding to SHMÚ station 5140/Bratislava-Nový Most, the same gauge cited in Section 5.2 for the post-1992 rating-curve shift, not the Devín station used in Section 3.6/Section 4.5) was obtained and is analyzed in a supplementary note [15]. As discharge only, it cannot redo the Q–H rating-curve epoch method of Section 3.2 at Bratislava; a matching pre-1992 stage series for this station was investigated and remains unobtainable without a formal, identity-bound SHMÚ data request. The discharge series itself shows no significant changepoint of any kind at or near 1992 (annual mean, Pettitt for the single most-likely break in the full 1901–2024 record), consistent with Bratislava’s position upstream of the diversion’s flow split, and independently reproduces Blaškovičová et al.’s [11,17] published finding of no trend in mean annual discharge at this station. The same method applied to Rajka’s discharge finds an overwhelming break at exactly 1992–1993 (Pettitt ): a clean upstream/downstream contrast that corroborates, at annual resolution and from an independent station pair, the daily-resolution finding already reported for Rajka in Section 4.3. The cross-border water-balance analysis (Section 3.6/Section 4.5) is limited by the absence of any Gabčíkovo/Hrušov reservoir-level data in the public sources consulted, and the broader question of whether the Paks-reach finding shares a common driver with the regional groundwater decline discussed in Section 5.3 remains open.
6. Conclusion
Using 46 years of daily discharge and water-level records, reconstructed as a periodically revised, field-gauging-grounded rating relationship rather than a series of independent measurements, we find that the water level at fixed discharge at the Paks Danube gauge has declined by 16–17 cm per decade since 1981, a result that survives restriction to the subset of years least susceptible to the very data-provenance concern that motivated the reconstruction. Applied to 2026, this shift corresponds to roughly 65 cm of additional stage lowering at fixed discharge relative to the 1980s, present throughout the record-breaking low-water episode that twice curtailed the Paks Nuclear Power Plant’s operation, and roughly twice the ∼30 cm margin by which the 2026 minimum remained above the most conservative (1-in-20,000-year) design low-water level established in the Paks II environmental impact assessment. Milly et al. [26] (see also [19]) argue that water-management infrastructure and planning criteria derived from historical records become systematically non-conservative once the underlying statistics are non-stationary, such that outcomes that were in fact statistically foreseeable are treated as unforeseen surprises; the shift documented here is precisely such a non-stationarity in the record underlying the Paks design basis: a basis whose own 2012-fit stationary statistics assign the 2018 and 2026 minima nominal return periods on the order of and years respectively, eight years apart, without having been revisited since. A four-station spatial comparison shows this is part of an active, still-ongoing channel-adjustment process, plausibly compounded by, but not solely attributable to, the 1992 Gabčíkovo diversion, and distinct from an unrelated historical decline that stabilized further upstream roughly three decades ago. We find no evidence that the concurrent 2026 drought reflects anomalous upstream water retention rather than a genuine, region-wide hydrological deficit. Hungary’s current and in-preparation river-basin management instruments describe a diagnostic capable of detecting the pattern reported here, but we found no evidence they have been applied to this specific question. Future work should incorporate a genuinely pre-1992 upstream discharge control, direct correspondence with the operating water authority regarding historical rating-curve revision dates, and a joint analysis of this reach-scale finding alongside regional groundwater-level records; the changing stage–discharge relationship documented here is itself a shifting boundary condition for any nearby groundwater reconstruction.
Author Contributions
For this single-author paper, the following CRediT statement applies: Conceptualization, Z.Z.F.; Methodology, Z.Z.F.; Software, Z.Z.F.; Formal Analysis, Z.Z.F.; Investigation, Z.Z.F.; Data Curation, Z.Z.F.; Writing—Original Draft Preparation, Z.Z.F.; Writing—Review and Editing, Z.Z.F.; Visualization, Z.Z.F. Specifically, the author acquired and provenance-checked the primary and comparison-station discharge/water-level series from data.vizugy.hu (OVF), eHYD (Austria), and DanubeHIS/ICPDR (Slovakia); conducted the forensic rating-curve provenance analysis identifying the 2022 bulk database reprocessing and corroborating operator statements (Section 3.1); designed and implemented the changepoint-based epoch reconstruction, hysteresis diagnostic, multi-station replication, counterfactual, cross-border water-balance, and thermal case-study methods (Section 3.2, Section 3.3, Section 3.4, Section 3.5, Section 3.6 and Section 3.7); produced Figure 1, Figure 2, Figure 3, Figure 4, Figure 5, Figure 6, Figure 7, Figure 8, Figure 9, Figure 10, Figure 11, Figure 12, Figure 13 and Figure 14 and Table 1; and wrote and revised the manuscript in full. The author has read and agreed to the published version of the manuscript.
Data Availability Statement
The primary data underlying this study are public: daily discharge and water-level records for the Paks, Rajka, Dunaújváros, and Komárom gauges are available from data.vizugy.hu, the public data portal of Hungary’s National Directorate General for Water Management (OVF); records for Hainburg and Wildungsmauer are available from eHYD, Austria’s federal hydrographic data portal; the record for Bratislava-Devín is available from DanubeHIS, the ICPDR’s Danube Hydrological Information System; the supplementary Bratislava/Nový Most discharge record is available from the Global Runoff Data Centre (GRDC); and Bavarian Danube, Salzach, and Inn records are available from Bavaria’s Gewässerkundlicher Dienst (GKD Bayern) portal. The analysis scripts and derived datasets generated during this study (including the introductory severity and discharge-context comparisons underlying Figure 1 and Figure 2; the rating-curve epoch reconstructions and changepoint outputs underlying Figure 4, Figure 5, and Figure 6; the daily-resolution diversion and counterfactual analyses underlying Figure 3, Figure 7, Figure 8, and Figure 14; the non-stationarity/design-basis comparison underlying Figure 9; the cross-border water-balance analysis underlying Figure 10, Figure 11, and Figure 12; and the thermal case-study model underlying Figure 13) will be archived and made publicly available on Zenodo at [Insert DOI]; no repository has been created at the time of writing, so this is a placeholder pending manuscript acceptance.
Conflicts of Interest
The author declares that they have no known competing financial interests or personal relationships that could have appeared to influence the work reported in this paper.
Acknowledgments
The author gratefully acknowledges the following institutions for making the hydrological, meteorological, and documentary records underlying this study publicly available: Hungary’s National Directorate General for Water Management (OVF, data.vizugy.hu), for discharge, water-level, and rating-curve/gauge-datum documentation for the Paks, Rajka, Dunaújváros, and Komárom gauges; Austria’s eHYD federal hydrographic data portal, for the Hainburg and Wildungsmauer records; the Slovak Hydrometeorological Institute (SHMÚ) and the International Commission for the Protection of the Danube River (ICPDR)’s Danube Hydrological Information System (DanubeHIS), for the Bratislava-Devín record; the Global Runoff Data Centre (GRDC), for the supplementary long-record Bratislava/Nový Most discharge series; Bavaria’s Gewässerkundlicher Dienst (GKD Bayern), for the Bavarian Danube, Salzach, and Inn records used in the cross-border corroboration analysis; and MVM Paks II Zrt. and MVM Paksi Atomeromu, for the publicly available environmental impact study and operational notices cited throughout this paper.
References
- Government of Hungary. Magyarország 2021. évi vízgyujto-gazdálkodási terve (VGT3) [Hungary’s 2021 River Basin Management Plan]. Technical report, Adopted by Government Resolution 1242/2022 (IV. 28.), 2022.
- MVM Paksi Atomeromu. [Notice: Danube water temperature reaches 25.5 °C, daily monitoring begins], 2026. 26 June 2026.
- MVM Paksi Atomeromu. [Notice on Danube water level and cooling-water intake], 2026. 27 July 2026.
- Various outlets. Contemporaneous press coverage of the June–July 2026 Paks curtailment episodes. Origo, 27 June 2026; atlatszo.hu, 30 June 2026; Index, 3 July 2026; Portfolio, 30 July 2026; Telex, 29 July 2026; Euronews (AP wire), 30 July 2026, 2026. Cited only to corroborate specific dates and output figures independently of the plant’s own statements; direct-fetch verified, full URLs and fetch dates documented in the project’s data and code repository, thermal_backtest/sourced_curtailment_dates.md.
- Goda, L.; Kalocsa, B.; Tamás, E.A. River Bed Erosion on the Hungarian Section of the Danube. J. Environ. Sci. Sustain. Soc. 2007, 1, 47–54. [Google Scholar] [CrossRef]
- Tamás, E.A.; Đorđević, D.; Kalocsa, B.; Vujanović, A. Hydrological indicators of the riverbed incision along the free-flowing Danube River reach from Budapest to Slankamen relevant for the lateral connectivity between the river channel and floodplains. In Proceedings of the Proceedings of the 43rd IAD Conference, 2021, pp. 62–69. [CrossRef]
- Đorđević, D.; Tamás, E.A.; Mihajlović, L.; Abonyi, C.; Vujanović, A.; Kalocsa, B. Estimation of Changes in Sediment Transport along the Free-Flowing Middle Danube River Reach. Appl. Sci. 2023, 13, 10513. [Google Scholar] [CrossRef]
- Molnár, S.; Baranya, S.; Török, G.T. A medersüllyedés okai és hidrológiai következményei a magyarországi Duna-szakaszon [Causes and hydrological consequences of riverbed subsidence on the Hungarian Danube reach]. In Proceedings of the Proceedings of the 43rd Vándorgyulés of the Hungarian Hydrological Society, 2026.
- Szilagyi, J.; Balint, G.; Gauzer, B.; Bartha, P. Flow Routing with Unknown Rating Curves Using a State-Space Reservoir-Cascade-Type Formulation. J. Hydrol. 2005, 311, 219–229. [Google Scholar] [CrossRef]
- Kovács, G. A tartóssági görbe felhasználása természetes vízfolyások hidrológiai vizsgálatánál [Use of the duration curve in the hydrological investigation of natural watercourses]. Hidrológiai Közlöny 1953, 33, 101–111. [Google Scholar]
- Blaškovičová, L.; Gavurník, J.; Belan, M.; Poórová, J.; Paľušová, Z. Identification of changes in the hydrological regime due to Gabčíkovo water dam operation. In Proceedings of the XXVII Conference of the Danubian Countries on Hydrological Forecasting and Hydrological Bases of Water Management, Golden Sands, Bulgaria, September 2017; pp. 112–123. 26–28 September 2017.
- MVM Paks II Zrt.. Environmental Impact Study, Chapter 11: Modelling of the Danube River Morphology and Danube Heat Load (PAKSII_KHT_11_Dunamodell_EN). Technical report, Prepared for the Paks II site licensing process; English translation published for the Espoo Convention transboundary consultation via Austria’s Umweltbundesamt, 2014.
- Dukai, D. A 2024. szeptemberi dunai árhullám levonulásának bemutatása hidrológiai szempontból [Hydrological description of the September 2024 Danube flood wave]. In Proceedings of the XLII. Országos Vándorgyulés, Magyar Hidrológiai Társaság, Székesfehérvár, Hungary, July 2025. 2–4 July 2025.
- Wagner, B.; Hauer, C.; Schoder, A.; Habersack, H. A review of hydropower in Austria: Past, present and future development. Renew. Sustain. Energy Rev. 2015, 50, 304–314. [Google Scholar] [CrossRef]
- Fehér, Z.Z. Analysis scripts and supplementary data: Paks Danube rating-curve provenance and companion analyses. Zenodo, 2026. Includes the Bratislava/Nový Most (GRDC station 6142200) 1900–2024 changepoint analysis, the Tisza provenance and trend check, and the Bavarian Danube/Salzach/Inn discharge and GRACE/Copernicus/SST corroboration. [Insert DOI].
- Pekárová, P. Statement (Slovak Academy of Sciences, Institute of Hydrology) on the 2026 Danube low-flow record at Bratislava/Devín. Distributed via TASR, 30 July 2026, 2026. Primary source: https://sav.sk/?doc=services-news&lang=sk&news_no=13825&source_no=20.
- Blaškovičová, L.; Danáčová, Z.; Lovásová, Ľ.; Šimor, V.; Škoda, P. Vývoj vybraných hydrologických charakteristík na Dunaji v Bratislave [The Development of Selected Hydrologic Characteristics of the Danube in Bratislava]. Presented at: Odborný seminár pri priležitosti Dňa Dunaja 2013 (1. ročník), Slovak Hydrometeorological Institute (SHMÚ), 2013. Conference/seminar presentation; no formal proceedings pagination available.
- Zsuffa, I.; Szollosi-Nagy, A.; Bogárdi, J. Insula Insolita – Szigetköz és Bos-Nagymaros párhuzamos története [Insula Insolita – Parallel history of the Szigetköz area and the Gabčíkovo-Nagymaros Barrage Scheme]. Hidrológiai Közlöny 2023, 103, 4–23. [Google Scholar] [CrossRef]
- Fehér, Z.Z. Large-scale geostatistical modeling of shallow groundwater time series in the Southern Great Plain. PhD thesis, University of Szeged, 2019. [Google Scholar]
- Tran, H.Q.; Fehér, Z.Z.; Túri, N.; Rakonczai, J. Climate Change as an Environmental Threat on the Central Plains of the Carpathian Basin Based on Regional Water Balances. Geogr. Pannonica 2022, 26, 184–199. [Google Scholar] [CrossRef]
- GFZ German Research Centre for Geosciences. Press release: Long-term changes in global water storage [Weltwassertag: langfristige Veränderungen der globalen Wasserspeicherung], 2026. 21 March 2026.
- Copernicus Climate Change Service (C3S). Precipitation, relative humidity, and soil moisture for February 2026. Implemented by ECMWF, 2026.
- Copernicus Climate Change Service (C3S). Precipitation, relative humidity, and soil moisture for April 2026. Implemented by ECMWF, 2026.
- Copernicus Climate Change Service (C3S). Precipitation, relative humidity, soil moisture and river flow for May 2026. Implemented by ECMWF, 2026.
- Copernicus Climate Change Service (C3S). Precipitation, relative humidity, soil moisture and river flow for June 2026. Implemented by ECMWF, 2026.
- Milly, P.C.D.; Betancourt, J.; Falkenmark, M.; Hirsch, R.M.; Kundzewicz, Z.W.; Lettenmaier, D.P.; Stouffer, R.J. Stationarity Is Dead: Whither Water Management? Science 2008, 319, 573–574. [Google Scholar] [CrossRef] [PubMed]
Figure 1.
Paks daily water level (top) and near-riverbed water temperature (bottom) for 2018, 2022, and 2026, against the 1980–2025 historical median and 5th-percentile band (water level) and the 30°C statutory mixed-section temperature limit (temperature); the pre-2026 record-low water level (−97 cm, 26 October 2018) is marked for reference. 2026 ran below the pre-existing record for most of the period shown and, in the temperature panel, approached the 30°C threshold during the period corresponding to the first curtailment episode described above; 2018 and 2022, the two prior comparison drought years used as reference points throughout this paper, are shown alongside it for context. Source: this study, from the water-level and near-riverbed temperature series described in Section 2.2 and Section 2.4.
Figure 1.
Paks daily water level (top) and near-riverbed water temperature (bottom) for 2018, 2022, and 2026, against the 1980–2025 historical median and 5th-percentile band (water level) and the 30°C statutory mixed-section temperature limit (temperature); the pre-2026 record-low water level (−97 cm, 26 October 2018) is marked for reference. 2026 ran below the pre-existing record for most of the period shown and, in the temperature panel, approached the 30°C threshold during the period corresponding to the first curtailment episode described above; 2018 and 2022, the two prior comparison drought years used as reference points throughout this paper, are shown alongside it for context. Source: this study, from the water-level and near-riverbed temperature series described in Section 2.2 and Section 2.4.
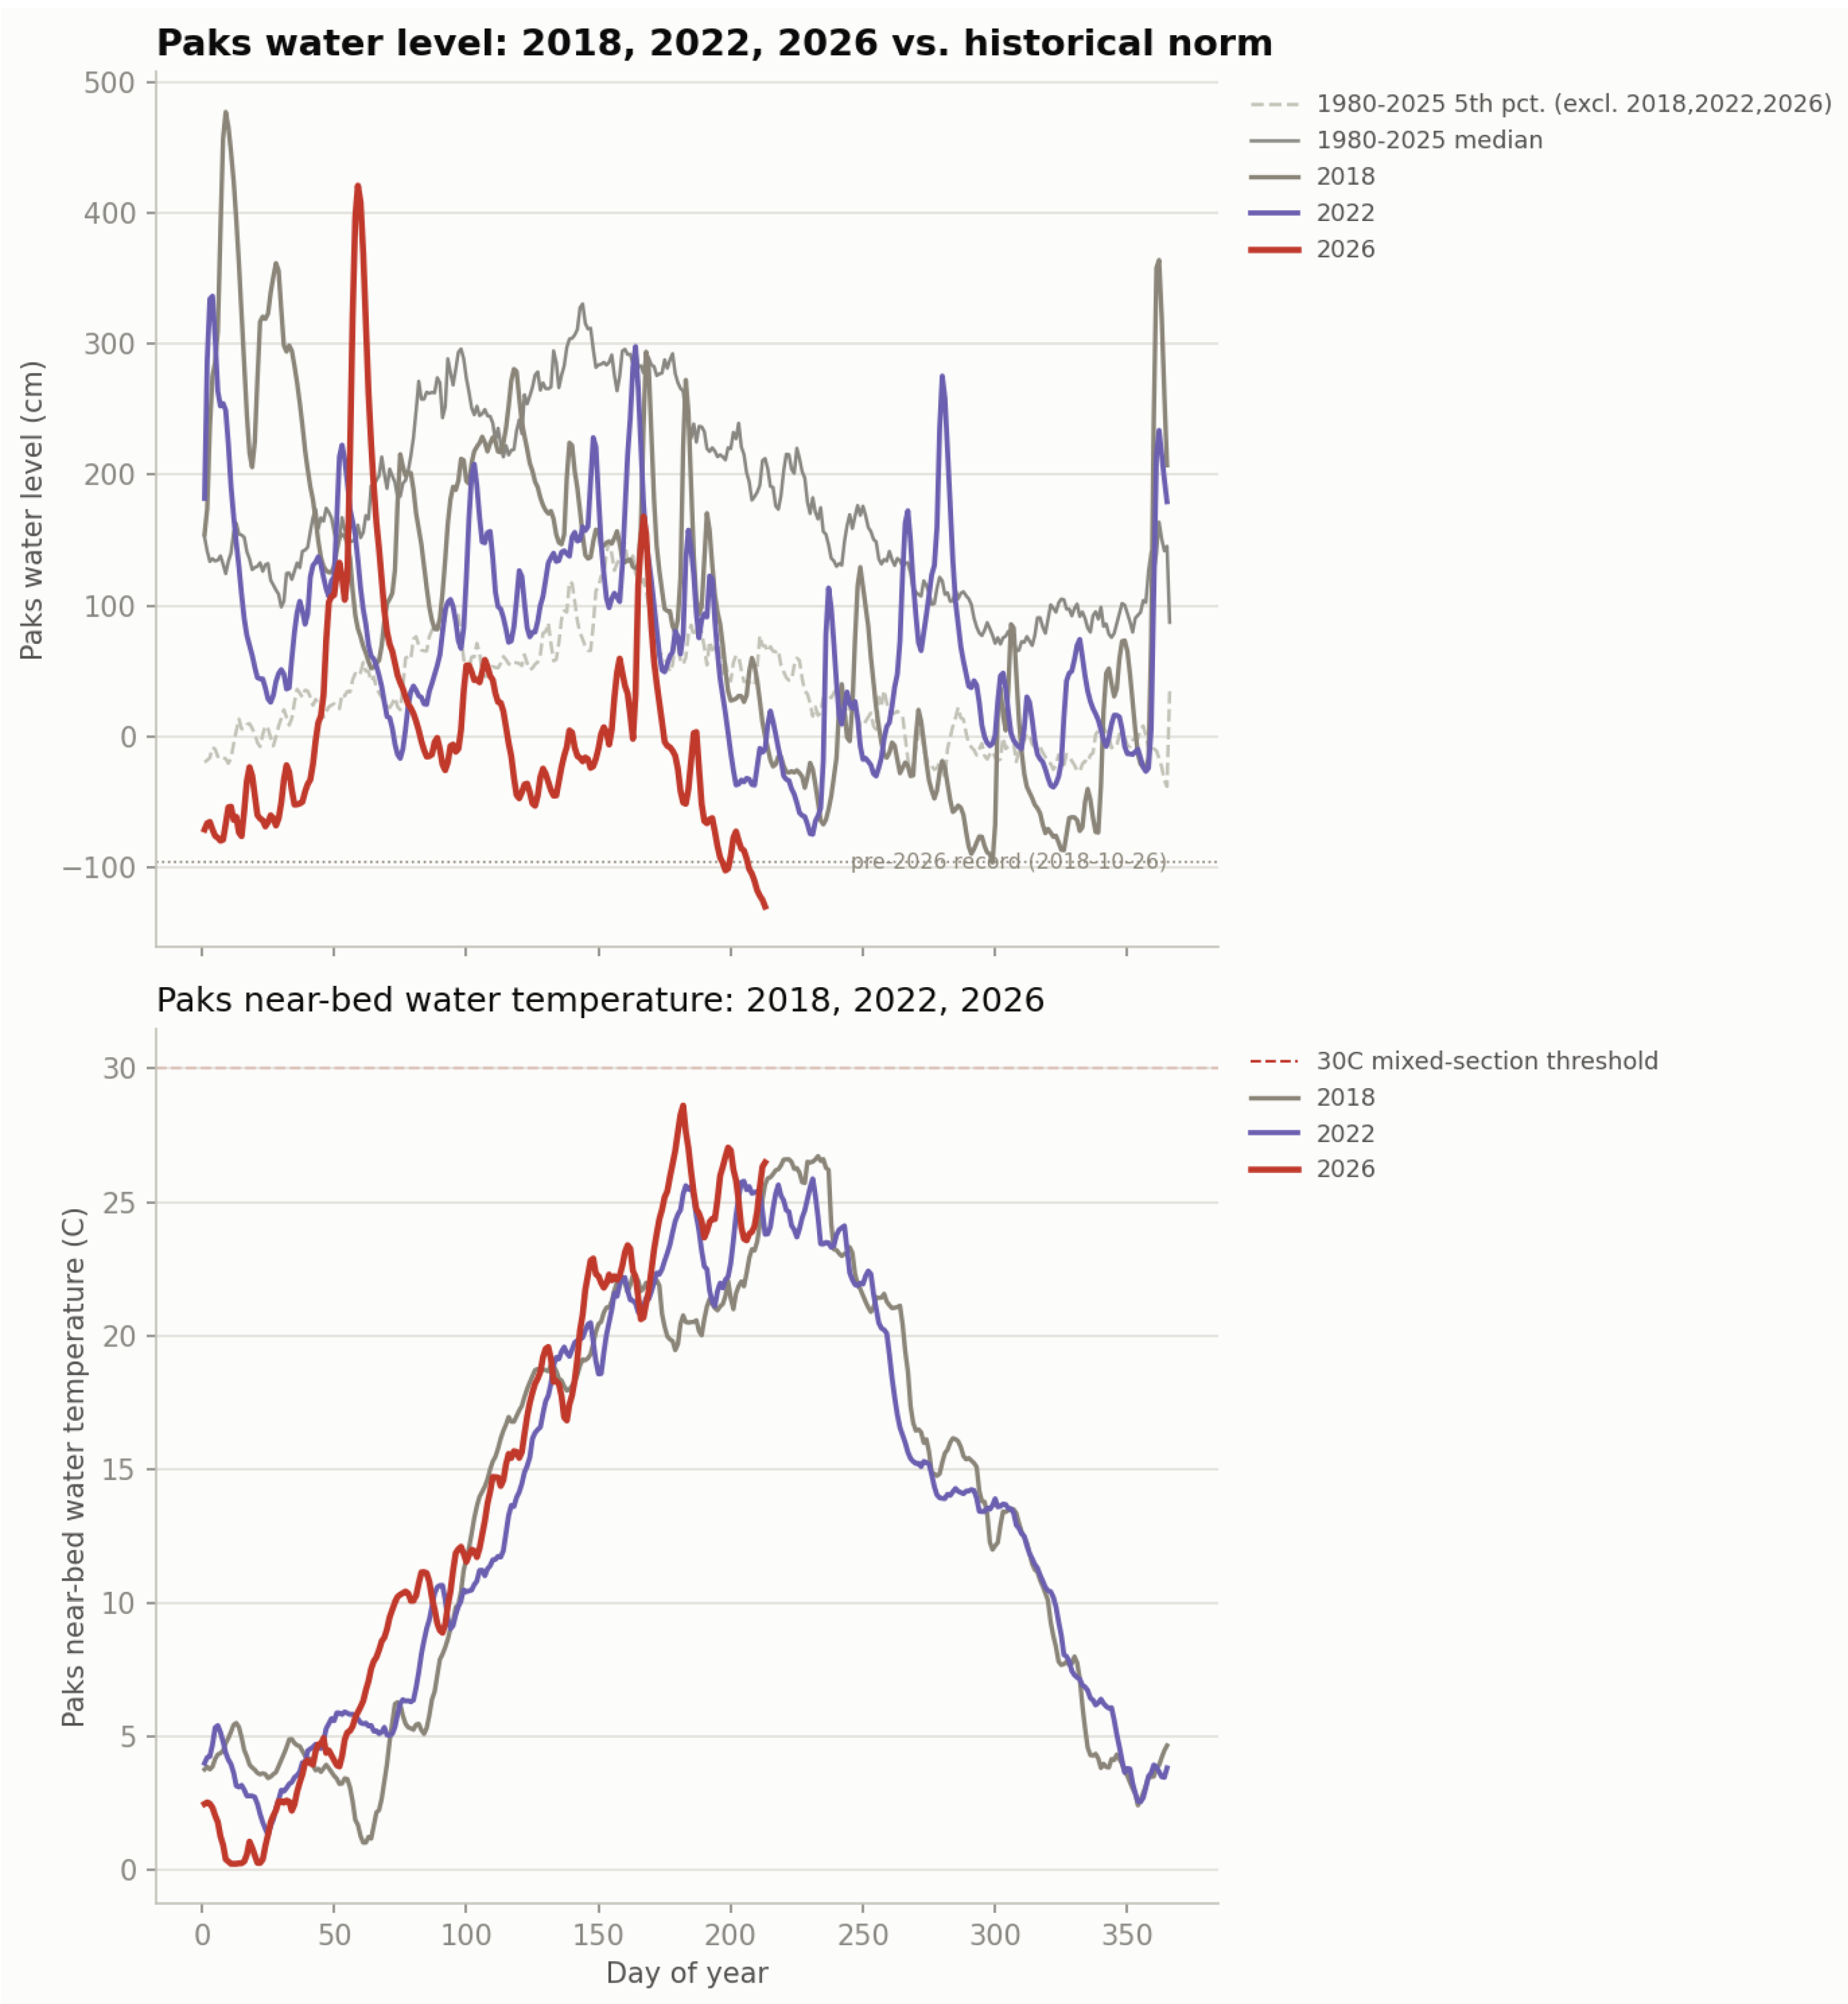
Figure 2.
Daily mean discharge at Paks for 2018, 2022, and 2026, by day of year, against the 1980s (1980–1989) and 2010s (2010–2019) decadal day-of-year medians. 2026 discharge runs below both decadal reference medians for most of the partial-year record shown, but remains within the broad envelope of inter-annual variability also evident in 2018 and 2022; this provides the context for the water-level and temperature severity shown in Figure 1, and for the question posed below, namely whether the record-low water level of 2026 is explained by discharge alone. Source: this study, from the daily discharge series described in Section 2.2.
Figure 2.
Daily mean discharge at Paks for 2018, 2022, and 2026, by day of year, against the 1980s (1980–1989) and 2010s (2010–2019) decadal day-of-year medians. 2026 discharge runs below both decadal reference medians for most of the partial-year record shown, but remains within the broad envelope of inter-annual variability also evident in 2018 and 2022; this provides the context for the water-level and temperature severity shown in Figure 1, and for the question posed below, namely whether the record-low water level of 2026 is explained by discharge alone. Source: this study, from the daily discharge series described in Section 2.2.
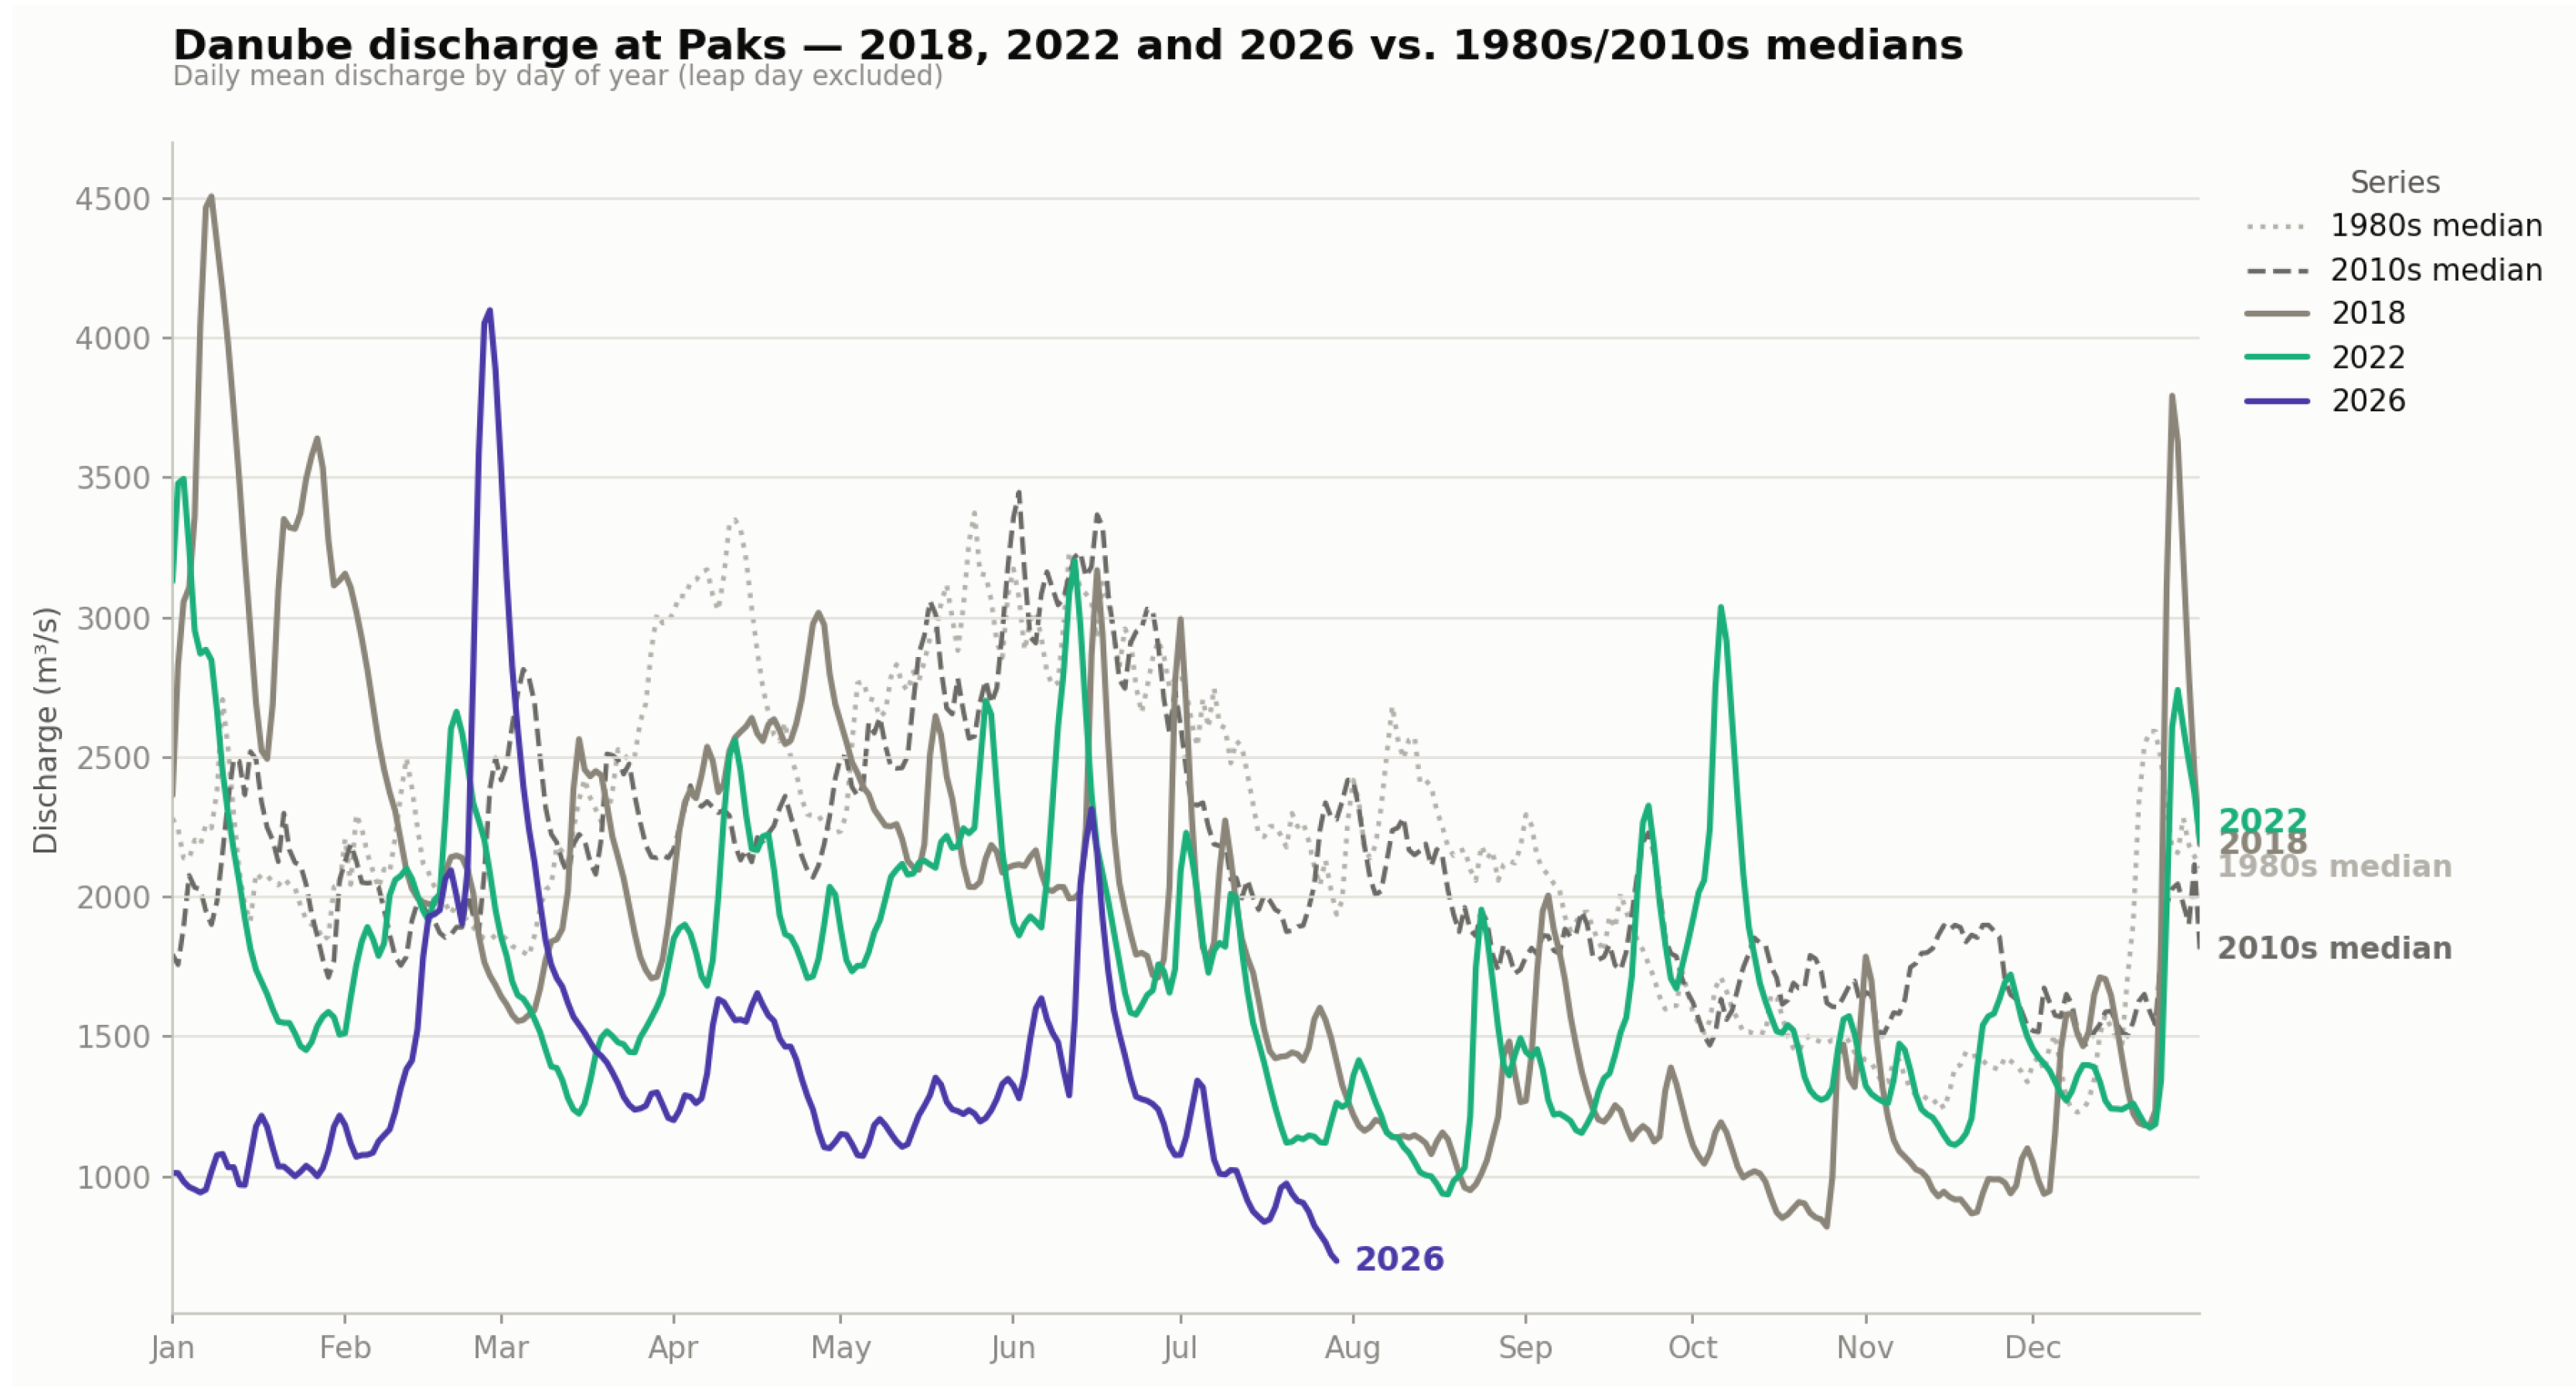
Figure 3.
Daily Q–H pairs at Paks colored by rising limb (positive 5-day-smoothed dQ/dt) versus falling limb (negative), for 2022 (near-deterministic, consistent with H computed from Q for that year) and 2018 (a genuine, visually apparent hysteresis loop, consistent with an independently gauged relationship). The 2022 panel is the direct visual counterpart of the residual-scatter evidence described in Section 3.1; 2018 is one of the thirteen years classified as high-hysteresis in Section 4.2. Source: this study, from the same daily Q–H series used throughout Section 4.
Figure 3.
Daily Q–H pairs at Paks colored by rising limb (positive 5-day-smoothed dQ/dt) versus falling limb (negative), for 2022 (near-deterministic, consistent with H computed from Q for that year) and 2018 (a genuine, visually apparent hysteresis loop, consistent with an independently gauged relationship). The 2022 panel is the direct visual counterpart of the residual-scatter evidence described in Section 3.1; 2018 is one of the thirteen years classified as high-hysteresis in Section 4.2. Source: this study, from the same daily Q–H series used throughout Section 4.
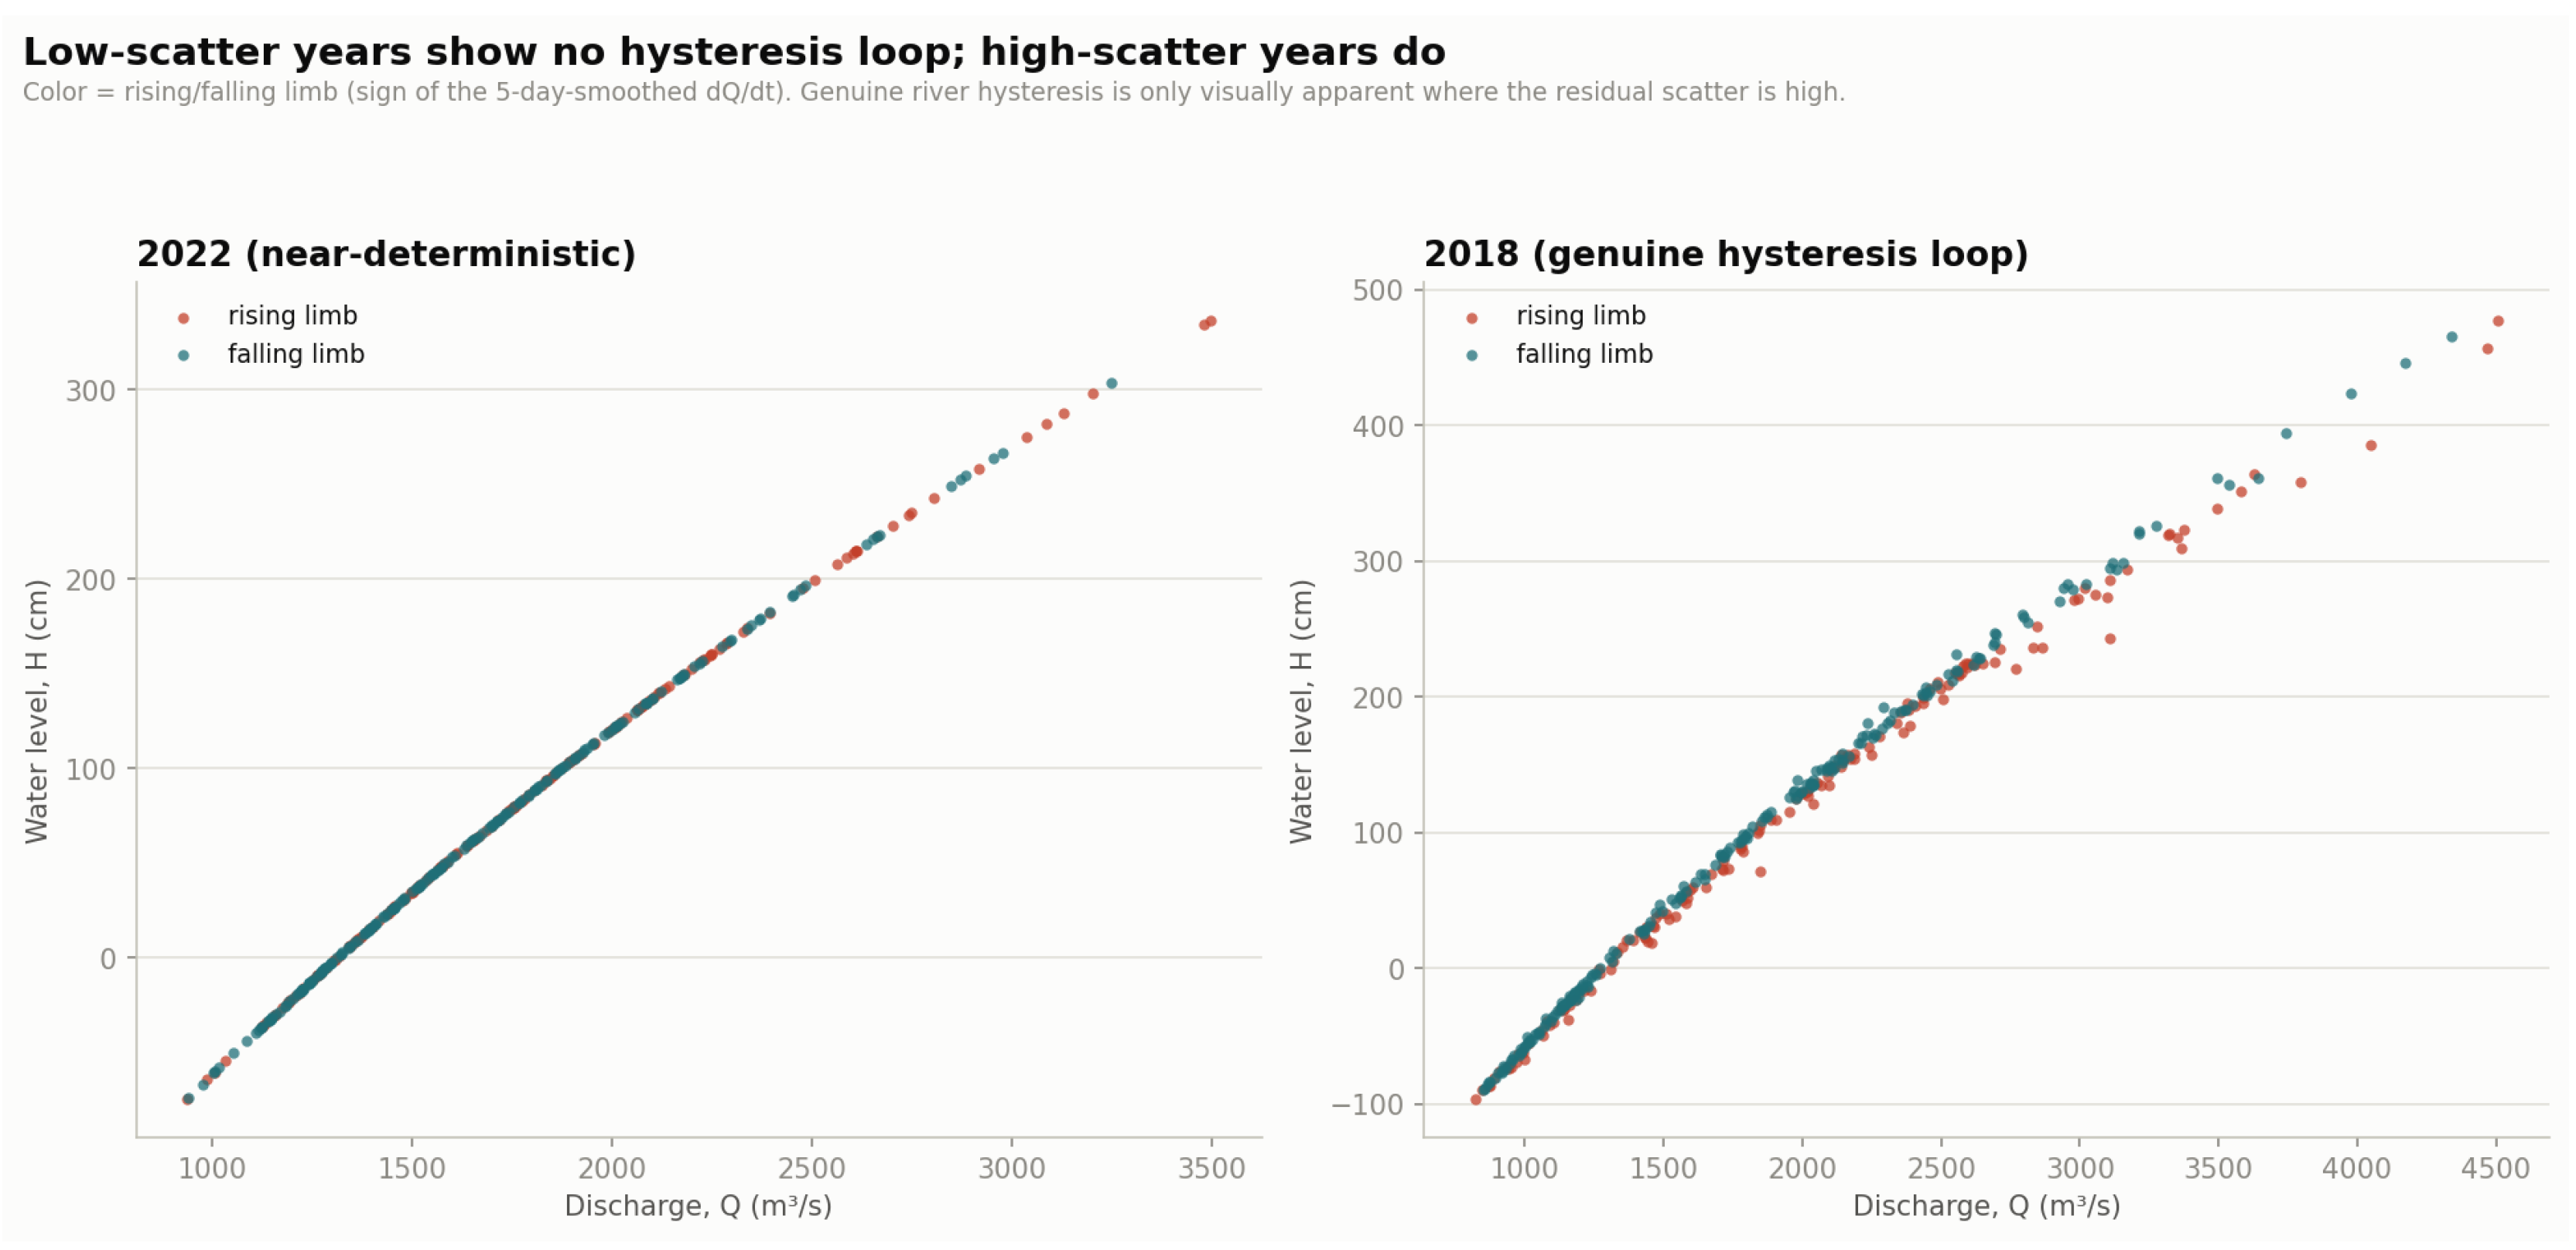
Figure 4.
Per-epoch mean water level at the reference discharge (H at Q = 1300 m3/s), one point per year, grouped into the twelve epochs identified by the primary PELT segmentation (Section 3.2); vertical dashed lines mark detected break years, horizontal segments mark each epoch’s mean. The stepped structure (discrete drops of roughly 3–12 cm between epochs rather than a smooth year-on-year decline) is the basis for treating this as an epoch-level, not daily-level, trend; the two brief upward reversals referenced in the text (around 1996–1998 and 2022–2026) are visible as the only two segments where an epoch mean sits above its immediate predecessor. Source: this study, from the same 1981–2026 daily Q–H series used throughout Section 4.
Figure 4.
Per-epoch mean water level at the reference discharge (H at Q = 1300 m3/s), one point per year, grouped into the twelve epochs identified by the primary PELT segmentation (Section 3.2); vertical dashed lines mark detected break years, horizontal segments mark each epoch’s mean. The stepped structure (discrete drops of roughly 3–12 cm between epochs rather than a smooth year-on-year decline) is the basis for treating this as an epoch-level, not daily-level, trend; the two brief upward reversals referenced in the text (around 1996–1998 and 2022–2026) are visible as the only two segments where an epoch mean sits above its immediate predecessor. Source: this study, from the same 1981–2026 daily Q–H series used throughout Section 4.
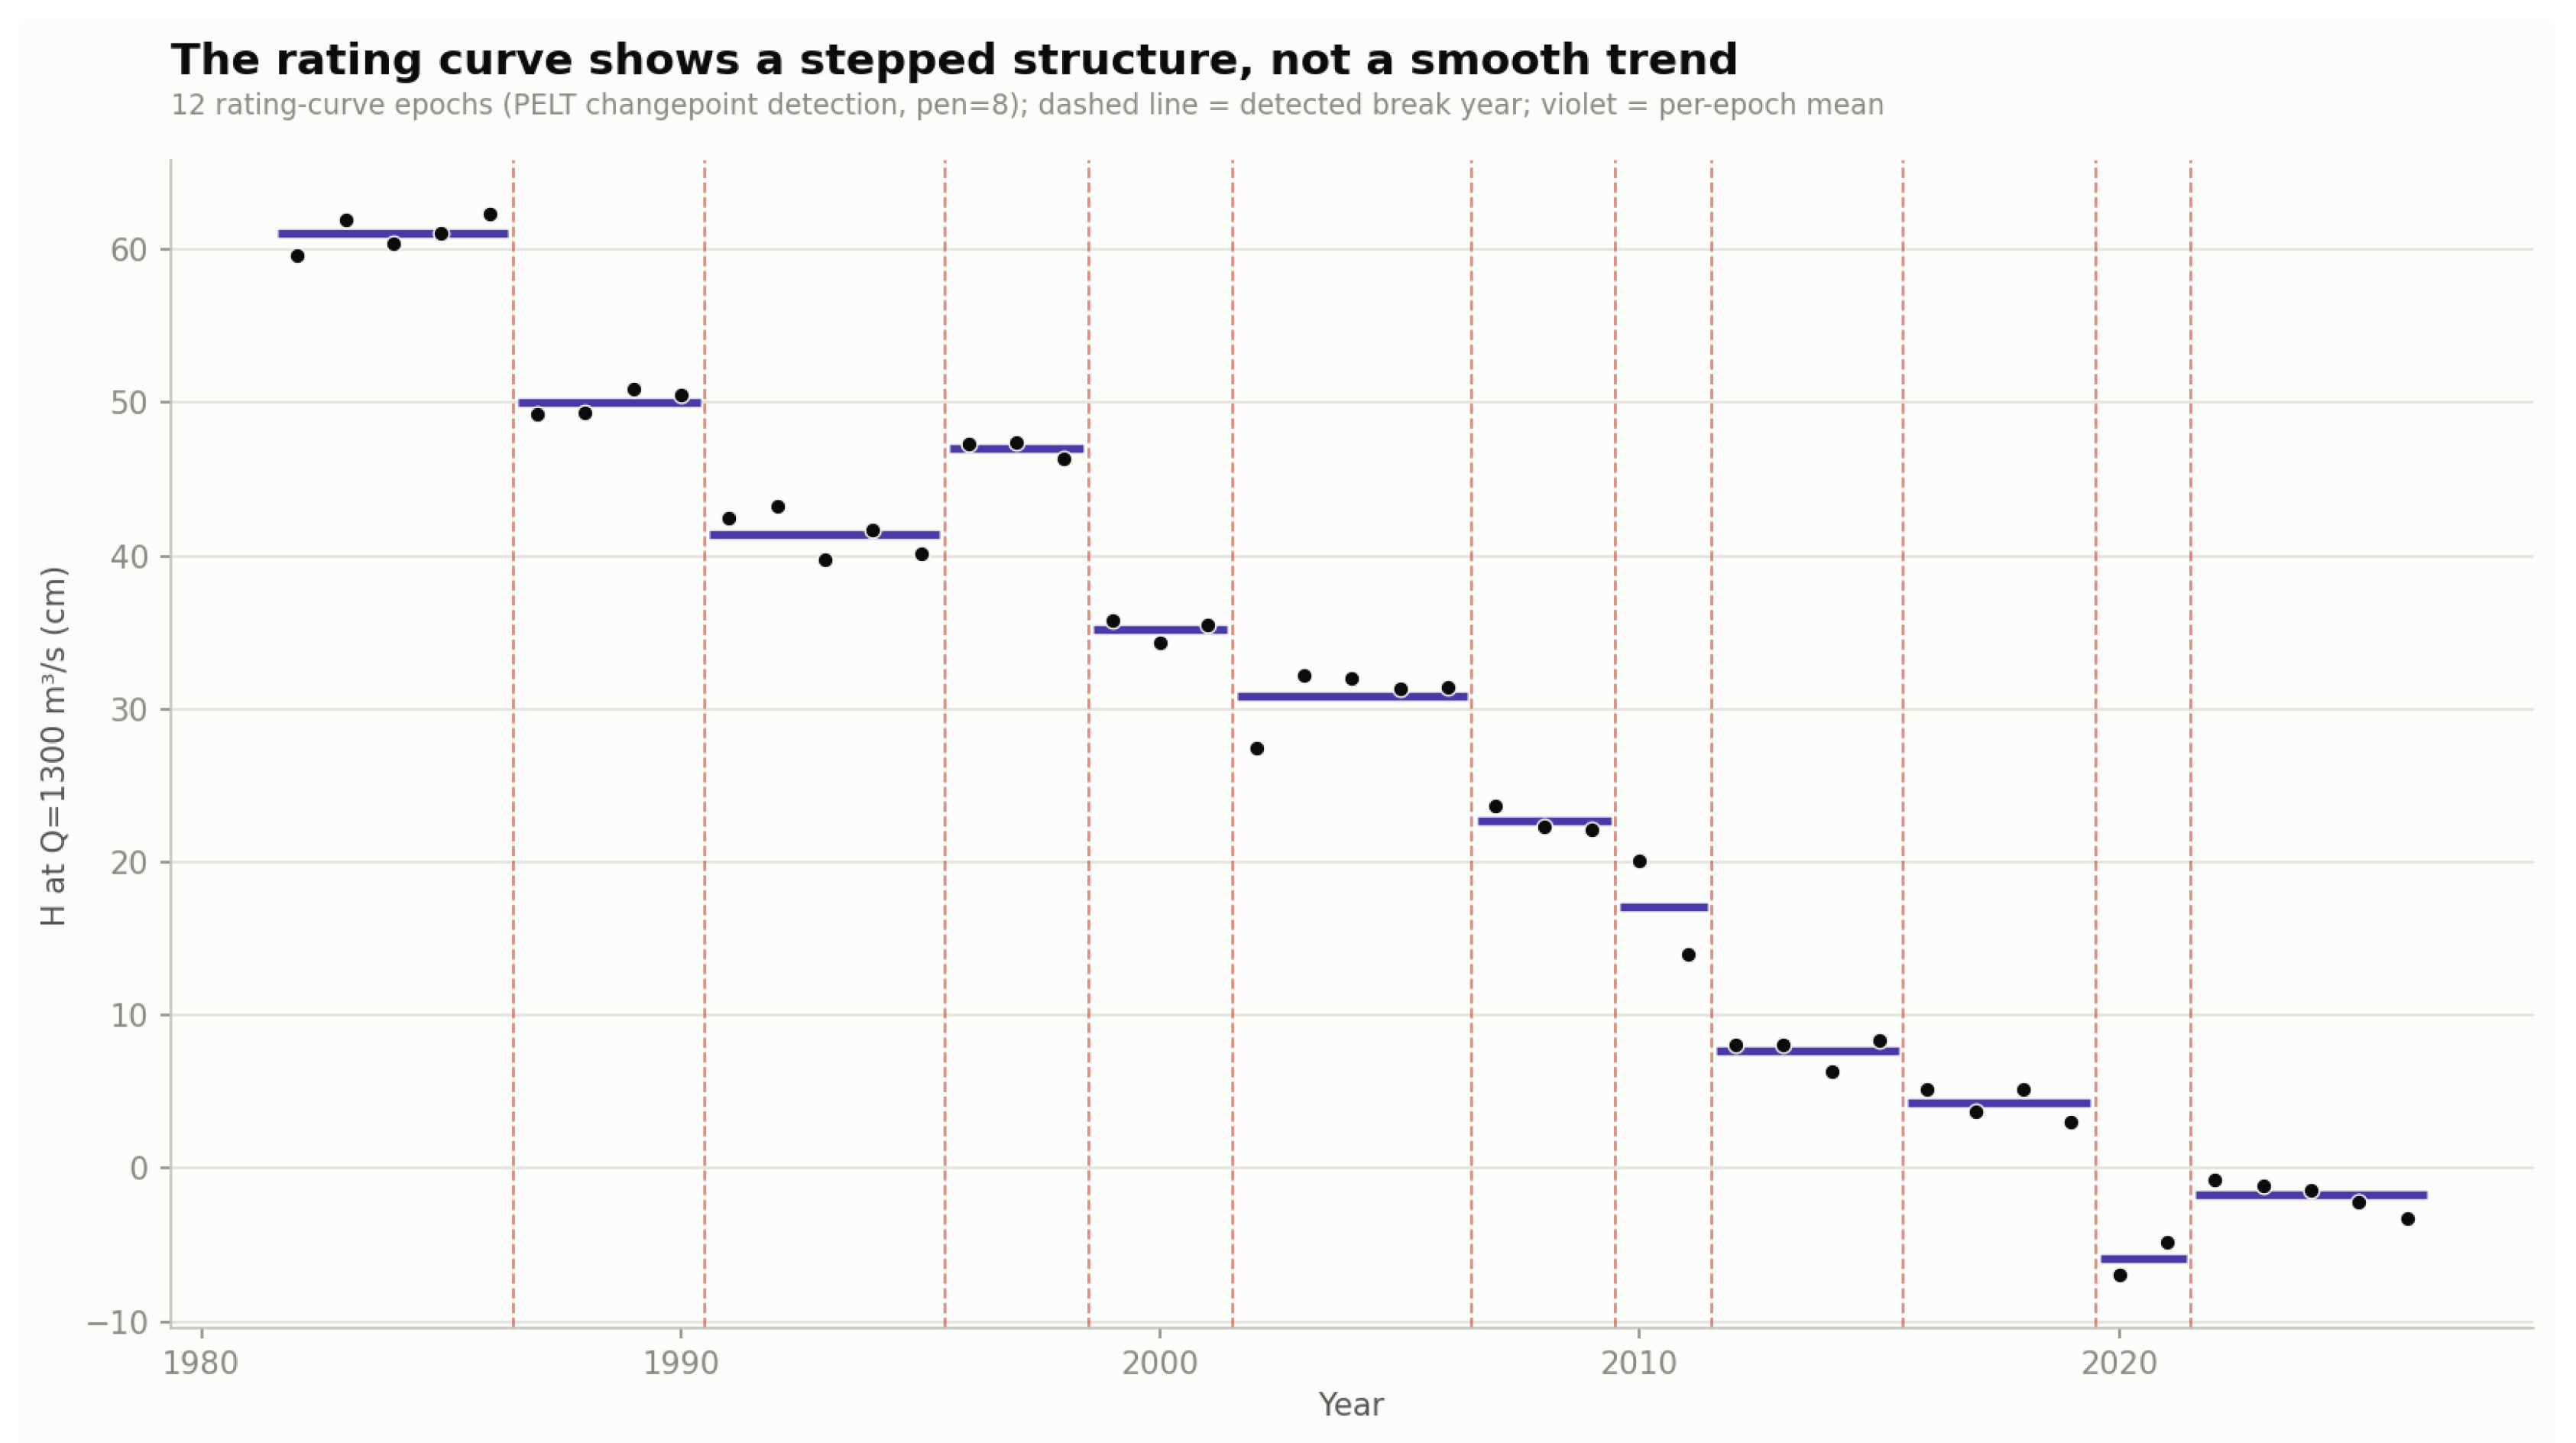
Figure 5.
Fitted Paks rating curves (H as a function of Q, log-quadratic form selected by AIC, Section 3.2) for three representative epochs from the primary 12-epoch (PELT) segmentation: 1982–1986 (earliest), 2002–2006 (middle), and 2022–2026 (most recent). Points show the underlying daily Q–H pairs for each epoch (discharges above 5500 m3/s omitted for display clarity; this excludes only the flood-stage tail, not the low-to-medium-flow range relevant to the headline result); dotted line segments mark extrapolation below that epoch’s own observed discharge range. At the reference discharge used throughout this paper (Q = 1300 m3/s), the fitted curves show a −64 cm shift between the earliest and most recent epoch, consistent with, and independently reproducing at daily resolution, the ≈61 cm to ≈−2 cm epoch-mean values underlying the −16 to −17 cm/decade trend reported above. Source: this study, fitted from the same 1981–2026 daily Q–H series used throughout Section 4.
Figure 5.
Fitted Paks rating curves (H as a function of Q, log-quadratic form selected by AIC, Section 3.2) for three representative epochs from the primary 12-epoch (PELT) segmentation: 1982–1986 (earliest), 2002–2006 (middle), and 2022–2026 (most recent). Points show the underlying daily Q–H pairs for each epoch (discharges above 5500 m3/s omitted for display clarity; this excludes only the flood-stage tail, not the low-to-medium-flow range relevant to the headline result); dotted line segments mark extrapolation below that epoch’s own observed discharge range. At the reference discharge used throughout this paper (Q = 1300 m3/s), the fitted curves show a −64 cm shift between the earliest and most recent epoch, consistent with, and independently reproducing at daily resolution, the ≈61 cm to ≈−2 cm epoch-mean values underlying the −16 to −17 cm/decade trend reported above. Source: this study, fitted from the same 1981–2026 daily Q–H series used throughout Section 4.
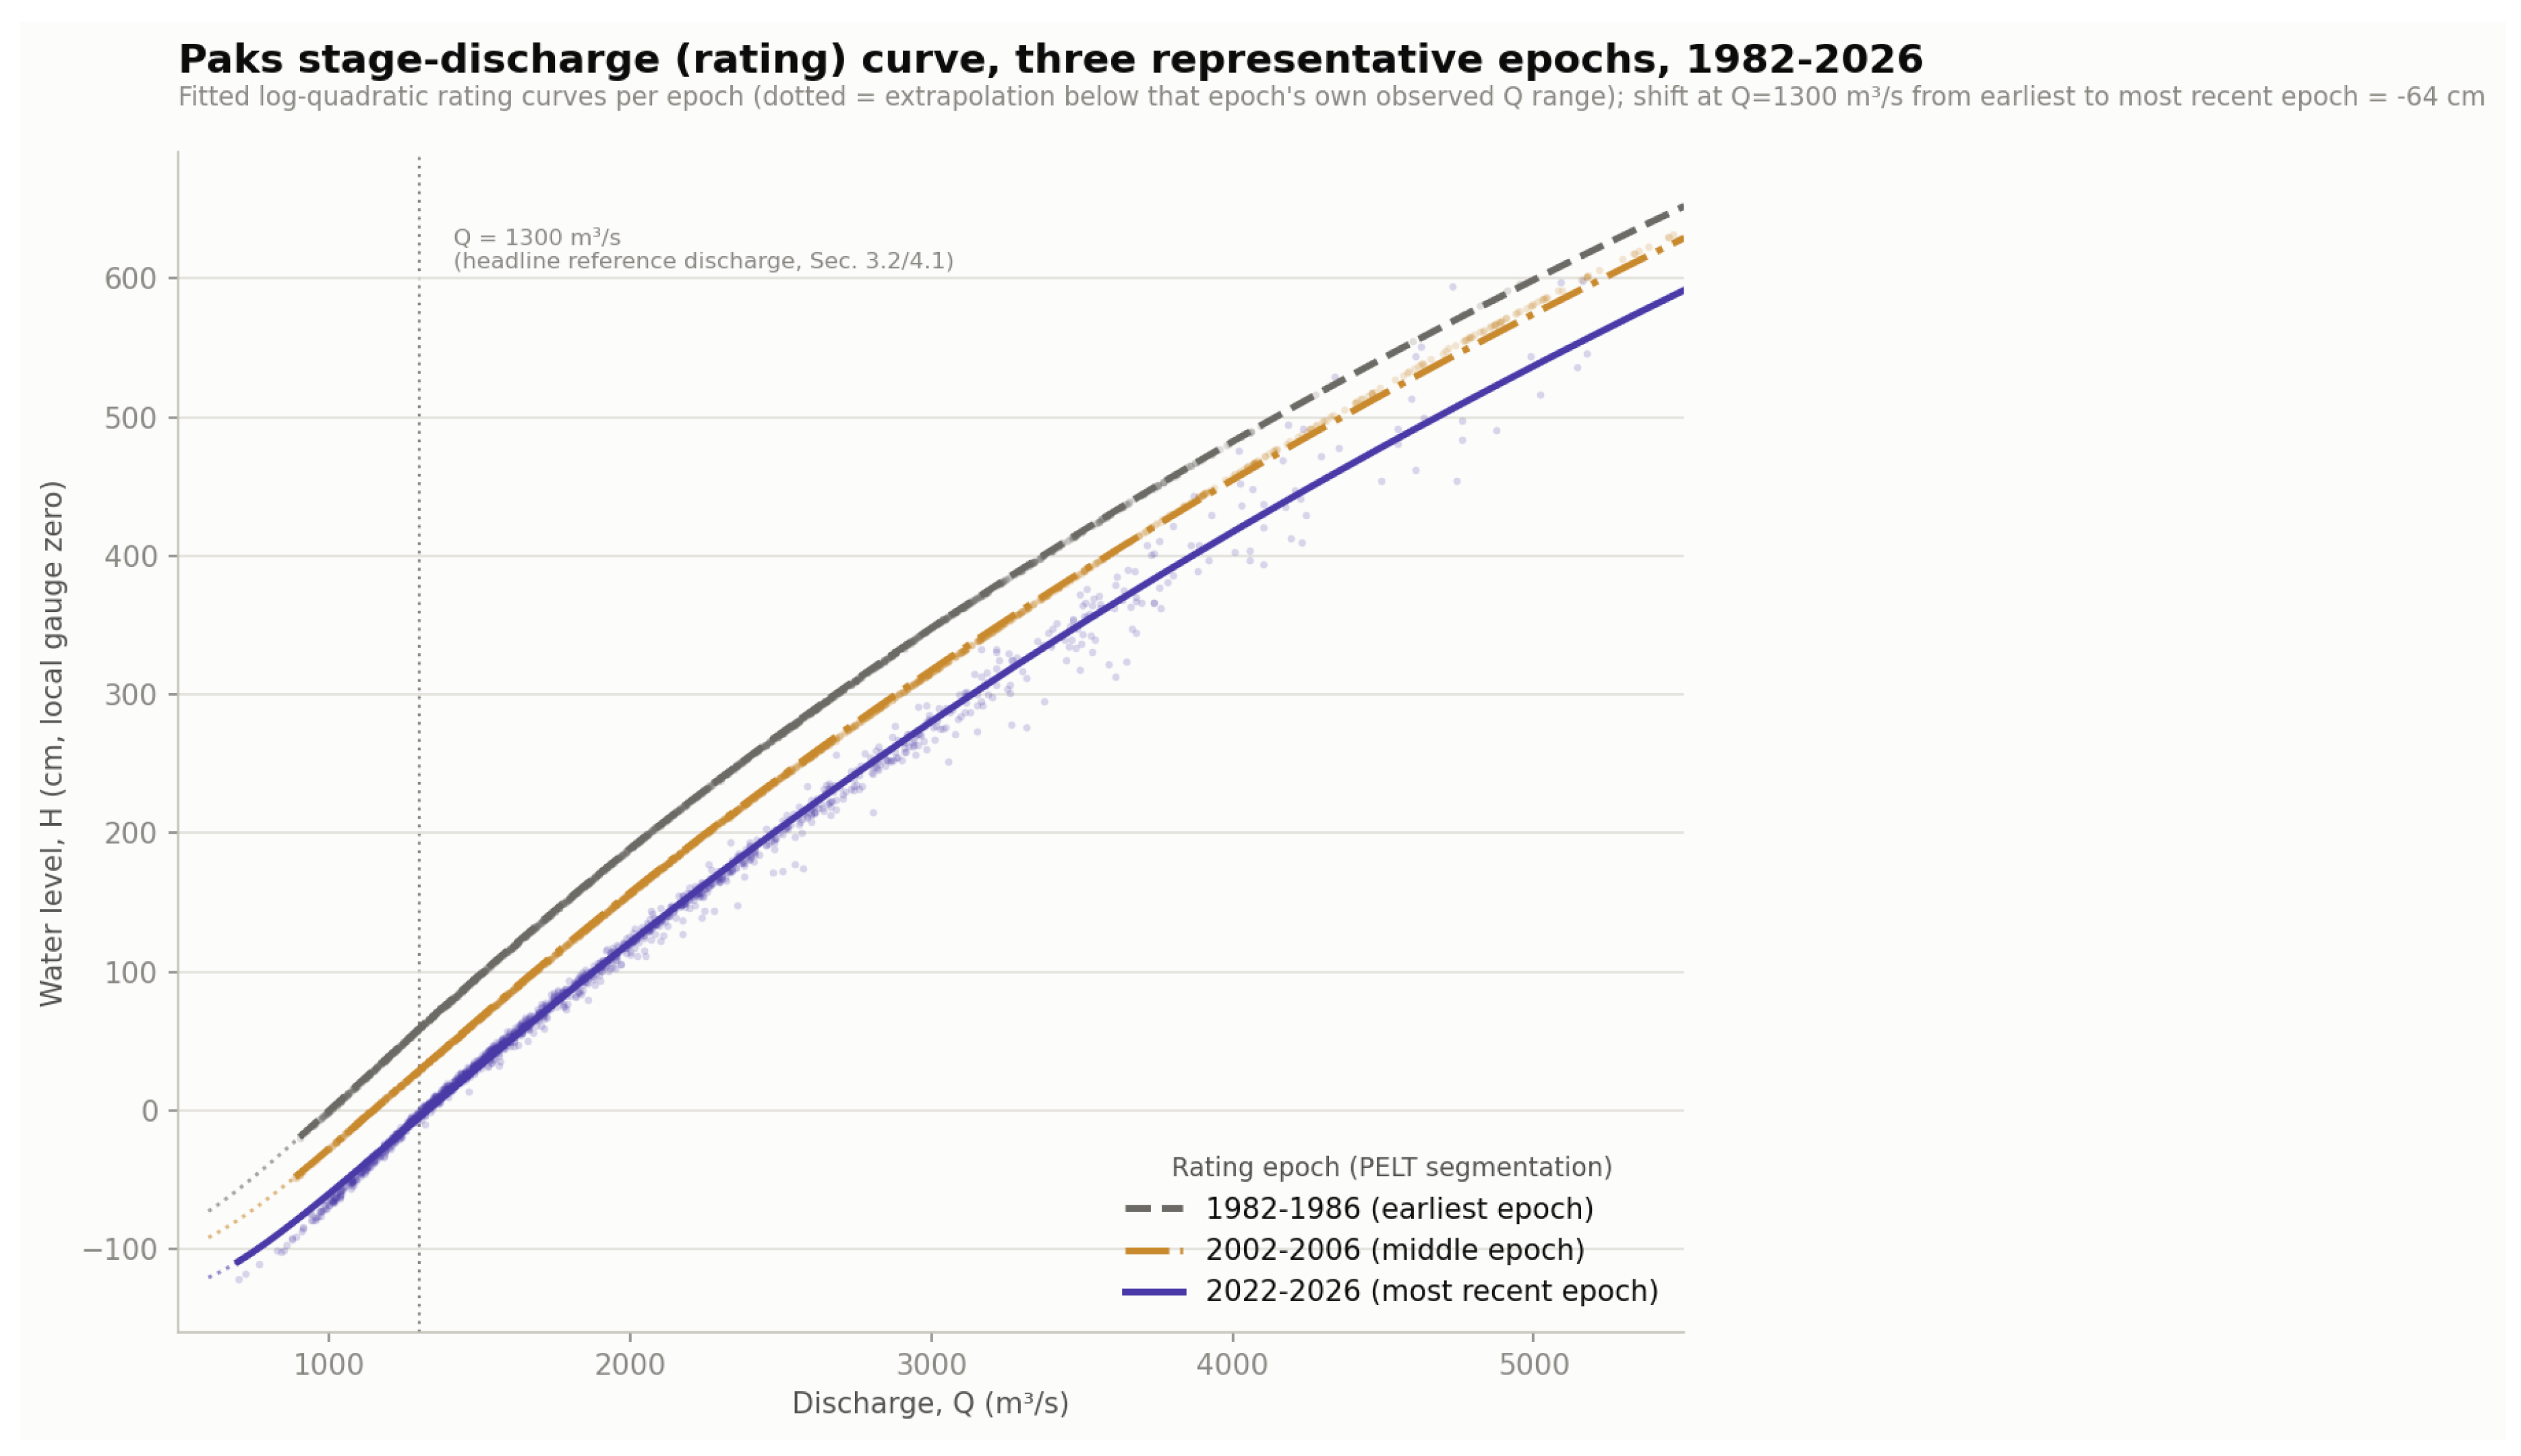
Figure 6.
Epoch-mean H at Q = 1300 m3/s for all 45 tested years (1981–2026; gray points), with the thirteen high-hysteresis years (p < 0.05, Section 3.3) highlighted and further distinguished by effect size (small, <2 cm, versus large, >2 cm). The dotted line is the full-record trend (−16.1 cm/decade); the solid line is the trend fitted to the high-hysteresis years only (−14.0 cm/decade, 95% CI −16.3 to −11.7). The high-hysteresis years cluster in 2013–2026 and track the full-record trend closely, providing a circularity-resistant check on the headline result from the years least affected by the data-provenance concern of Section 3.1. Source: this study, from the same 1981–2026 daily Q–H series used throughout Section 4.
Figure 6.
Epoch-mean H at Q = 1300 m3/s for all 45 tested years (1981–2026; gray points), with the thirteen high-hysteresis years (p < 0.05, Section 3.3) highlighted and further distinguished by effect size (small, <2 cm, versus large, >2 cm). The dotted line is the full-record trend (−16.1 cm/decade); the solid line is the trend fitted to the high-hysteresis years only (−14.0 cm/decade, 95% CI −16.3 to −11.7). The high-hysteresis years cluster in 2013–2026 and track the full-record trend closely, providing a circularity-resistant check on the headline result from the years least affected by the data-provenance concern of Section 3.1. Source: this study, from the same 1981–2026 daily Q–H series used throughout Section 4.
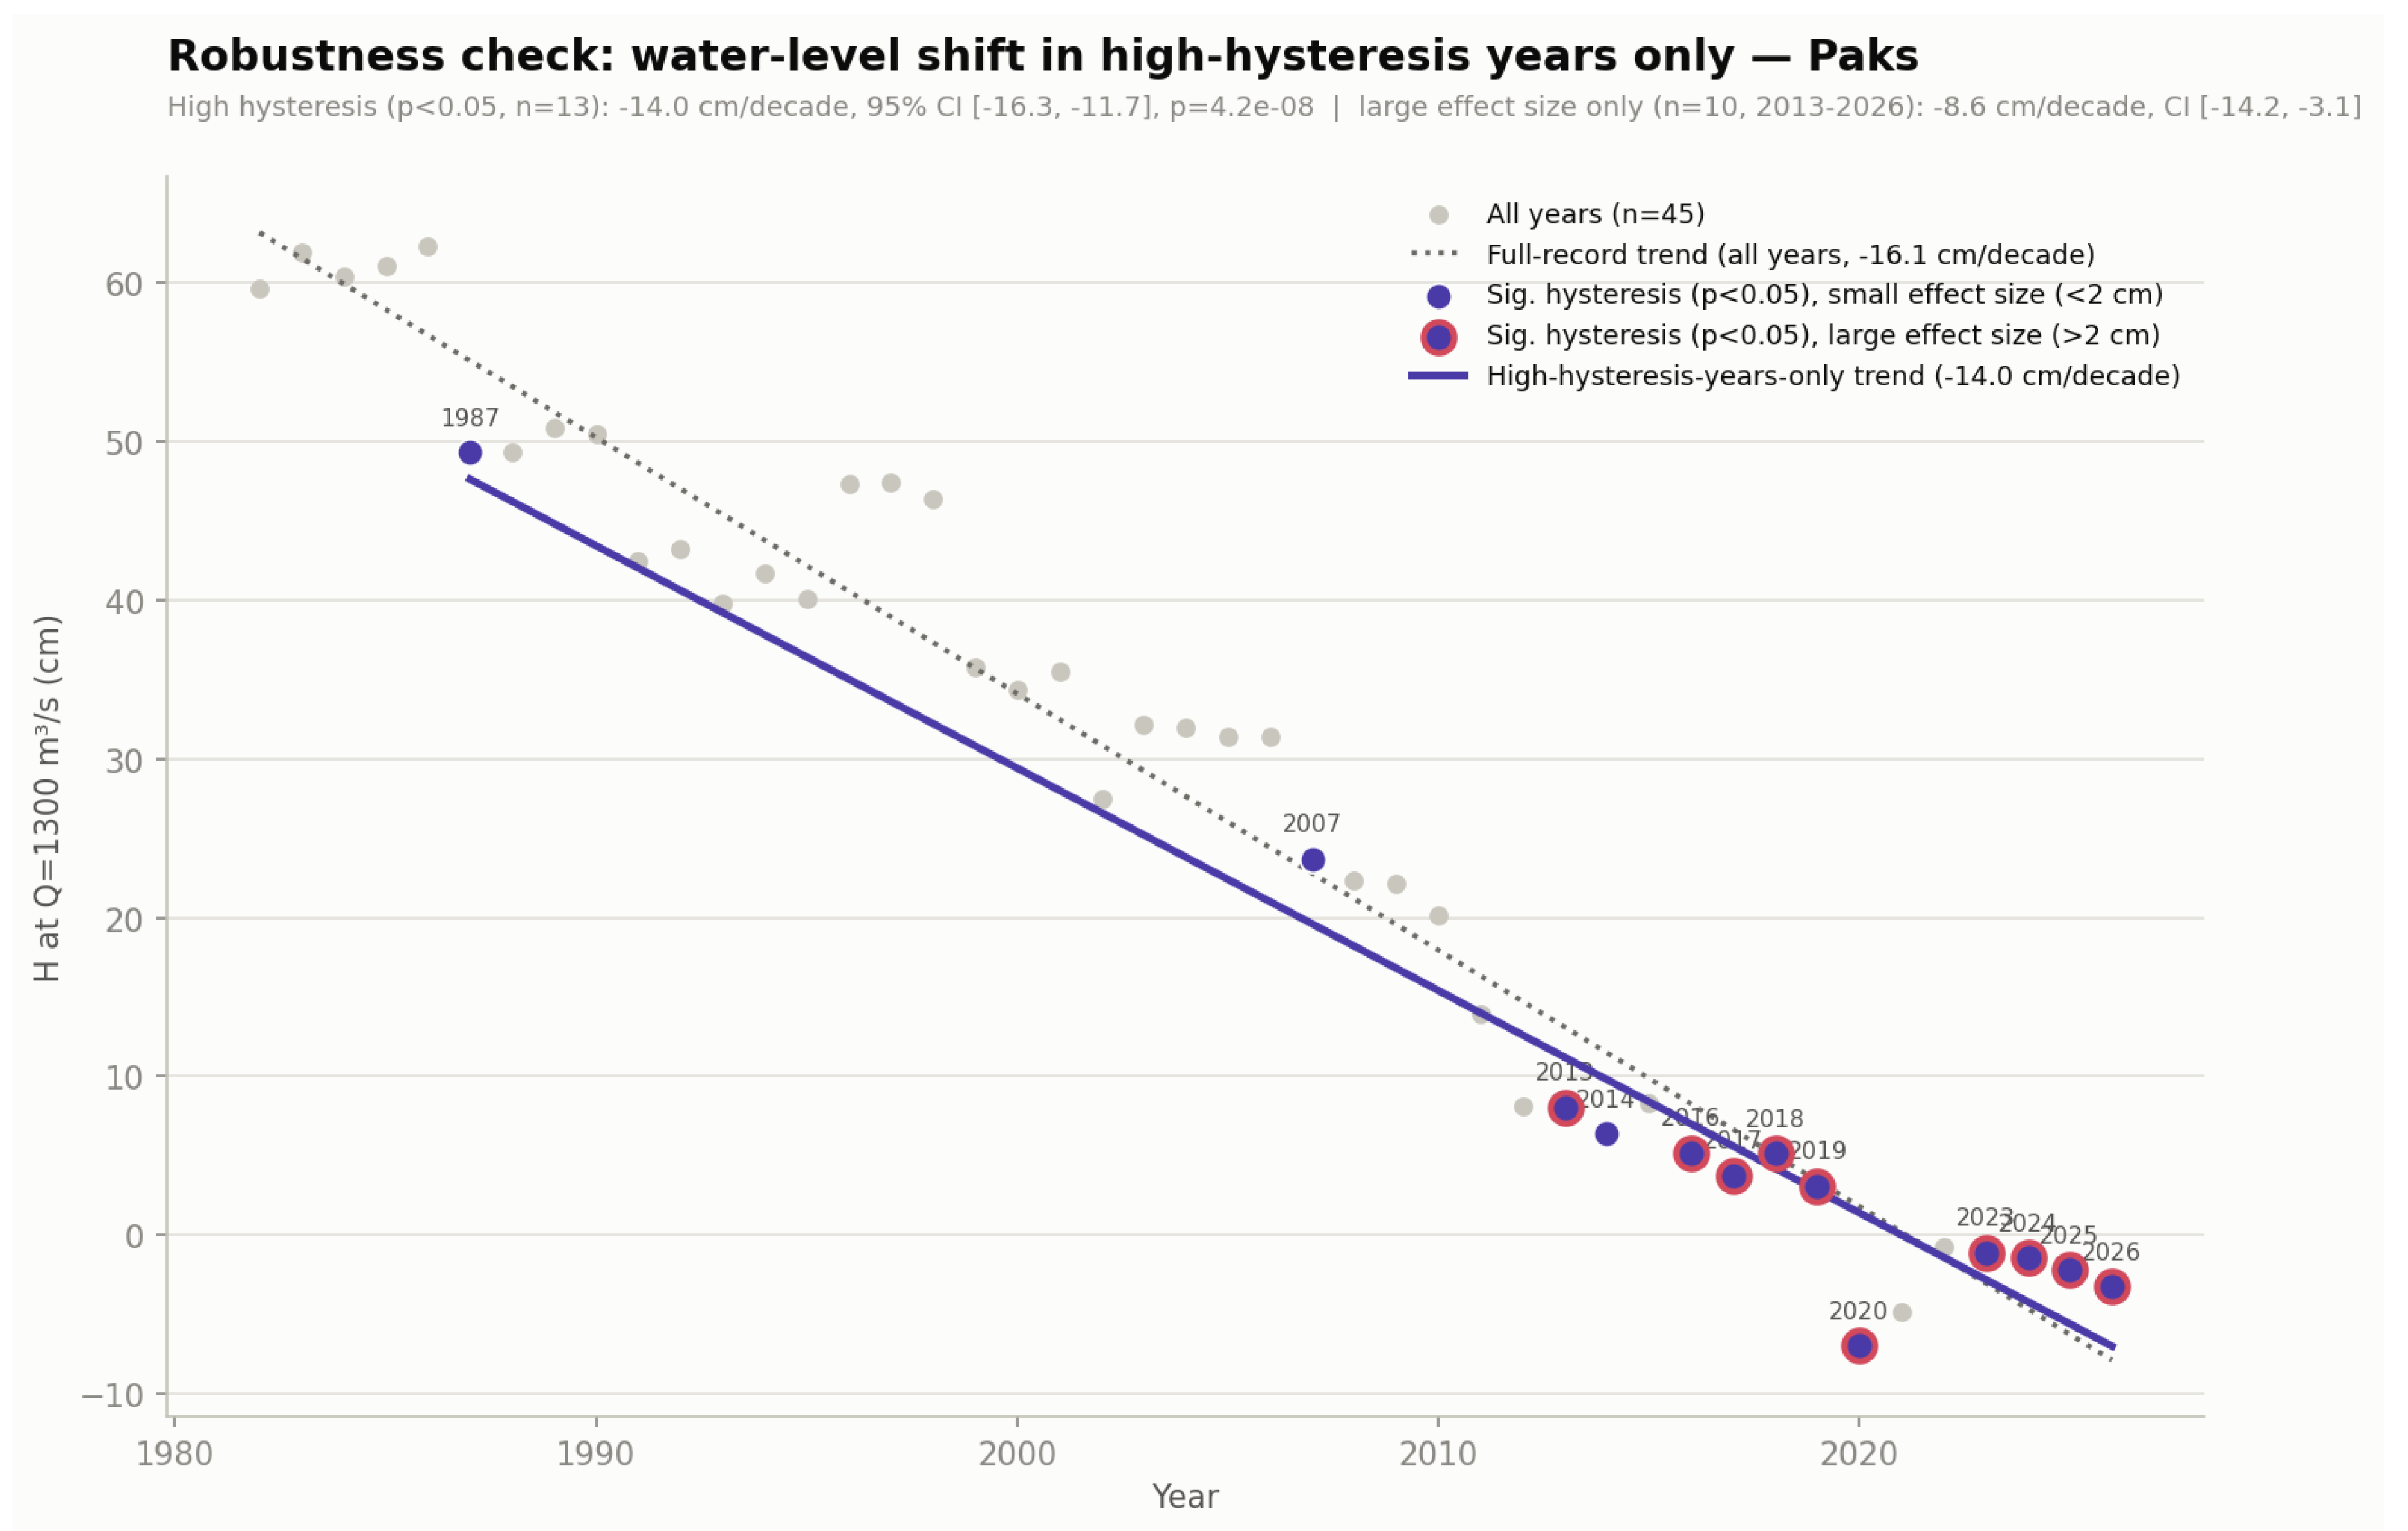
Figure 7.
Daily discharge (top) and water level (bottom) at Rajka and Paks, 15 September–15 November 1992. At Rajka, discharge falls approximately 75–85% and stage falls approximately 230 cm within five days of the diversion’s onset (∼25 October 1992, dashed line); at Paks, both series continue an ordinary autumn rise over the identical days, with no visible response. This is the daily-resolution evidence underlying the “abrupt one-time step at the diversion, then stable” pattern reported for Rajka in Table 1. Source: this study, from the daily Q–H series described in Section 2.3.
Figure 7.
Daily discharge (top) and water level (bottom) at Rajka and Paks, 15 September–15 November 1992. At Rajka, discharge falls approximately 75–85% and stage falls approximately 230 cm within five days of the diversion’s onset (∼25 October 1992, dashed line); at Paks, both series continue an ordinary autumn rise over the identical days, with no visible response. This is the daily-resolution evidence underlying the “abrupt one-time step at the diversion, then stable” pattern reported for Rajka in Table 1. Source: this study, from the daily Q–H series described in Section 2.3.
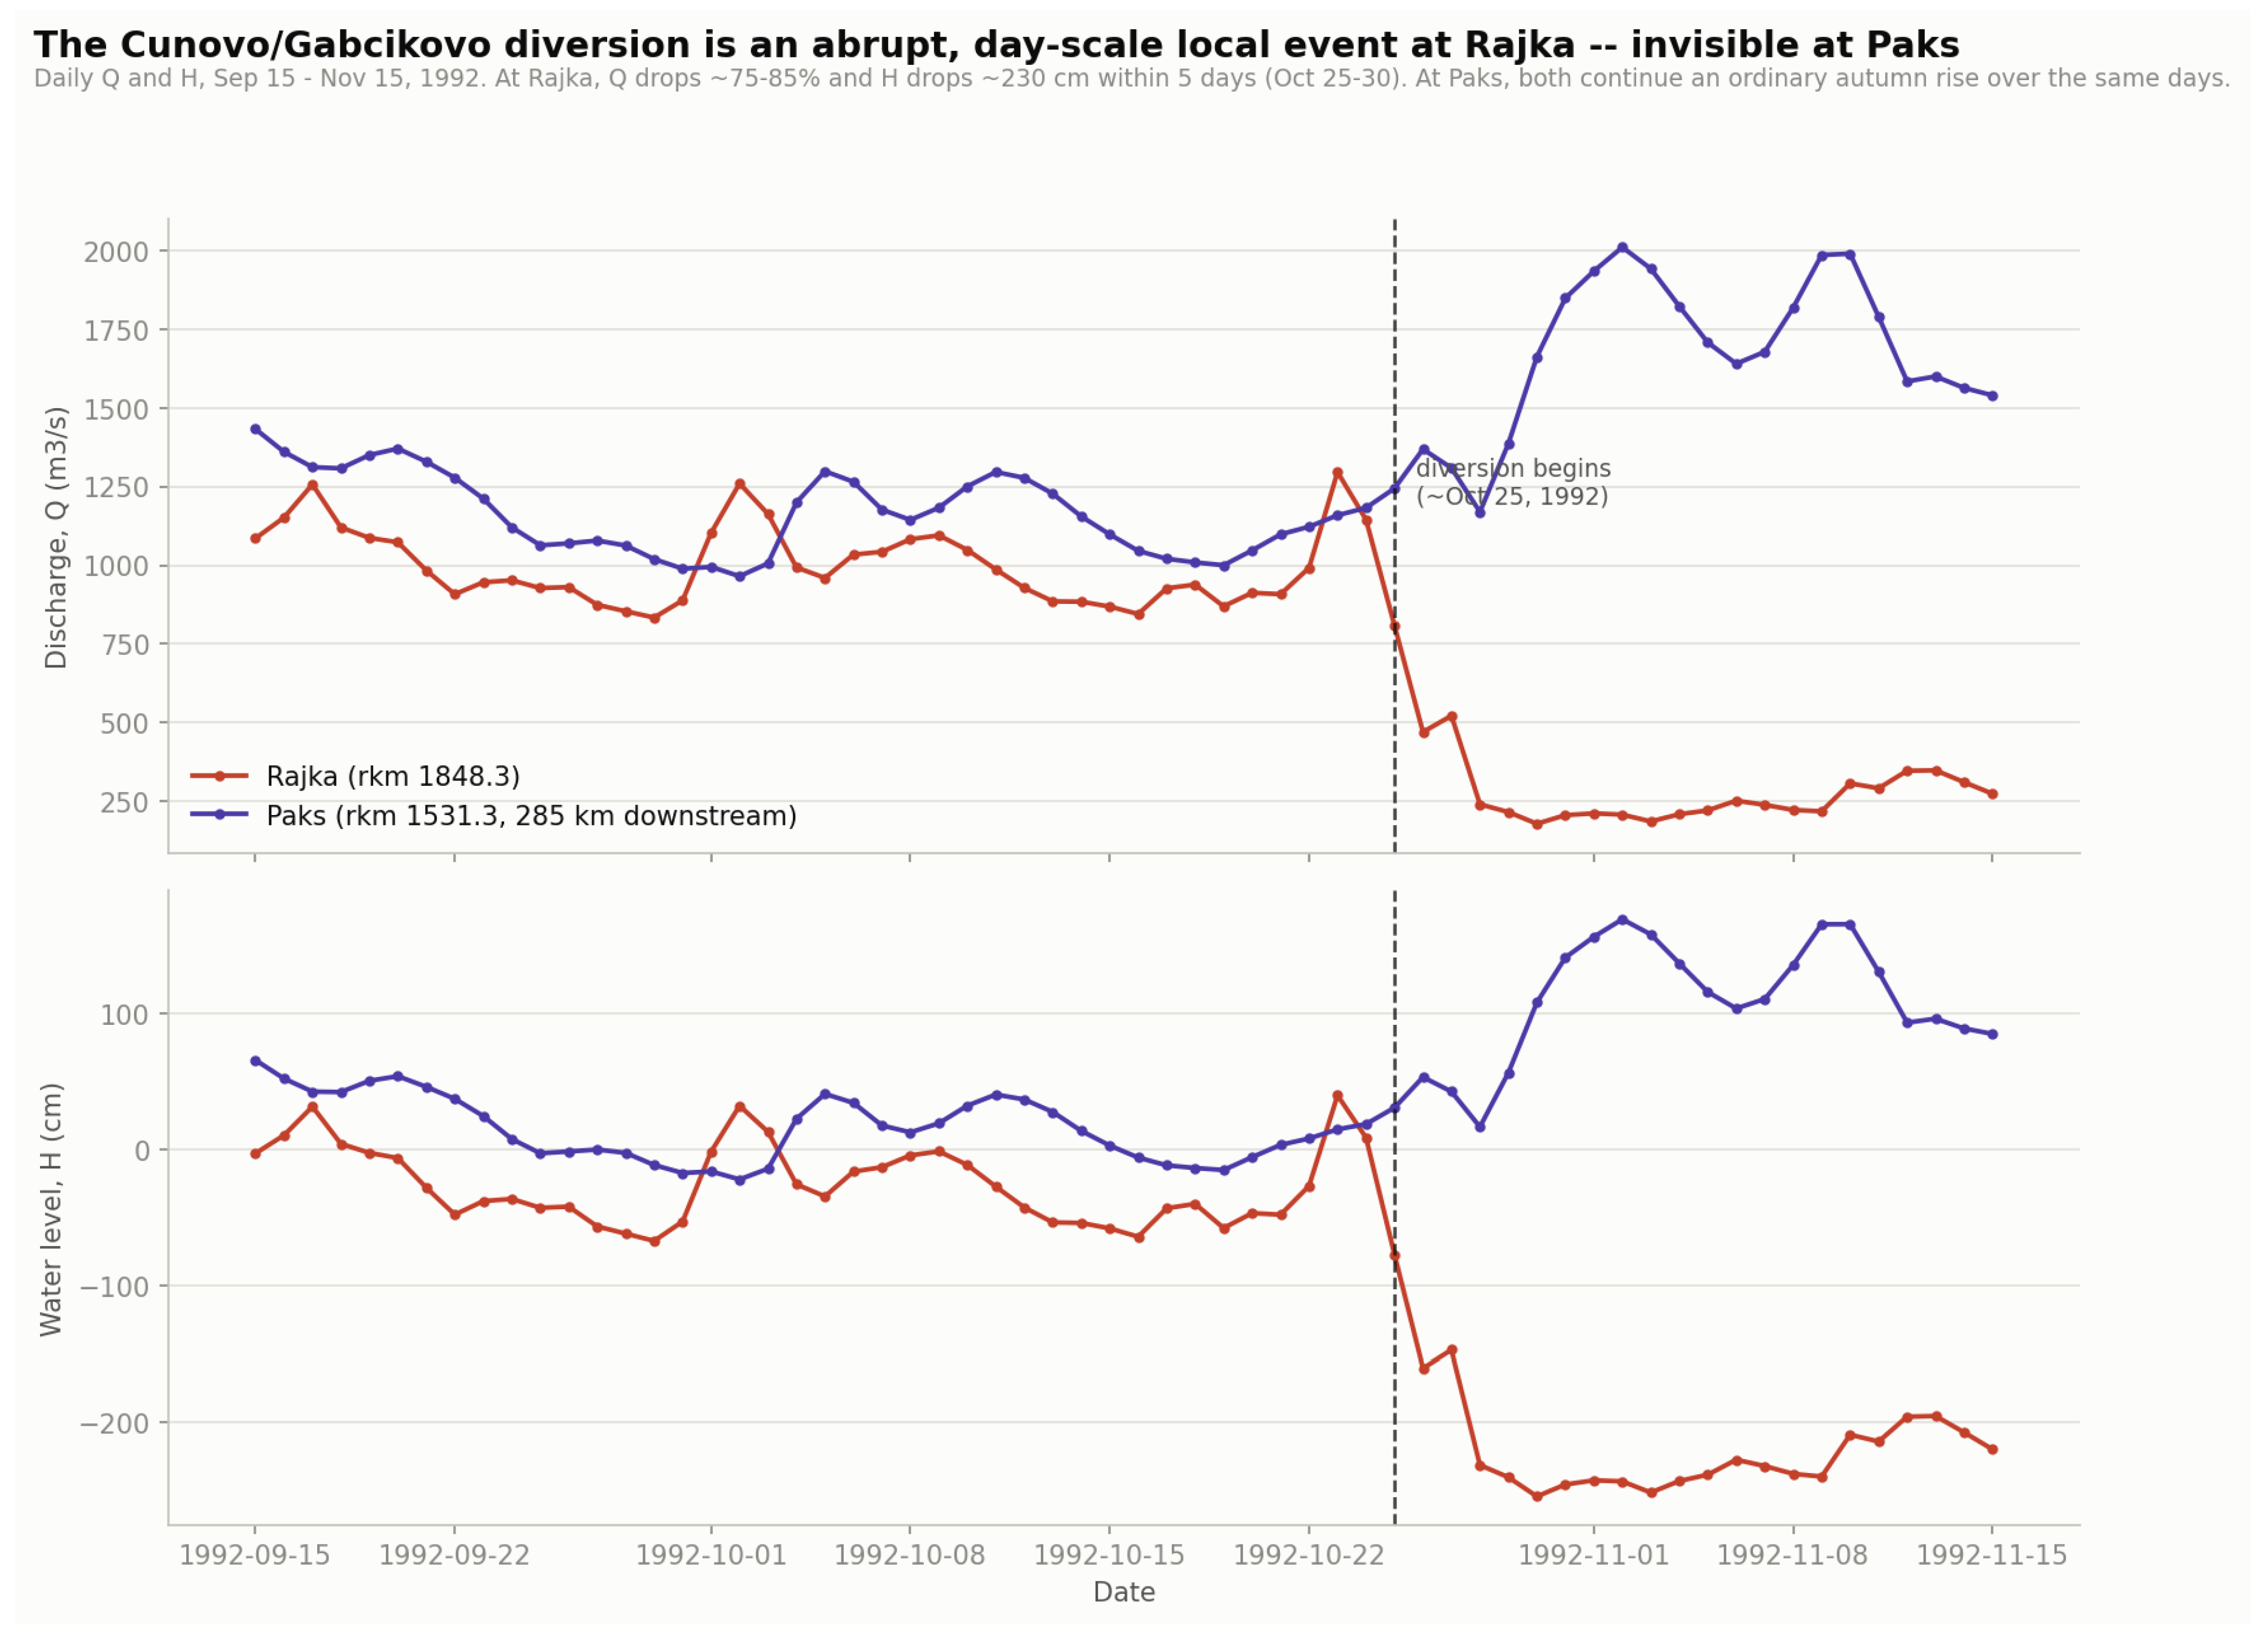
Figure 8.
Actual 2026 daily water level at Paks (solid) versus the counterfactual level implied by that day’s actual discharge under the 1982–1986 epoch’s fitted rating curve (dotted), 1 January–30 July 2026; the shaded band marks the 27–31 July hydraulic-shutdown episode. Red markers identify days whose discharge falls below the 1982–1986 epoch’s own observed minimum, i.e. where the counterfactual value is an extrapolation rather than a direct comparison (as noted in the text, this includes the lowest-discharge days of the 27–31 July episode itself). The gap between the two curves is the −65.9 cm median shift reported in the text; note that the gap is not constant with discharge, narrowing somewhat at the highest flows (early March) and widening again at the lowest. Source: this study, from the 1981–2026 daily Q–H series used throughout Section 4, using the same functional form as Figure 5.
Figure 8.
Actual 2026 daily water level at Paks (solid) versus the counterfactual level implied by that day’s actual discharge under the 1982–1986 epoch’s fitted rating curve (dotted), 1 January–30 July 2026; the shaded band marks the 27–31 July hydraulic-shutdown episode. Red markers identify days whose discharge falls below the 1982–1986 epoch’s own observed minimum, i.e. where the counterfactual value is an extrapolation rather than a direct comparison (as noted in the text, this includes the lowest-discharge days of the 27–31 July episode itself). The gap between the two curves is the −65.9 cm median shift reported in the text; note that the gap is not constant with discharge, narrowing somewhat at the highest flows (early March) and widening again at the lowest. Source: this study, from the 1981–2026 daily Q–H series used throughout Section 4, using the same functional form as Figure 5.
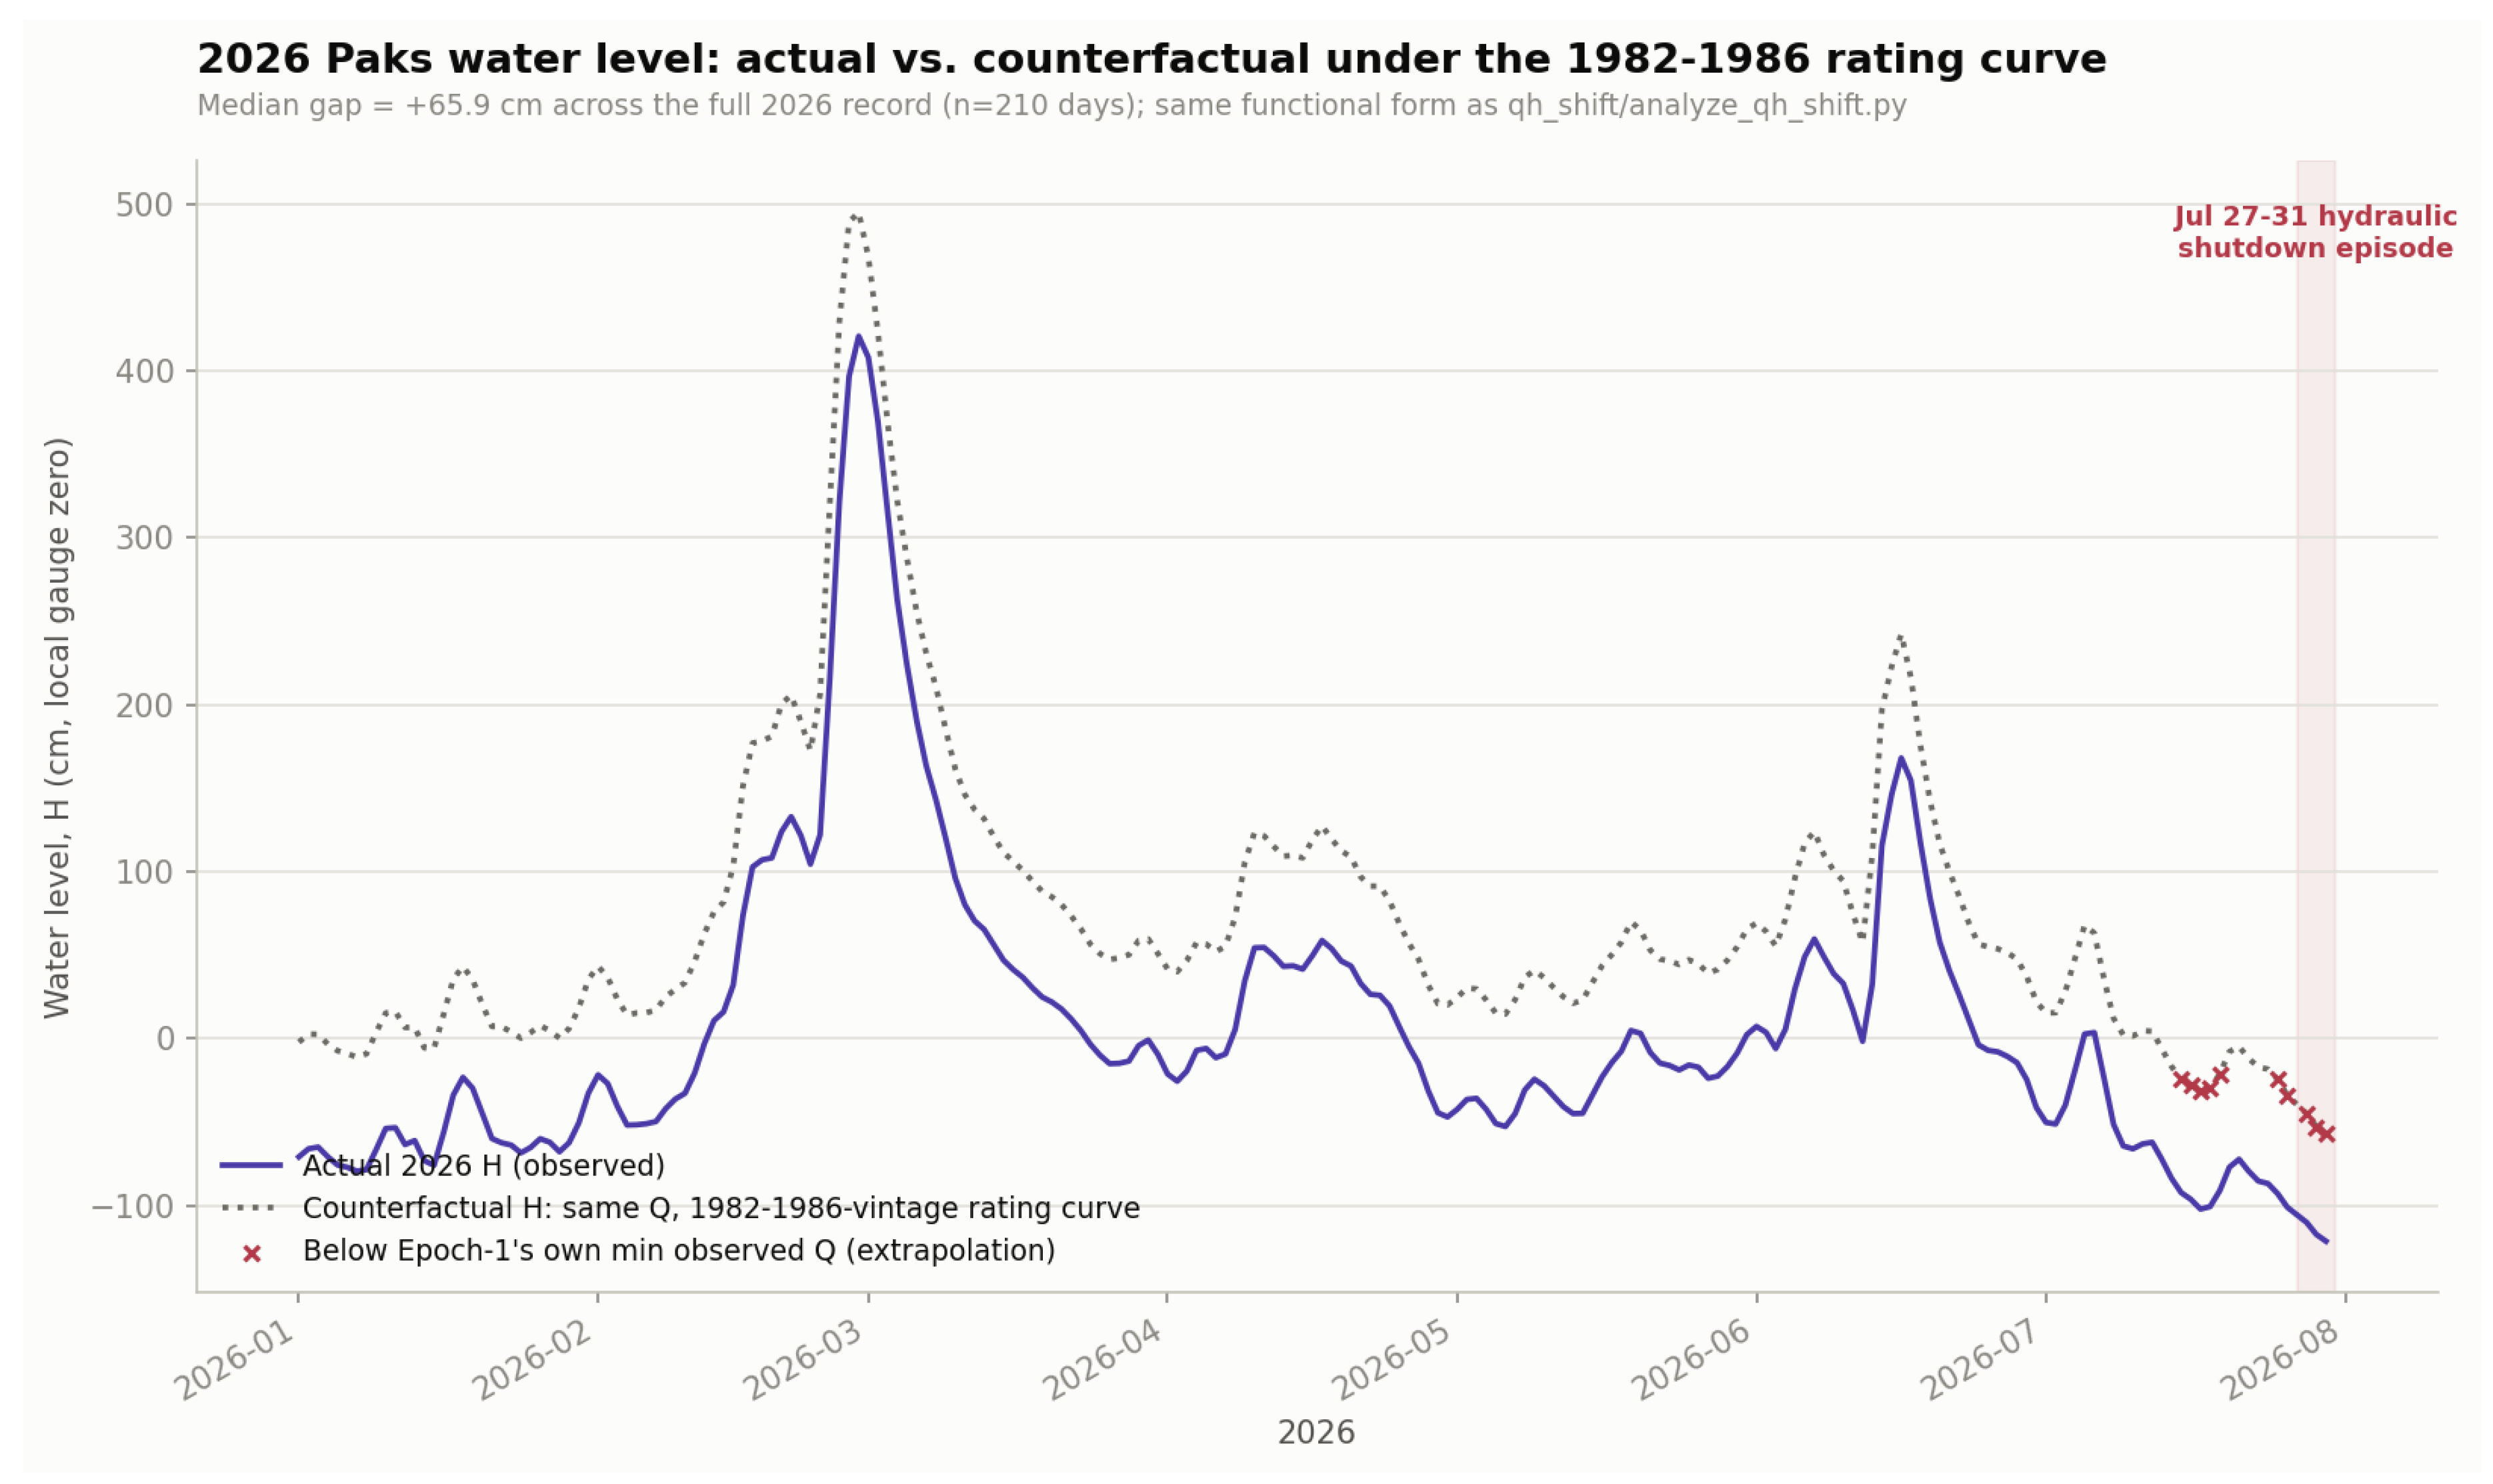
Figure 9.
Observed annual low-water (minimum daily) stage at the Paks gauge, 1981–2026, with the 2018 and 2026 record minima highlighted, alongside the Paks II environmental impact study’s three subsidence-forecast branches (logarithmic/optimistic −0.36 cm/yr, mean of methods −1.31 cm/yr, linear/pessimistic −2.27 cm/yr; anchored at the observed 2012 annual minimum, the assessment’s own forecast baseline year) and the static 1-in-20,000-year design low-water level (83.78 m above Baltic datum = −160 cm on the local gauge datum, using the 85.38 m gauge-zero elevation established in Section 4.2). Source: this study (own H series); forecast branches and design level from MVM Paks II Zrt. [12] (Ch. 11).
Figure 9.
Observed annual low-water (minimum daily) stage at the Paks gauge, 1981–2026, with the 2018 and 2026 record minima highlighted, alongside the Paks II environmental impact study’s three subsidence-forecast branches (logarithmic/optimistic −0.36 cm/yr, mean of methods −1.31 cm/yr, linear/pessimistic −2.27 cm/yr; anchored at the observed 2012 annual minimum, the assessment’s own forecast baseline year) and the static 1-in-20,000-year design low-water level (83.78 m above Baltic datum = −160 cm on the local gauge datum, using the 85.38 m gauge-zero elevation established in Section 4.2). Source: this study (own H series); forecast branches and design level from MVM Paks II Zrt. [12] (Ch. 11).
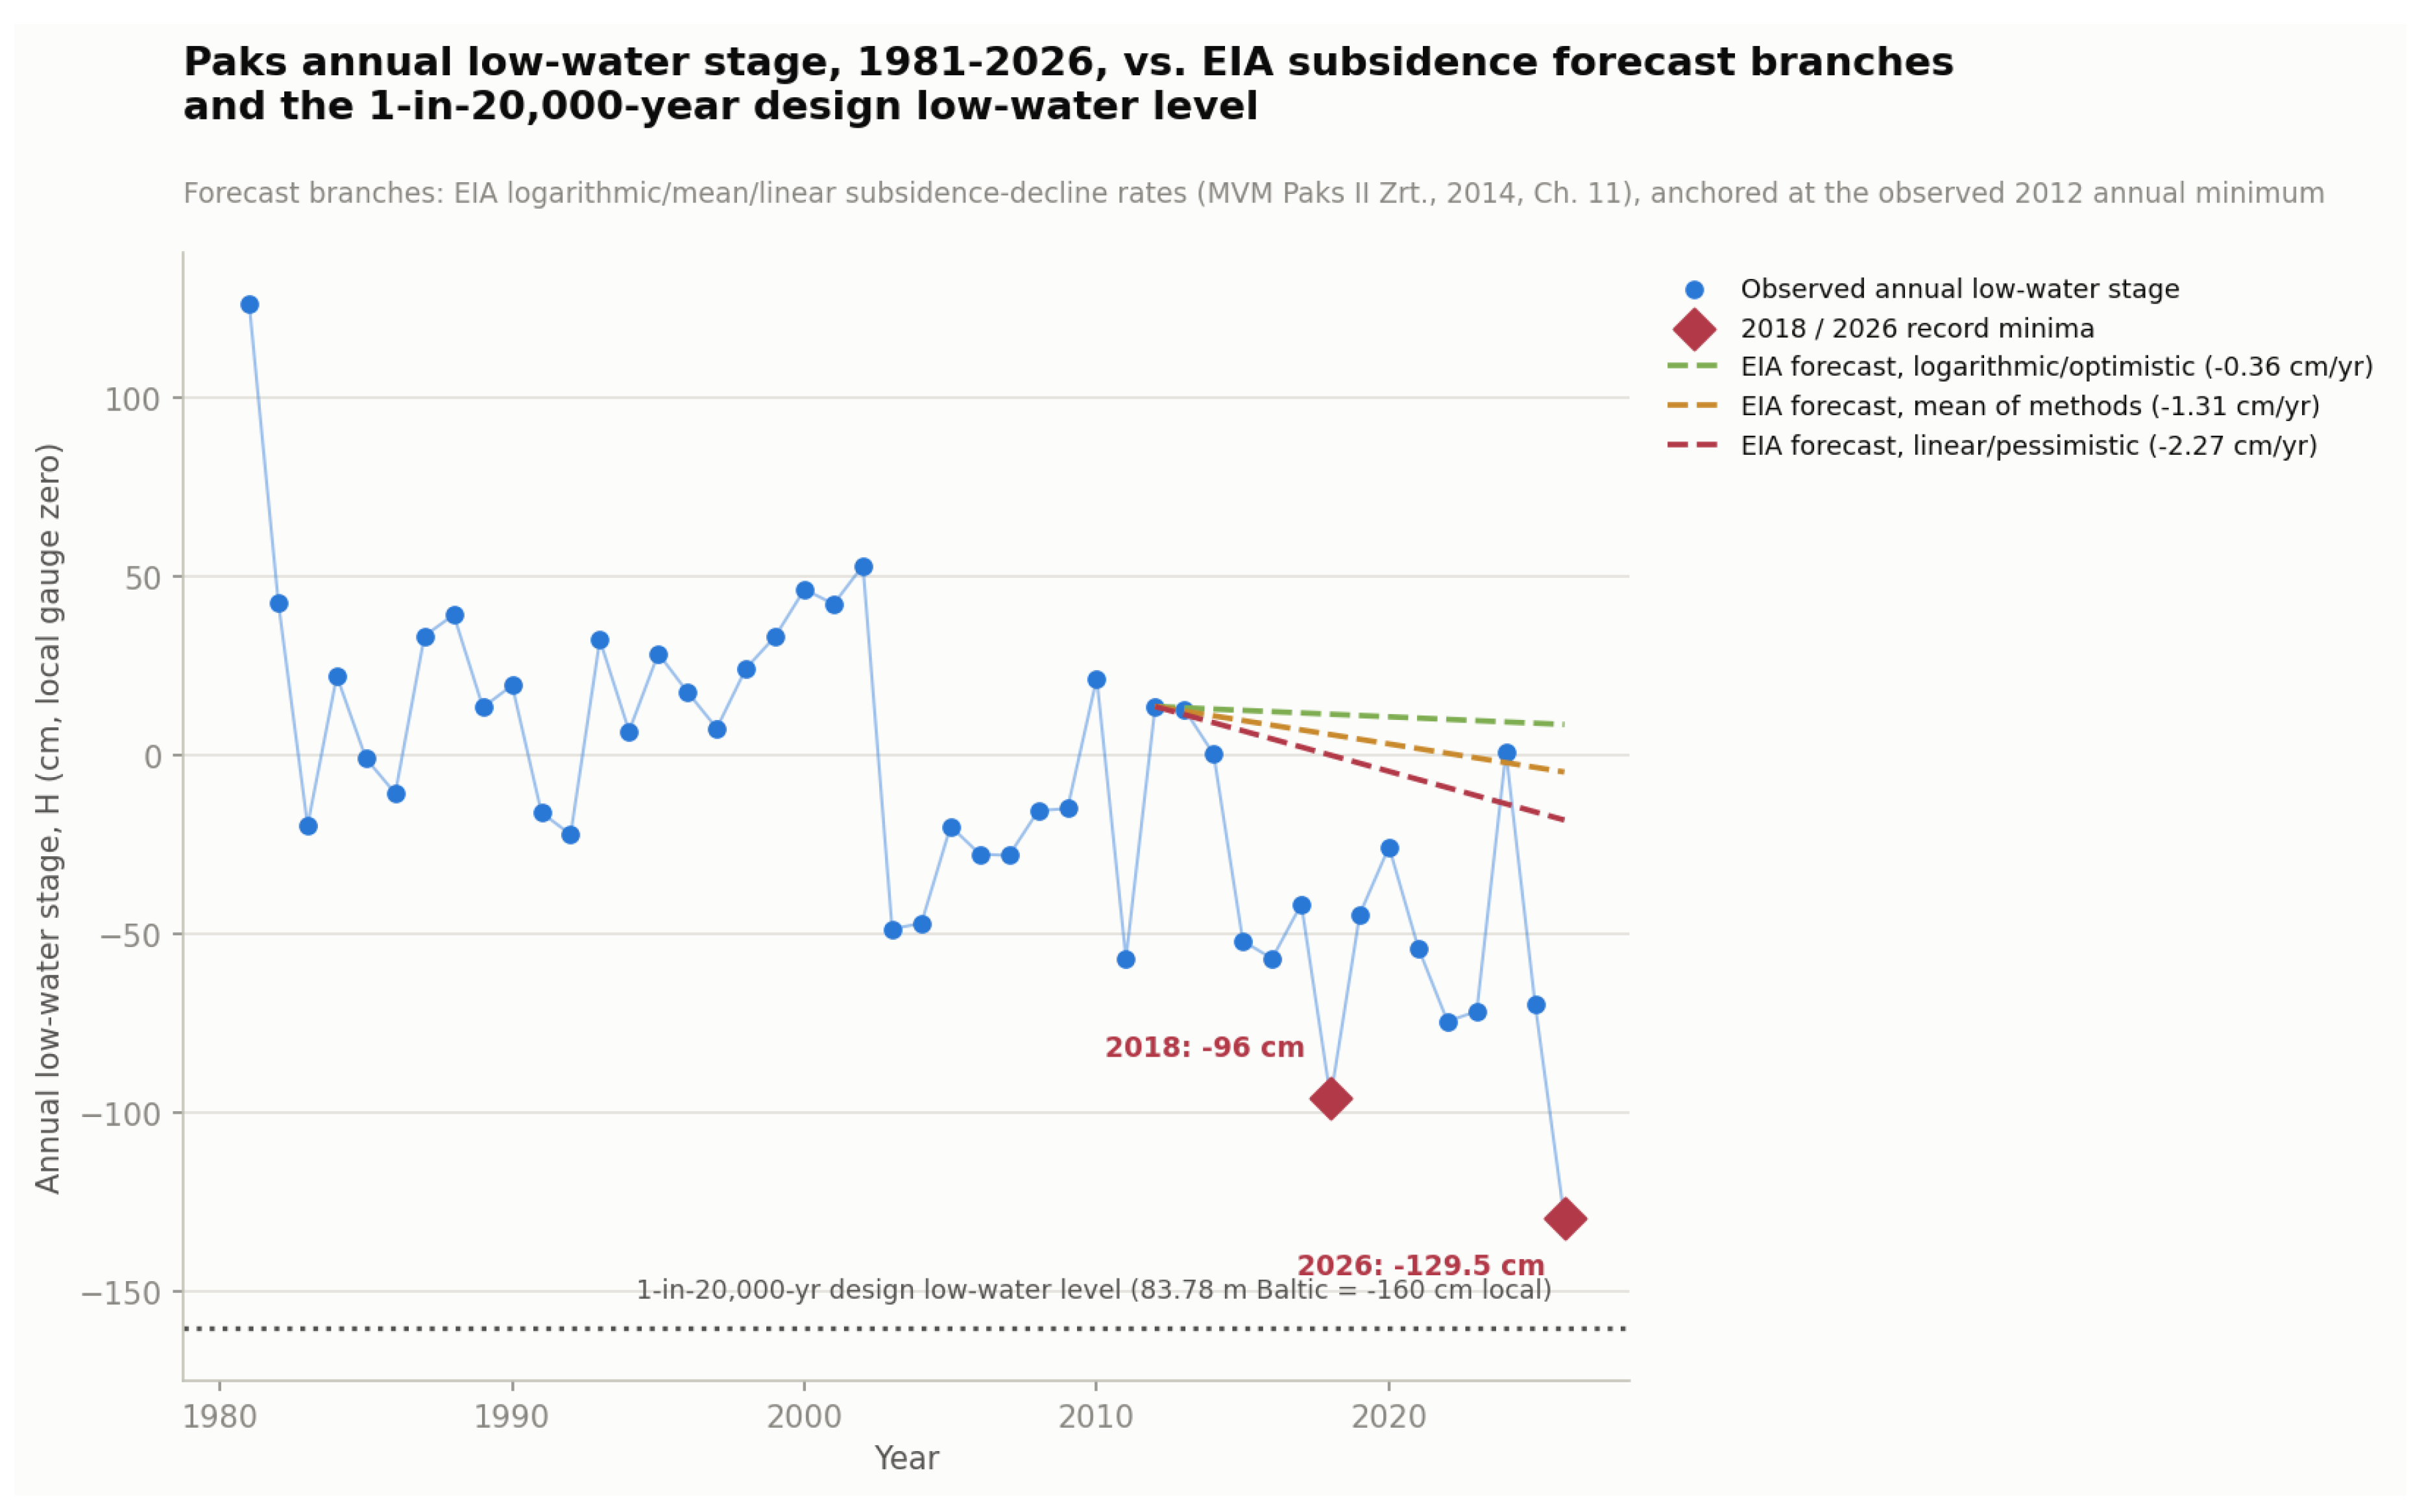
Figure 10.
Daily old-bed flow share (Rajka discharge divided by next-day Komárom discharge, approximating the combined downstream flow) across the calendar year, for 2018, 2022, and 2026, plotted against the 1993–2025 historical median and 5th–95th percentile band. The Rajka gauge sits on the reduced-flow historical channel just below the Čunovo diversion weir, not upstream of it, so a below-normal share would be the expected signature of anomalous upstream retention; instead, 2026 tracks at or above the historical band for essentially the entire partial-year record shown, consistent with the (2022) and elevated-share (2026) findings reported in the text. Source: this study, from the Rajka and Komárom discharge series described in Section 2.3.
Figure 10.
Daily old-bed flow share (Rajka discharge divided by next-day Komárom discharge, approximating the combined downstream flow) across the calendar year, for 2018, 2022, and 2026, plotted against the 1993–2025 historical median and 5th–95th percentile band. The Rajka gauge sits on the reduced-flow historical channel just below the Čunovo diversion weir, not upstream of it, so a below-normal share would be the expected signature of anomalous upstream retention; instead, 2026 tracks at or above the historical band for essentially the entire partial-year record shown, consistent with the (2022) and elevated-share (2026) findings reported in the text. Source: this study, from the Rajka and Komárom discharge series described in Section 2.3.
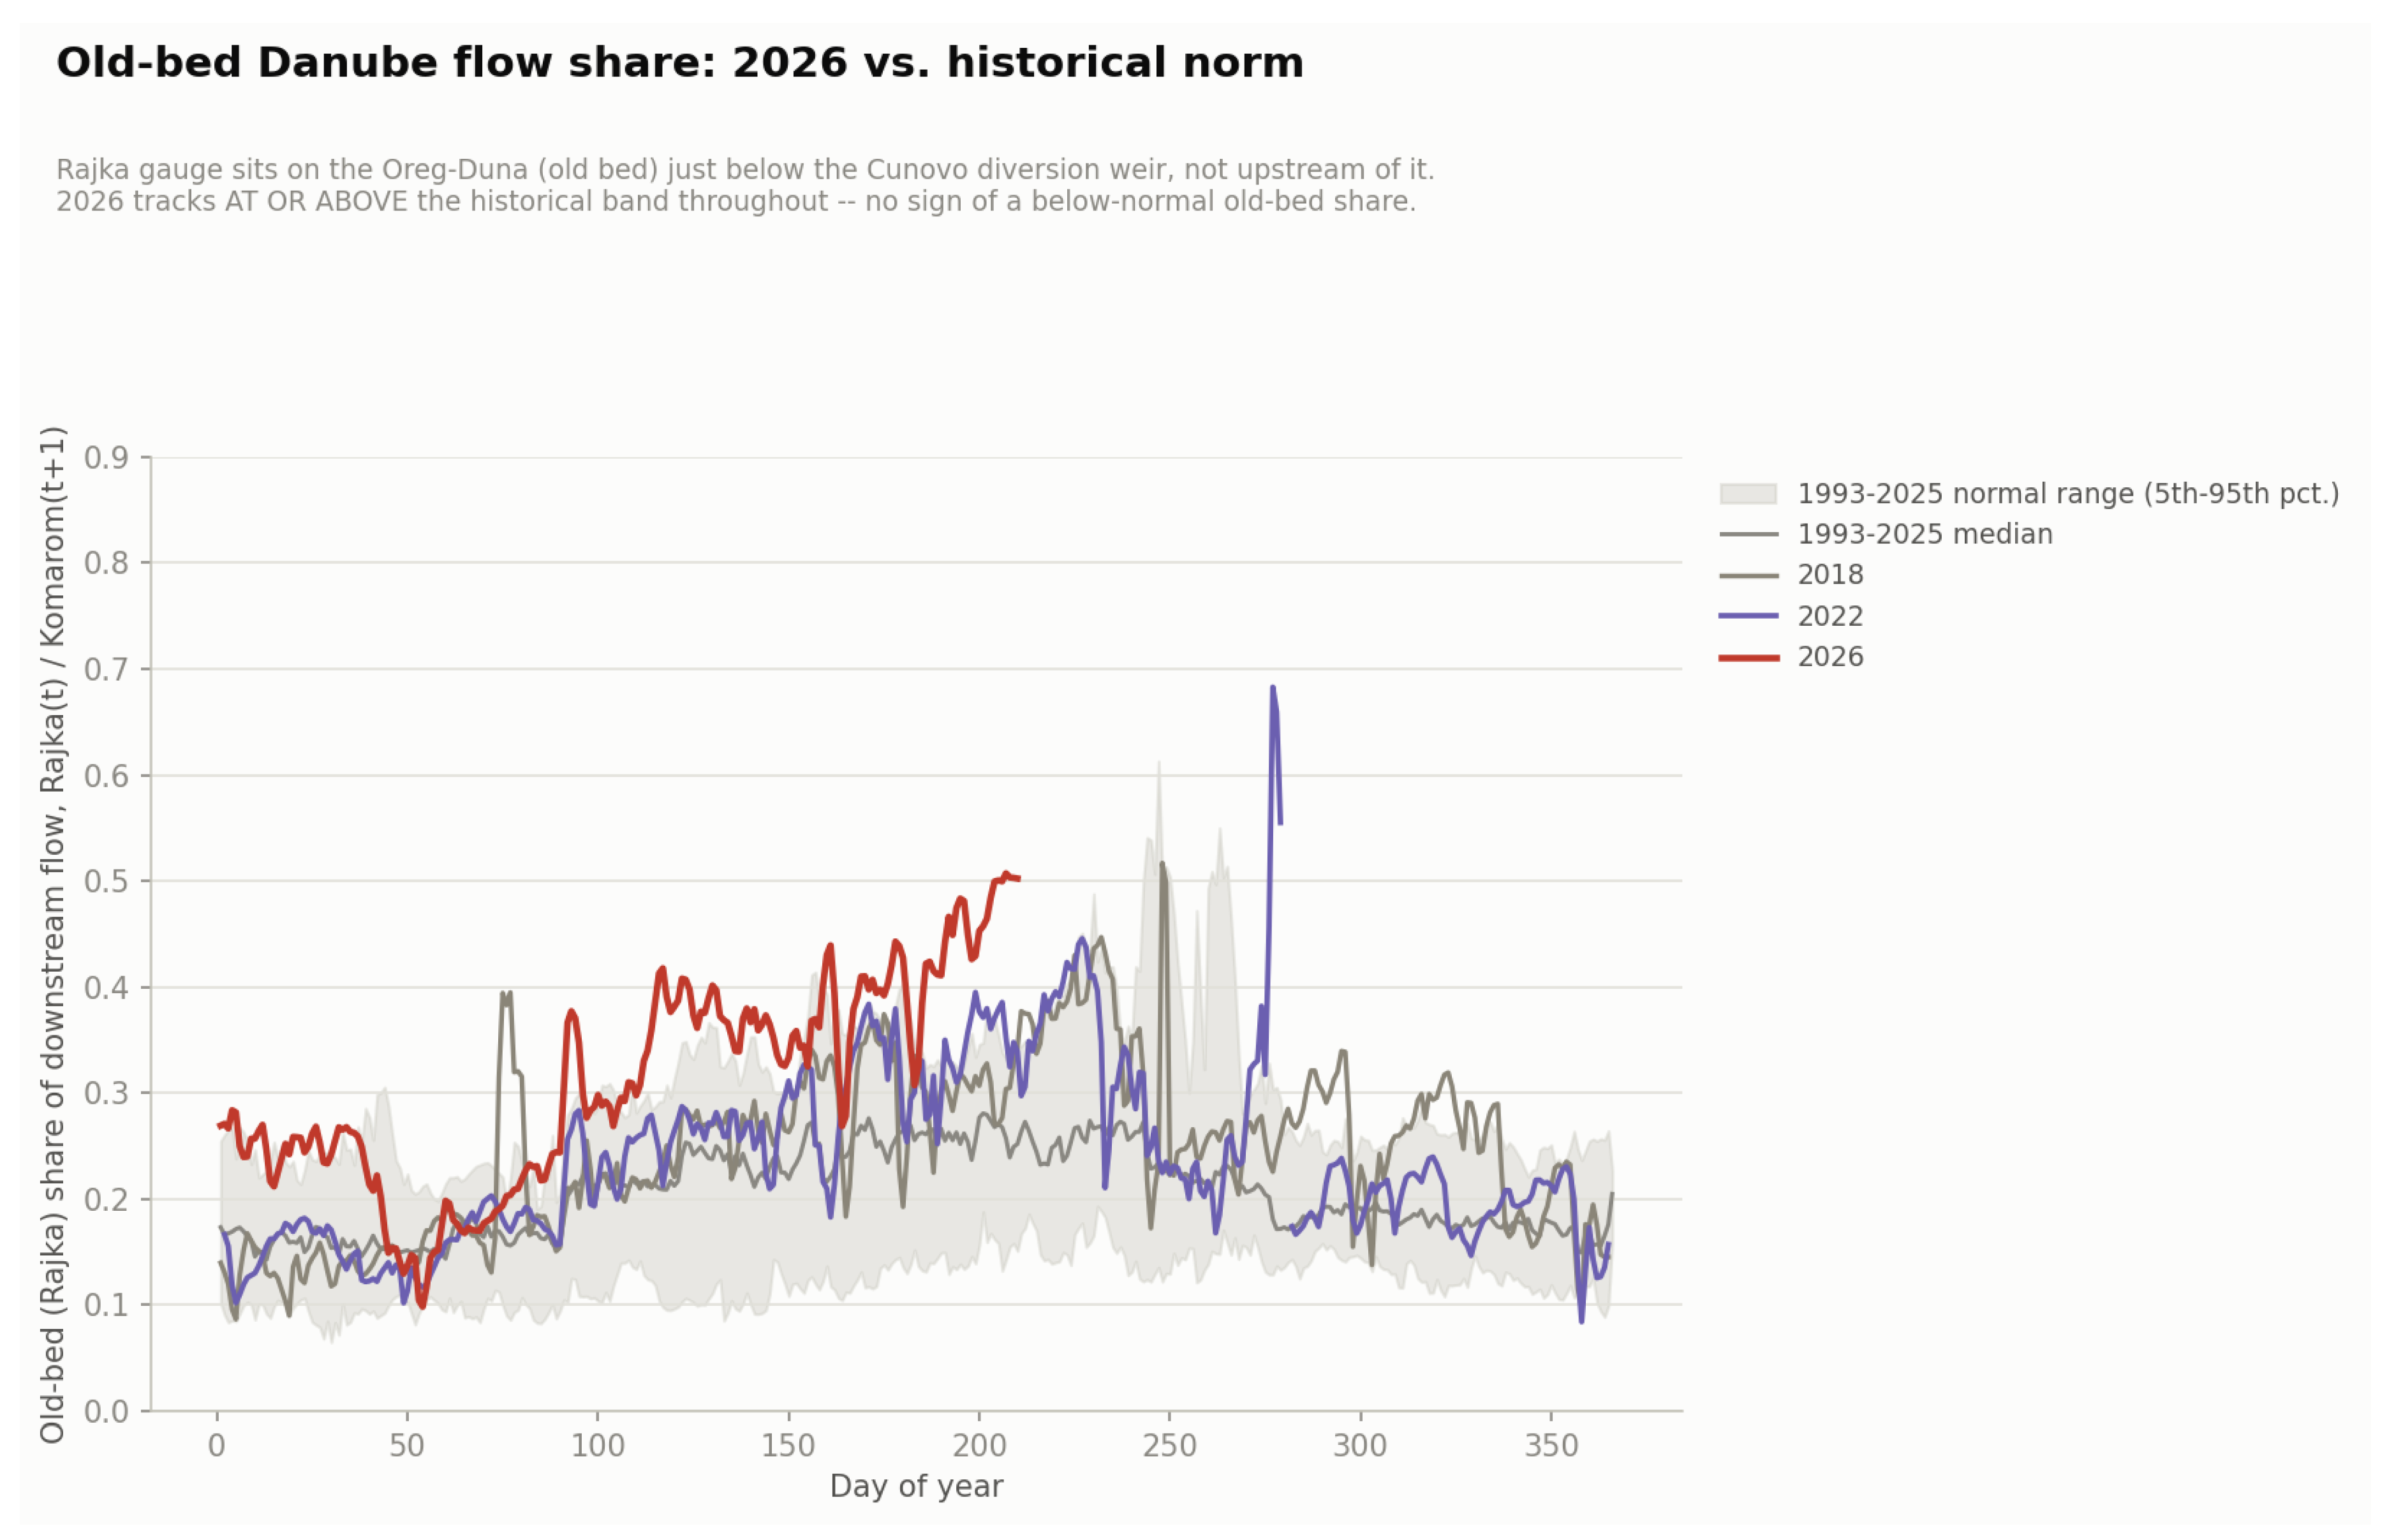
Figure 11.
Daily discharge at Devín (top) and Wildungsmauer (bottom) for each winter (1 December–28 February, aligned by day-of-winter) in the two stations’ overlapping record, with winter 2025–2026 highlighted. Far from showing an anomalous high-inflow period consistent with upstream reservoir filling ahead of the 2026 drought, 2025–2026 tracks at or below every prior winter on record for most of its length at both stations: direct visual support for the “no surplus to bank” finding reported in the text. Source: this study, from the Devín and Wildungsmauer discharge series described in Section 2.3.
Figure 11.
Daily discharge at Devín (top) and Wildungsmauer (bottom) for each winter (1 December–28 February, aligned by day-of-winter) in the two stations’ overlapping record, with winter 2025–2026 highlighted. Far from showing an anomalous high-inflow period consistent with upstream reservoir filling ahead of the 2026 drought, 2025–2026 tracks at or below every prior winter on record for most of its length at both stations: direct visual support for the “no surplus to bank” finding reported in the text. Source: this study, from the Devín and Wildungsmauer discharge series described in Section 2.3.
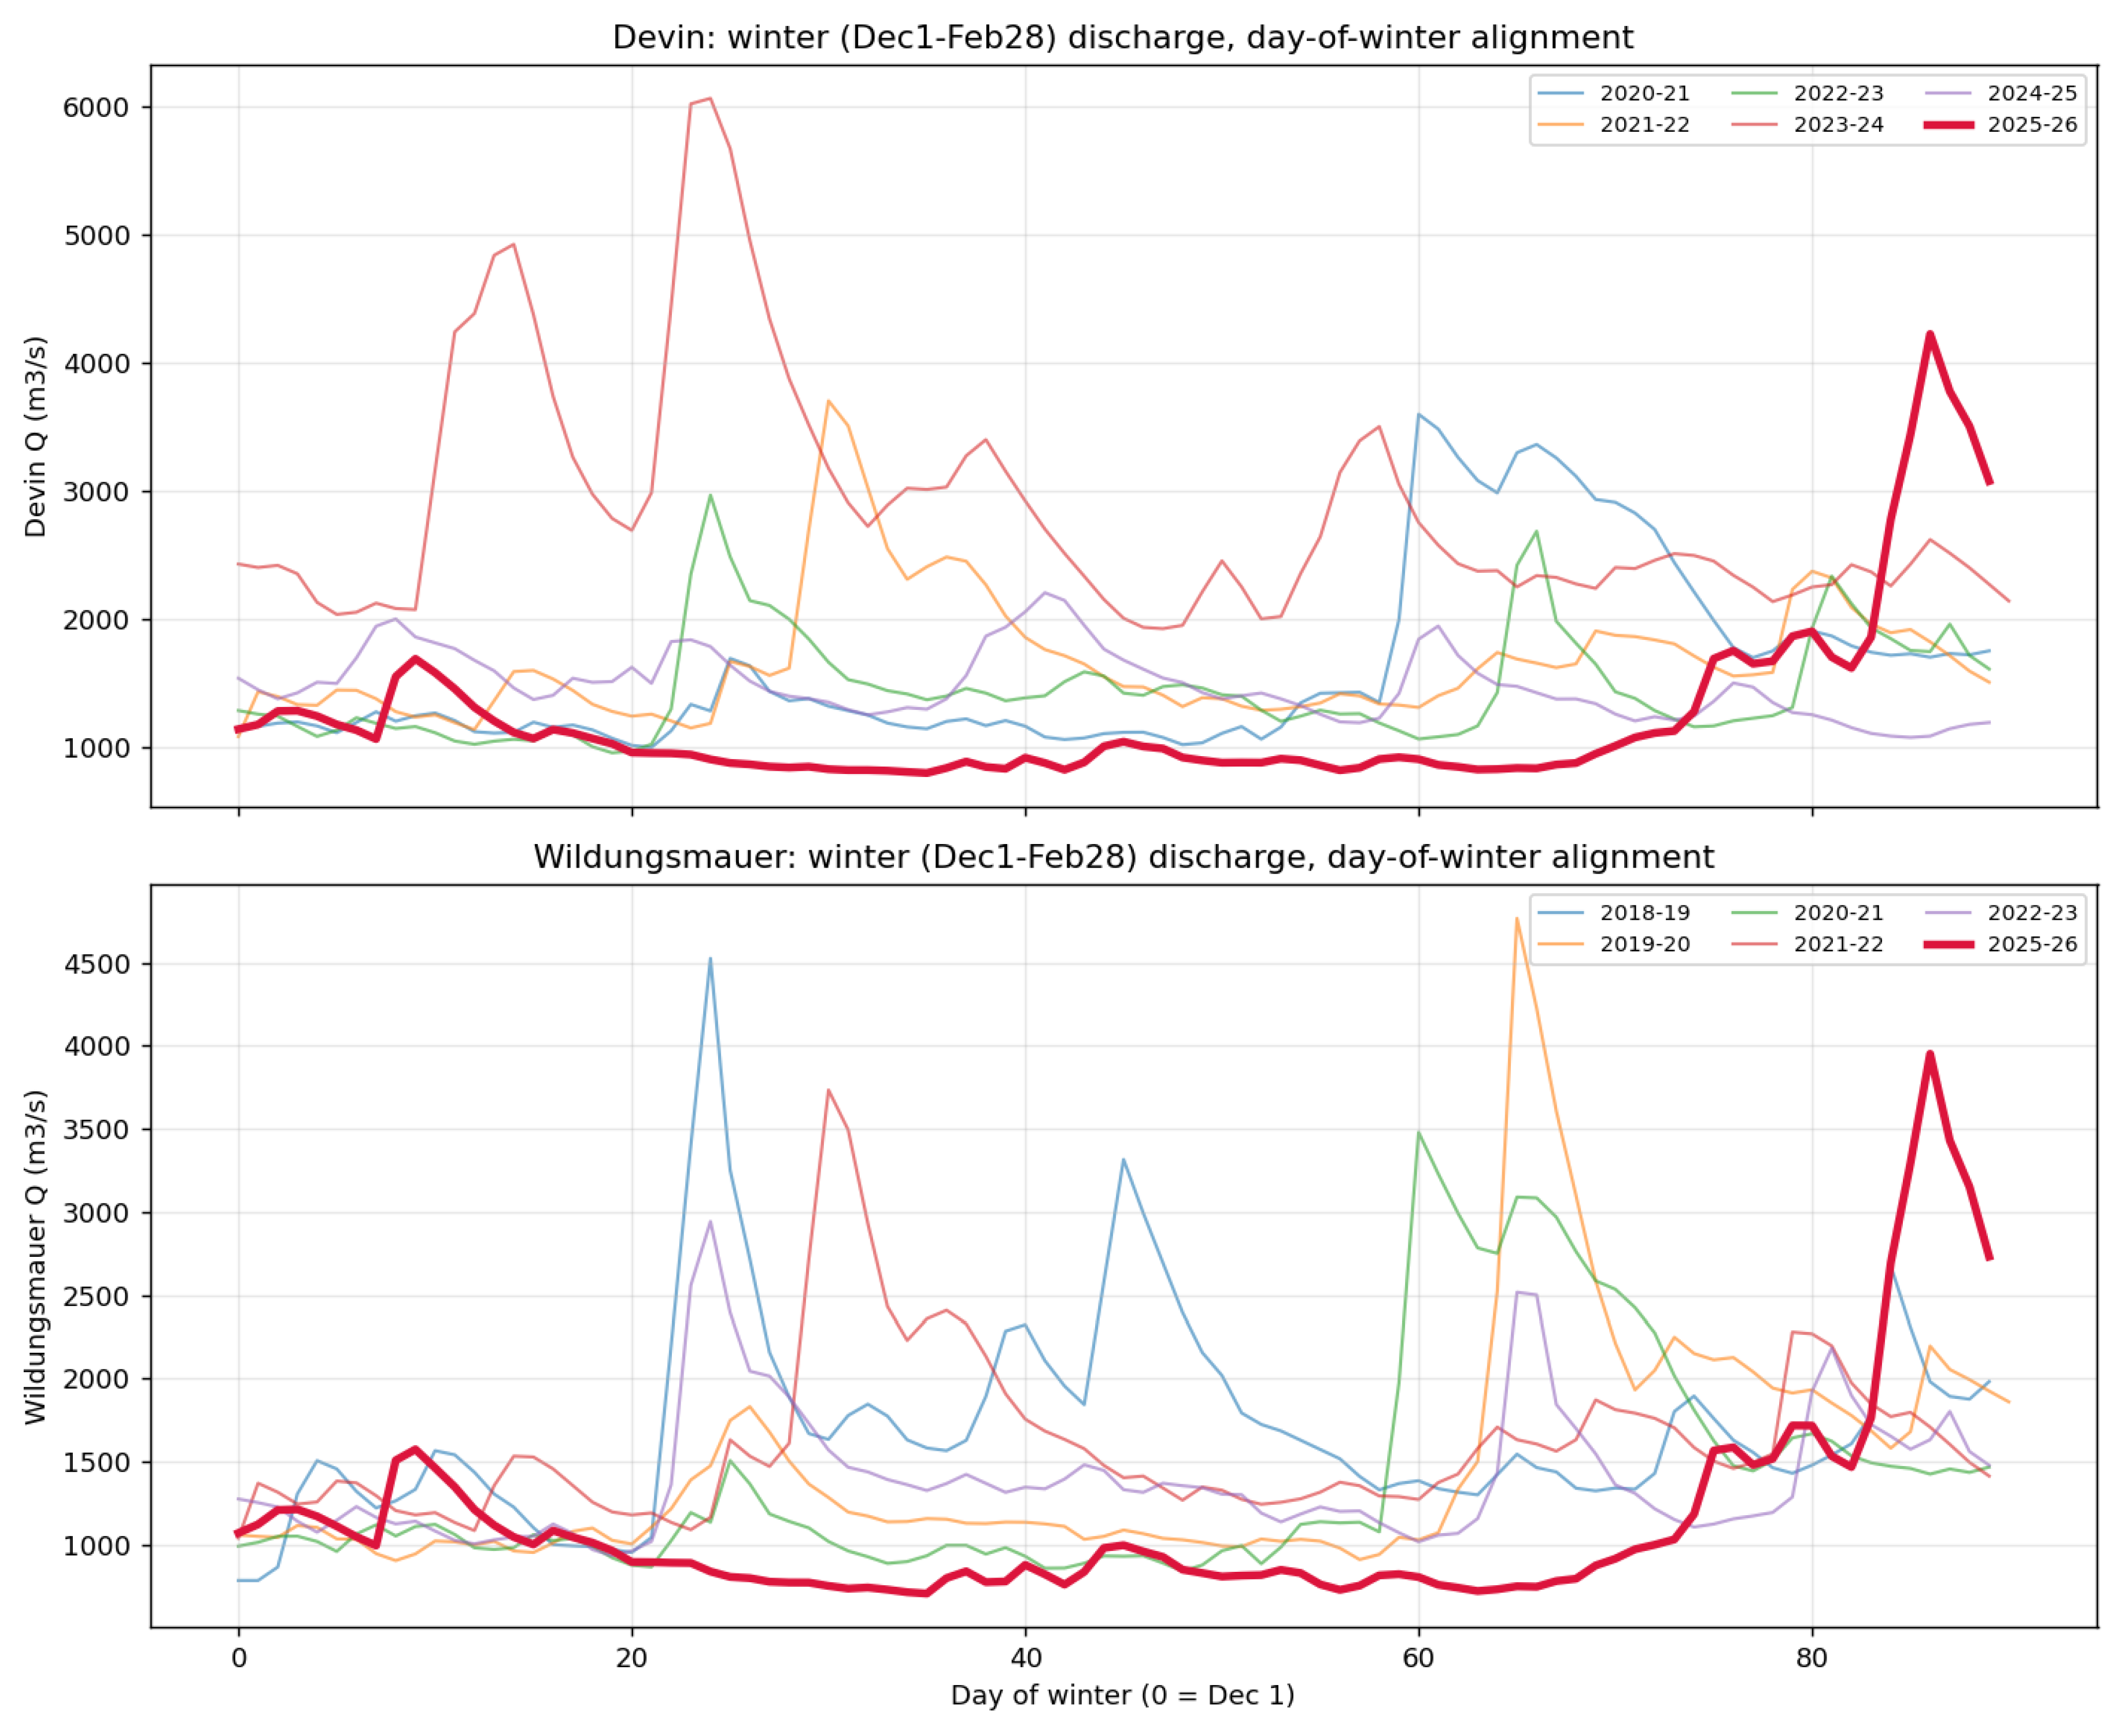
Figure 12.
Daily mean discharge at Wildungsmauer, Austria (43 km above the Čunovo diversion, hydraulically isolated from it) and at Paks, Hungary (≈349 river-km downstream), January–July 2026. The two series track closely in timing and relative magnitude throughout the year, including through the spring flood peaks and the summer minimum: direct visual support for the near-zero Wildungsmauer–Paks z-score reported in the text, i.e. that the 2026 deficit measured at this true upstream reference station propagates to Paks without evidence of anomalous gain or loss along the intervening reach. Source: this study, from the Wildungsmauer and Paks discharge series described in Section 2.3.
Figure 12.
Daily mean discharge at Wildungsmauer, Austria (43 km above the Čunovo diversion, hydraulically isolated from it) and at Paks, Hungary (≈349 river-km downstream), January–July 2026. The two series track closely in timing and relative magnitude throughout the year, including through the spring flood peaks and the summer minimum: direct visual support for the near-zero Wildungsmauer–Paks z-score reported in the text, i.e. that the 2026 deficit measured at this true upstream reference station propagates to Paks without evidence of anomalous gain or loss along the intervening reach. Source: this study, from the Wildungsmauer and Paks discharge series described in Section 2.3.
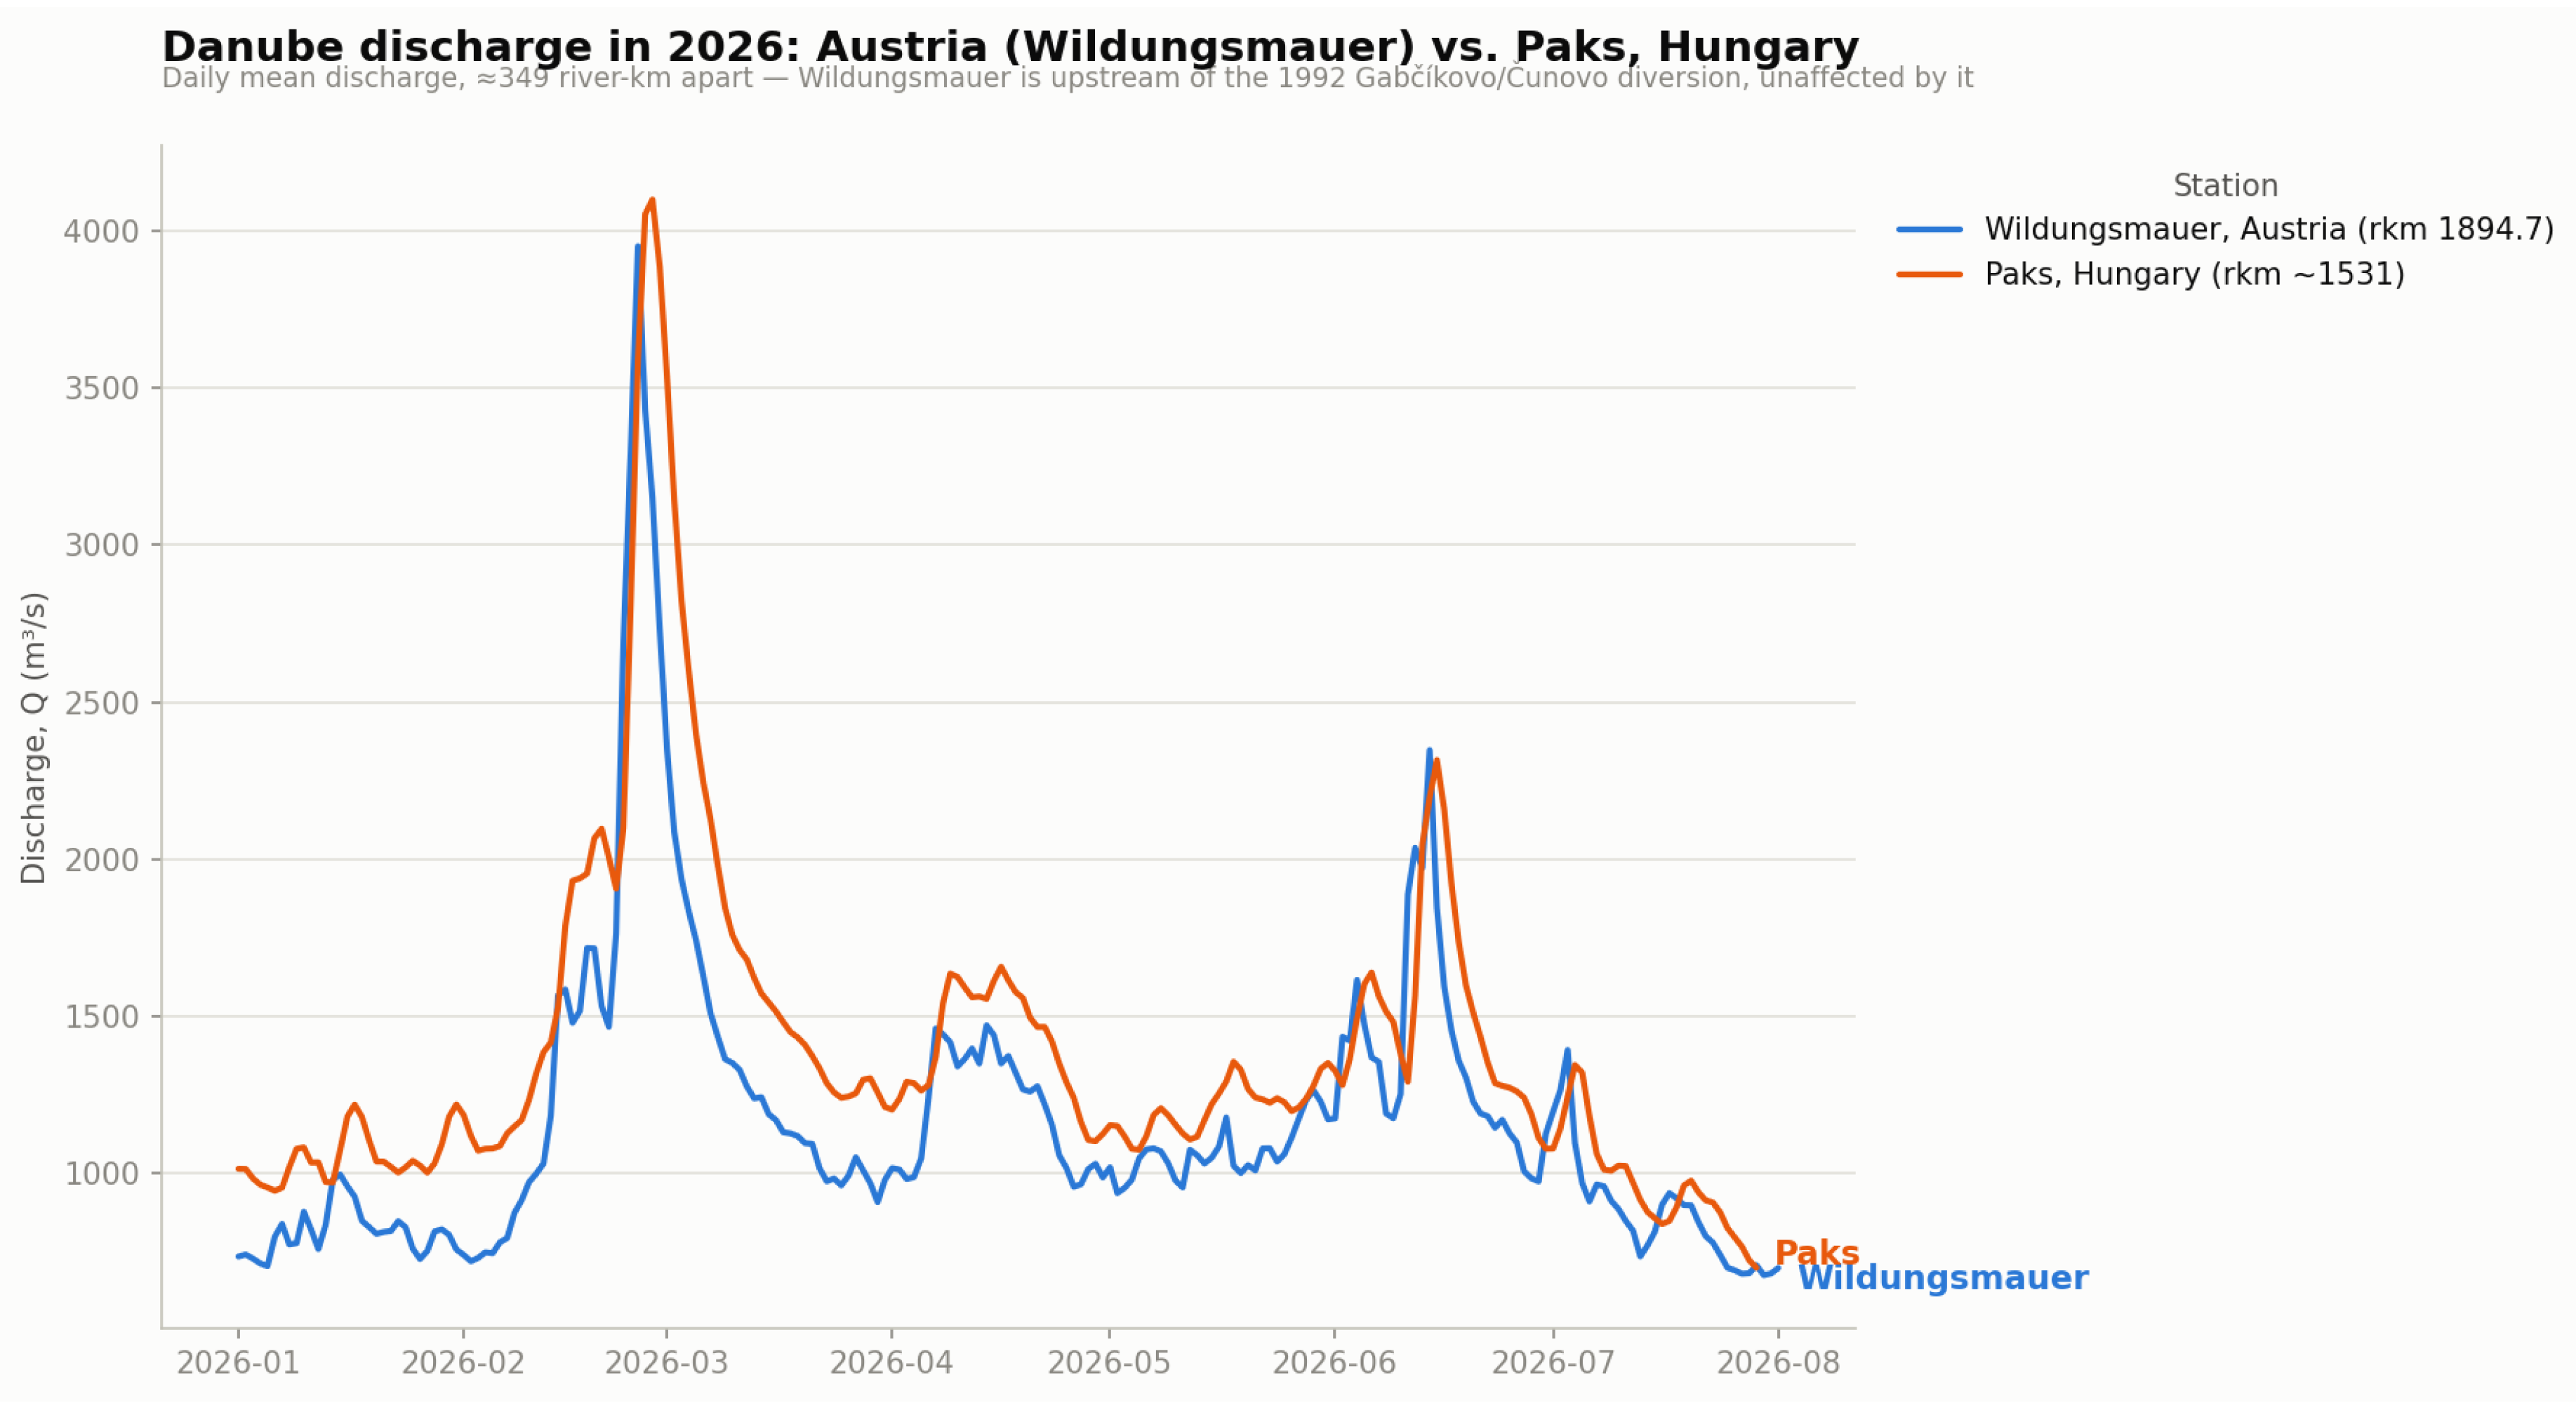
Figure 13.
Measured near-riverbed Danube temperature at Paks (blue) versus the heat-balance model’s computed fully mixed cross-section temperature (orange, = measured temperature + , ), May–July 2026, with the 30°C statutory limit, the plant’s 29.5°C internal action threshold, and the two reported curtailment episodes (shaded bands) overlaid; daily mean discharge is shown in the lower panel. The computed curve crosses the 29.5°C threshold within the reported temperature-driven curtailment window (27 June–3 July) and predicts no comparable approach during the 27–31 July hydraulic-shutdown episode, when discharge, not temperature, was the binding constraint. Source: this study, from the near-riverbed water temperature and discharge series described in Section 2.4, combined with the heat-balance relationship of Section 3.7.
Figure 13.
Measured near-riverbed Danube temperature at Paks (blue) versus the heat-balance model’s computed fully mixed cross-section temperature (orange, = measured temperature + , ), May–July 2026, with the 30°C statutory limit, the plant’s 29.5°C internal action threshold, and the two reported curtailment episodes (shaded bands) overlaid; daily mean discharge is shown in the lower panel. The computed curve crosses the 29.5°C threshold within the reported temperature-driven curtailment window (27 June–3 July) and predicts no comparable approach during the 27–31 July hydraulic-shutdown episode, when discharge, not temperature, was the binding constraint. Source: this study, from the near-riverbed water temperature and discharge series described in Section 2.4, combined with the heat-balance relationship of Section 3.7.
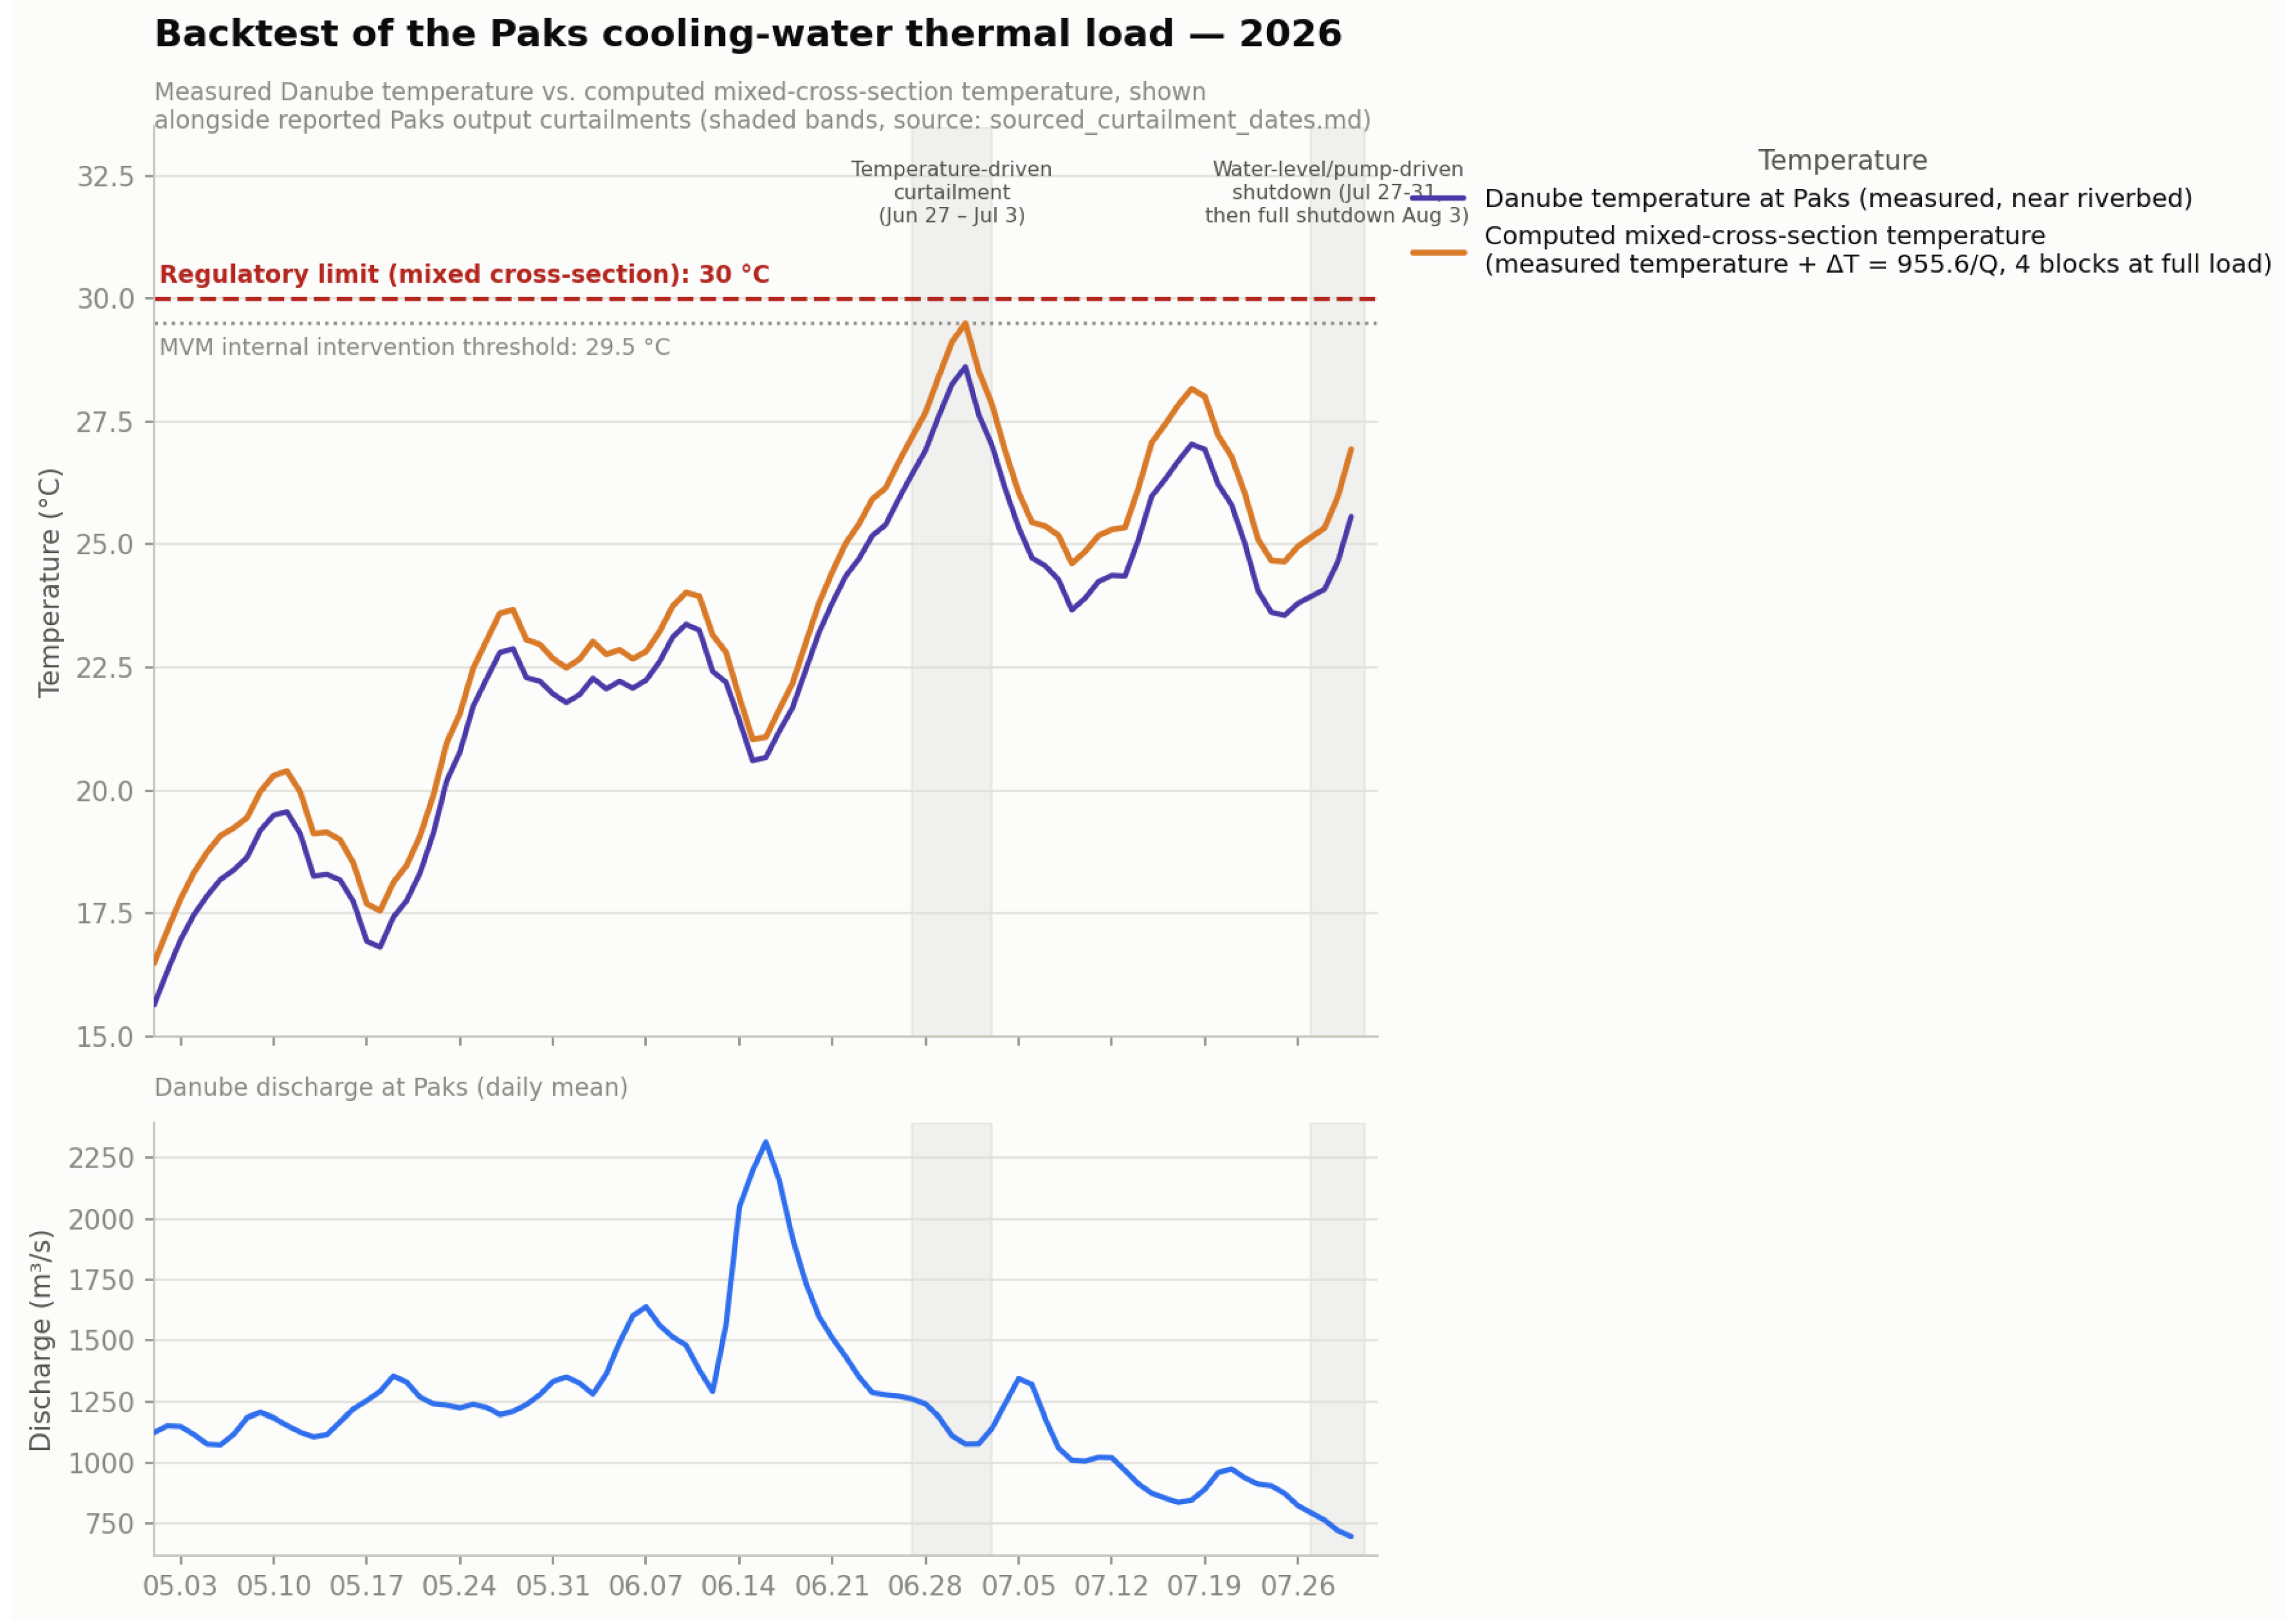
Figure 14.
Epoch-mean H at each station’s own reference discharge, normalized to zero at each station’s own first epoch (Hainburg from 1977, Paks from 1981–1986; the two series are therefore aligned on relative decline, not on a shared calendar baseline), plotted against epoch mid-year, with the October 1992 diversion marked. Hainburg’s decline is front-loaded and essentially complete by the early-to-mid 2000s; Paks’s decline is comparable in cumulative magnitude but continues through the terminal 2022–2026 epoch. This is the visual basis for the “front-loaded versus sustained” distinction drawn in the text, which a same-direction, similar-magnitude comparison of endpoint effect sizes alone (as in Table 1) would not by itself convey. Source: this study, from the Paks and Hainburg Q–H series described in Section 2.3.
Figure 14.
Epoch-mean H at each station’s own reference discharge, normalized to zero at each station’s own first epoch (Hainburg from 1977, Paks from 1981–1986; the two series are therefore aligned on relative decline, not on a shared calendar baseline), plotted against epoch mid-year, with the October 1992 diversion marked. Hainburg’s decline is front-loaded and essentially complete by the early-to-mid 2000s; Paks’s decline is comparable in cumulative magnitude but continues through the terminal 2022–2026 epoch. This is the visual basis for the “front-loaded versus sustained” distinction drawn in the text, which a same-direction, similar-magnitude comparison of endpoint effect sizes alone (as in Table 1) would not by itself convey. Source: this study, from the Paks and Hainburg Q–H series described in Section 2.3.
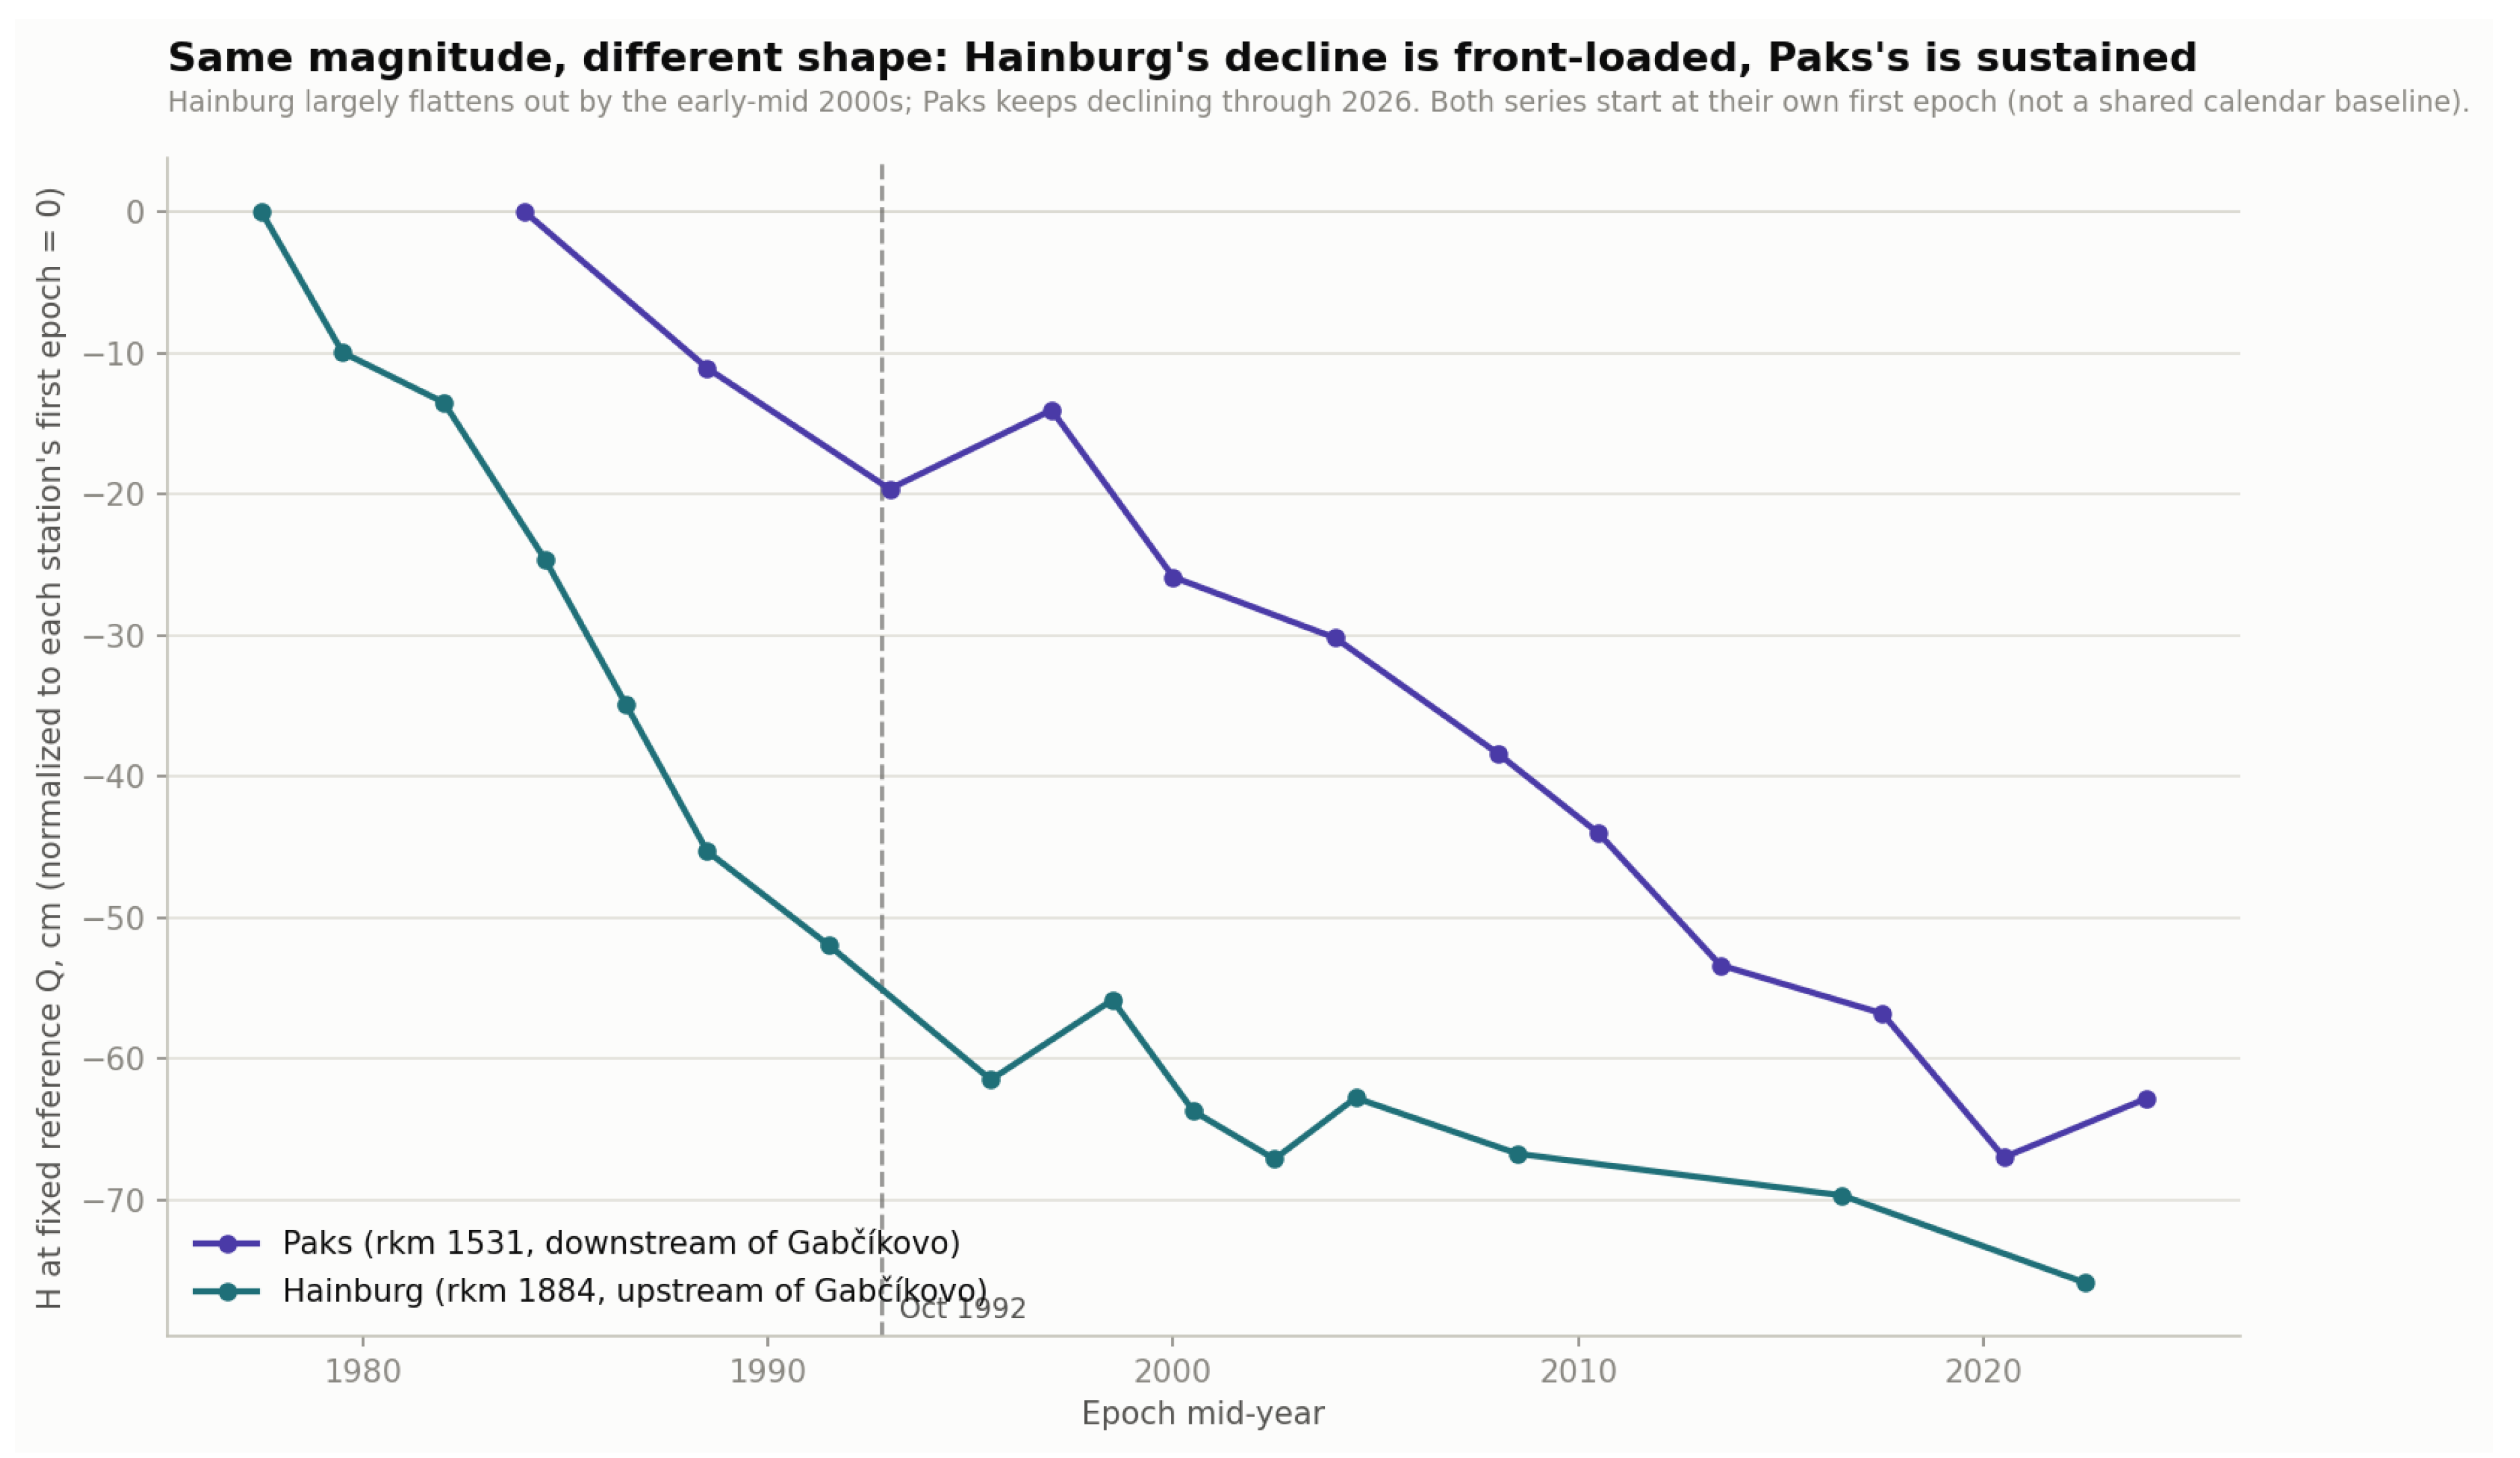

Table 1.
Stage–discharge shift results by station, ordered by river-km.
| Station | River-km (position rel. to Čunovo, 1851.75) | End of Record | Effect Size | Temporal Pattern |
|---|---|---|---|---|
| Wildungsmauer, Austria | 1894.72 (43 km above, isolated from the diversion) | 2023 | −8.4 to −9.1 cm/decade (2004–2023 only; an unrelated station-side artifact makes the pre-2004 portion unusable, see note below) | Same direction as Hainburg, shorter/interrupted record |
| Hainburg, Austria | 1883.96 (32 km above, isolated from the diversion) | 2023 | Front-loaded 1977–1996 (∼79 cm total); ∼flat 1997–2023 (whole-period epoch estimate −16.4 cm/decade [−21.1,−11.7] is not meaningful as a single rate given this front-loading, see note below) | Plateaued since 1997 |
| Rajka | 1848.3 (3.4 km below) | 2026 | Pre-1992: −38 to −45 cm/decade (a shorter, noisier sub-record than the other estimates in this table); Oct 1992 step: Q −75–85%, H −230 cm in 5 days; post-1995: +2.7 cm/decade, n.s. | Abrupt one-time step at the diversion, then stable |
| Dunaújváros | 1580.6 (271 km below; 49 km above Paks) | 2026 | −25.6 to −27.7 cm/decade full-record; −14.4 to −17.5 cm/decade restricted to 1998–2026 (see note below) | Still declining; full-record and recent-subset estimates diverge |
| Paks | ≈1531 (320 km below) | 2026 | −16 to −17 cm/decade [−19,−14] | Still declining through the terminal (2022–2026) epoch |
Disclaimer/Publisher’s Note: The statements, opinions and data contained in all publications are solely those of the individual author(s) and contributor(s) and not of MDPI and/or the editor(s). MDPI and/or the editor(s) disclaim responsibility for any injury to people or property resulting from any ideas, methods, instructions or products referred to in the content. |
© 2026 by the authors. Licensee MDPI, Basel, Switzerland. This article is an open access article distributed under the terms and conditions of the Creative Commons Attribution (CC BY) license (http://creativecommons.org/licenses/by/4.0/).
Copyright: This open access article is published under a Creative Commons CC BY 4.0 license, which permit the free download, distribution, and reuse, provided that the author and preprint are cited in any reuse.