
Submitted:
30 July 2026
Posted:
03 August 2026
You are already at the latest version
Abstract
Background and Objectives: Most current pediatric sepsis screening tools operate in the Emergency Department to detect low incidence Phoenix criteria sepsis. We sought to create an inpatient alert with broader scope and higher predictive value to identify infectious illness cases likely to progress to major physiological decompensation. Methods: Clinician reviews of cases meeting a modified pSOFA sepsis criteria within a 10,992 inpatient cohort identified 83 cases of “gold standard” infection-related decompensation (GS-IRD). Our refinement process utilized Lasso regression to create a model identifying children likely to progress to major or extreme decompensation according to 3M’s APR-DRG severity of illness (SOI) index. Prior to live implementation, a second 4,050 patient cohort was selected and 50 GS-IRD cases identified for external validation of the model and as a baseline for assessing post-implementation patient improvements. We examined the relationship between patients’ maximum alert “score” and final SOI level. We hypothesized that post-firing decreases in score represent clinical improvement, affording a measure of the alert’s efficacy through silent versus live cohort comparisons. Results: Our final model exhibited 85.0% sensitivity and 93.6% specificity for GS-IRD cases, and positive and negative predictive values of 43.6% and 83.7% for major or extreme SOI outcomes. The live epoch showed a greater average decrease in both alert scores over the 48-hour post-firing interval (p< .0001) and maximum scores at ≥48 hours post-admission (p< .0001), compared with the silent epoch. Conclusion: Our pediatric alert shows a high predictive value for progression of infectious illness to major or extreme severity. Alert implementation was associated with significant post-firing clinical improvements.
Keywords:
sepsis
; predictive tool
; infection
; pediatric
; inpatient
; decompensation
1. Introduction
Sepsis continues to be a major cause of death in children worldwide, with survivors often suffering increased rates of readmissions and diminished long-term quality of life[1,2,3,4,5]. While international consensus definitions of pediatric sepsis have continued to evolve[6,7,8,9,10,11], these advances largely serve to define improved targets for the development of early screening tools rather than as metrics to be incorporated directly as diagnostic indicators[12]. Although a number of sepsis screening tools have been designed and are in widespread use, a large majority of these are focused on the screening of patients in the emergency department (ED)[13], as the progression of sepsis cases to organ dysfunction and physiological decompensation often occurs within 24 hours of hospital arrival. However, due to the relative lack of clinical data available at the time of ED arrival and to the inherently low incidence of Phoenix criteria sepsis[9,10,11] (previously called severe sepsis), any such tool that is programmed into the electronic health record (EHR) and employed to screen all ED patients will invariably have a low positive predictive value (PPV)[14], often leading to trigger fatigue. Organizations have ameliorated this shortcoming by implementing tiered alert systems whereby a lower-level automated alert triggers an additional manual screening and possible huddle, leading to higher stage alerts that have improved sensitivity, specificity, and PPV[13,14,15,16].
Sepsis screening tools designed for use in general, non-ICU inpatient pediatric units are less common[13,17,18,19] but are likely to show much better performance relative to ED-based alerts due to the availability of more detailed clinical inputs, collected and documented over a longer period of observation. Following our earlier implementation of an electronic screening alert in the ED setting[20,21], we have now created an improved electronic tool for use in non-ICU, inpatient units. The development of this tool was based on an approach that began with a broader definition of “infection-related decompensation,” which focuses on identifying those cases likely to progress to an advanced level of decompensation severity and so would benefit from early recognition and treatment regardless of whether they would meet the pediatric Sequential Organ Failure Assessment (pSOFA) or Phoenix criteria, while also exhibiting high sensitivity in predicting Phoenix- or pSOFA-defined sepsis and high overall severity-based predictive value. Additionally, we present the alert tool’s validation, EHR refinements to enhance clinician awareness and communication of alerts, and improvements in clinical outcomes following implementation.
2. Methods
2.1. Study Setting
The electronic assessment tool described here, called the Inpatient Children at High Risk Alert Tool (iCAHR-AT), was developed and implemented over the period 2018-2025 at the Children’s Hospital of The King’s Daughters Health System (CHKDHS), a 266-bed freestanding children’s hospital located in Norfolk, Virginia, USA with ~9,000 inpatient (IP) and observation (Obs) admissions per year. Input data for the creation and operation of the assessment tool were derived from historical and real-time data collected during the patient stay as recorded in the hospital’s Cerner Millennium® (Cerner Corporation [now Oracle Health®], Kansas City, MO, USA) EHR.
2.2. Retrospective Gold Standard Case Identification for Tool Calibration
“Gold standard” (GS) cases of infection-related decompensation (IRD) were identified from a study population of 10,992 IP and Obs admissions to the hospital admitted and discharged during 01/2018 – 12/2019. Based on the tool’s design for use in general care inpatient units and on the consensus of the hospital’s subspecialty physician groups, we excluded patients primarily assigned to one of the following medical services or locations: Cardiology, Cardiac Surgery, Hematology/Oncology, Inpatient Psychiatry, and Neonatal Intensive Care Unit (NICU).
We selected retrospective GS IRD cases from this 2018-19 IP/Obs study population based on the following criteria: (1) Evidence within the previous 7 days of a confirmed or suspected infection having potential for a systemic response (listed in Table 1); (2) Evidence of one or more organ dysfunctions (OD’s) as defined by the pSOFA scoring method developed by Matics and Sanchez-Pinto[7], which we modified (see supplement S1) for use in general care units outside the ICU[22,23]; (3) Elimination of low severity cases as denoted by an outcome of “Minor” Severity of Illness (SOI) as assigned by the 3M™ Corporation’s All Patient Refined-Diagnosis Related Groups (APR-DRG, v36) algorithm[24] at the time of coding (post-discharge); (4) Chart review by clinicians of cases meeting the above criteria to eliminate chronic OD cases, other conditions that may mimic sepsis (such as ingestions and autoimmune or metabolic conditions), and cases where decompensation appeared unrelated to infection (such as those following and directly related to major surgery or trauma).
For each identified case of IRD, reviewers also determined the initial time of acknowledged decompensation, defined as the earliest time of: Rapid Response Team (RRT) called, unplanned transfer to the ICU, or a pSOFA determination of an acute OD.
2.3. Tool Creation
A flow diagram illustrating the steps involved in creating the iCAHR-AT algorithm is presented in Figure 1.
Data elements (listed in Supplement S2) were collected for the study population from the Cerner Millennium EHR using SAP® Web Intelligence Rich Client software. Preliminary analysis and tool development were conducted using SAS® v9.4 software.
In addition to the exclusion of patients having care primarily assigned to the specialty services listed above, we also excluded data elements collected during periods when patients were physically located in any of the following units: Sedation, Surgery Operating Room (OR), Post-Anesthesia Care Unit (PACU), and Pediatric Intensive Care Unit (PICU). An exception was made for the collection and analysis of microcultures or viral panels, which were accepted from all units or services.
Candidates for predictors of IRD were selected based on literature sources such as the Sepsis-2[6] or the pSOFA[7] definitions, our own earlier screening tools[20,25], preliminary univariate analysis, and clinician consensus. For purposes of screening tool creation, we considered most predictive factors as dichotomous variables, with thresholds of abnormality taken from the above sources or from age-specific 5th or 95th centiles.
Based on our previous work [26], we utilized de-identified Cerner Health Facts® (now Oracle Health Data Intelligence®) vital signs data from >200 hospitals for children aged 0-17 years collected during 2014-2017 to derive age-specific centiles and z-scores (normalized standard centiles) for heart rate (HR), respiratory rate (RR), SBP shock index (“SBP-SI” = HR ÷ systolic blood pressure), MAP shock index (“MAP-SI” = HR ÷ mean arterial pressure) and temperatures (oral [oTMP], rectal [rTMP], and temporal artery [taTMP]). We developed these metrics from distributions generated using Generalized Additive Models for Location, Scale, and Shape (GAMLSS) methodology[27,28] and software written in the R programming language. The age-specific modeled centiles for HR, RR, SBP-SI and MAP-SI are shown in supplemental tables S3-S6, respectively, and modeled z-scores for HR, RR, oTMP, rTMP, and taTMP are shown in supplemental tables S7-S11.
Preliminary development of the iCAHR-AT algorithm modeled the association of the identified GS IRD cases with abnormal values of the factors listed in Supplement S2 using a LASSO penalized logistic (binary) regression. After identifying a group of preliminary significant factors, we added all first-order interactions among these factors (e.g., the co-occurrence of abnormal heart rate and prolonged capillary refill time, or of abnormal values of temperature and white blood count (WBC), etc.). In concordance with our previous screening tools[20,25], we considered abnormal values for vital signs (HR, RR. SBP[29], MAP, TMP), pulse oximetry, neurological tests, and respiratory measures (e.g., bronchiolitis score), as well as maximum vital sign z-scores, as valid for 24 hours; lab results for 48 hours; and positive indicators of infection (coded diagnoses, cultures, viral panels, or chest x-ray results) for 7 days.
2.4. Tool Refinement Process
To create a more predictive algorithm that would preferentially select “early” rather than “late” predictors of IRD, and cases that would reach a higher level of physiological decompensation (as defined by the APR-DRG SOI metric[24]) we performed improvement cycles as follows.
First, for all patients in the study, we calculated the time of “maximum abnormal factors,” defined as the initial time at which the maximum number of factors identified in the preliminary analysis above exhibited abnormal values (as defined in Supplement S2).
Next, we created a SAS® model that simulated the real time clinical events during each patient encounter included in the study sample. The simulation duration for a given encounter varied according to the initial time of maximum abnormal factors (MAF) for that encounter. If the MAF time occurred less than 24 hours following IP/Obs admission, we ended the simulation at the MAF time. If the initial MAF occurred between 24 and 48 hours following admission, we ended the simulation at 6 hours prior to MAF; and for initial MAF greater than 48 hours post-admission, we ended the simulation 12 hours prior. This new “early factor” model was then re-analyzed using the LASSO penalized logistic regression technique to identify a new set of significant factors and weights for earlier prediction of the GS IRD cases.
Further improvement cycles were performed, with emphasis on predicting high severity cases, i.e., those progressing to more extreme levels of physiological decompensation. Although more recent definitions of pediatric sepsis no longer require the presence of systemic inflammatory response syndrome (SIRS), our previous work in creating sepsis screening tools [20,25] suggests that SIRS is associated with higher severity outcomes. Therefore, we performed an additional LASSO regression analysis using the “early factor” methodology described above to predict a new set of GS IRD cases identified as those in the original set that also manifested SIRS (defined in Supplement S2) before the initial time of MAF. These cases, referred to as “GS SIRS IRD,” were used to create and train the final model.
2.5. Final Model
After creating a preliminary optimized real-time model (with associated Receiver Operating Characteristic [ROC] curve) using the processes described above, we selected an optimum firing threshold for our hospital based on consideration of several factors: ROC factors (sensitivity, specificity); PPV for cases of “Major” or “Extreme” SOI; and time between alert firing and maximum physiologic decompensation (i.e., the “treatment window”).
To maintain consistency with our current ED version of the Children at High Risk Alert Tool (eCAHR-AT), which has been operational in our hospital’s ED since August 2017, the weights of the final, optimized algorithm were standardized to set the firing threshold of 5.0, matching that of our ED algorithm.
2.6. Validation and Testing
2.6.1. Internal Validation
We performed a split-sample validation of the final model derived from our 2018-19 study sample by comparing its performance across patient admissions during 2018 with those during 2019. Using logistic regression to generate ROC curves representing iCAHR-AT alert firing as the predictor of GS SIRS IRD cases, we compared the area under the curve (AUC) estimates for the two subsamples and evaluated the difference using an unpaired t-test[30].
2.6.2. External Validation
Beginning in May 2023, we implemented a prototype of the iCAHR-AT model in a “silent” mode, whereby we collected information relevant to the scoring and firing of the iCAHR-AT for all IP/Obs patients currently being treated by services and in units where the alert tool would become active and visible in the EHR to clinicians following full implementation later in January 2024.
Using the identical criteria employed for our original 2018-19 study population, both for inclusion in the study sample and for identification as GS infection-related decompensation cases, we identified a patient sample of 4,050 IP/Obs encounters admitted between 05/14/2023 and 01/22/2024. Identification of GS SIRS IRD cases in the external validation dataset was performed without knowledge of the iCAHR-AT’s scoring or firing. As was the case for encounters in the 2018-19 sample, data collected for the external validation sample also included information on the initial time of maximum abnormal factors (MAF) and, for GS SIRS IRD cases, whether patients manifested SIRS before the time of MAF.
We compared the ROC curves of the original 2018-19 tool calibration and the external validation datasets using the same methodology employed in the internal validation described above, using an unpaired t-test to compare the AUC estimates of the two study samples. For the external validation sample, the ROC curve represents iCAHR-AT firing as the predictor of the new external validation GS SIRS IRD cases.
2.7. Association of iCAHR-AT Score with Severity of Illness
For each encounter in the original 2018-19 study sample and the 05/2023-01/2024 external validation sample, we determined the maximum iCAHR-AT score attained during the patient stay and examined the association between maximum score and the occurrence of high-severity outcomes, defined as a final APR-DRG v36 SOI of “Major” or “Extreme”.
2.8. Live Implementation of iCAHR-AT
2.8.1. Initial Implementation
The iCAHR-AT was entered into live clinical use at CHKD in February 2024. Its initial appearance in the Cerner EHR “Powerchart” consisted of the “Results Review” display of iCAHR-AT scores and alert firings in real time, as well as a “Summary View” detailing the abnormalities that contributed to the current score. These are shown as an overview in Figure 2, with a more detailed description of the Summary View given in supplement S12.
2.8.2. Communication and Acknowledgment Refinements
In addition to the above notifications in the Cerner EHR, we introduced further improvements to enhance communication and clinician response to iCAHR-AT firings. These include: 1) automated paging and phone notification of unit charge nurse upon alert firing, whose task was to notify the patient’s current provider (often a resident physician) on call; 2) mandatory notification of the attending physician or advanced practice provider by the alerted provider; 3) automated opening of a Cerner “Powerform” (also detailed in supplement S12) upon the initial provider’s opening of the alerted patient chart, requiring the provider’s written assessment and acknowledgement.
The effectiveness of our efforts to increase provider awareness and response through the above refinement steps was evaluated, and compliance was measured with each refinement over the course of the study.
2.8.3. Resident Training
Because our institution is a pediatric teaching hospital with new residents rotating through each month, we also implemented a new resident training system that included verbal instruction, a training handout (supplement S12), and an introductory video.
2.8.4. Pre-Alert
Given the iCAHR-AT’s dependence on the availability of patient data such as vital signs, labs, cultures, and radiology results, we were concerned that a patient showing significant abnormalities might not trigger an alert simply due to the sparsity of available data. We therefore introduced a “Pre-alert” that would appear in the Powerchart Summary View when a patient reached an iCAHR-AT score of ‘4’, too low to trigger an alert but nevertheless of concern. The Pre-alert, detailed in supplement S13, would list those additional metrics used by the iCAHR-AT algorithm to perform a complete evaluation but had not been collected within the past 24 hours (for neurological and vital sign related results), 72 hours (for labs), or 7 days (for cultures, viral panels, or x-rays). As the Pre-alert serves only as an optional aid in suggesting additional metrics that might aid the iCAHR-AT in its evaluation, it does not trigger any paging or phone call, nor mandate a physician response.
2.9. Clinical Outcomes
2.9.1. Acuity and Severity
We hypothesized that the iCAHR-AT score correlates with both the current acuity and overall severity of the patient’s condition with respect to infection-related decompensation and that a decrease in the score over time reflects an improvement of the patient’s condition. We similarly hypothesized that the highest iCAHR-AT score attained during a patient’s stay correlates with the overall severity of illness and degree of physiological decompensation for that encounter. Therefore, we created a series of graphs, including boxplots and a time-series X-bar control chart, comparing outcomes for patients who fired the tool during the “silent” (pre-live) period with those who fired it after “live” implementation of the iCAHR-AT. All plots were created using Minitab® Statistical Software v.22 (State College, PA).
2.9.2. Boxplots
Two series of boxplots were created to compare outcomes between the Silent and Live epochs, with differences evaluated using two-sample t-tests. One shows the average 48-hour trend in iCAHR-AT score from the time of initial firing until 48 hours post-firing for all patients who fired the alert and remained in a general care, non-ICU unit for the entire 48-hour post-firing period. We calculated individual patient trends from a regression line for that encounter over the 48-hour period.
A second series of boxplots shows the average of the maximum patient scores attained at 48 hours or greater post-admission following the initial alert firing. As a balancing measure, we added boxplots for each of the two epochs showing the mean iCAHR-AT score at the initial time of firing.
2.9.3. Control Chart
To show the relationship of patient improvement as measured by 48-hour iCAHR-AT score trend with the refinements in communication and firing acknowledgement described above, we created a staged graph that shows the effect of each of the refinements, summarized above and in supplement S10, on the corresponding mean iCAHR-AT score change, by month and stage, with stages corresponding to the introduction of each new refinement.
2.9.4. Identification of Infectious Agents
To investigate whether the implementation of iCAHR-AT facilitated the correct identification of pathogens present in IRD patients, we examined all cases where the alert tool fired and microbiological cultures or polymerase chain reaction (PCR) panels were collected during the period when the tool was active. We compared the proportion of these cases that yielded a positive finding of an infectious agent between the Silent and Live epochs.
2.9.5. Transfers from General Care Units to the ICU
To explore whether implementing iCAHR-AT might aid in the management of infection-related decompensation on general care units and reduce the need for unplanned transfers of decompensating patients to the ICU, we compared the overall rate of post-firing floor-to-ICU transfers between the Silent and Live epochs.
2.9.6. Length of Stay
We assessed whether an improvement (reduction) in overall hospital length of stay (LOS) for patients firing the iCAHR-AT occurred following live implementation. To adjust for differences in severity of illness among cases, we obtained Medicare Severity-Diagnosis Related Group (MS-DRG) Average Length of Stay (ALOS) and Geometric Mean Length of Stay (GM-LOS) data for each patient who alerted during the Silent and Live epochs. These metrics are used by the U.S. Centers for Medicare and Medicaid Services (CMS) to determine resource and hospital stay reimbursement for Medicare and Medicaid patients and thus serve as the “expected” LOS metrics. The MS-DRG ALOS represents the arithmetic mean LOS for patients in a given MS-DRG severity group, and the GMLOS represents the corresponding geometric mean, which is less influenced by outliers. Actual LOS / MS-DRG ALOS and Actual LOS / MS-DRG GMLOS ratios were calculated separately for each patient, and overall differences in these actual-to-expected metrics between the Silent and Live periods were evaluated using a Wilcoxon Rank-Sum nonparametric test.
3. Results
3.1. Characteristics of Patients in the Study Samples
Characteristics of patients in our study are summarized in Table 2 as three groups: 1) Patients in the original 2018-19 tool calibration sample used in iCAHR-AT model development; 2) Patients in the 05/2023 - 01/2024 sample, used as subjects for the external validation sample and as the patient population for the “silent” epoch of tool implementation; 3) Patients in the 02/2024 – 05/2025 sample, comprising the patient population for the “live” epoch of tool implementation. The table shows that, while “sepsis” as a final ICD-10 diagnosis is rare (0.6% – 1.7%) among all of the study cohorts, a final diagnosis of an infection having the potential for a systemic response (as listed in Table 1) is much more common (23% - 28%). The existence of a large patient population with potential for infection-related decompensation, combined with the high percentage of iCAHR-AT alert firings with high severity outcomes (37% – 59% in the pre-live epochs), supports our goal of creating a tool with broader ability to predict infection-related decompensation compared with other existing sepsis screening alerts.
3.2. Characteristics of the iCAHR-AT Final Model
Table 3 lists the factors and their corresponding weights selected as significant predictors of infection-related decompensation in the final model. All factors except z-scores are dichotomous, with values expressed as the listed weights if abnormal according to the definitions given in Supplement S2. For factors representing interactions, the additional weight listed is added if both interacting factors were abnormal during the periods when each was valid. For z-scores, the final weight is calculated as the listed weight factor multiplied by the square of the abnormal z-score, with abnormality defined as ≥2 SD above normal for RR or HR, and ≥2 SD above or below normal for TMP.
3.3. Internal Validation
Our split-sample internal validation of the iCAHR-AT model evaluated the null hypothesis of no difference in AUC estimates between the 2018 and 2019 cohorts of our two-year calibration study sample. The results were, for the 2018 time period: N=5,479, AUC=0.9114, standard error (SE)=0.0242; for the 2019 time period: N=5,513, AUC=0.8795, SE=0.0324. The AUC difference (0.0319) is not statistically significant (p=0.43) and does not allow rejection of the null hypothesis.
3.4. External Validation
The external validation of the model also evaluated the null hypothesis of no difference in AUC estimates between the original calibration sample and the external validation sample. The results for the original 2018-19 calibration sample were: N (total)=10,992, N (GS SIRS IRD)=83, AUC=0.8972, SE=0.0195; for the external validation 05/23-01/24 sample: N(Total) = 4,050, N (GS SIRS IRD)=50, AUC=0.8843, SE=0.0263. The AUC difference (0.0129) is not significant (p=0.69), supporting the null hypothesis and allowing us to pool the ROC results from the two samples.
3.5. Performance characteristics of iCAHR-AT for the pooled samples
The ROC and other performance characteristics for the iCAHR-AT based on the 15,042 patients in the pooled original calibration and external validation cohorts are summarized in Table 4. In addition to showing high sensitivity and specificity (85.0% and 93.6%) for the GS SIRS IRD sepsis cases, the alert tool also identified children who progressed to “major” or “extreme” severity outcomes with a high PPV and NPV (43.6% and 83.7%). For cases not reaching maximum decompensation within the first 24 hours following arrival, the tool alerted at an average of 40 hours in advance of maximum decompensation, affording a meaningful treatment window for improving patient outcomes.
3.6. Association of Maximum iCAHR-AT Score with Severity of Illness Outcomes
Figure 3 shows the association between the maximum iCAHR-AT score and the occurrence of “Major” or “Extreme” SOI outcomes among patient encounters. As was similarly observed in the relationship between maximum alert scores and SOI outcomes for our earlier ED-based IRD alert tool[20], patients with maximum scores below the alert’s firing threshold had a low probability of a high SOI outcome, which gradually rose as the score increased. When the firing threshold of ‘5’ was reached, further increases in the maximum score correlated with a much steeper rise in the likelihood of such an outcome, reaching over 90% for maximum scores of ‘9’ or greater. This supports our hypothesis that the iCAHR-AT score correlates with the severity of a patient’s condition.
3.7. Clinical Outcomes
3.7.1. Acuity and Severity
As shown in Figure 4, patients firing the iCAHR-AT following live implementation exhibited a significantly (p<.001) greater average decrease in iCAHR-AT score over the 48 hours following initial firing compared with those who fired during the silent epoch. Given the strong association between iCAHR-AT score and physiological decompensation as measured by the APR-DRG SOI metric, this suggests that implementing the tool facilitated a greater patient improvement during this post-firing period.
Figure 5B shows that patients hospitalized at least 48 hours who fired the alert during the live epoch exhibited a significantly (p<.001) lower average post 48-hour maximum iCAHR-AT score compared with those firing during the silent epoch. This suggests that, on average, implementation of the iCAHR-AT also contributed to a lower patient morbidity by 48 hours post-admission. As a balancing measure, Figure 5A shows that the average iCAHR-AT scores at the time of initial alert firing are similar (5.77 for the silent epoch vs. 5.64 for the live), suggesting that the lower maximum scores for the live epoch are not due merely to lower initial severity.
The control chart shown in Figure 6 illustrates the temporal correlation of the patient improvements summarized in Figure 4 with each of the communication and acknowledgment refinements that were introduced following the live implementation of the alert. As the figure shows, the introduction of each enhancement (notification of charge nurse and initial provider, mandatory call to attending physician, and required written acknowledgement and patient assessment) resulted in a corresponding improvement as measured by a greater lowering of iCAHR-AT score during the initial 48-hour post-firing period.
3.7.2. Identification of Infectious Agents
Among patients with iCAHR-AT firings and microbiological cultures or PCR panels collected following inpatient admission, the percentage of cases with a positive identification of a bacterial, viral, or fungal organism increased significantly (p=.002, exact chi-square) from silent=26.5% (41/155) to live=40.9% (144/352).
3.7.3. Post-Firing Transfers from General Care Units to ICU
The percentage of patients transferred from the floor unit to the ICU at any time following initial alert firing showed a near significant (p=.086, exact chi-square) decrease from the silent epoch =11.6% (38/328) to the live epoch =8.2% (61/746).
3.7.4. Length of Stay
The median LOS for patients firing the iCAHR-AT decreased from 3.70 days during the silent epoch to 2.90 days during the live epoch. When adjusted for severity by conversion to Actual LOS÷ MS-DRG ALOS or Actual LOS÷ MS-DRG ALOS as described earlier, this decrease is highly significant (p=.003 using MSDRG ALOS, and p=.004 using MS-DRG GMLOS ).
4. Discussion
Early detection, preferably before the patient meets the clinical definition of “sepsis,” is important in preventing the worst outcomes for children with infection-related illness. Definitions have changed and improved, but sepsis as currently defined by pSOFA or Phoenix criteria remains a rare disease. To be of value to clinicians and less prone to overfiring and trigger fatigue, screening tools may need to function more broadly and with emphasis on predicting future deterioration.
Our iCAHR-AT, while defining its benchmark “gold standard” target cases using the pSOFA sepsis criteria, was constructed using a methodology that emphasized the early identification of cases that would progress to a high severity of illness. As such, the alert tool demonstrated a PPV of 43% for infection-related illness that progressed to “major” or “extreme” severity as defined by the APR-DRG SOI criteria. This represents an alternative to the two-tiered systems of other pediatric hospitals described earlier, which are likely to require a greater resource commitment for the enhanced monitoring of patients identified as “positive” by the initial screen.
As summarized earlier, iCAHR-AT implementation proceeded through a series of communication and mandatory response refinements. Resident training initiatives were implemented spanning several months. After demonstrating the strong association between a patient’s maximum iCAHR-AT score and the degree of physiological decompensation reached during the encounter as measured by the SOI metric, we then used the iCAHR-AT score as a proxy measure of illness severity. This was utilized to compare post-firing outcomes among patients having clinically silent firings during the pre-implementation period with those who fired following live implementation of the alert. We consider our significant findings of a greater average decrease in iCAHR-AT scores during the initial 48-hour post-firing period and of a lower average maximum iCAHR score at 48 hours or greater post-admission for patients who alerted during the live epoch as prima facie evidence that the iCAHR-AT has facilitated a more rapid clinical improvement among patients who activated the alert. This finding is also supported by discovering a significant decrease in severity adjusted length of stay among patients who activated the alert following its live implementation.
Our finding of a significant increase in the proportion of positive microbiological culture or panel results following live tool activation among patients meeting iCAHR-AT alert criteria and having samples collected suggests that the tool may also be helpful in triggering the identification of pathogens present in cases of infection-related decompensation. Additionally, both this apparent improvement in pathogen identification and the above mentioned improvements in post-firing iCAHR-AT scores and severity adjusted LOS may have contributed to the near-significant decrease in unplanned transfers from general care units to the ICU following alert implementation. This further suggests value for the iCAHR-AT in improving management of IRD cases on general care units, reducing the costs associated with escalation of care and improving hospital resource utilization.
5. Study Limitations and Future Directions
Future steps in the development of iCAHR-AT involve the introduction of natural language processing (NLP) tools to improve the contextual accuracy of data capture from unstructured free-text fields such as detailed history and reason-for-visit (RFV) information, summary results from transferring hospitals, history and physical (H&P) reports, radiologic imaging impressions, pathology reports, and specialty consults[31]. These methods may also lead to the identification of additional predictive factors or interactions. However, even in the current age of artificial intelligence (AI) ascendancy, predictive tools such as iCAHR-AT still rely completely on the availability of clinical information. While such information is usually most lacking for ED patients at the time of initial triage, it may also be lacking in the inpatient setting, as in cases where a child was initially admitted for a (presumed) non-infectious condition requiring minimal testing beyond regular vital signs collection.
While some existing pediatric sepsis screening tools are designed for widespread use at children’s hospitals, we consider it unlikely that a single predictive algorithm would be optimal for all patient populations and all hospitals. Rather, different local or regional patient populations may also show different disease patterns and susceptibilities, requiring a screening tool that is better honed to these differences. In addition, hospitals and their associated providers may show different preferences as to the target cases of the alert, for example, bacterial infections only versus inclusion of viral illnesses such as RSV pneumonia, encephalitis, and meningitis. Depending on available resources and goals, individual hospitals may also select different points along a screening tool’s ROC curve, choosing to optimize specificity over sensitivity, or vice versa.
6. Conclusions
We designed and implemented a pediatric inpatient assessment tool that identifies or predicts the development of physiological decompensation due to sepsis or other infection-related conditions that would otherwise result in major or extreme severity of illness in about 43% of alerted cases, with activation averaging 40 hours in advance for those where decompensation occurred at greater than 24 hours post-admission. The implementation of the tool was accompanied by a series of communication and resident training refinements, including mandatory notification of the attending physician and completion of an electronic acknowledgement form following alert firing. Most importantly, we have shown the introduction of the iCAHR-AT to be associated with more rapid clinical improvements (decreased severity) among children following firing, as well as an overall decrease in severity adjusted hospital length of stay, compared with those meeting firing criteria prior to this time.
Supplementary Materials
The following supporting information can be downloaded at the website of this paper posted on Preprints.org. Supplementary Materials S1. Modified pSOFA. Supplementary Materials S2. Data Elements Collected for the iCAHR-AT Project. Supplementary Materials S3. Heart Rate Centiles. Supplementary Materials S4. Respiratory Rate Centiles. Supplementary Materials S5. SBP Shock Index Centiles. Supplementary Materials S6. MAP Shock Index Centiles. Supplementary Materials S7. Heart Rate Z-scores. Supplementary Materials S8. Respiratory Rate Z-scores. Supplementary Materials S9. Oral Temperature Z-scores. Supplementary Materials S10. Rectal Temperature Z-scores. Supplementary Materials S11. Temporal Artery Temperature Z-scores. Supplementary Materials S12. iCAHR-AT Training Handout. Supplementary Materials S13. iCAHR-AT Pre-Alert.
Author Contributions
Conceptualization: R.J.S. and S.B.D.; Methodology: R.J.S., E.M.M. and A.M.O.; Literature search and data curation: R.J.S., E.M.M., and A.M.O.; Writing—original draft preparation: R.J.S.; Writing—review and editing: R.J.S., A.M.O., E.M.M., K.L.S., and S.B.D.; Visualization (tables and figures): R.J.S. and A.M.O.; Visualization (clinical EHR): R.J.S., A.M.O., and K.L.S; Clinical Implementation: R.J.S., A.M.O., K.L.S., and S.B.D.. All authors have read and agreed to the published version of the manuscript.
Funding
This research received no external funding.
Institutional Review Board Statement
The project was approved by the Institutional Review Board at Eastern Virginia Medical School under a waiver of informed consent as a quality improvement initiative.
Informed Consent Statement
Informed consent was waived for all individuals included in this study.
Data Availability Statement
The original contributions presented in this study are included in the article/supplementary material. Further inquiries can be directed to the corresponding author(s).
Conflicts of Interest
The authors declare no conflicts of interest.
Acknowledgments
The authors specially thank the following team members from the Information Services department at Children’s Hospital of The King’s Daughters (CHKD) for their support in integrating the iCAHR-AT into the hospital’s Cerner EHR: Cati Stewart, Jonathan (Mark) Hord, Coleman McGehee, and David Douglas. We also thank the many other members of our team at CHKD, including Christopher Mangum, CSSBB; Yvette Conyers, MSN, RN; John Harrington, MD; and Thomas Cholis, MD. Finally, we thank Sandip Godambe, MD, PhD, MBA, and Arno Zaritsky, MD, for their earlier contributions to the development of sepsis screening tools at CHKD.
References
- Watson, R.S.; Carrol, E.D.; Carter, M.J.; Kissoon, N.; Ranjit, S.; Schlapbach, L.J. The burden and contemporary epidemiology of sepsis in children. Lancet Child Adolesc. Health 2024, 8(9), 670–81. [Google Scholar] [CrossRef] [PubMed]
- Zimmerman, J.J.; Banks, R.; Berg, R.A.; Zuppa, A.; Newth, C.J.; Wessel, D.; et al. Trajectory of Mortality and Health-Related Quality of Life Morbidity Following Community-Acquired Pediatric Septic Shock. Crit. Care Med. 2020, 48(3), 329–37. [Google Scholar] [CrossRef] [PubMed]
- Magill, S.S.; Sapiano, M.R.P.; Gokhale, R.; Nadle, J.; Johnston, H.; Brousseau, G.; et al. Epidemiology of Sepsis in US Children and Young Adults. Open Forum Infect. Dis. 2023, 10(5), ofad218. [Google Scholar] [CrossRef] [PubMed]
- Rudd, K.E.; Johnson, S.C.; Agesa, K.M.; Shackelford, K.A.; Tsoi, D.; Kievlan, D.R.; et al. Global, regional, and national sepsis incidence and mortality, 1990-2017: analysis for the Global Burden of Disease Study. Lancet 2020, 395(10219), 200–11. [Google Scholar] [CrossRef] [PubMed]
- Prout, A.J.; Talisa, V.B.; Carcillo, J.A.; Angus, D.C.; Chang, C.H.; Yende, S. Epidemiology of Readmissions After Sepsis Hospitalization in Children. Hosp. Pediatr. 2019, 9(4), 249–55. [Google Scholar] [CrossRef] [PubMed]
- Goldstein, B.; Giroir, B.; Randolph, A.; International Consensus Conference on Pediatric S. International pediatric sepsis consensus conference: definitions for sepsis and organ dysfunction in pediatrics. Pediatr. Crit. Care Med. 2005, 6(1), 2–8. [Google Scholar] [CrossRef] [PubMed]
- Matics, T.J.; Sanchez-Pinto, L.N. Adaptation and Validation of a Pediatric Sequential Organ Failure Assessment Score and Evaluation of the Sepsis-3 Definitions in Critically Ill Children. JAMA Pediatr. 2017, 171(10), e172352. [Google Scholar] [CrossRef] [PubMed]
- Balamuth, F.; Scott, H.F.; Weiss, S.L.; Webb, M.; Chamberlain, J.M.; Bajaj, L.; et al. Validation of the Pediatric Sequential Organ Failure Assessment Score and Evaluation of Third International Consensus Definitions for Sepsis and Septic Shock Definitions in the Pediatric Emergency Department. JAMA Pediatr. 2022, 176(7), 672–8. [Google Scholar] [CrossRef] [PubMed]
- Sanchez-Pinto, L.N.; Bennett, T.D.; DeWitt, P.E.; Russell, S.; Rebull, M.N.; Martin, B.; et al. Development and Validation of the Phoenix Criteria for Pediatric Sepsis and Septic Shock. JAMA 2024, 331(8), 675–86. [Google Scholar] [CrossRef] [PubMed]
- Watson, R.S.; Argent, A.C.; Sorce, L.R.; Randolph, A.G.; Sanchez-Pinto, L.N.; Bennett, T.D.; et al. The 2024 Phoenix Sepsis Score Criteria: Part 1, the Evolution in Definition of Sepsis and Septic Shock. Pediatr. Crit. Care Med. 2025, 26(2), e246–e51. [Google Scholar] [CrossRef] [PubMed]
- Sanchez-Pinto, L.N.; Daniels, L.A.; Atreya, M.; Faustino, E.V.S.; Farris, R.W.D.; Geva, A.; et al. Phoenix Sepsis Criteria in Critically Ill Children: Retrospective Validation Using a United States Nine-Center Dataset, 2012-2018. Pediatr. Crit. Care Med. 2025, 26(2), e155–e65. [Google Scholar] [CrossRef] [PubMed]
- Georgette, N.; Michelson, K.; Monuteaux, M.; Eisenberg, M.A. Comparing Screening Tools for Predicting Phoenix Criteria Sepsis and Septic Shock Among Children. Pediatrics 2025, 155(5). [Google Scholar] [CrossRef] [PubMed]
- Eisenberg, M.A.; Balamuth, F. Pediatric sepsis screening in US hospitals. Pediatr. Res. 2022, 91(2), 351–8. [Google Scholar] [PubMed]
- Balamuth, F.; Alpern, E.R.; Grundmeier, R.W.; Chilutti, M.; Weiss, S.L.; Fitzgerald, J.C.; et al. Comparison of Two Sepsis Recognition Methods in a Pediatric Emergency Department. Acad. Emerg. Med. 2015, 22(11), 1298–306. [Google Scholar] [CrossRef] [PubMed]
- Balamuth, F.; Alpern, E.R.; Abbadessa, M.K.; Hayes, K.; Schast, A.; Lavelle, J.; et al. Improving Recognition of Pediatric Severe Sepsis in the Emergency Department: Contributions of a Vital Sign-Based Electronic Alert and Bedside Clinician Identification. Ann. Emerg. Med. 2017, 70(6), 759–68 e2. [Google Scholar] [CrossRef] [PubMed]
- Scott, H.F.; Kempe, A.; Deakyne Davies, S.J.; Krack, P.; Leonard, J.; Rolison, E.; et al. Managing Diagnostic Uncertainty in Pediatric Sepsis Quality Improvement with a Two-Tiered Approach. Pediatr. Qual. Saf. 2020, 5(1), e244. [Google Scholar] [CrossRef] [PubMed]
- Bradshaw, C.; Goodman, I.; Rosenberg, R.; Bandera, C.; Fierman, A.; Rudy, B. Implementation of an Inpatient Pediatric Sepsis Identification Pathway. Pediatrics 2016, 137(3), e20144082. [Google Scholar] [CrossRef] [PubMed]
- Stephen, R.J.; Carroll, M.S.; Hoge, J.; Maciorowski, K.; Jones, R.C.; Lucey, K.; et al. Sepsis Prediction in Hospitalized Children: Model Development and Validation. Hosp. Pediatr. 2023, 13(9), 760–7. [Google Scholar] [CrossRef] [PubMed]
- Stephen, R.J.; Lucey, K.; Carroll, M.S.; Hoge, J.; Maciorowski, K.; Jones, R.C.; et al. Sepsis Prediction in Hospitalized Children: Clinical Decision Support Design and Deployment. Hosp. Pediatr. 2023, 13(9), 751–9. [Google Scholar] [CrossRef] [PubMed]
- Sepanski, R.J.; Zaritsky, A.L.; Godambe, S.A. Identifying children at high risk for infection-related decompensation using a predictive emergency department-based electronic assessment tool. Diagnosis (Berl) 2021, 8(4), 458–68. [Google Scholar] [CrossRef] [PubMed]
- Martinez, E.M.; Sepanski, R.J.; Jennings, A.D.; Schmidt, J.M.; Cholis, T.J.; Dominy, M.E.; et al. Optimizing Recognition and Management of Patients at Risk for Infection-Related Decompensation Through Team-Based Decision Making. J. Healthc. Qual. 2023, 45(2), 59–68. [Google Scholar] [CrossRef] [PubMed]
- Doernbecher Children's Hospital Emergency Department. Bronchiolitis Clinical Pathway Portland, OR; Oregon Health & Science University, 2021; Available online: https://www.ohsu.edu/sites/default/files/2021-10/DCH%20ED%20Bronchiolitis-Clinical-Pathway%20Oct%2021.pdf.
- Toh, C.H.; Hoots, W.K.; ISTH obotSoDICot. The scoring system of the Scientific and Standardisation Committee on Disseminated Intravascular Coagulation of the International Society on Thrombosis and Haemostasis: a 5-year overview. J. Thromb. Haemost. 2007, 5(3), 604–6. [Google Scholar] [CrossRef] [PubMed]
- Averill, R.F.; McCullough, E.C.; Goldfield, N.; Hughes, J.S.; Bonazelli, J.L.B.; et al. 3M APR DRG classification system, version 31.0: methodology overview Wallingford, CT: 3M Health Information Systems. 2013. Available online: https://hcup-us.ahrq.gov/db/nation/nis/grp031_aprdrg_meth_ovrview.pdf.
- Sepanski, R.J.; Godambe, S.A.; Mangum, C.D.; Bovat, C.S.; Zaritsky, A.L.; Shah, S.H. Designing a pediatric severe sepsis screening tool. Front Pediatr. 2014, 2, 56. [Google Scholar] [CrossRef] [PubMed]
- Sepanski, R.J.; Godambe, S.A.; Zaritsky, A.L. Pediatric Vital Sign Distribution Derived From a Multi-Centered Emergency Department Database. Front Pediatr. 2018, 6, 66. [Google Scholar] [CrossRef] [PubMed]
- Stasinopoulos, M.; Rigby, R.; Voudouris, V.; Heller, G.; De Bastiani, F. Flexible Regression and Smoothing: Using GAMLSS in R; Chapman & Hall/CRC: Boca Raton, FL, USA, 2017. [Google Scholar]
- Stasinopoulos, M.; Rigby, R.A. Generalized additive models for location scale and shape (GAMLSS) in R. J. Stat. Softw. 2007, 23, 1–46. [Google Scholar] [CrossRef]
- Haque, I.U.; Zaritsky, A.L. Analysis of the evidence for the lower limit of systolic and mean arterial pressure in children. Pediatr. Crit. Care Med. 2007, 8(2), 138–44. [Google Scholar] [CrossRef] [PubMed]
- Gonen, M. Analyzing Receiver Operating Characteristic Curves with SAS; SAS Institute Inc.: Cary, NC, USA, 2007. [Google Scholar]
- Goh, K.H.; Wang, L.; Yeow, A.Y.K.; Poh, H.; Li, K.; Yeow, J.J.L.; et al. Artificial intelligence in sepsis early prediction and diagnosis using unstructured data in healthcare. Nat. Commun. 2021, 12(1), 711. [Google Scholar] [CrossRef] [PubMed]
Figure 1.
Overview Flow Diagram of the iCAHR-AT Project.
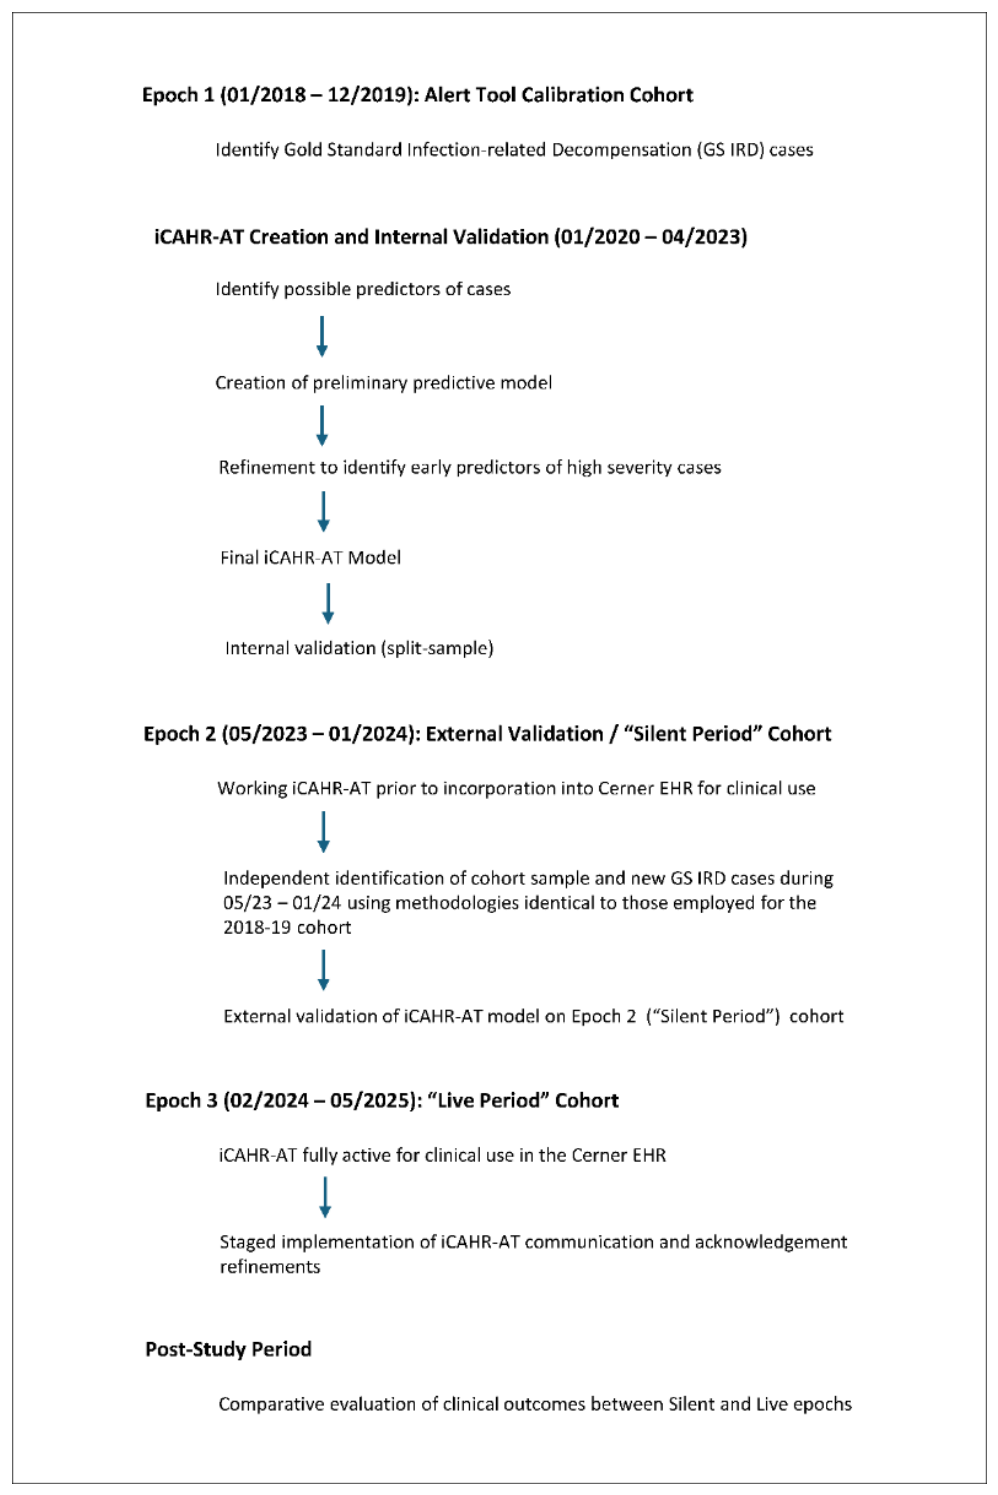
Figure 2.
Summarized appearance of iCAHR-AT in Cerner EHR following live implementation.
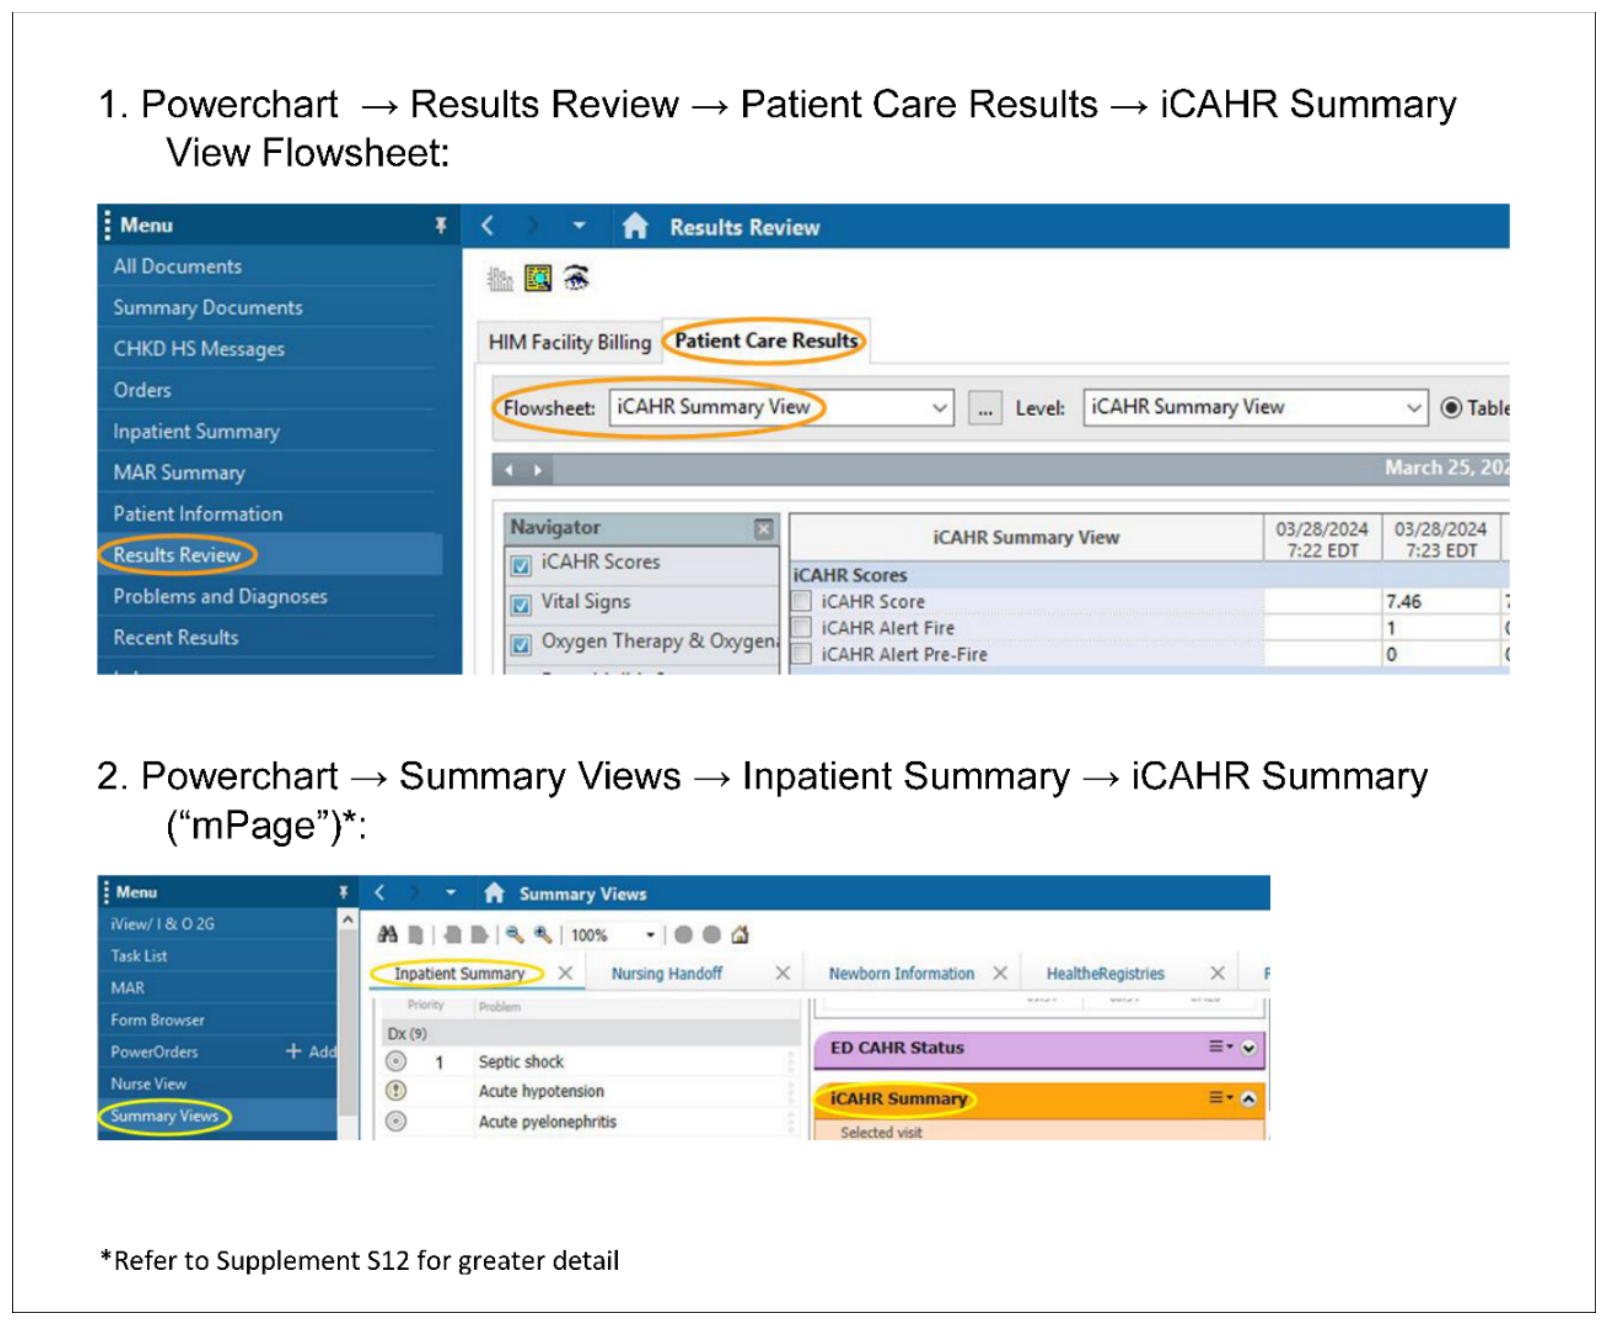
Figure 3.
Association of maximum iCAHR-AT score with outcomes of “Major” or “Extreme” severity of illness (SOI).
Figure 3.
Association of maximum iCAHR-AT score with outcomes of “Major” or “Extreme” severity of illness (SOI).
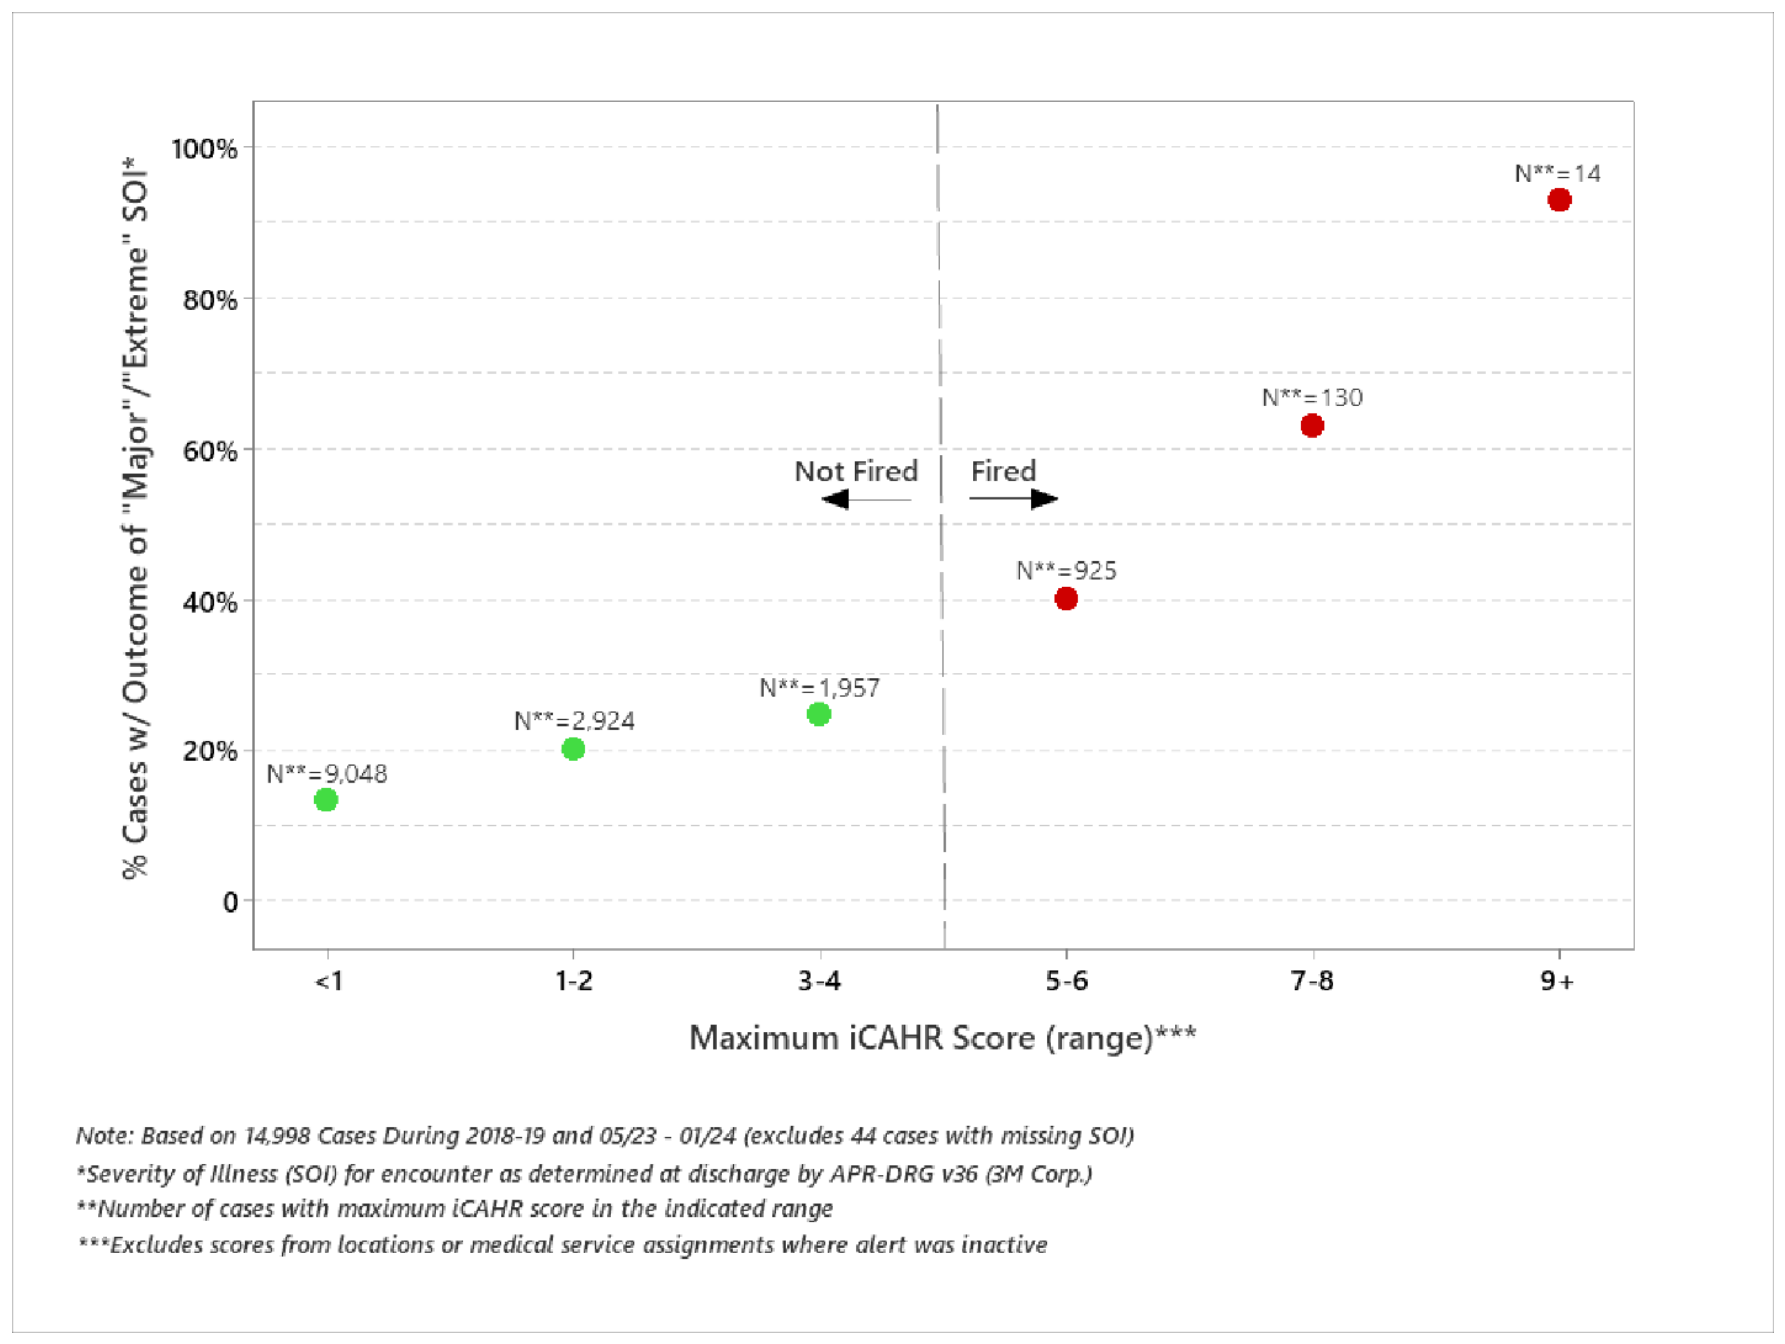
Figure 4.
iCAHR-AT mean score trend from time of initial firing to 48 hours post-firing, Silent vs. Live epochs.
Figure 4.
iCAHR-AT mean score trend from time of initial firing to 48 hours post-firing, Silent vs. Live epochs.
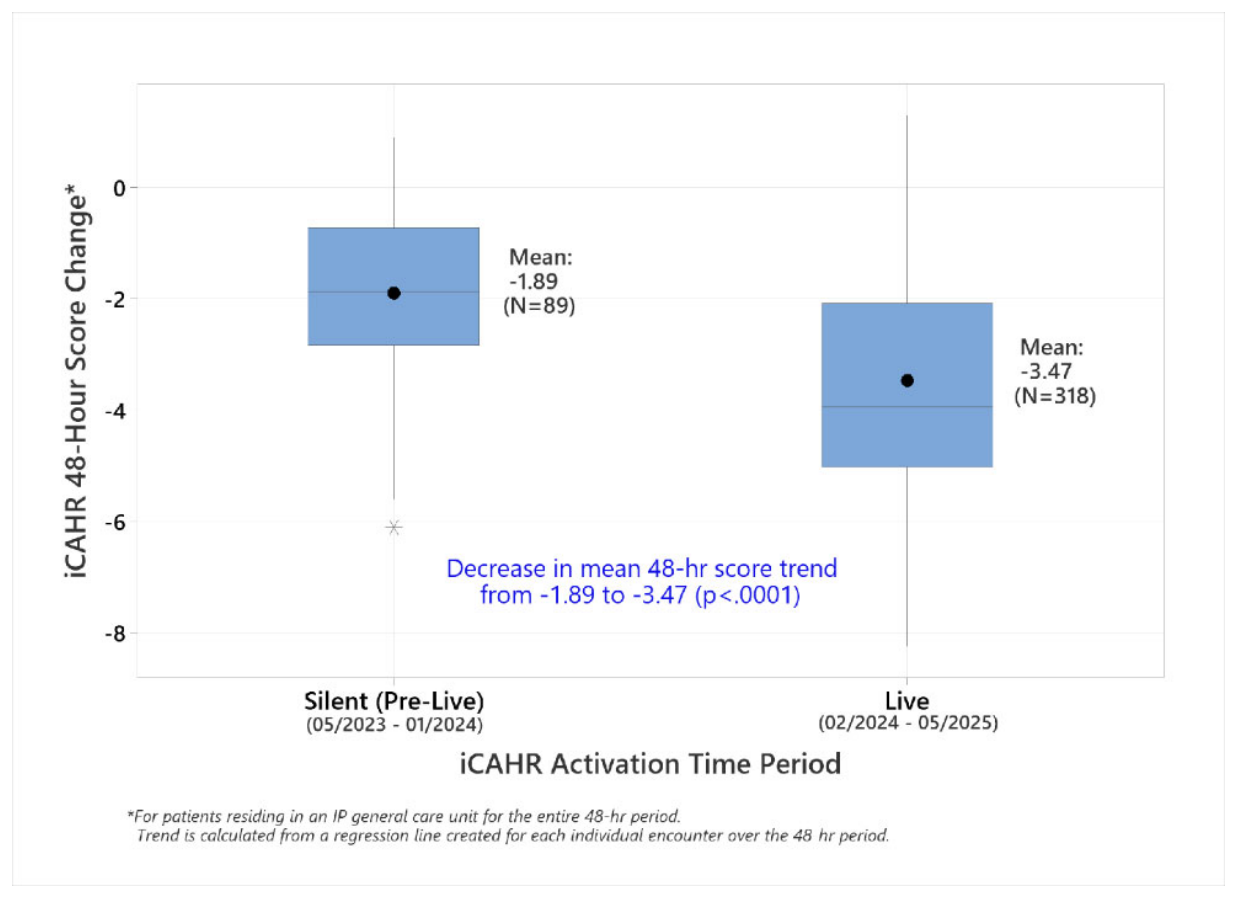
Figure 5.
A) iCAHR-AT mean scores at time of initial firing, and B) Maximum scores at ≥48 hours post-admission, Silent vs. Live epochs.
Figure 5.
A) iCAHR-AT mean scores at time of initial firing, and B) Maximum scores at ≥48 hours post-admission, Silent vs. Live epochs.
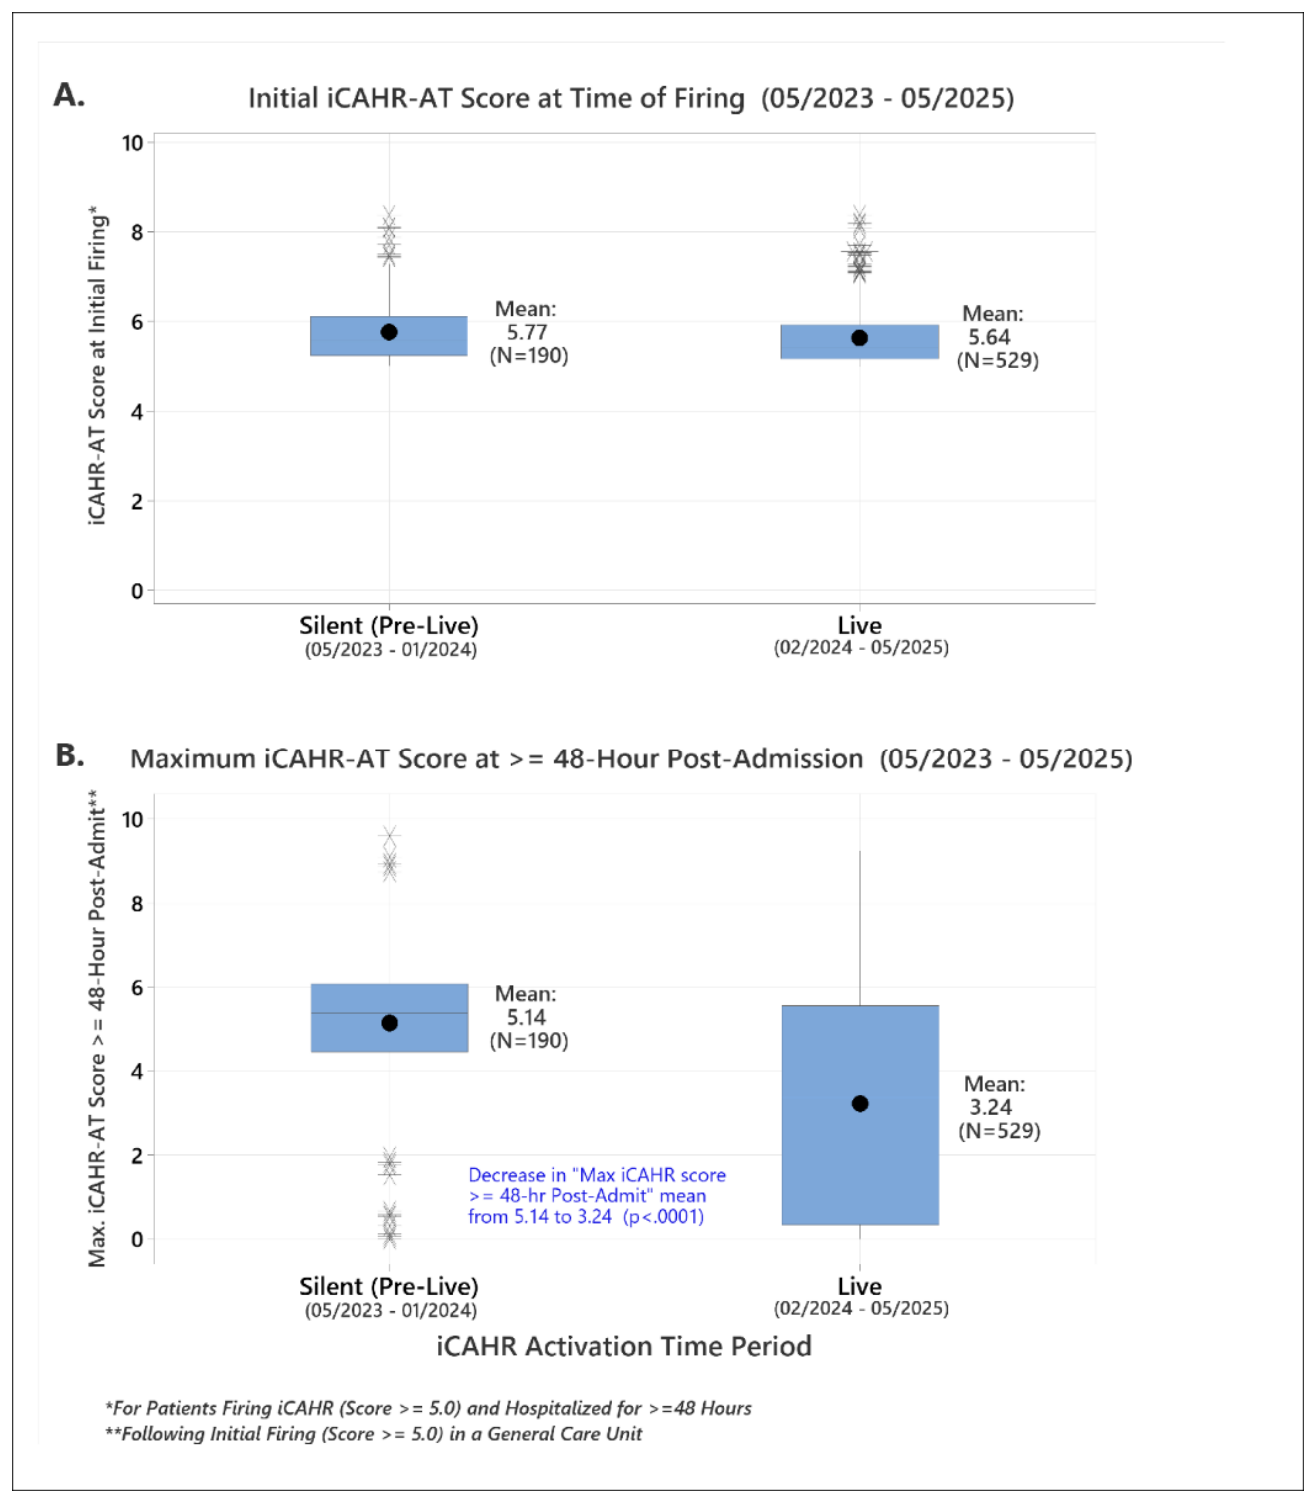
Figure 6.
Staged time series of mean iCAHR-AT score change (patient improvement) over initial 48 hours post-firing, showing effects of alert implementation and subsequent refinements.
Figure 6.
Staged time series of mean iCAHR-AT score change (patient improvement) over initial 48 hours post-firing, showing effects of alert implementation and subsequent refinements.
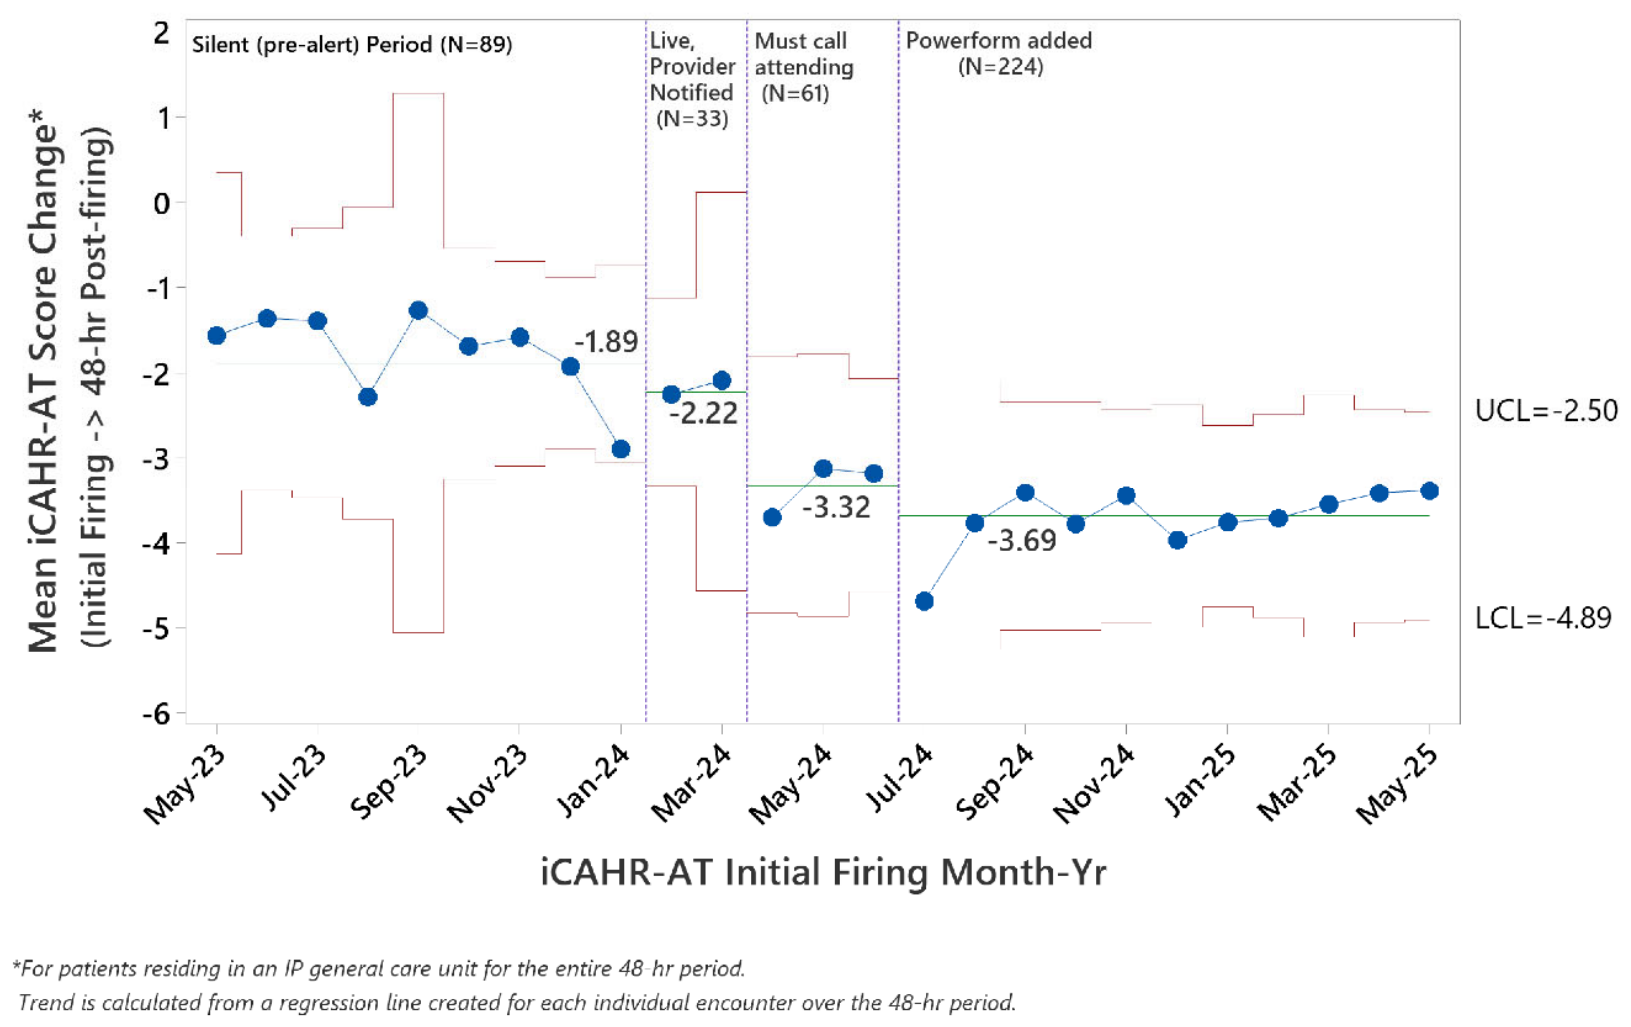

Table 1.
List of ICD-10-CM coded diagnoses with potential systemic response considered for chart review.
Table 1.
List of ICD-10-CM coded diagnoses with potential systemic response considered for chart review.
| ICD-10-CM Code | ICD-10-CM Description | ICD-10-CM | ICD-10-CM Description | |
|---|---|---|---|---|
| J85x | Abscess of lung and mediastinum | J1008,J09X1,J110x | Influenza with pneumonia | |
| I32x | Acute and subacute endocarditis | G06x | Intracranial and intraspinal abscess | |
| K7200 | Acute and subacute necrosis of the liver | A32x,P372 | Listeriosis | |
| I40x | Acute myocarditis | A692 | Lyme disease | |
| K85x2 | Acute pancreatitis with infection | O85 | Major puerperal infection | |
| I30x | Acute pericarditis | B50x-B54x | Malaria | |
| N10 | Acute pyelonephritis | B451,G02x,G039 | Meningitis, Other | |
| A069 | Amebiasis, unspecified | A394 | Meningococcemia | |
| A066 | Amebic brain abscess | A19x | Miliary tuberculosis | |
| A064,A065 | Amebic liver abscess | B5889 | Multisystemic disseminated toxoplasmosis | |
| A227 | Anthrax septicemia | K5530,P779 | Necrotizing enterocolitis in newborn | |
| B449 | Aspergillosis | M726 | Necrotizing fasciitis | |
| R7881 | Bacteremia | B488 | Opportunistic mycosis | |
| G00x,G01x | Bacterial meningitis | K6811,T814x | Other postoperative infection | |
| T80211A | Bloodstream infection due to central venous catheter | B60xx | Other protozoal diseases | |
| J21x | Bronchiolitis due to other organism | A280 | Pasteurellosis | |
| J210 | Bronchiolitis due to RSV | K65x,K67x | Peritonitis and retroperitoneal infections | |
| J180 | Bronchopneumonia | K658 | Pneumococcal peritonitis | |
| B376 | Candidal endocarditis | B59 | Pneumocystosis | |
| B375 | Candidal meningitis | J13x-J15x | Pneumonia, Bacterial | |
| B371 | Candidal pneumonia | J12x | Pneumonia, Viral | |
| L03x | Cellulitis and abscess | J16x,J17x,J18x | Pneumonia, Other | |
| B384 | Coccidioidal meningitis | T8112XA,T811x | Postoperative shock, septic | |
| B45x | Cryptococcosis | O8681 | Puerperal septic thrombophlebitis | |
| B377 | Disseminated candidiasis | A75xx-A79xx | Rickettsioses | |
| B3889 | Disseminated coccidioidomycosis | A021 | Salmonella septicemia | |
| A312 | Disseminated mycobacterium | A40x,A41x | Sepsis | |
| I33 | Endocarditis | I76 | Septic arterial embolism | |
| J86x | Empyema | I2690 | Septic pulmonary embolism | |
| G040x,G042x | Encephalitis/myelitis/encephalomyelitis | R6521 | Septic shock | |
| A267,A268 | Erysipelothrix infection | P369 | Septicemia (sepsis) of the newborn | |
| I96 | Gangrene | A207 | Septicemic plague | |
| A480 | Gas gangrene | R652x | Severe sepsis | |
| A5486 | Gonococcal sepsis | B42x | Sporotrichosis | |
| B007 | Herpetic septicemia | K650 | Suppurative peritonitis | |
| B39x | Histoplasmosis | A483 | Toxic Shock Syndrome | |
| T845x,T846x,T847x,T857x | Infection/inflammatory reaction due to prosthetic device, implant, graft | P393 | Urinary tract infection of the newborn | |
| T8022XA,T802x,T880XXA | Infection following transfusion, infusion, or injection | N390 | Urosepsis | |
| T80219A | Infection due to central venous catheter | A289 | Zoonotic bacterial infection |
Table 2.
Characteristics of the Study Cohorts.
| Characteristics: median (IQR) or % (n) | Original Calibration Group 01/2018 – 12/2019 (N=10,992) |
External Validation / "Silent" 05/2023 - 01/2024 (N=4,050) |
"Live" Alert Epoch 02/2024 - 05/2025 (N=8,411) |
|
|---|---|---|---|---|
| All patients in cohort | ||||
| Age: overall and by category | 4.6 years (11.5) | 4.2 years (10.6) | 5.3 years (10.9) | |
| Neonate (0–29 days) | 9.1% (1,004) | 7.8% (314) | 6.4% (535) | |
| Infant (30 days – <2 years) | 27.7% (3,049) | 29.9% (1,209) | 25.3% (2,140) | |
| Toddler and pre-school (2–5 years) | 18.9% (2,074) | 20.0% (812) | 21.4% (1,802) | |
| School age child (6–12 years) | 21.7% (2,382) | 21.6% (874) | 24.5% (2.061) | |
| Adolescent and young adult (13–17 years) | 18.2% (1,997) | 16.8% (682) | 19.0% (1,597) | |
| Adult (≥18 years) | 4.4% (486) | 3.9% (159) | 3.4% (290) | |
| Length of stay (LOS) | 1.7 days (2.2) | 1.9 days (2.4) | 1.7 days (2.2) | |
| High SOI outcomes ("Major" or "Extreme")a, overall | 16.0% (1,755) | 24.3% (984) | 23.7% (1,991) | |
| Infectious disease (ID) as primary service line (1° SL)b | 8.6% (946) | 6.7% (270) | 7.7% (644) | |
| Final diagnosis (Dx) of infection as defined in Table 1 | 23.4% (2,571) | 28.3% (1145) | 26.1% (2,195) | |
| Sepsis as final diagnosis (ICD-10)c | 0.6% (62) | 1.4% (55) | 1.7% (145) | |
| GS SIRS IRD casesd | 0.8% (83) | 1.2% (50) | N/A | |
| Deaths, overall (all causes) | 0.06% (7) | 0.10% (4) | 0.07% (6) | |
| Cases meeting iCAHR alert criteria (firing rate) | 6.7% (736) | 8.1% (328) | 8.8% (742) | |
| Among patients meeting iCAHR-AT alert criteria | ||||
| Length of stay (LOS) | 3.1 days (4.7) | 3.7days (5.6) | 2.9 days (5.9) | |
| High SOI outcomes ("Major" or "Extreme")a | 36.7% (270) | 58.8% (193) | 51.8% (382) | |
| Infectious disease (ID) as primary service line (1° SL)b | 13.9% (102) | 10.4% (34) | 15.4% (114) | |
| Final diagnosis (Dx) of infection as defined in Table 1 | 54.4% (400) | 60.1% (197) | 60.2% (444) | |
| Sepsis as final diagnosis (ICD-10)e | 4.4% (32) | 7.0% (23) | 10.3% (76) | |
| Deathse | 0.4% (3) | 0.6% (2) | 0.5% (4) | |
| aSeverity of illness (SOI) "major" or "extreme" based on APR-DRG v36 classification | ||||
| bAssigned following discharge based on APR-DRG v36 classification | ||||
| cAny coded discharge diagnosis of septicemia, sepsis, severe sepsis, or septic shock | ||||
| dIdentified by chart review process | ||||
| eIncludes deaths among patients in palliative care or with complex chronic conditions or coexisting organ failures unrelated to infection. | ||||
Table 3.
Factors and corresponding weights selected as significant predictors of infection-related decompensation.
Table 3.
Factors and corresponding weights selected as significant predictors of infection-related decompensation.
| Parameter | Factor Weight |
|---|---|
| Systemic Inflammatory Response Syndrome (SIRS): | 2.851 |
| Acute Organ Dysfunction + Infection | 1.951 |
| Abnormal Oxygen Saturation (SpO2) | 0.581 |
| Interaction: Abnormal Temperature X Abnormal White Blood Count (WBC) or Neutrophil Banding | 0.403 |
| Elevated C-reactive protein (CRP) | 0.309 |
| Extended Capillary Refill Time | 0.302 |
| Respiratory Rate (RR) Z-score† ≥ 2.0 | 0.248 * (RR Z-score squared) |
| Interaction: Abnormal Bronchiolitis Score X Abnormal RR | 0.227 |
| Abnormal Bronchiolitis Score | 0.226 |
| Acidosis (abnormal anion gap, base excess, or pH) | 0.220 |
| Abnormal WBC or Neutrophil Banding | 0.212 |
| Immunocompromise | 0.130 |
| Temperature Z-score† ≥ 2.0 or ≤ −2.0 | 0.120 * (TMP Z-score squared) |
| Interaction: Extended Capillary Refill Time X Abnormal Heart Rate | 0.072 |
| Abnormal Systolic Blood Pressure (SBP) | 0.032 |
| Heart Rate (HR) Z-score† ≥ 2.0 | 0.016 * (HR Z-score squared) |
| †Normalized standard centile | |
Table 4.
Performance characteristics of iCAHR-AT among the pooled original calibration and external validation cohorts.
Table 4.
Performance characteristics of iCAHR-AT among the pooled original calibration and external validation cohorts.
| Performance Metric | Value for Pooled Cohorts |
|---|---|
| Area Under the Curve [AUC] (95% CI) | 0.893 (0.862,0.924) |
| Sensitivity / Specificity for GS SIRS IRD cases | 85.0% / 93.6% |
| iCAHR-AT Firing rate | 7.1% of cohort cases |
| Number of GS SIRS IRD cases (% of total cohort cases) | 133 (0.88%) |
| Positive / Negative Predictive Value [PPV/NPV] for GS SIRS IRD cases | 10.6% / 99.9% |
| PPV / NPV as % iCAHR-AT Firings with "Major" or "Extreme" SOI Outcomes | 43.6% / 83.7% |
| Percent of GS SIRS IRD alert firings with Max Decomp.* ≤24 hours post-admit | 54% |
| Mean / Median times from alert to Max Decomp.*: | |
| All GS SIRS IRD firings | 21.4 hour / 7.9 hours |
| GS SIRS IRD firings where Max Decomp.* >24 hours post-admit | 40.5 hours / 31.2 hours |
|
*Time of maximum physiological decompensation | |
Disclaimer/Publisher’s Note: The statements, opinions and data contained in all publications are solely those of the individual author(s) and contributor(s) and not of MDPI and/or the editor(s). MDPI and/or the editor(s) disclaim responsibility for any injury to people or property resulting from any ideas, methods, instructions or products referred to in the content. |
© 2026 by the authors. Licensee MDPI, Basel, Switzerland. This article is an open access article distributed under the terms and conditions of the Creative Commons Attribution (CC BY) license (http://creativecommons.org/licenses/by/4.0/).
Copyright: This open access article is published under a Creative Commons CC BY 4.0 license, which permit the free download, distribution, and reuse, provided that the author and preprint are cited in any reuse.


