

Submitted:
31 July 2026
Posted:
31 July 2026
You are already at the latest version
Abstract
Marinas support a range of recreational and commercial activities, but their enclosed hydrodynamics, and associated operations can generate diverse and rapidly changing environmental pressures. Conventional monitoring may miss short-lived events, previously unrecognized contaminants and the combined biological effects of multiple stressors. Valvometry, the measurement of bivalve shell behaviour, is an emerging biomonitoring technology that can provide continuous, integrated evidence of environmental variability and stress. This study developed and demonstrated the BioSentinel Health Index, a biologically informed framework combining bivalve-behaviour with assessments of data quality and management and response capability. Minute-scale valve-gape data from the mussel Mytilus galloprovincialis at Mandurah Ocean Marina, Western Australia, were used to derive ecosystem-health metrics. Mussels were classified as open for 87.9% of valid observations and exhibited broadly consistent rhythmic structure (spectral consistency score = 75.9%). Coordinated valve-closure events served as operational alarm indicators linked to a documented investigation and response pathway. At least three active mussels provided valid observations for 86.2% of the period. The single-station deployment only received partial spatial-coverage credit because it did not account for potential environmental variation across the marina. Under the proposed framework, Mandurah Ocean Marina received a preliminary score of 85.2%, placing it within the highest overall rating category.
Keywords:
bivalves
; biosensors
; coastal tourism
; environmental management
; marinas
; real-time monitoring
; valve gape
; wavelet analysis
; biological early-warning systems
1. Introduction
Marinas and small harbors are important components of coastal maritime infrastructure, supporting tourism, recreational boating, commercial fishing, charter operations, vessel servicing and waterfront economies [1]. While marinas can contribute substantially to social activities and the local economy, they can also concentrate environmental pressures associated with vessel use and waterfront operations [2,3,4,5]. Operational pressures include inputs of sewage and nutrients, fuel and oil residues, antifouling contaminants and other waste, as well as physical disturbance from propellers and anchoring, light and noise pollution, and the spread of invasive species [6]. Marinas are often configured to provide sheltered berthing and protection from waves and currents; however, enclosed layouts, narrow entrances, irregular basin geometry and internal breakwaters can reduce water exchange and create poorly flushed areas, exacerbating any nutrient and non-nutrient contaminants [7].
Environmental sustainability is increasingly central to marina management [1,7,8]. Accreditation and environmental management schemes have improved the standardization of policies, audits, reporting and continual environmental improvement across the maritime sector [9,10,11,12]. For example, EcoPorts supports environmental risk assessment, performance benchmarking and certification through its Self-Diagnosis Method and Port Environmental Review System framework [13,14]. Similarly, ISO 14001 provides an international framework for organizations to establish, review and continually improve environmental management systems, while marina-specific accreditation programs, such as Blue Flag, and the International Clean Marina Program, promote pollution prevention, waste management, emergency preparedness, environmental education and stakeholder engagement [15,16,17]. These programs are valuable, but they are generally supported by discrete water-quality sampling events, rather than providing continuous monitoring of the health of the marina environment [18].
Managers need to be able to identify environmental changes quickly, indicate whether the magnitude of the change is biologically meaningful, trigger timely investigation or management action, and support practical operational decisions. While traditional physico-chemical measurements, e.g., dissolved oxygen concentrations, provide important information for this purpose, continuous sensors capable of capturing such changes may be costly to deploy and maintain because of biofouling and sensor-drift servicing requirements [19,20]. They also typically measure a limited number of water-quality variables [21] and may not detect the particular stressor or combination of stressors and the resulting biological response activity. Furthermore, species-specific physiological thresholds are often unknown for all individual environmental parameters, making it difficult to determine whether observed conditions are likely to have biologically meaningful effects on fauna, particularly where multiple stressors may act synergistically [22,23].
Biological monitoring is already widely used to assess ecological condition through microbial plankton, benthic invertebrate and fish communities [24,25,26,27]. However, these approaches are also commonly based on discrete sampling events and thus may not provide continuous evidence of biological condition during intervening periods of time. Biological early-warning systems can address this gap by continuously measuring the responses of organisms to ambient conditions [28]. They are particularly valuable where pollutants may be episodic, chemically diverse or difficult to detect using conventional monitoring alone, as they provide rapid, integrated evidence of changing water quality [28,29].
Biological early-warning systems can use sentinel organisms that respond continuously to ambient conditions. Bivalve molluscs are especially suitable for this role because they are generally sessile, almost continuously filter the overlying water, are abundant and occur widely across freshwater, estuarine and marine environments, and respond to a broad range of environmental drivers [29,30]. Their valve-gape behavior may change in response to altered oxygen conditions, salinity, temperature, contaminants, food supply and other disturbances [31,32].
Continuously monitoring the valve-gape behaviour of bivalves (i.e., valvometry) provides a non-invasive means of quantifying bivalve shell movements and has been increasingly applied to investigate behavioral responses to environmental variability and stress in aquatic systems [31,33,34]. In addition to shell-closure responses, associated with changing environmental conditions, bivalves often express recurring behavioral rhythms linked to diel and tidal patterns [35,36,37]. The persistence, strength and synchrony of these rhythms, which are shaped by endogenous processes and external cues, such as light–dark cycles, tides, water temperature and food availability, may provide a complementary measure of ecosystem condition. Stable rhythm structure may indicate coherent responses to expected environmental forcing, whereas reductions in rhythm power, altered timing or declining agreement among individuals may indicate that local conditions have departed from an expected biological state [38]. In this study, wavelet methods were used to characterize the periodic structure of valve-gape behavior, while comparison of global spectra among individuals provided a measure of consistency without assuming that a particular frequency must be dominant.
The BioSentinel Health Index was developed to translate continuous bivalve behavior into practical environmental information for managers and was applied here to a marina setting. Using the Spyvalve® platform (www.spyvalve.com), a remote biomonitoring system that records minute-scale valve-gape dynamics from multiple Mytilus galloprovincialis (Mediterranean Mussels), the framework integrates indicators of behavioral state, coordinated closure events, biological rhythm structure, among-individual consistency, data completeness and spatial monitoring coverage. Together, these indicators are intended to support early warning, targeted investigation, adaptive management and transparent reporting alongside established environmental management systems.
This study presents the development and demonstration of the BioSentinel Health Index in a marina in southwestern Australia. Specifically, it aimed to: (1) demonstrate a biologically-informed approach for continuous marina environmental assessment; (2) derive transparent metrics describing bivalve behavioral condition, biological rhythm maintenance, alarm events, data completeness and spatial monitoring coverage; and (3) integrate these measures with management and response readiness into an overall marina health score encompassing ecosystem health, monitoring and data quality, and management and response capacity. The findings demonstrate that continuous mussel behavioral monitoring can be incorporated into a transparent management framework that complements conventional water-quality assessment for marinas.
2. Materials and Methods
2.1. Framework Overview
The BioSentinel Health Index was structured as a decision-support framework integrating continuous bivalve valve-gape monitoring with assessments of data quality, spatial representativeness and management readiness. Indicators derived from the Spyvalve® platform database included behavioral state, coordinated closure events, biological rhythm consistency, data completeness and spatial monitoring coverage. These indicators were combined with a Management and Response component that assessed the presence of appropriate alert pathways, maintenance procedures, follow-up investigation and environmental response arrangements.
2.2. BioSentinel Health Index
The BioSentinel Health Index was structured as a 100-point composite score comprising three domains: Ecosystem Health (60 points), Monitoring and Data (20 points), and Management and Response (20 points; Table 1). Ecosystem Health comprised behavioural state, rhythm consistency and penalties for confirmed coordinated closure events. Monitoring and Data comprised data completeness and spatial sensor coverage, while Management and Response assessed documented alert pathways, trained responders, routine maintenance and quality-assurance procedures, data accessibility, and mechanisms for investigation and corrective action. The proposed component weights provide a transparent starting point and should be refined through validation across marinas with differing environmental settings and operational pressures. Overall scores were assigned a BioSentinel certification badge: Gold (80–100 points), Silver (60–79 points), Bronze (40–59 points), or Priority Action (<40 points).
2.3. Study Setting and Deployment Design
Here, we demonstrate the BioSentinel Health Index using a single Spyvalve® monitoring station deployed within the Mandurah Ocean Marina (-32.5247, 115.7137; Figure 1). The Mandurah Ocean Marina is a semi-enclosed marina situated at the northern end of the Mandurah city centre, adjacent to the entrance channel connecting the Peel–Harvey Estuary with the Indian Ocean. The marina supports recreational boating, vessel launching and mooring, charter and tourism operations, boat sales, maintenance and repair services. Consequently, the marina is exposed to environmental pressures associated with vessel traffic, fuel and oil residues, antifouling compounds, wastewater, litter, stormwater runoff and intensive waterfront activity. Historical recreational-water monitoring by the Western Australian Department of Health classified Mandurah Ocean Marina as microbial assessment category A. The site was provisionally rated “Very Good” for 2008–2014 [39], with category A classifications also reported in subsequent assessments extending to 2021 [40]. These assessments were based on enterococcal indicators and therefore describe recreational microbial water quality rather than overall ecological condition.
The Spyvalve® station was installed in October 2023 and operated continuously thereafter. To exclude the initial period of minor technical and operational refinement, the present study analyzed a 12-month dataset collected from July 2024 to June 2025.
2.4. Spyvalve Platform and Biological Data Acquisition
Continuous behavioural monitoring was undertaken using the Spyvalve® biosensor platform deployed in Mandurah Ocean Marina. The system recorded valve-gape dynamics of up to eight M. galloprovincialis at 1-min intervals. Each mussel was fitted with a Hall-effect sensor enclosed in silicone and mounted in a custom 3D-printed backpack attached to the posterior region of one valve using marine epoxy (Loctite® Epoxy Marine). A 5 × 3 mm magnet was attached to the opposing valve, with the sensor and magnet aligned to measure valve-gape movement. Sensor data, expressed in millivolts (mV) and representing magnetic field strength between the sensor and magnet, were read using an Arduino Nano ESP32. The poles of each sensor and magnet were aligned so that shell closure produced lower mV values, whereas greater valve opening produced higher mV values. Observations were transmitted at 5-min intervals to a central database together with station metadata and water-temperature measurements. Monitoring multiple individuals reduced the influence of anomalous behavior, sensor error or short-term handling responses on station-level interpretation. Mussels were contained in a 15L commercial oyster basket at 1-2 m depth.
2.5. Behavioral State and Alarm Events
Behavioral state was derived directly from the raw valve-gape sensor signal after normalization for each individual mussel. To account for differences in sensor position and the absolute magnitude of valve movement among individuals, sensor values were scaled over a rolling seven-day period using the equation:
where valve openness (VO) is the proportion a valve is open for an individual mussel j at time t, is the raw sensor measurement in millivolts; and and are the minimum and maximum sensor values recorded for that mussel during the preceding seven days. Normalised values thus ranged from 0 to 1, with lower values representing relative shell closure and higher values representing greater shell opening. For each minute, each mussel’s valves were classified as closed when and open when .
The difference between and over a seven-day period for each ‘active’ mussel was typically >50 mV. When the range was <10 mV, that mussel was classified as ‘inactive’ for the corresponding period and was excluded from behavioural-state calculations. Limited variation in valve-gape signal may indicate mortality, sensor detachment or another hardware-related failure.
The proportion of valid observations classified as open was calculated for each individual and then summarized across all active mussels. A minimum of three active mussels was adopted as an operational threshold for station-level assessment. This retained a basic level of biological replication and reduced the influence of anomalous individual behaviour or sensor failure, while avoiding the exclusion of extended monitoring periods when some individuals were inactive. Station-level estimates based on only three mussels were nevertheless considered less robust than those derived from a larger proportion of the eight-mussel array. Where fewer than three mussels were active, station-level behavioral summaries were treated as insufficient and excluded from interpretation. Station-level behavioral plots were generated from the mean normalized gape of active mussels at each time step, with the distribution of individual observations retained to illustrate among-mussel variability. For each minute, mean openness was calculated across all active mussels. A station-level observation was classified as open when mean normalized openness was ≥0.2 and closed when it was <0.2. The proportion of valid minutes classified as open was then calculated across the study period and used as the behavioural-state component of the Ecosystem Health score, contributing up to 50 of the 60 points allocated to this domain.
Potential alarm events were defined as coordinated closure periods in which all active mussels were simultaneously classified as closed for at least five consecutive minutes. The 5-min criterion was selected because it has previously been applied in European drinking-water reservoirs using bivalve early-warning system [41]. Each confirmed alarm event contributed a one-point penalty to the Ecosystem Health component. Events subsequently attributed to technical faults, handling disturbance or other verified non-environmental causes were corrected following data validation and were not retained as penalties.
2.6. Maintenance of Biological Rhythms and Rhythm Consistency
Biological rhythmic structure, defined here as the distribution of recurring periodic patterns in valve-gape behaviour, was assessed using continuous wavelet transform analysis of standardized valve-gape time series in R [42] using the WaveletComp package [43]. For each mussel, a Morlet wavelet was applied across periods of approximately 2–48 h to the longest continuous segment containing consistent 1-min observations. Short gaps of ≤10 min were linearly interpolated. For each mussel, a global wavelet spectrum was calculated by averaging wavelet power across that period. These spectra were used to describe the distribution of rhythmic power across periods, without assuming that a particular periodicity represented a universal indicator of environmental condition.
Consistency in rhythmic structure among mussels was assessed by comparing individual global wavelet spectra. Pairwise Pearson correlation coefficients were calculated between spectral profiles after alignment by time period. The station-level rhythm-consistency score was calculated as the mean of the upper-triangular correlation coefficients, excluding self-correlations, and expressed as a percentage. Higher scores indicated greater similarity in the distribution of rhythmic power across periods among mussels, irrespective of which period was dominant. This metric was interpreted as evidence of coherent collective behavioral organization rather than as a measure of any specific circadian or tidal rhythm.
2.7. Data Completeness and Spatial Coverage
Monitoring completeness was defined as the proportion of the total deployment period during which at least three active mussels simultaneously supplied valid observations. The monitoring record was expanded to a complete one-minute sequence, allowing missing timestamps to be explicitly included. For each minute, the number of active mussels transmitting data was determined, and completeness was calculated as:
, where is the number of assessed minutes with at least three active mussels transmitting data, and is the total number of minutes over the study period.
Sensor coverage contributed 10 points to the overall score, with full credit assigned when the array covered the appropriate number of zones within the marina.
2.8. Management and Response Readiness
The Management and Response component of the BioSentinel Health Index was assessed against whether the monitoring system was linked to documented procedures capable of translating biological alerts into timely field investigation and, where necessary, regulatory response. It also assessed whether monitoring information was accessible to relevant users through transparent data visualisation.
3. Results
3.1. Low-Frequency Behavioral Monitoring
The Mandurah Ocean Marina station produced a continuous minute-scale record of valve-gape behavior from July 2024 to June 2025. Monthly time series showed persistent variation in mean normalized gape, including repeated short-duration reductions below the operational closure threshold (< 5 minutes; Figure 2). Across the full monitoring period, mussels were classified as open for 87.9% of valid observations. The preliminary alarm-event calculation resulted in a 1% penalty, when all active mussels were closed for greater than five consecutive minutes; however, this event occurred during scheduled maintenance and was therefore classified as a non-environmental alert, resulting in a corresponding 1% correction. The resulting behavioral-state score, based on mean valve openness of 87.9%, was thus 44 of the 50 points available for this component within the Ecosystem Health domain.
3.2. Maintenance and Consistency of Biological Rhythms
Wavelet analysis indicated that mussels expressed a dominant diel rhythm near 24 h, with secondary harmonic structure near 12 h. Global wavelet spectra showed a high preliminary among-individual consistency score of 75.9%, indicating broadly similar distributions of rhythmic power across mussels (Figure 3). The corresponding rhythm-consistency score was therefore 7.6 of the 10 points available for the Ecosystem Health component.
3.3. Monitoring Completeness and Station Coverage
Data completeness was 86.2%, based on the criterion that at least three mussels were transmitting data simultaneously to enable a valid station-level assessment. The number of active mussels was generally between five and eight. Reduced transmission occurred during only two short periods: approximately two weeks in June following flooding of the equipment, and approximately two days in January due to technical issues. This resulted in a data-completeness score of 8.6 out of 10 available points within the Monitoring and Data domain.
3.4. Management and Response Readiness
The Mandurah Ocean Marina deployment received 20 of 20 points for Management and Response under the proposed BioSentinel Health Index. The station was supported by an established alert, first-response and escalation pathway, with trained local responders available to undertake visual assessments and notify the relevant government agency where a potential environmental concern was identified. Routine maintenance included removing biofouling from the basket enclosure, which was required more frequently during summer, and periodically repositioning and reattaching sensors closer to the posterior margin of the shell to account for mussel growth and maintain reliable valve-gape measurements. Monitoring data were accessible to the public via the Spyvalve® website.
4. Discussion
This study demonstrates the potential of the BioSentinel Health Index to provide a practical, biologically meaningful and readily interpretable framework for assessing environmental condition and management of marinas. Using minute-scale valve-gape observations from Mytilus galloprovincialis, the Index integrated behavioral condition, rhythm consistency, data completeness, spatial coverage and management readiness within a transparent composite score. Under the proposed scoring framework, Mandurah Ocean Marina received an overall BioSentinel Health Index score of 85.2 out of 100. This high score was considered plausible given the generally sustained valve opening, coherent rhythmic structure, high data completeness and established management-response arrangements observed during the assessment period. It was also broadly consistent with historical recreational-water monitoring that classified the marina as microbial assessment category A, although this bacterial classification provides contextual support rather than direct validation of the Index.
The BioSentinel Health Index was designed to interpret valve-gape data across complementary temporal scales. At short time scales, the proportion of mussels classified as open provides an accessible indication of collective behavioural condition, while coordinated closure events activate the established response pathway for data review, first-responder assessment and, where warranted, agency notification and management action. Across the assessment period, mussels were classified as open for 87.9% of valid observations, indicating generally sustained valve opening under prevailing marina conditions. This was lower than values reported for M. galloprovincialis in Ría de Arousa, Spain (97.5% open), and during winter in the nearby Swan–Canning Estuary (approximately 97%) [44,45], but higher than summer values in the latter estuary, where mussels were open for 53% of observations, potentially owing to elevated temperature and/or a toxic algal bloom [45]. A single apparent alarm event occurred when all active mussels were classified as closed for five consecutive minutes. The event coincided with scheduled maintenance, during which the mussels were temporarily removed from the water, and was therefore classified as non-environmental and excluded from the alarm-event penalty.
At longer time scales, consistency in the distribution of rhythmic power among individuals provides an additional measure of collective behavioral organization [36,38,46]. Global wavelet spectra showed a dominant rhythm near 24 h, together with secondary harmonic structure near 12 h, and a mean among-individual consistency score of 75.9%, indicating broadly similar rhythmic profiles across mussels. This is broadly consistent with findings from Ría de Arousa, where seven of eight M. galloprovincialis displayed similar circadian rhythmicity [44]. Although the dominant daily pattern at Mandurah Ocean Marina was most consistent with entrainment to the light–dark cycle [29,44,47], the scoring approach did not rely on any predetermined frequency. Instead, it assessed whether rhythmic structure was coherent among individuals, recognizing that dominant rhythms may vary among habitats, seasons and species according to local environmental conditions.
Rhythmic behavior may be altered by stressors including contaminant exposure, harmful algal blooms, turbidity, vessel activity, artificial light at night, underwater noise and other physical disturbances [29,48]. Persistent weakening of rhythmic structure, shifts in dominant periodicity or declining agreement among mussels may therefore provide an early indication that environmental conditions have departed from their typical state. Artificial light at night is particularly relevant in marina environments because it can interfere with natural light–dark cues and disrupt circadian regulation and activity rhythms in marine animals, including bivalves and other coastal taxa [49,50]. Conversely, a consistent rhythmic pattern that does not align with an identifiable biological or environmental driver may also warrant further investigation, particularly where it persists across multiple individuals or departs from site-specific baseline behavior.
Valid observations from at least three active mussels were available for 86.2% of the 12-month assessment period. These results demonstrate that the station retained sufficient biological replication for most of the monitoring period, while also showing why data completeness should be reported explicitly rather than assumed from the presence of a continuous plot. Reduced data availability was largely associated with a flooding event and brief technical interruptions, demonstrating that the approach can retain biological replication over extended marina deployments while also highlighting the importance of explicitly reporting monitoring completeness.
The inclusion of spatial coverage within the BHI recognises that ecological condition can vary substantially within a marina. Water quality in tidal exchange areas near an entrance may be strongly influenced by adjacent coastal or estuarine waters, whereas enclosed inner basins can experience reduced flushing and greater accumulation of locally generated stressors [7]. In the present study, the existing monitoring station was located near the marina entrance, where exchange with the adjacent estuary channel and tidal flushing were most pronounced. The deployment therefore provided robust temporal evidence for one location but could not determine whether the observed responses were representative of the marina as a whole, influenced by conditions in the adjacent estuary, or restricted to localized inner-basin processes. It therefore received 5 of the 10 points available for spatial sensor coverage.
Rather than representing a limitation to obscure in reporting, this result identifies a clear pathway towards a more spatially representative monitoring network. A fully implemented minimum configuration should include at least one station in an entrance exchange zone and one station in an enclosed inner basin or other retention-prone location, where reduced flushing may increase the likelihood of locally generated stressors accumulating [7]. Relevant zones can be identified using marina plans, tidal exchange patterns, marina geometry, local knowledge of circulation and water-quality conditions, and, where available, hydrodynamic modelling or tracer studies [51].
Additional stations may be appropriate in secondary basins, maintenance areas, freshwater inflows, dredged pockets or other locally recognized risk locations. Where only one station can initially be deployed, placement within a retention-prone area may provide greater sensitivity to locally generated pressures, although interpretation would still benefit from comparison with an entrance exchange zone or external reference station.
The Management and Response component linked biological monitoring to practical action. The Mandurah Ocean Marina Spyvalve® station was initially established as an early-warning system for potential fish-kill events, with data outputs available on a public website. A local Indigenous Ranger group was trained as first responders to undertake visual assessments following relevant alerts. This included fish-kill response training provided by the Western Australian Department of Primary Industries and Regional Development (DPIRD), together with additional training from university aquatic-ecosystem experts in visual survey techniques for identifying potential environmental concerns, including fish mortality, surface scums, odours, unusual fauna behaviour and other visible signs of water-quality deterioration.
If an alert or visual concern was identified, Rangers were trained to document observations as first responders and notify the relevant government agency to enable further investigation. This response pathway linked continuous mussel-behavior monitoring with on-ground assessment, stakeholder-facing reporting and formal incident-response processes. The early-warning and response approach has since been incorporated into the Western Australian DPIRD Fish Kill Response Manual, which is distributed internally within the State Government [52]. Collectively, these arrangements demonstrate that the system was not limited to passive data collection, but formed part of an operational process for investigating and responding to potential fish-kill or water-quality incidents.
The framework may also support environmental accreditation and continual-improvement systems. Existing schemes, including EcoPorts, Blue Flag and environmental management systems aligned with ISO 14001, provide mechanisms for documenting policies, identifying risks, auditing procedures and demonstrating environmental commitment [13]. However, these schemes do not generally include continuous biological evidence of environmental condition within receiving waters. The BioSentinel Health Index provides a potential way to link management actions with ecological response. For example, a marina may have spill-response plans, waste-reception facilities and maintenance procedures, while biological monitoring can provide complementary evidence of whether resident mussels maintain stable collective behavior and coherent rhythmic organization.
5. Conclusions
This study shows that the BioSentinel Health Index can translate continuous mussel valve-gape data into a practical assessment of marina environmental condition, monitoring performance and management readiness. Mandurah Ocean Marina scored 85.2 out of 100, supported by generally sustained valve opening, coherent daily rhythms and high data completeness. The single entrance-zone station provided strong temporal evidence but highlighted the need for future monitoring in inner-basin or retention-prone areas. Importantly, the system was linked to trained Indigenous Ranger first responders and formal fish-kill response processes, demonstrating that biological monitoring can support early warning and practical management action. Further validation across other marinas is required, but the Index provides a scalable framework for linking environmental management with real-time biological evidence.
Author Contributions
“Conceptualization, A.C.; methodology, A.C.; software, A.C; validation, A.C.; formal analysis, A.C.; resources, A.C.; data curation, A.C.; writing—original draft preparation, A.C., S.B., J.D. and J.T.; writing—review and editing, A.C., S.B., J.D. and J.T.; project administration, A.C., S.B., J.D. and J.T.; funding acquisition, A.C., S.B. and J.T. All authors have read and agreed to the published version of the manuscript.
Funding
This research was funded by the Alcoa Foundation.
Institutional Review Board Statement
Not applicable.
Data Availability Statement
The data presented in this study are available on request from the corresponding author.
Conflicts of Interest
Alan Cottingham is the founder and developer of the Spyvalve monitoring system and associated BioSentinel platform. Spyvalve is currently a research and environmental monitoring platform and is not a commercial product. Neither Alan Cottingham nor Murdoch University will receive commercial income, royalties, equity, licence fees or other direct financial benefit from the use of Spyvalve or BioSentinel in this project.
Acknowledgments
We acknowledge the Bindjareb Noongar people as the Traditional Custodians of the land and waters on which this research was undertaken. We thank the Western Australian Department of Primary Industries and Regional Development for issuing an Instrument of Exemption under section 7(2)(a) of the Fish Resources Management Act 1994 (Exemption No. 251267024), authorizing the relevant research and monitoring activities.
References
- Muslu, A.; Lemckert, C.; Scheffers, A. Exploring Sustainable Marina Management: Developing Scales with Stakeholders in the Australian Marin Tourism Industry. Coast. Manag. 2026, 1–14. [Google Scholar]
- Vantola, R.; Luoma, E.; Parviainen, T.; Lehikoinen, A. Sustainability manifesting as a multi-material and-sited network effect: How boat-sourced sewage management facilities serve as governance artefacts advancing sustainability in nautical tourism. Mar. Pollut. Bull. 2021, 173, 113114. [Google Scholar] [CrossRef] [PubMed]
- Hardiman, N.; Burgin, S. Recreational impacts on the fauna of Australian coastal marine ecosystems. J. Environ. Manag. 2010, 91, 2096–2108. [Google Scholar] [CrossRef] [PubMed]
- Leon, L.M.; Warnken, J. Copper and sewage inputs from recreational vessels at popular anchor sites in a semi-enclosed Bay (Qld, Australia): Estimates of potential annual loads. Mar. Pollut. Bull. 2008, 57, 838–845. [Google Scholar] [CrossRef] [PubMed]
- Ghermandi, A. Benefits of coastal recreation in Europe: identifying trade-offs and priority regions for sustainable management. J. Environ. Manag. 2015, 152, 218–229. [Google Scholar] [CrossRef] [PubMed]
- Byrnes, T.A.; Dunn, R.J. Boating-and shipping-related environmental impacts and example management measures: A review. J. Mar. Sci. Eng. 2020, 8, 908. [Google Scholar] [CrossRef]
- Alkhalidi, M.; Alsulaili, A. Enhancing marina sustainability: Water quality and flushing efficiency in marinas. J. Mar. Sci. Eng. 2024, 12, 649. [Google Scholar]
- Ioras, F. Sustainable Management of Mediterranean Superyacht Marinas: A Comparative Assessment of Environmental Practices and Policy Implications. Sustainability 2025, 17, 1377. [Google Scholar]
- Rony, A.H.; Kitada, M.; Dalaklis, D.; Ölçer, A.I.; Ballini, F. Exploring the new policy framework of environmental performance management for shipping: a pilot study. WMU J. Marit. Aff. 2019, 18, 1–24. [Google Scholar] [CrossRef]
- Walker, T.R. Green Marine: An environmental program to establish sustainability in marine transportation. Mar. Pollut. Bull. 2016, 105, 199–207. [Google Scholar] [CrossRef] [PubMed]
- Di Vaio, A.; Varriale, L. Management innovation for environmental sustainability in seaports: Managerial accounting instruments and training for competitive green ports beyond the regulations. Sustainability 2018, 10, 783. [Google Scholar] [CrossRef]
- Housni, F.; Boumane, A.; Rasmussen, B.D.; Britel, M.R.; Barnes, P.; Abdelfettah, S.; Maurady, A. Environmental sustainability maturity system: An integrated system scale to assist maritime port managers in addressing environmental sustainability goals. Environ. Chall. 2022, 7, 100481. [Google Scholar] [CrossRef]
- Satır, T.; Doğan-Sağlamtimur, N. The protection of marine aquatic life: Green Port (EcoPort) model inspired by Green Port concept in selected ports from Turkey, Europe and the USA. Period. Eng. Nat. Sci. 2018, 6. [Google Scholar] [CrossRef]
- Vale, J.; Ferreira, M.; Tavares, M.C.; Bandeira, A.M. Environmental Sustainability Disclosure in EcoPorts. In Proceedings of the World Conference on Information Systems and Technologies, 2025; pp. 131–140. [Google Scholar]
- Di Noia, A.E.; Nicoletti, G.M. ISO 14001 certification: benefits, costs and expectations for organization. Stud. Oecon. Posnaniensia 2016, 4, 94–109. [Google Scholar] [CrossRef]
- Ojiako, U.; Bashir, H.; Almansoori, H.H.B.; AlRaeesi, E.J.H.; Al Zarooni, H.A. Using ISO 14001 certification to signal sustainability equivalence: An examination of the critical success factors. Prod. Plan. Control 2025, 36, 1287–1314. [Google Scholar]
- van Dijk, J. Implementation of the Blue Flag Program. NHTV Breda University of Applied Sciences 2009. 2009.
- Tselentis, V.S. Marina Environmental Review System: A methodology to assess environmental management in recreational ports. 2008.
- Harmel, R.D.; Preisendanz, H.E.; King, K.W.; Busch, D.; Birgand, F.; Sahoo, D. A review of data quality and cost considerations for water quality monitoring at the field scale and in small watersheds. Water 2023, 15, 3110. [Google Scholar] [CrossRef]
- Leigh, C.; Alsibai, O.; Hyndman, R.J.; Kandanaarachchi, S.; King, O.C.; McGree, J.M.; Neelamraju, C.; Strauss, J.; Talagala, P.D.; Turner, R.D. A framework for automated anomaly detection in high frequency water-quality data from in situ sensors. Sci. Total Environ. 2019, 664, 885–898. [Google Scholar] [CrossRef] [PubMed]
- Kumar, M.; Khamis, K.; Stevens, R.; Hannah, D.M.; Bradley, C. In-situ optical water quality monitoring sensors—applications, challenges, and future opportunities. Front. Water 2024, 6, 1380133. [Google Scholar] [CrossRef]
- Coraggio, E.; Han, D.; Gronow, C.; Tryfonas, T. Water quality sampling frequency analysis of surface freshwater: a case study on Bristol Floating Harbour. Front. Sustain. Cities 2022, 3, 791595. [Google Scholar] [CrossRef]
- Hoff, D.; Lehmann, W.; Pease, A.; Raimondo, S.; Russom, C.; Steeger, T. Predicting the toxicities of chemicals to aquatic animal species; US Environmental Protection Agency: Washington, DC, 2010. [Google Scholar]
- Danovaro, R.; Carugati, L.; Berzano, M.; Cahill, A.E.; Carvalho, S.; Chenuil, A.; Corinaldesi, C.; Cristina, S.; David, R.; Dell’Anno, A. Implementing and innovating marine monitoring approaches for assessing marine environmental status. Front. Mar. Sci. 2016, 3, 213. [Google Scholar] [CrossRef]
- Isibor, P.O.; Adesinaola, A.O. Biological Indicators and Bioassessment Protocols. In Pollution Tolerance of Freshwater Ecosystems and Biomonitoring; CRC Press; pp. 91–114.
- Tweedley, J.R.; Warwick, R.M.; Hallett, C.S.; Potter, I.C. Fish-based indicators of estuarine condition that do not require reference data. Estuar. Coast. Shelf Sci. 2017, 191, 209–220. [Google Scholar] [CrossRef]
- Tweedley, J.R.; Hallett, C.S.; Warwick, R.M.; Clarke, K.R.; Potter, I.C. The hypoxia that developed in a microtidal estuary following an extreme storm produced dramatic changes in the benthos. Mar. Freshw. Res. 2016, 67, 327–341. [Google Scholar] [CrossRef]
- Hellou, J. Behavioural ecotoxicology, an “early warning” signal to assess environmental quality. Environ. Sci. Pollut. Res. 2011, 18, 1–11. [Google Scholar] [CrossRef] [PubMed]
- Vereycken, J.E.; Aldridge, D.C. Bivalve molluscs as biosensors of water quality: state of the art and future directions. Hydrobiologia 2023, 850, 231–256. [Google Scholar] [CrossRef]
- Kanmani, M.; Jeyanthi, S.; Thirunavukkarasu, N. Mussels: A Potent Ecological Indicator to Climate Change. In Navigating Climate Change: Impacts on Biodiversity and Ecosystem Resilience; Springer, 2025; pp. 145–158. [Google Scholar]
- Durier, G.; Nadalini, J.-B.; Comeau, L.A.; Starr, M.; Michaud, S.; Tran, D.; St-Louis, R.; Babarro, J.M.; Clements, J.C.; Tremblay, R. Use of valvometry as an alert tool to signal the presence of toxic algae Alexandrium catenella by Mytilus edulis. Front. Mar. Sci. 2022, 9, 987872. [Google Scholar] [CrossRef]
- Porter, E.T.; Breitburg, D.L. Eastern oyster, Crassostrea virginica, valve gape behavior under diel-cycling hypoxia. Mar. Biol. 2016, 163, 218. [Google Scholar] [CrossRef]
- Durier, G.; Nadalini, J.-B.; Saint-Louis, R.; Genard, B.; Comeau, L.A.; Tremblay, R. Sensitivity to oil dispersants: Effects on the valve movements of the blue mussel Mytilus edulis and the giant scallop Placopecten magellanicus, in sub-arctic conditions. Aquat. Toxicol. 2021, 234, 105797. [Google Scholar] [CrossRef] [PubMed]
- Modesto, V.; Tosato, L.; Pilbala, A.; Benistati, N.; Fraccarollo, L.; Termini, D.; Manca, D.; Moramarco, T.; Sousa, R.; Riccardi, N. Mussel behaviour as a tool to measure the impact of hydrodynamic stressors. Hydrobiologia 2023, 850, 807–820. [Google Scholar] [CrossRef]
- Tran, D.; Perrigault, M.; Ciret, P.; Payton, L. Bivalve mollusc circadian clock genes can run at tidal frequency. Proc. R. Soc. B Biol. Sci. 2020, 287, 20192440. [Google Scholar] [CrossRef] [PubMed]
- Tran, D.; Nadau, A.; Durrieu, G.; Ciret, P.; Parisot, J.-P.; Massabuau, J.-C. Field chronobiology of a molluscan bivalve: how the moon and sun cycles interact to drive oyster activity rhythms. Chronobiol. Int. 2011, 28, 307–317. [Google Scholar] [CrossRef] [PubMed]
- Mat, A.M.; Massabuau, J.-C.; Ciret, P.; Tran, D. Looking for the clock mechanism responsible for circatidal behavior in the oyster Crassostrea gigas. Mar. Biol. 2014, 161, 89–99. [Google Scholar] [CrossRef]
- Bertolini, C.; Rubinetti, S.; Umgiesser, G.; Witbaard, R.; Bouma, T.; Rubino, A.; Pastres, R. How to cope in heterogeneous coastal environments: spatio-temporally endogenous circadian rhythm of valve gaping by mussels. Sci. Total Environ. 2021, 768, 145085. [Google Scholar] [CrossRef] [PubMed]
- Department of Health; Western Australia. Regional Recreational Waters Bacterial (Enterococci) Sampling Program: Site Status Overview (October 2014); Environmental Health Directorate, Department of Health, Western Australia: Perth, Australia, 2014. [Google Scholar]
- Department of Health; Western Australia. Recreational Waters Bacterial (Enterococci) Monitoring Program: Site Status Overview 2021—Regional Local Government Authorities; Government of Western Australia: Perth, Australia, 2021. [Google Scholar]
- Ferreira-Rodríguez, N.; Beggel, S.; Geist, J.P.; Modesto, V.; Österling, M.; Riccardi, N.; Sousa, R.; Urbańska, M. Freshwater mussels as sentinels for safe drinking water supply in Europe. ACS Es&t Water 2023, 3, 3730–3735. [Google Scholar] [CrossRef] [PubMed]
- R Core Team R: A Language and Environment for Statistical Computing, R Foundation for Statistical Computing: 2025.
- Roesch, A.; Schmidbauer, H. WaveletComp: Computational Wavelet Analysis; WaveletComp, 2025. [Google Scholar] [CrossRef]
- Comeau, L.A.; Babarro, J.M.; Longa, A.; Padin, X.A. Valve-gaping behavior of raft-cultivated mussels in the Ría de Arousa, Spain. Aquac. Rep. 2018, 9, 68–73. [Google Scholar] [CrossRef]
- Cottingham, A.; Bossie, A.; Valesini, F.; Tweedley, J.R.; Galimany, E. Quantifying the potential water filtration capacity of a constructed shellfish reef in a temperate hypereutrophic estuary. Diversity 2023, 15, 113. [Google Scholar] [CrossRef]
- Gnyubkin, V. The circadian rhythms of valve movements in the mussel Mytilus galloprovincialis. Russ. J. Mar. Biol. 2010, 36, 419–428. [Google Scholar] [CrossRef]
- Garcia-March, J.R.; Jiménez, S.; Sanchis, M.A.; Monleon, S.; Lees, J.; Surge, D.; Tena-Medialdea, J. In situ biomonitoring shows seasonal patterns and environmentally mediated gaping activity in the bivalve, Pinna nobilis. Mar. Biol. 2016, 163, 29. [Google Scholar] [CrossRef]
- Torres-Guijarro, S.; Estevez-Marquez, P.; Babarro, J.M.; Silva-Caride, E.; Santos-Domínguez, D.; Comeau, L.A.; Gilcoto, M. Laboratory measurement of the effect of exposure to ship noise on mussels. In Proceedings of the INTER-NOISE and NOISE-CON Congress and Conference Proceedings, 2024; pp. 277–288. [Google Scholar]
- Stanton, D.L.; Cowart, J.R. The effects of artificial light at night (ALAN) on the circadian biology of marine animals. Front. Mar. Sci. 2024, 11, 1372889. [Google Scholar] [CrossRef]
- Brüning, A.; Hölker, F.; Franke, S.; Preuer, T.; Kloas, W. Spotlight on fish: Light pollution affects circadian rhythms of European perch but does not cause stress. Sci. Total Environ. 2015, 511, 516–522. [Google Scholar] [CrossRef] [PubMed]
- Galal, E.M.; Youssef, H.Z. Flushing characteristics of a marina using a 2D Hydrodynamic Model: Case study of the new extension of Al-Wakrah Port, Qatar. Port.-Said Eng. Res. J. 2023, 27, 54–67. [Google Scholar]
- Department of Primary Industries and Regional Development. Fish Kill Response Manual—Interim Edition 9.8. In Fisheries Occasional Publications No. 44; Department of Primary Industries and Regional Development, Government of Western Australia: Perth, Australia, 2024; ISBN 978-1-921258-12-8. ISSN 1447-2058. [Google Scholar]
Figure 1.
Map showing location of the Spyvalve® mussel monitoring station (highlighted circle) in the Mandurah Ocean Marina (red polygon). Insert map shows location of the marine in southwest Western Australia. Image: GoogleEarth.
Figure 1.
Map showing location of the Spyvalve® mussel monitoring station (highlighted circle) in the Mandurah Ocean Marina (red polygon). Insert map shows location of the marine in southwest Western Australia. Image: GoogleEarth.
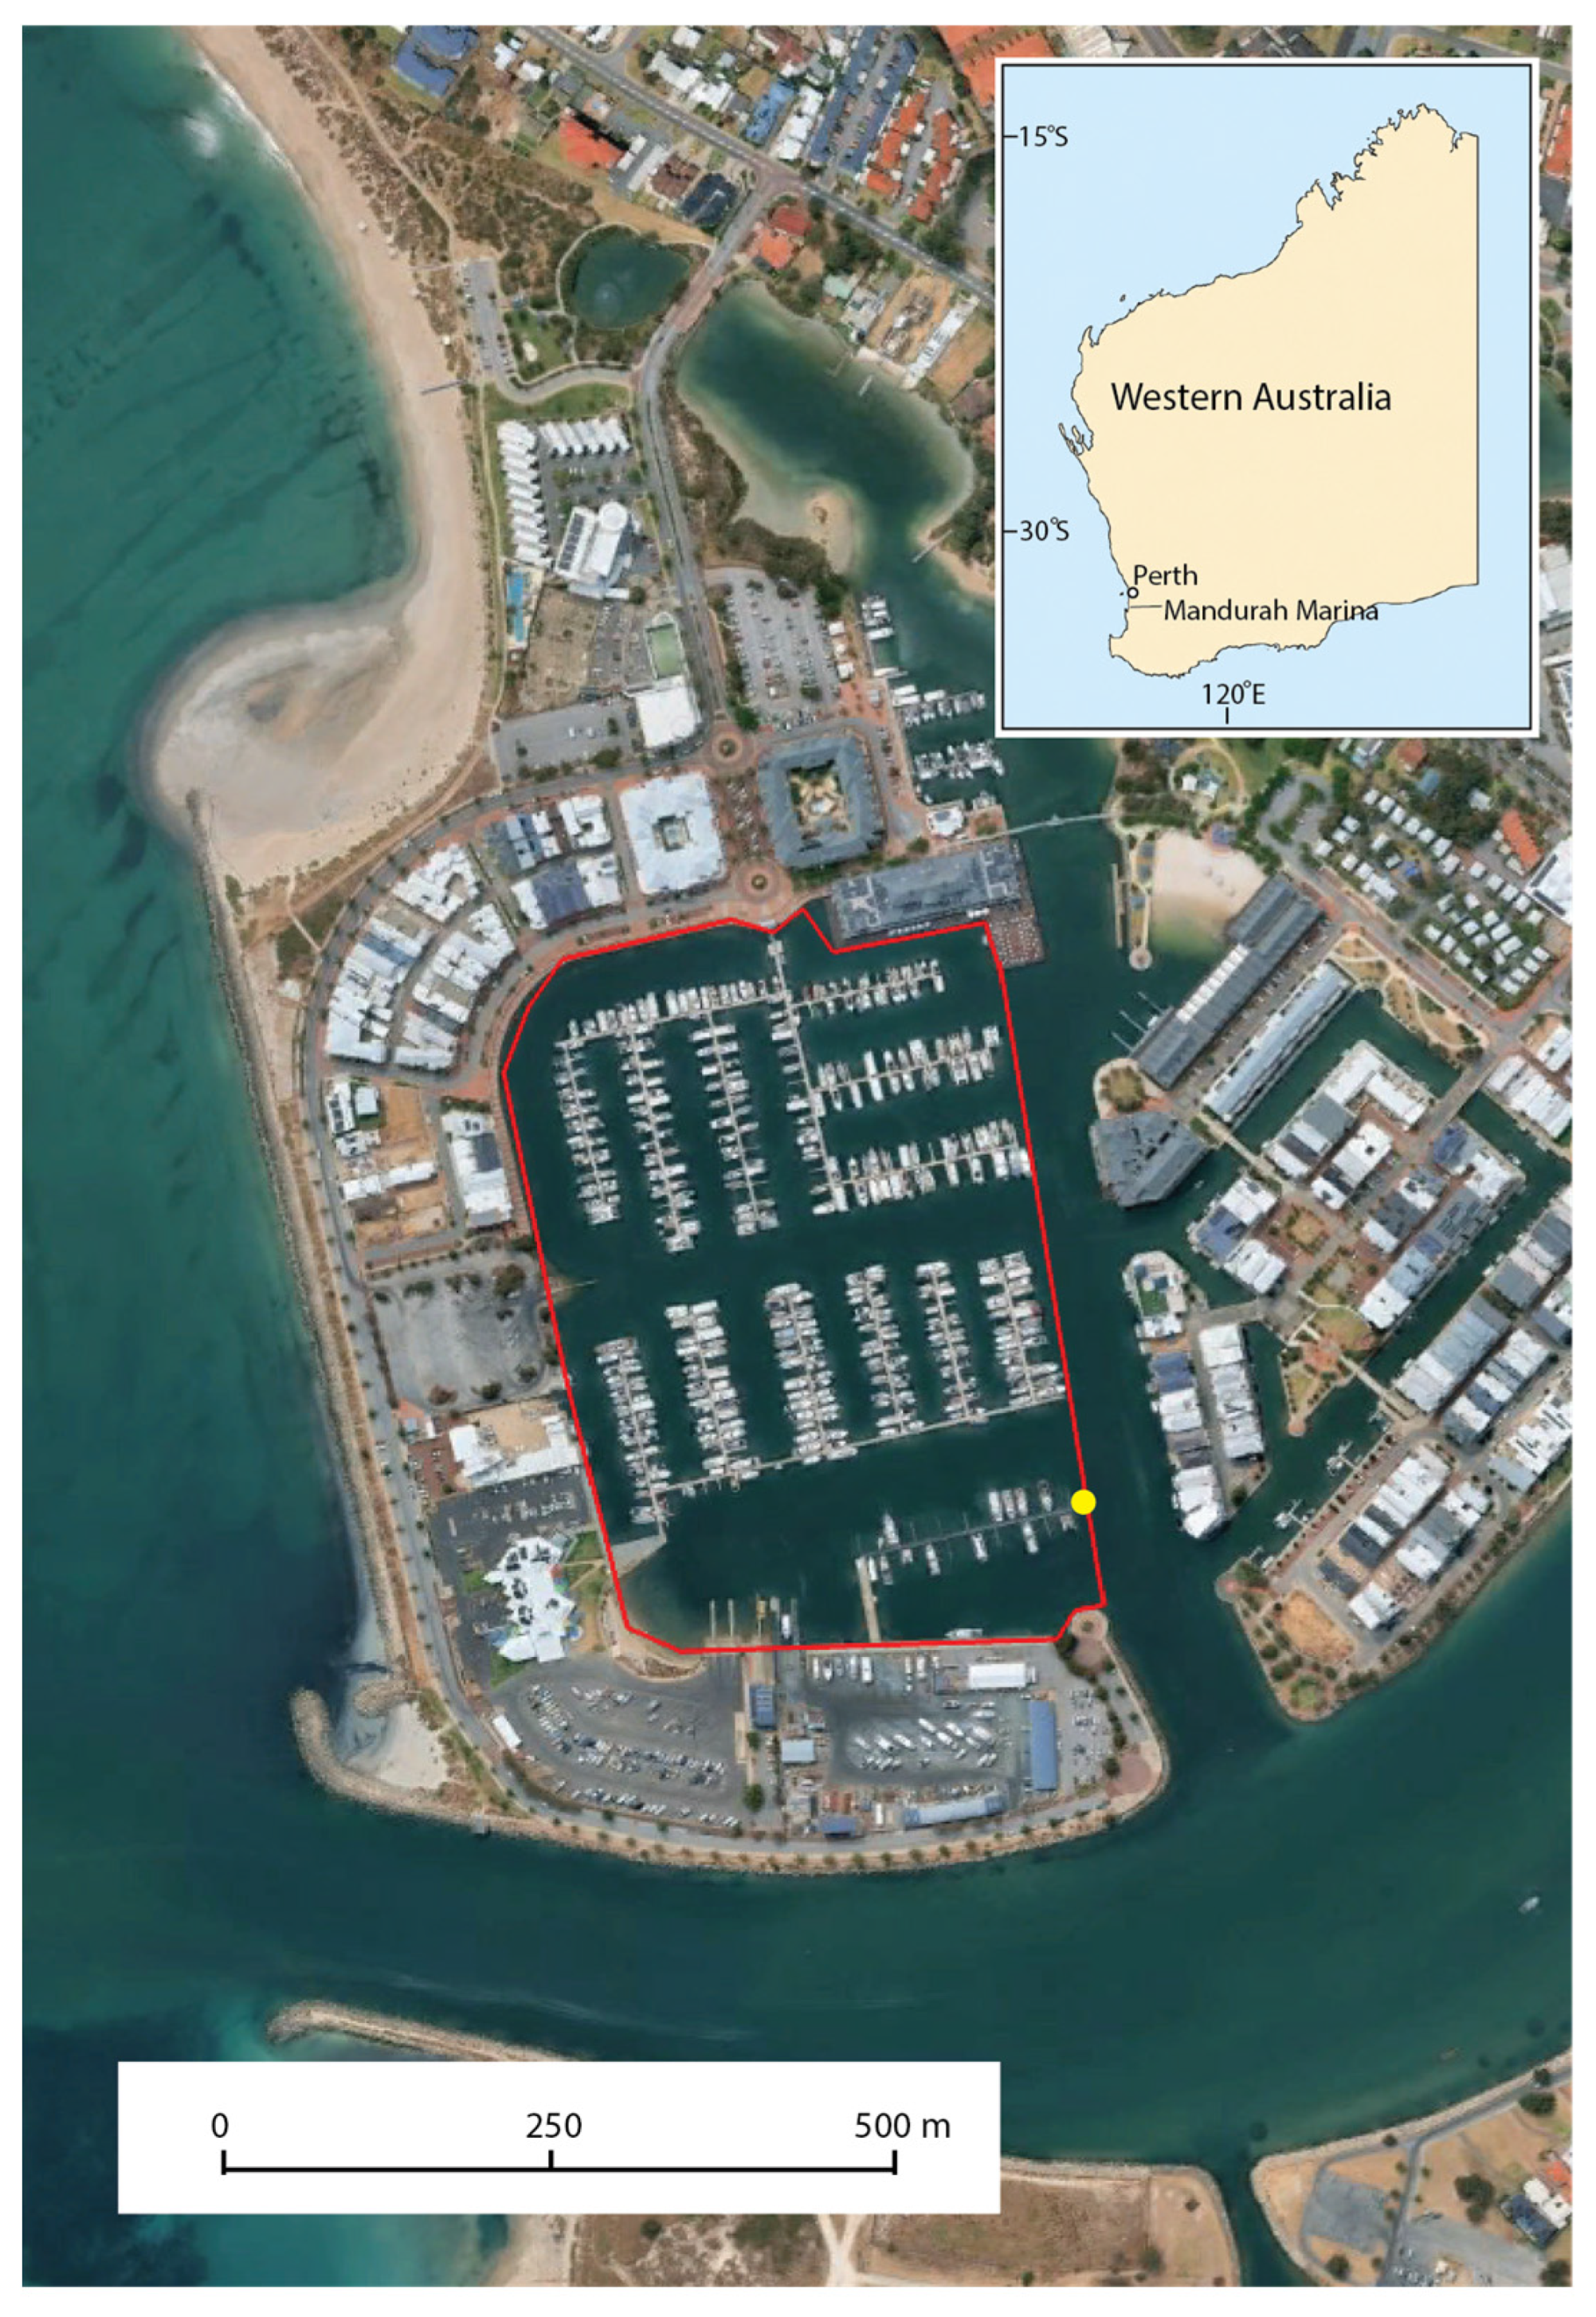
Figure 2.
Mean (black line) and 95% CI (grey line) of normalized valve gape for Mytilus galloprovincialis at the Mandurah Ocean Marina between July 2024 and June 2025. Red dashed line indicates the operational closure threshold (0.2). Gaps in data represent times when <3 mussels were considered active.
Figure 2.
Mean (black line) and 95% CI (grey line) of normalized valve gape for Mytilus galloprovincialis at the Mandurah Ocean Marina between July 2024 and June 2025. Red dashed line indicates the operational closure threshold (0.2). Gaps in data represent times when <3 mussels were considered active.
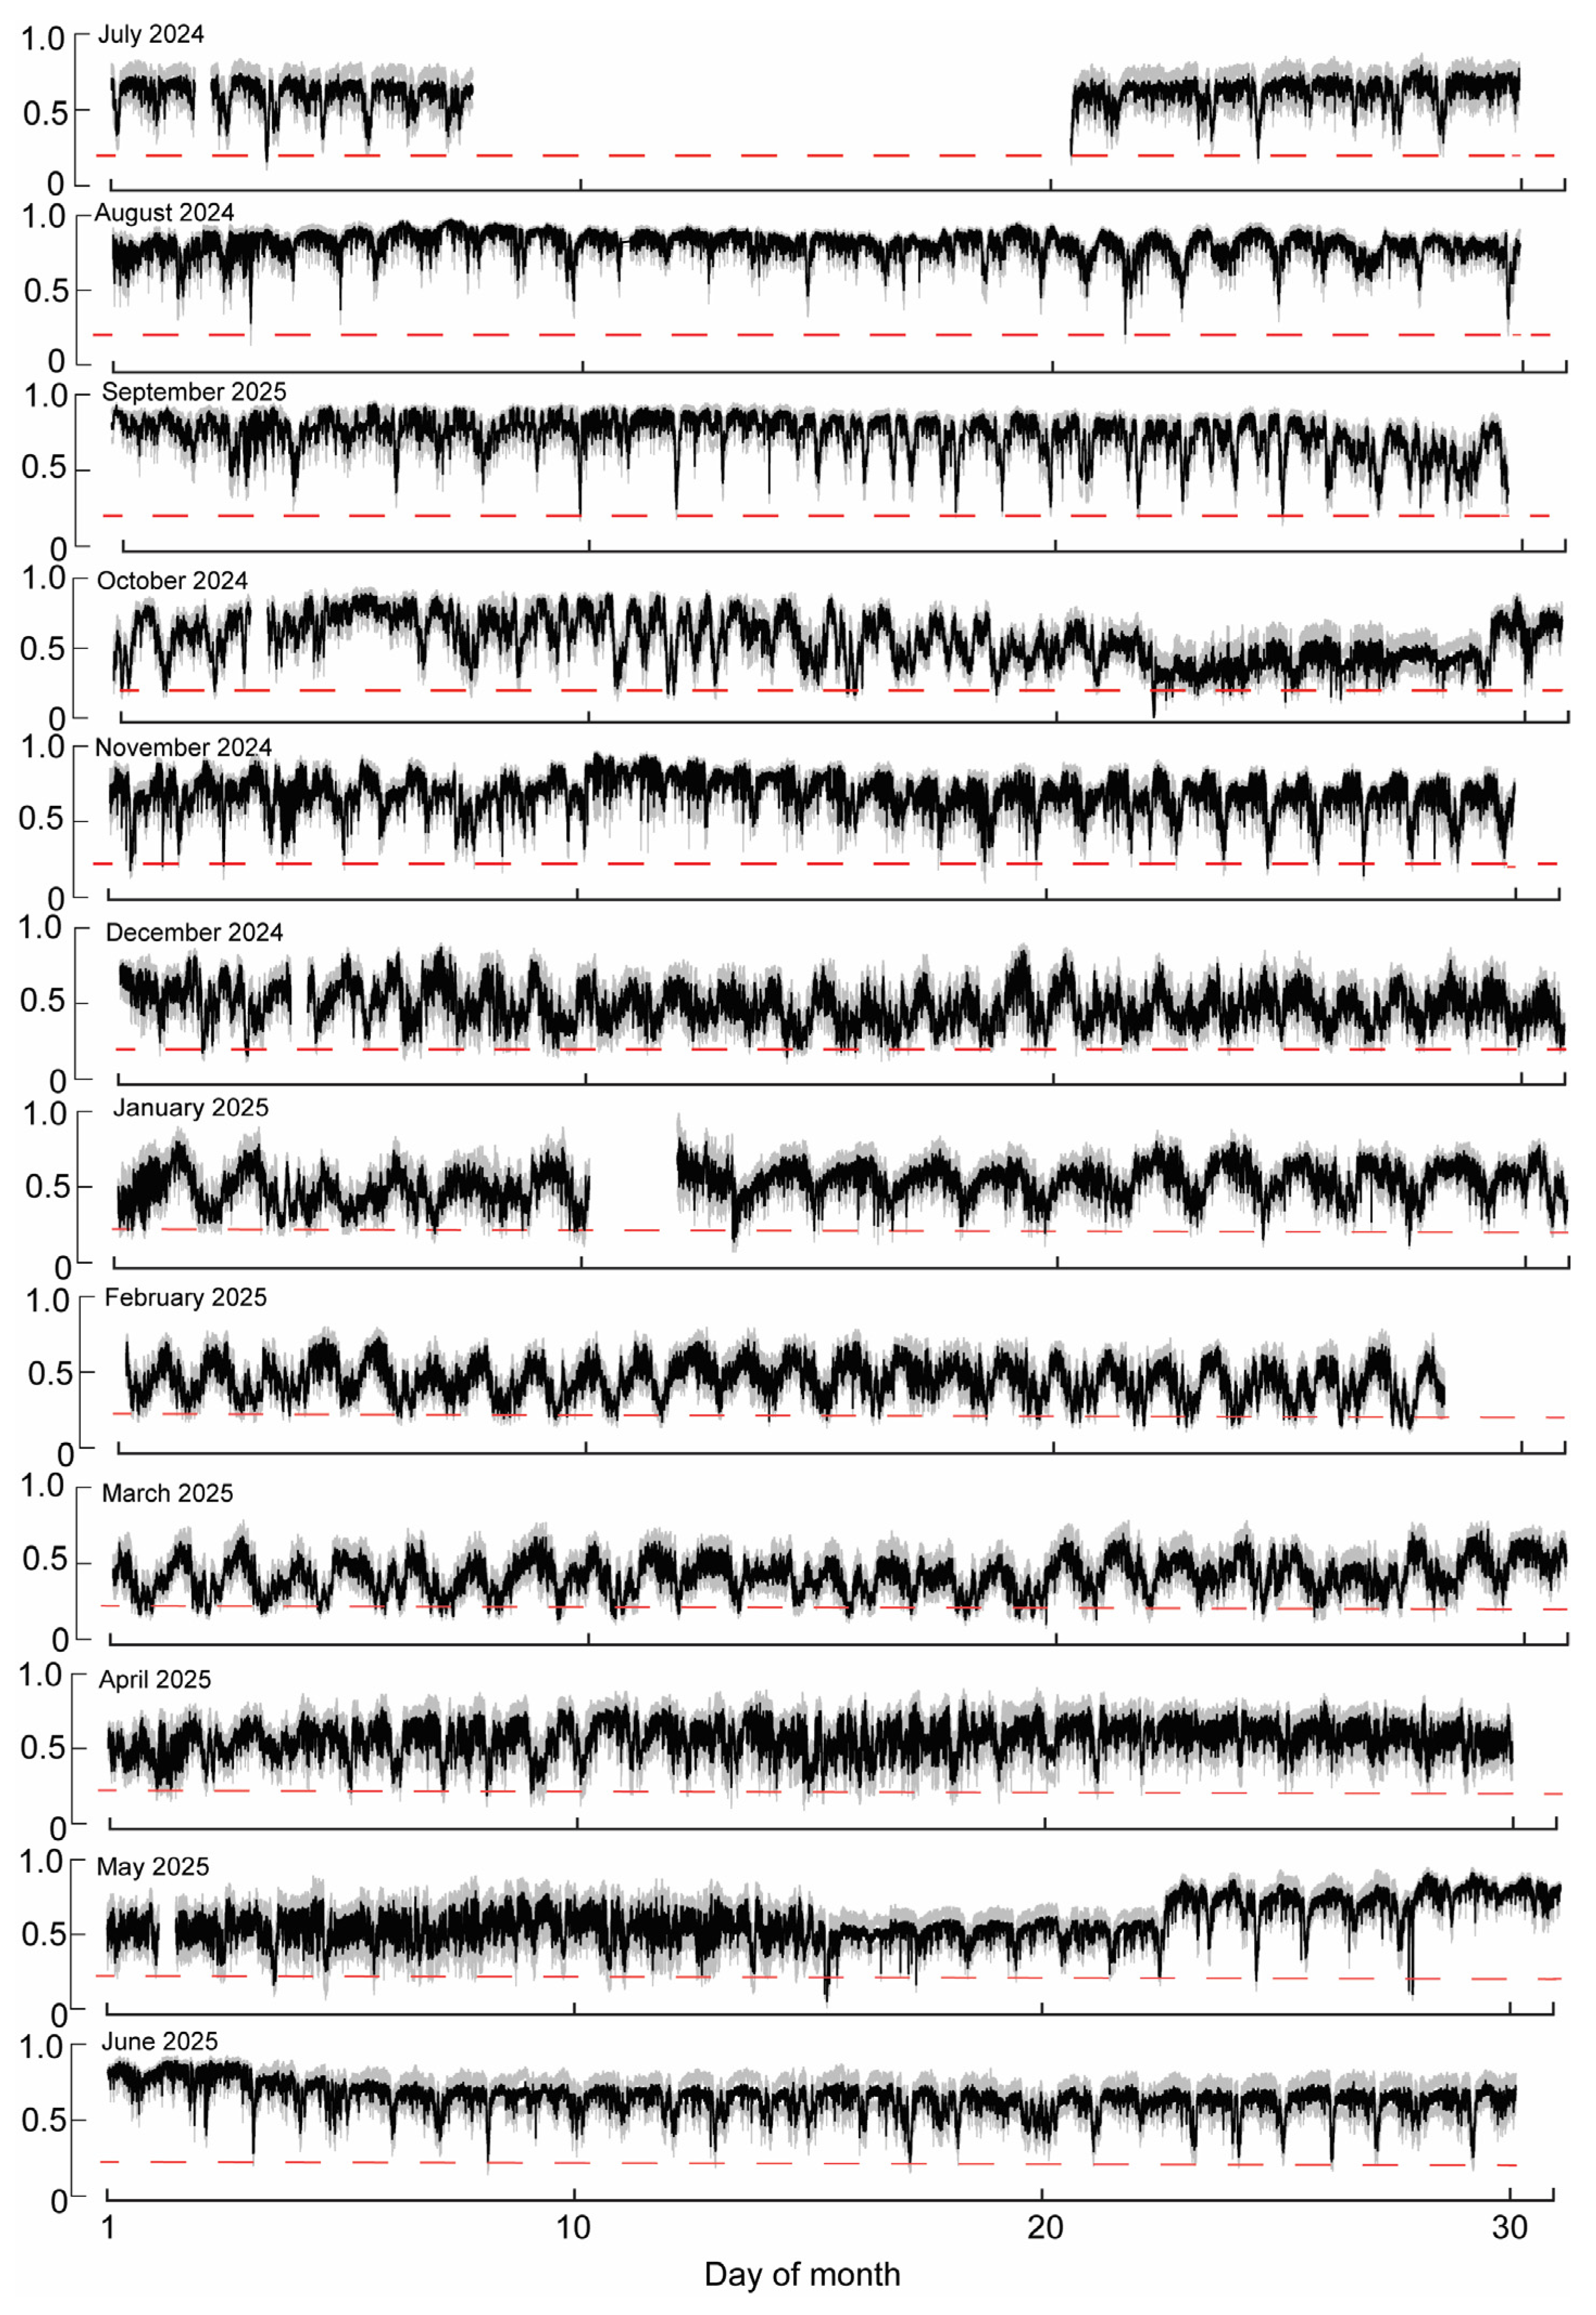
Figure 3.
Global wavelet spectra for individual mussels (M0–M7) across the 12-month monitoring period. Vertical dashed lines indicate 12 h and 24 h periodicities for visual reference. The preliminary consistency score (75.9%) represents the mean pairwise similarity among individual spectral profiles.
Figure 3.
Global wavelet spectra for individual mussels (M0–M7) across the 12-month monitoring period. Vertical dashed lines indicate 12 h and 24 h periodicities for visual reference. The preliminary consistency score (75.9%) represents the mean pairwise similarity among individual spectral profiles.
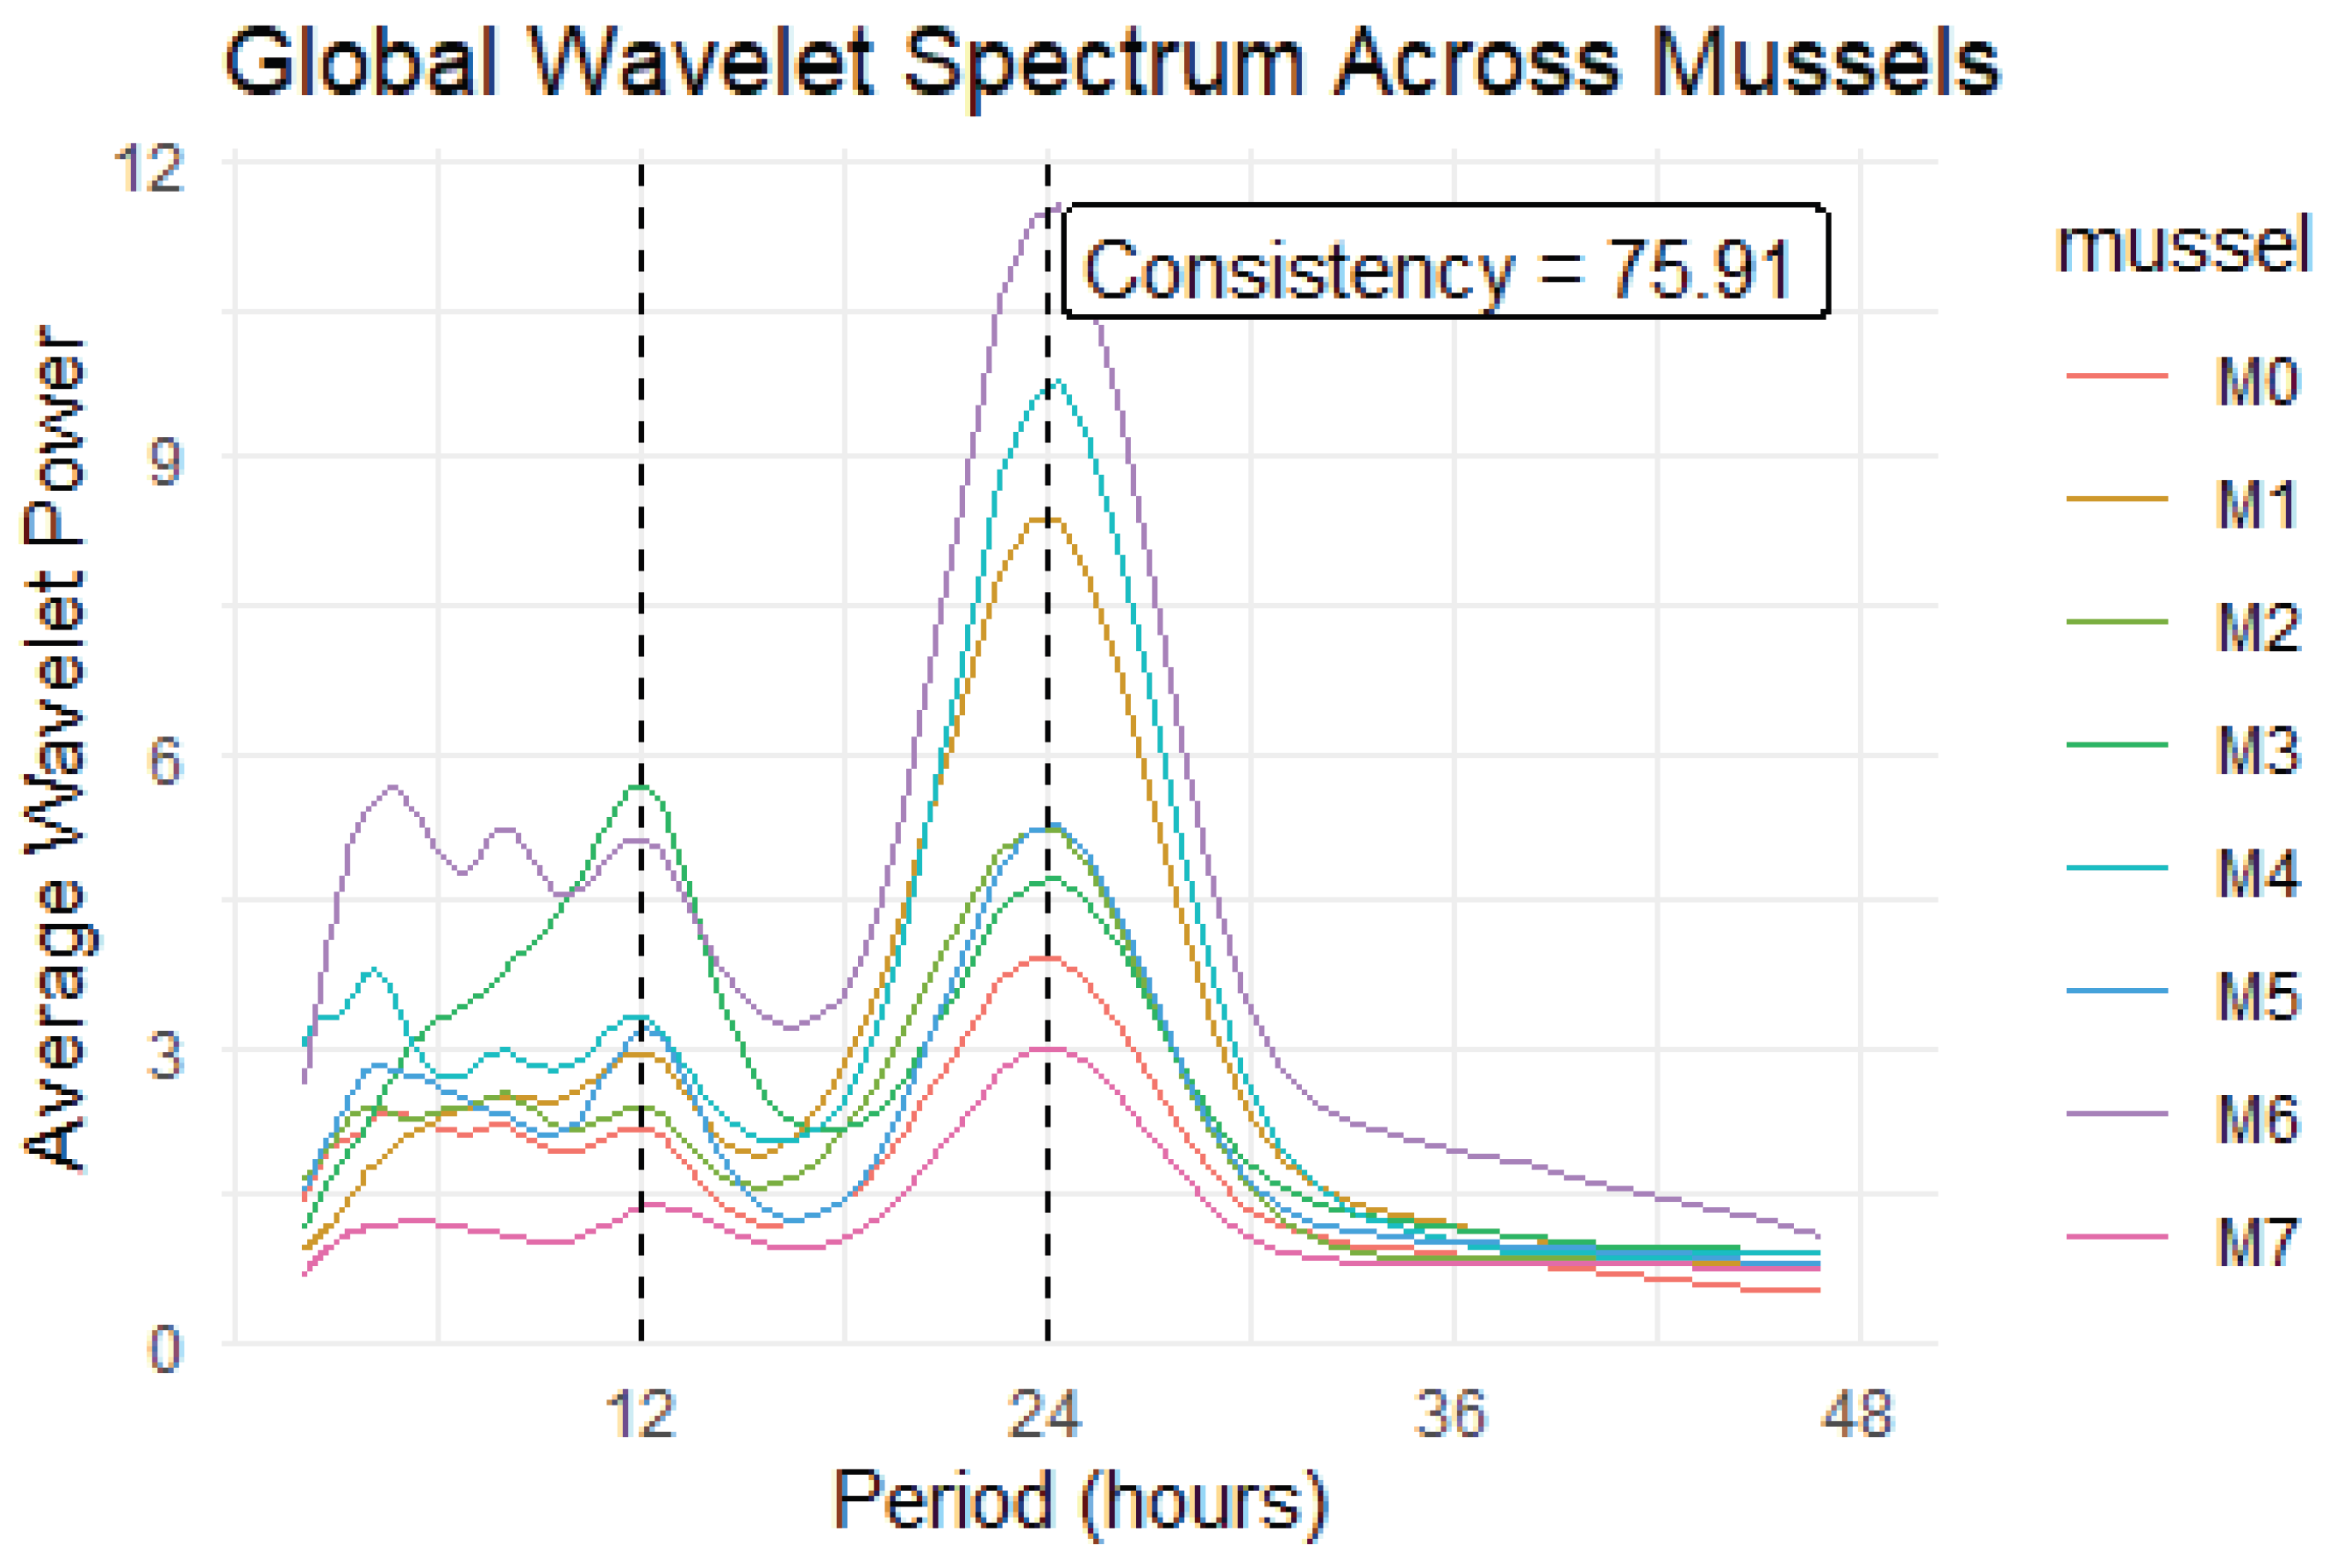

Table 1.
Proposed BioSentinel Health Index structure.
| Domain | Component | Score |
| Ecosystem Health (60) | Mean openness across valid station-level observations | 50 |
| Rhythm consistency among active mussels | 10 | |
| Monitoring and Data (20) | Data completeness: percentage of time with >=3 active mussels | 10 |
| Spatial sensor coverage across hydrodynamic settings | 10 | |
| Management and Response (20) | Documented alert thresholds and notification pathway | 5 |
| Trained event responders and clearly defined responsibilities | 5 | |
| Routine maintenance, quality assurance and animal-replacement procedures | 5 | |
| Transparency: publicly available outputs | 5 | |
| Total | 100 |
Scoring modifier: One point was deducted from the Ecosystem Health score for each validated coordinated closure event lasting longer than the specified five minute duration. Events attributed to scheduled maintenance, handling, sensor malfunction or another verified non-environmental cause were excluded. The Ecosystem Health score was constrained to a maximum of 60 points and a minimum of 0 points.
Disclaimer/Publisher’s Note: The statements, opinions and data contained in all publications are solely those of the individual author(s) and contributor(s) and not of MDPI and/or the editor(s). MDPI and/or the editor(s) disclaim responsibility for any injury to people or property resulting from any ideas, methods, instructions or products referred to in the content. |
© 2026 by the authors. Licensee MDPI, Basel, Switzerland. This article is an open access article distributed under the terms and conditions of the Creative Commons Attribution (CC BY) license (http://creativecommons.org/licenses/by/4.0/).
Copyright: This open access article is published under a Creative Commons CC BY 4.0 license, which permit the free download, distribution, and reuse, provided that the author and preprint are cited in any reuse.


