

Submitted:
30 July 2026
Posted:
31 July 2026
You are already at the latest version
Abstract
The belief that some foods taste better the next day is widespread, but it remains unclear whether overnight storage and reheating produce perceptible sensory differences when explicit freshness information is removed. This study compared sensory responses to fresh and day-old versions of four commonly cited foods: beef lasagne, butter chicken, dhal and apple crumble. Day-old samples were prepared 24 h earlier, refrigerated, reheated and served alongside freshly prepared samples under blinded conditions. Sixty-five participants completed two sensory sessions involving samedifferent, paired preference and liking tests. Statistical analyses accounted for repeated responses within participants. Dhal, butter chicken and apple crumble were discriminated in the same-different analysis, whereas beef lasagne did not reach significance after correction for repeated participant responses. However, discrimination did not consistently translate into preference or liking. Butter chicken was the only food for which the day-old sample was statistically preferred. Liking ratings differed among food types, with apple crumble rated highest overall, but there was no evidence of fresh versus day-old liking differences within foods. These findings show that the next-day effect is modest, food-specific and dependent on the sensory outcome measured. The study contributes controlled sensory evidence to a common culinary belief by distinguishing perceptible difference, preference and hedonic liking across everyday food matrices.
Keywords:
sensory evaluation
; consumer preference
; liking
; leftovers
; day-old foods
; food perception
; expectation
; paired preference
; same-different test
; food matrix
1. Introduction
Few culinary beliefs are as persistent as the idea that some foods taste better the next day [1,2]. This claim is frequently made for curries, stews, pasta bakes and other complex dishes, where flavour is said to develop, settle or become more integrated after overnight storage. Although the belief is familiar in domestic cooking and food writing, it has received limited attention in controlled sensory research. As a result it remains unclear whether next-day foods are perceptibly different from freshly prepared foods when evaluated under blinded conditions, and whether any perceptible difference is associated with preference or liking.
Food perception is shaped by more than the chemical composition of the food itself. Flavour perception arises from the integration of aroma, taste, texture, temperature, trigeminal sensations, visual cues, memory and eating context [3,4]. Expectations can also shape perceived quality, liking and willingness to consume foods, particularly when consumers have prior knowledge or contextual information before tasting [9]. In the context of next-day foods, consumers may bring a prior belief that certain dishes improve after storage. However, because expectation was not experimentally manipulated in the present study, the current design specifically evaluates sensory responses under blinded conditions rather than quantifying expectation effects.
Sensory difference, preference and liking are related but distinct outcomes. A discrimination test can show whether two samples are perceptibly different, but it does not indicate whether one is liked more or preferred. Paired preference testing provides a direct comparison between two samples, whereas hedonic liking ratings provide a scale-based measure of affective response. Previous sensory-methods research shows that acceptance, preference, choice and related consumer measures can lead to different conclusions depending on the question being asked [5,10]. This distinction is central to the present study because a food may change after storage without becoming more liked or preferred.
Overnight storage and reheating may alter cooked foods through multiple mechanisms, including volatile loss or retention, aroma-matrix interactions, lipid oxidation, starch retrogradation, moisture redistribution and texture change. Recent food chemistry literature emphasises that proteins, lipids, carbohydrates and other non-volatile matrix components can influence the retention and release of odorants, thereby affecting aroma perception [12]. In meat-containing foods, refrigerated storage and reheating can also promote warmed-over flavour, which is commonly linked to lipid oxidation and changes in aroma-active volatiles [14,15]. In starch-based foods, cooling and storage can promote retrogradation and water redistribution, which may influence texture and mouthfeel after reheating [13]. These mechanisms suggest that the next-day effect is likely to be food matrix specific rather than universal.
The novelty of the present study is that it brings a common culinary belief into a controlled sensory-science framework using blinded, repeated-measures testing across multiple everyday food matrices. Specifically, the study aimed to determine whether fresh and day-old versions of selected foods differ under blinded sensory conditions, and whether any perceptible differences are associated with preference or liking. A key strength of the design is the use of multiple complementary sensory methods. The same-different task assessed whether participants could detect a sensory difference between fresh and day-old samples, the paired-preference test determined whether any difference translated into directional choice, and the liking test measured the broader hedonic response to each sample. By separating discrimination, preference and hedonic liking, the study evaluates the “better the next day” belief as both a sensory and consumer-response question, rather than as an assumed culinary truth.
2. Materials and Methods
2.1. Study Design
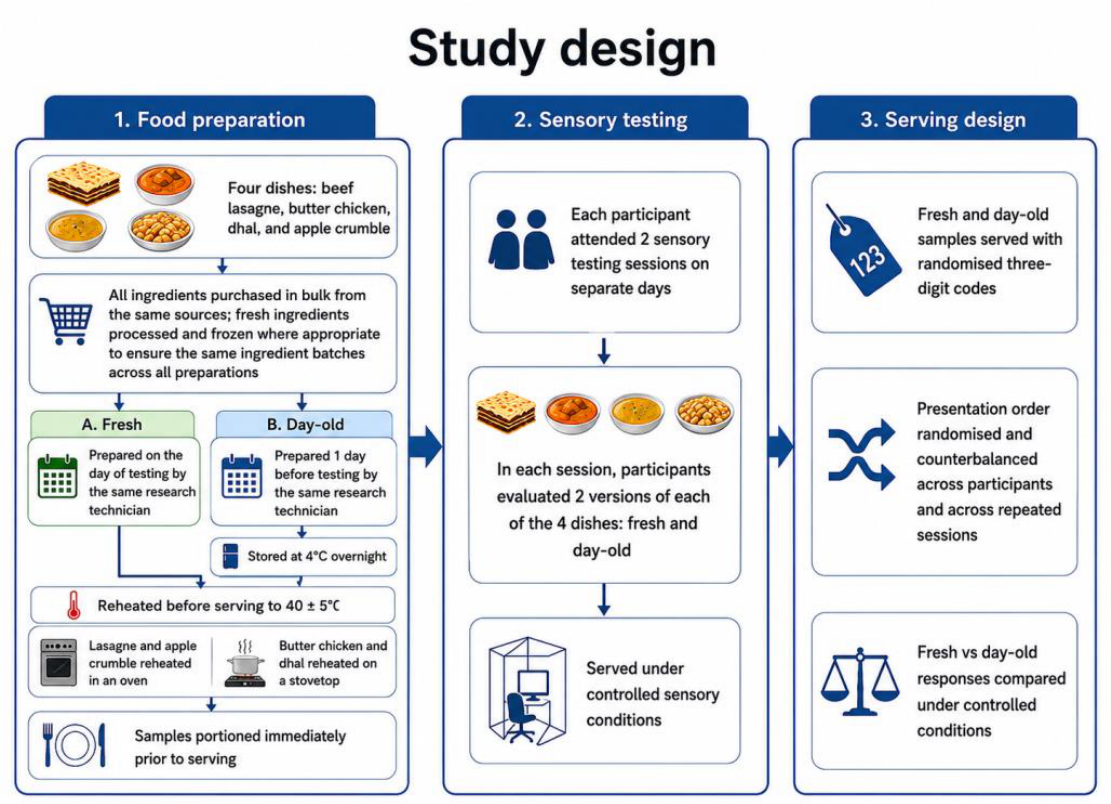
The study compared sensory responses to freshly prepared foods and matched foods prepared the previous day, stored under refrigeration, reheated and served under controlled conditions. Each participant attended two sensory testing sessions conducted on separate days. In each session, participants evaluated fresh and day-old versions of each of four dishes. Sensory testing was conducted in computerized, partitioned sensory booths at the Deakin Centre for Advanced Food Sciences, Deakin University, Melbourne, Australia, using Compusense Cloud software as part of the Compusense Academic Consortium (Compusense Inc., Ontario, Canada). All samples were identified using randomized three-digit codes. Filtered deionized water was provided as an oral rinse, and participants were instructed to rinse for approximately 5 s before commencing each task and between sample sets.
Figure 1.
Study design for sensory evaluation of fresh and day-old foods. Four foods, beef lasagne, butter chicken, dhal and apple crumble, were prepared as fresh and day-old samples using standardised ingredients and preparation methods. Day-old samples were stored at 4 °C overnight, reheated to 40 ± 5 °C and served under controlled sensory conditions. Participants attended two testing sessions and evaluated both versions of each food. Samples were presented with randomized three-digit codes, and serving order was randomized and counterbalanced across participants and sessions.
Figure 1.
Study design for sensory evaluation of fresh and day-old foods. Four foods, beef lasagne, butter chicken, dhal and apple crumble, were prepared as fresh and day-old samples using standardised ingredients and preparation methods. Day-old samples were stored at 4 °C overnight, reheated to 40 ± 5 °C and served under controlled sensory conditions. Participants attended two testing sessions and evaluated both versions of each food. Samples were presented with randomized three-digit codes, and serving order was randomized and counterbalanced across participants and sessions.
2.2. Participants
The final analysed sample comprised 65 participants recruited from communities surrounding Deakin University, Melbourne, Australia. The sample included 45 females (age 28 ± 4 years) and 20 males (age 26 ± 3 years). This sample size was considered appropriate for a controlled consumer sensory study because the design used within-participant comparisons and repeated sessions. Laboratory-based hedonic studies commonly use approximately 50–100 consumers when the aim is to compare products rather than conduct detailed consumer segmentation [8]. Participants were excluded if they were smokers, pregnant or lactating, taking prescription medication that could interfere with taste perception, affected by food allergies or intolerances relevant to the study foods, or vegetarian or vegan. Participants were instructed to refrain from eating, drinking anything other than room-temperature water, chewing gum or brushing their teeth for at least 1 h before testing. Written informed consent was obtained from all participants prior to participation, and participants received compensation for their time. The study was approved by the Deakin University Human Ethics Advisory Group (HEAG-H 2014-14).
2.3. Selection of Foods
The foods used in the main study were selected through a preliminary ranking exercise. In a separate pretest, 30 Deakin University staff and students who did not participate in the main sensory study were presented with a list of 25 foods and asked to rank the four foods they most strongly believed “taste better the next day”. The initial list was developed from internet searches investigating common culinary examples of foods typically discussed in relation to leftovers or next-day eating. Based on the ranking exercise and taking into account different food matrices, ingredient systems and product categories, the four highest-ranked foods were selected for the main study: beef lasagne, butter chicken, dhal and apple crumble. Recipes are provided in the Supplementary Materials.
2.4. Food Preparation and Serving
To promote consistency across preparations, ingredients were purchased in bulk from the same sources, and fresh ingredients were processed and frozen where appropriate so that test foods were prepared from the same ingredient batches. Each food was prepared twice by the same research technician: once on the day of testing (fresh) and once on the day before testing (day-old). After preparation, day-old samples were stored at 4 °C until reheating on the following day.
Before serving, all foods were reheated to a target serving temperature of 40 ± 5 °C. Beef lasagne and apple crumble were reheated in an oven, whereas butter chicken and dhal were reheated on a stovetop, consistent with their original preparation methods. Samples were portioned immediately before serving. Presentation order was randomized and counterbalanced across participants and repeated sessions.
2.5. Sensory Evaluation
Sensory testing comprised three tasks conducted in a fixed order: same-different discrimination, preference testing and liking testing. The full protocol was repeated in a second testing session on a separate day, so that each participant completed two assessments of each dish. The fixed task order was selected to prioritize discrimination and preference responses before monadic liking ratings.
For the same-different task, participants were presented sequentially with two coded 30 g samples of the same food and asked whether the samples were the same or different. Sample pairs represented combinations of fresh and day-old foods and could be actual-same pairs (fresh/fresh or day-old/day-old) or actual-different pairs (fresh/day-old or day-old/fresh). Participants were instructed to taste the sample on the left first, followed by the sample on the right. They were not required to consume the entire portion but were asked to taste enough of each sample to make their judgement.
After a 15 min break, participants completed the preference test. For each food, they were presented with two coded 50 g samples, one fresh and one day-old, and were asked to taste both samples before indicating which they preferred. Participants were allowed to consume as much or as little of each sample as needed, up to the full 50 g portion, and rinsed with deionized water between samples.
Following a second 15 min break, liking was assessed monadically. A new set of coded samples was presented one at a time in randomized order. Participants rated liking using the Labelled Hedonic Scale (LHS), a scale designed for hedonic measurement [7]. The numerical values extracted for analysis corresponded to the LHS ratings recorded in Compusense.
2.6. Statistical Analysis
Statistical analyses were conducted using Python (statsmodels and SciPy) and cross-checked against the exported sensory data. Statistical significance was set at p < 0.05. Because each participant completed two testing sessions, analyses accounted for repeated responses within participants rather than treating the two sessions as independent observations.
Same-different responses were analysed using generalized estimating equation (GEE) logistic regression with participant specified as the clustering variable. Participant response was coded as “different” or “same”, and actual pair type was coded as matched pairs (fresh-fresh or day-old/day-old) or non-matched pairs (fresh/day-old or day-old/fresh). The model tested whether participants were more likely to respond “different” when presented with actual non-matched pairs than matched pairs. Separate models were conducted for each food, and results are reported as odds ratios, 95% confidence intervals and p values. This modelling approach is consistent with the broader recommendation that discrimination data be analysed using methods that reflect the binary response structure and the paired nature of sensory discrimination tasks [11].
Preference data were analysed using GEE logistic regression to account for repeated responses from the same participant across sessions. Preference for the day-old sample was coded as 1 and preference for the fresh sample as 0. For each food, the estimated probability of preferring the day-old sample was compared with chance expectation of 0.50. Results are reported as the number and percentage of day-old preferences, estimated probabilities, 95% CI, OR versus chance and p values. As a conservative sensitivity analysis, participant-level response consistency across the two sessions was also examined using exact binomial/sign tests among participants who consistently preferred one sample across both sessions.
Liking ratings were analysed using repeated-measures analysis of variance with food, condition and session as within-participant factors. Food had four levels: dhal, beef lasagne, butter chicken and apple crumble. Condition had two levels: fresh and day-old. Session had two levels corresponding to the two testing visits. The food × condition interaction was used to determine whether the effect of overnight storage differed among foods. Within-food paired comparisons were used to assess whether liking differed between fresh and day-old samples. Overall food comparisons were conducted using participant-level food means with Holm adjustment for multiple comparisons. Absence of a statistically significant difference was interpreted as no evidence of a difference under the conditions tested, not as evidence of equivalence.
3. Results
3.1. Same-Different Discrimination
Same-different responses showed that participants were more likely to respond “different” to actual-different pairs than to actual-same pairs for dhal, butter chicken and apple crumble (Table 1; Figure 2). Dhal showed the strongest discrimination effect, with “different” responses occurring in 83.1% of actual-different trials compared with 55.4% of actual-same trials (OR = 3.96, 95% CI = 2.10–7.44, p < 0.001). Butter chicken was also discriminated (76.9% versus 58.5%; OR = 2.38, 95% CI = 1.27–4.45, p = 0.007), as was apple crumble (66.9% versus 52.3%; OR = 1.87, 95% CI = 1.03–3.37, p = 0.039). Beef lasagne did not reach significance after accounting for repeated responses (69.2% versus 57.7%; OR = 1.65, 95% CI = 0.94–2.91, p = 0.081). These results indicate that fresh and day-old versions of some foods were perceptibly distinguishable, but the discrimination effect was product dependent.
3.2. Preference for Day-Old Samples
Preference responses did not uniformly favour day-old samples (Table 2; Figure 3). Butter chicken was the only food for which the day-old sample was preferred above chance after accounting for repeated observations within participants. Day-old butter chicken was selected in 83 of 130 observations (63.8%), with a GEE-estimated day-old preference probability of 0.64 (95% CI = 0.56–0.71; OR = 1.77, 95% CI = 1.27–2.45; p < 0.001). Participant-level sensitivity analysis among consistent responders supported this result: 24 participants preferred day-old butter chicken in both sessions, 6 preferred fresh butter chicken in both sessions and 35 were split across sessions (p = 0.001 among consistent responders).
For the remaining foods, no statistically significant preference for day-old samples was detected. Day-old dhal was selected in 55 of 130 observations (42.3%; p = 0.084), beef lasagne in 64 of 130 observations (49.2%; p = 0.876) and apple crumble in 66 of 130 observations (50.8%; p = 0.862). Thus, the preference data provide evidence for a positive day-old effect for butter chicken only, rather than a general preference for day-old foods.
3.3. Liking Ratings
Liking ratings showed a significant main effect of food, but no main effect of condition and no food × condition interaction (Table 3 and Table 4; Figure 4). The main effect of food indicated that liking differed among dishes (F(3,192) = 9.34, p < 0.001). In contrast, the fresh versus day-old condition effect was not significant (F(1,64) = 1.34, p = 0.251), and the food × condition interaction was not significant (F(3,192) = 0.62, p = 0.605). Session did not reach significance as a main effect (F(1,64) = 2.86, p = 0.096), although there was a food × session interaction (F(3,192) = 6.51, p < 0.001).
Within-food comparisons found no evidence of fresh versus day-old differences in liking. Mean liking increased numerically from fresh to day-old for dhal (17.75 ± 1.72 to 19.25 ± 1.57; p = 0.322) and butter chicken (21.02 ± 1.55 to 22.88 ± 1.72; p = 0.082), changed little for apple crumble (28.00 ± 1.51 to 28.22 ± 1.51; p = 0.820), and decreased numerically for beef lasagne (21.12 ± 1.61 to 20.65 ± 1.65; p = 0.796). These non-significant results should not be interpreted as equivalence, but rather as no evidence of a liking difference under the conditions tested.
Apple crumble was liked more than the savoury foods overall. Holm-adjusted participant-level comparisons showed that apple crumble had higher mean liking than dhal (mean difference = 9.61, p < 0.001), beef lasagne (mean difference = 7.23, p = 0.002) and butter chicken (mean difference = 6.16, p = 0.045). Dhal, beef lasagne and butter chicken did not differ significantly from one another after adjustment.
4. Discussion
This study examined a familiar culinary belief using blinded sensory methods and participant-adjusted statistics. Overall, overnight storage and reheating produced detectable sensory change in some, but not all, foods, and perceptible difference did not necessarily translate into greater liking or preference. The clearest affective effect was observed for butter chicken, where the day-old sample was preferred. In contrast, the other foods either showed sensory discrimination without a corresponding preference shift, or no clear evidence of improved consumer response. These findings refine the common claim that foods taste better the next day: under blinded conditions, the effect was modest and food-specific.
The pattern of results also indicates that the next-day effect cannot be attributed simply to broad categories such as meat dishes, curries or savoury foods. Butter chicken and beef lasagne both contained meat, but only butter chicken showed a supported day-old preference. Likewise, butter chicken and dhal were both curry-style dishes, yet the lentil-based dhal did not reproduce the same preference effect. This suggests that the next-day response depends on the specific food matrix rather than on a single defining feature. Ingredient interactions, fat content, spice composition, protein or legume structure, starch behaviour, sauce consistency, moisture redistribution and reheating response may all contribute to how storage alters sensory balance. The next-day effect should therefore be understood as a product-specific sensory outcome rather than a general property of meat-based, curry-style or savoury foods.
This matrix-specific interpretation is consistent with literature showing that aroma perception depends not only on volatile composition but also on interactions between odorants and non-volatile food components. Proteins, lipids, carbohydrates and polyphenols can influence the retention, partitioning and release of odorants, which in turn can alter perceived aroma quality and intensity [12]. A sauce rich dish such as butter chicken may therefore respond differently to overnight storage and reheating than a structured product such as lasagne or a lentil-based dhal. In butter chicken, fat, spice derived volatiles and protein may interact in ways that modify aroma release or sensory balance after storage. However, these mechanisms remain plausible explanations rather than demonstrated causes because the present study did not include volatile, texture or descriptive sensory profiling.
The contrast between butter chicken and beef lasagne is important because meat-containing foods may undergo changes during refrigerated storage and reheating that are not necessarily positive. Warmed-over flavour in cooked meat, poultry and fish has long been associated with lipid oxidation and the formation of secondary volatile compounds during storage and reheating [15]. Recent work using gas chromatography-olfactometry-mass spectrometry in reheated precooked pork identified aroma-active compounds such as 1-octen-3-ol, (Z)-2-octenal and (E,E)-2,4-decadienal as contributors to warmed-over flavour [14]. The absence of a day-old preference for beef lasagne is therefore consistent with the possibility that storage and reheating may generate both desirable and undesirable sensory changes. The butter chicken result suggests that a meat-containing dish can be preferred after overnight storage, but only in a matrix where sauce, spice and fat may offset, mask or rebalance less desirable reheating-related effects.
Starch-containing components may also contribute to product-specific responses. Cooling and storage can promote starch retrogradation and water redistribution in cooked starch systems, including pasta and rice [13]. These changes may affect firmness, cohesion, moisture perception and the integration of sauce and solid components after reheating. Such effects may be relevant to lasagne, where pasta sheets, meat sauce and cheese form a structured matrix, and to apple crumble, where fruit, sugar, starch and baked topping components respond differently to storage. The higher liking for apple crumble overall may reflect sweetness, familiarity, food category, or individual product preferences rather than a storage-related effect.
A key methodological contribution of this study is the combined use of discrimination, preference and liking tests to examine the next-day food effect from complementary sensory perspectives. These methods answer different questions and when interpreted together provide a more robust conclusion than any single test alone. Same-different testing determined whether participants could detect a perceptible sensory difference between fresh and day-old samples, but it did not indicate whether that difference was positive, negative or affectively neutral. The paired-preference test then provided a direct measure of directional choice between fresh and day-old samples, identifying whether participants favoured one version over the other when the two were compared side by side. In contrast, the liking test measured the broader hedonic response to each sample presented individually, providing information on overall acceptance rather than forced choice. The value of this combined approach is evident in the present results. If the study had relied only on discrimination testing, the conclusion would have been that several foods changed after overnight storage, but this would not establish that they were preferred. If the study had relied only on preference testing, the butter chicken result may have suggested a stronger next-day effect, but without showing whether this preference was accompanied by a meaningful difference in overall liking. Conversely, the liking ratings alone would have suggested little evidence of fresh versus day-old differences within foods, potentially overlooking the directional preference observed for butter chicken. Considered together, the three methods show that perceptible sensory change, preference and liking do not necessarily align, however, they provide complementary evidence that strengthens the overall conclusion.
This pattern is consistent with sensory-methods literature showing that liking, preference, choice and related consumer measures capture overlapping but non-identical dimensions of response [5,10]. Hein et al. demonstrated that different acceptance and preference methods can lead to related but not identical conclusions, while Wichchukit and O’Mahony highlighted that liking, choosing, buying and takeaway preference tests reflect different aspects of consumer decision making [5,10]. Lim also notes that hedonic scaling provides a useful measure of affective response, but ratings can be influenced by individual scale use, context and response variability [7]. Therefore, the absence of significant fresh versus day-old differences in liking should not be interpreted as equivalence. Rather, it indicates that the present study found no statistical evidence that overnight storage changed hedonic liking under the conditions tested, while the preference and discrimination data provide additional information about perceptible difference and directional choice. This methodological combination strengthens the interpretation that the next-day effect is modest, food specific and dependent on the sensory outcome being measured.
These findings appear to support the importance of expectation [9]. The belief that food tastes better the next day is culturally familiar and may bias perception when consumers know that a food has been stored. In the present study, samples were served under blinded conditions to reduce this expectation effect and separate perceptual response from culinary folklore. Under these conditions, the next-day effect was present but modest. Once blinding is removed in real life eating contexts, expectation may amplify the experience, making the belief that food tastes better the next day more powerful than the sensory differences alone. Thus, the food tastes better the next-day effect should be understood as a food-specific sensory phenomenon shaped by both measurable perceptual change and consumer expectation.
Several limitations should be considered. First, the study compared complex foods that differed in composition, structure, sweetness and cooking method. Therefore, differences among foods cannot be attributed to a single matrix characteristic. Second, task order was fixed, with same-different testing followed by preference and then liking. This may have introduced exposure, adaptation or fatigue effects before liking ratings. Third, the study did not assess baseline liking, familiarity, consumption frequency, hunger, satiety or participants’ prior beliefs about which foods improve overnight. These variables may influence consumer responses.
Despite these limitations, the study makes a novel contribution by bringing a common culinary belief into a controlled sensory science framework. The results show that “better the next day” is not a single effect, but a combination of at least three separable outcomes: perceptible sensory difference, directional preference and hedonic liking. By showing that these outcomes do not always align, the study provides a more precise basis for discussing leftover foods, meal preparation, food quality after storage and consumer perception of reheated dishes. The results also identify clear directions for future work combining blinded and expectation-informed sensory testing with flavour chemistry, texture analysis and matrix-specific storage studies.
5. Conclusions
Overnight storage and reheating produced detectable sensory differences for some foods, but the effect was not universal and did not consistently improve consumer response. Day-old butter chicken was preferred above chance, whereas dhal, beef lasagne and apple crumble showed no reliable day-old preference. Liking ratings differed among food types, with apple crumble liked most overall, but provided no evidence that day-old samples differed in liking from fresh samples within any food. These findings suggest that the next-day effect is best understood as a modest, food specific sensory phenomenon rather than a general rule.
Supplementary Materials
The following supporting information can be downloaded at the website of this paper posted on Preprints.org.
Author Contributions
Conceptualization, R.K.; methodology, R.K., S.L., U.W., D.A.D., G.L. and L.R.; investigation, S.L. and U.W.; formal analysis, R.K.; data curation, R.K. and S.L.; writing—original draft preparation, R.K.; writing—review and editing, R.K., D.S., U.W., S.L., D.A.D., G.L. and L.R.; supervision, R.K., D.A.D., G.L. and L.R.; project administration, R.K. All authors have read and agreed to the published version of the manuscript.
Funding
This research received no external funding.
Institutional Review Board Statement
The study was conducted in accordance with the Declaration of Helsinki and approved by the Deakin University Human Ethics Advisory Group (HEAG-H 2014-14, 2014-01-04).
Informed Consent Statement
Informed consent was obtained from all participants involved in the study.
Data Availability Statement
The data supporting the findings of this study are available from the corresponding author upon reasonable request.
Generative AI Statement
Generative AI tools, including ChatGPT, were used to assist with language editing, structure, clarity and drafting of selected manuscript text. All AI-assisted content was reviewed, edited and verified by the authors, who take full responsibility for the final manuscript.
Conflicts of Interest
The authors declare no conflicts of interest.
References
- Crosby, G. Why Does Flavour Improve Overnight? Cook’s Illustrated, 2017. Available online: https://www.cooksillustrated.com/features/8242-easiest-way-to-improve-the-flavor-of-soups-and-stews (accessed on [insert date]).
- Lopez-Alt, J. The Science of Stew: Does Stew Get Better with Age? Serious Eats, 2016. Available online: https://www.seriouseats.com/2016/02/science-of-stew-does-stew-get-better-with-age.html (accessed on [insert date]).
- Cardello, A.V.; Bell, R.; Kramer, F.M. Predictors of food acceptance, consumption and satisfaction in specific eating situations. Food Quality and Preference 2000, 11, 201–216. [CrossRef]
- Spence, C. Multisensory flavor perception. Cell 2015, 161, 24–35. [CrossRef]
- Hein, K.A.; Jaeger, S.R.; Carr, B.T.; Delahunty, C.M. Comparison of five common acceptance and preference methods. Food Quality and Preference 2008, 19, 651–661. [CrossRef]
- Köster, E.P.; Couronne, T.; Léon, F.; Lévy, C.; Marcelino, A.S. Repeatability in hedonic sensory measurement: A conceptual exploration. Food Quality and Preference 2003, 14, 165–176. [CrossRef]
- Lim, J. Hedonic scaling: A review of methods and theory. Food Quality and Preference 2011, 22, 733–747. [CrossRef]
- Mammasse, N.; Schlich, P. Adequate number of consumers in a liking test. Insights from resampling in seven studies. Food Quality and Preference 2014, 31, 124–128. [CrossRef]
- Piqueras-Fiszman, B.; Spence, C. Sensory expectations based on product-extrinsic food cues: An interdisciplinary review of the empirical evidence and theoretical accounts. Food Quality and Preference 2015, 40, 165–179. [CrossRef]
- Wichchukit, S.; O’Mahony, M. ‘Liking’, ‘buying’, ‘choosing’ and ‘take away’ preference tests for varying degrees of hedonic disparity. Food Quality and Preference 2011, 22, 60–65. [CrossRef]
- Brockhoff, P.B.; Christensen, R.H.B. Thurstonian models for sensory discrimination tests as generalized linear models. Food Quality and Preference 2010, 21, 330–338. [CrossRef]
- Wang, D.; Wang, J.; Lang, Y.; Huang, M.; Hu, S.; Liu, H.; Sun, B.; Long, Y.; Wu, J.; Dong, W. Interactions between food matrices and odorants: A review. Food Chemistry 2025, 466, 142086. [CrossRef]
- Riva, M.; Fessas, D.; Schiraldi, A. Starch retrogradation in cooked pasta and rice. Cereal Chemistry 2000, 77, 433–438. [CrossRef]
- Zang, M.; Wang, L.; Zhang, Z.; Zhang, K.; Li, D.; Li, X.; Wang, S.; Chen, H. Changes in flavour compound profiles of precooked pork after reheating (warmed-over flavour) using gas chromatography–olfactometry–mass spectrometry with chromatographic feature extraction. International Journal of Food Science & Technology 2020, 55, 978–987. [CrossRef]
- Pearson, A.M.; Love, J.D.; Shorland, F.B. “Warmed-over” flavor in meat, poultry, and fish. Advances in Food Research 1977, 23, 1–74. [CrossRef]
Figure 2.
Same-different discrimination results. Points show odds ratios and 95% confidence intervals from participant-clustered GEE logistic models. Values greater than 1 indicate greater likelihood of a “different” response for actual-different pairs than for actual-same pairs.
Figure 2.
Same-different discrimination results. Points show odds ratios and 95% confidence intervals from participant-clustered GEE logistic models. Values greater than 1 indicate greater likelihood of a “different” response for actual-different pairs than for actual-same pairs.
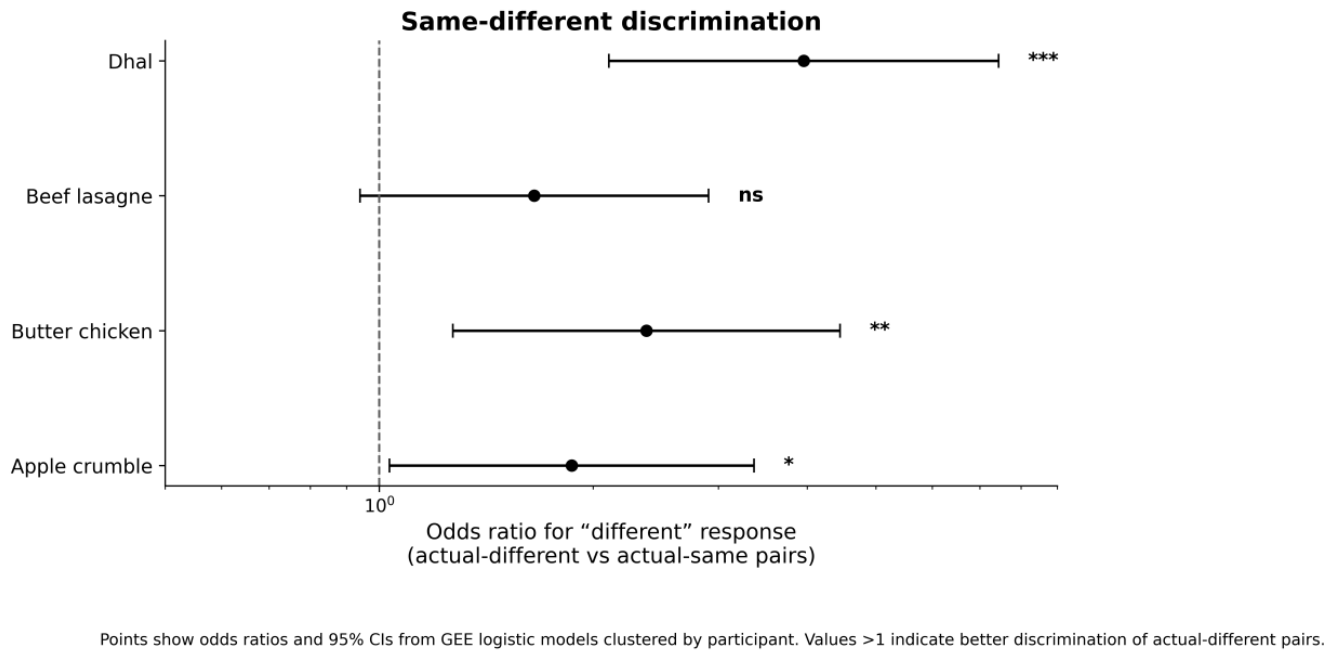
Figure 3.
Estimated preference for day-old samples. Bars show GEE-estimated probability and 95% confidence interval, with responses clustered by participant. The dashed line indicates 50% chance preference. Asterisks indicate comparison with 50% chance preference.
Figure 3.
Estimated preference for day-old samples. Bars show GEE-estimated probability and 95% confidence interval, with responses clustered by participant. The dashed line indicates 50% chance preference. Asterisks indicate comparison with 50% chance preference.
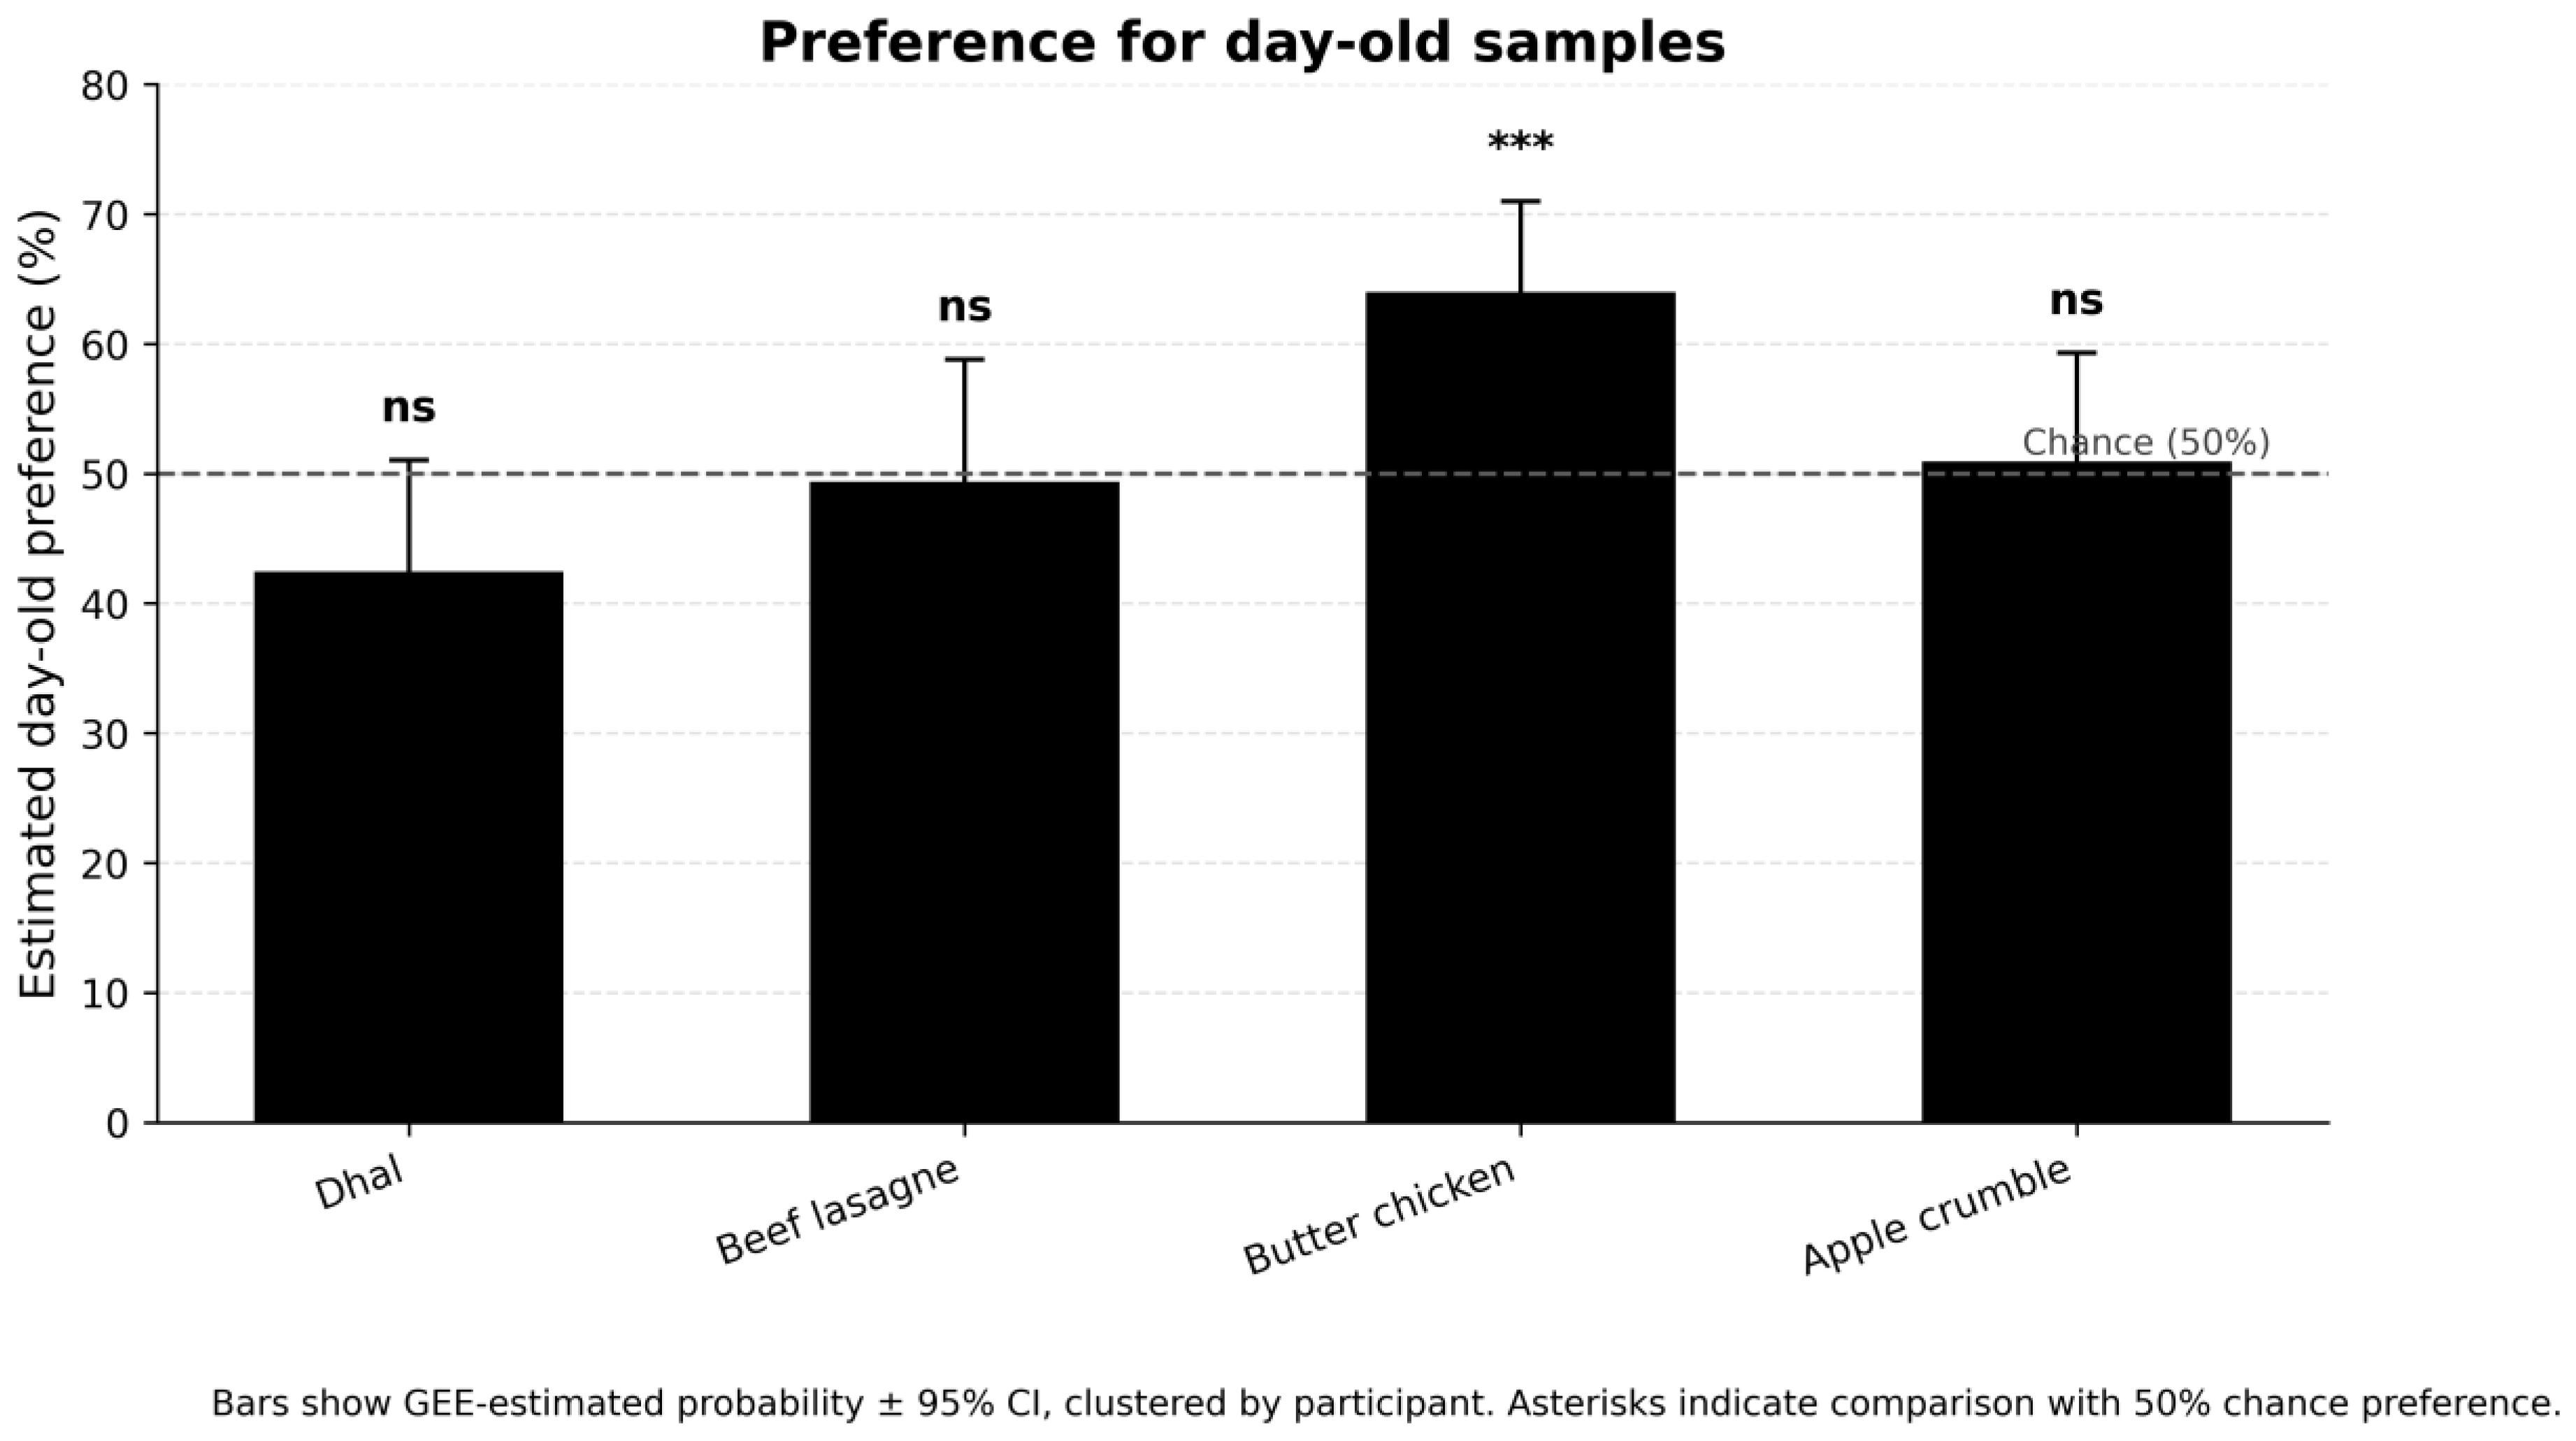
Figure 4.
Liking ratings for fresh and day-old foods. Bars show mean ± standard error. Different letters indicate significant differences among foods (p < 0.05); ns indicates no significant fresh versus day-old difference within food. Absence of a significant difference should not be interpreted as evidence of equivalence.
Figure 4.
Liking ratings for fresh and day-old foods. Bars show mean ± standard error. Different letters indicate significant differences among foods (p < 0.05); ns indicates no significant fresh versus day-old difference within food. Absence of a significant difference should not be interpreted as evidence of equivalence.
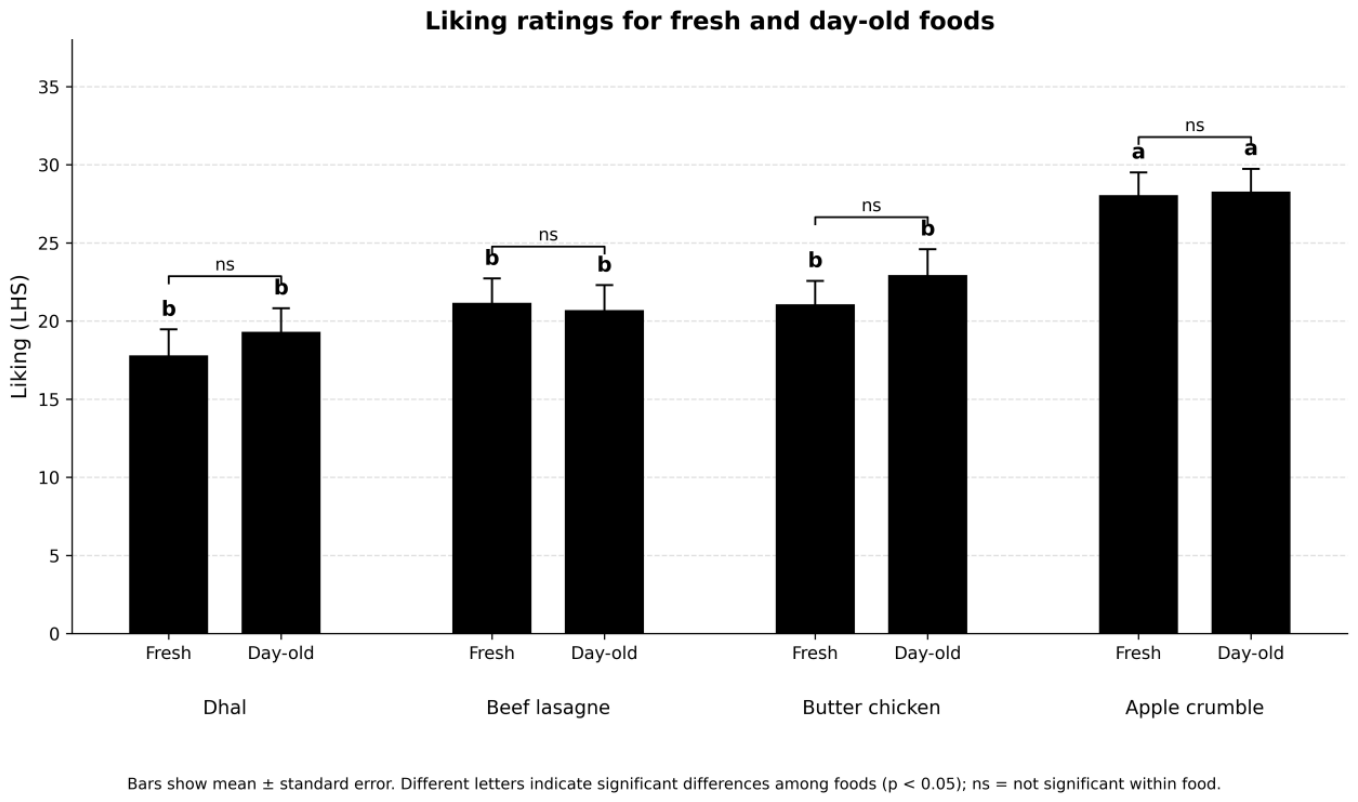

Table 1.
Same-different discrimination results from participant-clustered GEE logistic models.
| Food | Different response: actual-different | Different response: actual-same | OR (95% CI) | p |
|---|---|---|---|---|
| Dhal | 83.1% | 55.4% | 3.96 (2.10–7.44) | <0.001 |
| Beef lasagne | 69.2% | 57.7% | 1.65 (0.94–2.91) | 0.081 |
| Butter chicken | 76.9% | 58.5% | 2.38 (1.27–4.45) | 0.007 |
| Apple crumble | 66.9% | 52.3% | 1.87 (1.03–3.37) | 0.038 |
Table 2.
Preference for day-old samples from participant-clustered GEE logistic models.
| Food | Day-old preferred | Estimated probability (95% CI) | OR vs chance (95% CI) | p | Both day-old/Both fresh/Split |
|---|---|---|---|---|---|
| Dhal | 55/130 (42.3%) | 0.42 (0.34–0.51) | 0.73 (0.52–1.04) | 0.084 | 12/22/31 |
| Beef lasagne | 64/130 (49.2%) | 0.49 (0.40–0.59) | 0.97 (0.66–1.43) | 0.876 | 20/21/24 |
| Butter chicken | 83/130 (63.8%) | 0.64 (0.56–0.71) | 1.77 (1.27–2.45) | <0.001 | 24/6/35 |
| Apple crumble | 66/130 (50.8%) | 0.51 (0.42–0.59) | 1.03 (0.73–1.46) | 0.862 | 17/16/32 |
Table 3.
Liking ratings for fresh and day-old samples.
| Food | Fresh liking mean ± SE | Day-old liking mean ± SE | Mean difference (95% CI) | p |
|---|---|---|---|---|
| Dhal | 17.75 ± 1.72 | 19.25 ± 1.57 | 1.51 (-1.51–4.52) | 0.322 |
| Beef lasagne | 21.12 ± 1.61 | 20.65 ± 1.65 | -0.47 (-4.08–3.14) | 0.796 |
| Butter chicken | 21.02 ± 1.55 | 22.88 ± 1.72 | 1.86 (-0.24–3.96) | 0.082 |
| Apple crumble | 28.00 ± 1.51 | 28.22 ± 1.51 | 0.22 (-1.73–2.17) | 0.820 |
Table 4.
Repeated-measures ANOVA for liking ratings.
| Effect | Test statistic | p |
|---|---|---|
| Food | F(3,192) = 9.34 | <0.001 |
| Condition | F(1,64) = 1.34 | 0.251 |
| Session | F(1,64) = 2.86 | 0.096 |
| Food:Condition | F(3,192) = 0.62 | 0.605 |
| Food:Session | F(3,192) = 6.51 | <0.001 |
| Condition:Session | F(1,64) = 2.53 | 0.117 |
| Food:Condition:Session | F(3,192) = 2.15 | 0.095 |
Disclaimer/Publisher’s Note: The statements, opinions and data contained in all publications are solely those of the individual author(s) and contributor(s) and not of MDPI and/or the editor(s). MDPI and/or the editor(s) disclaim responsibility for any injury to people or property resulting from any ideas, methods, instructions or products referred to in the content. |
© 2026 by the authors. Licensee MDPI, Basel, Switzerland. This article is an open access article distributed under the terms and conditions of the Creative Commons Attribution (CC BY) license (http://creativecommons.org/licenses/by/4.0/).
Copyright: This open access article is published under a Creative Commons CC BY 4.0 license, which permit the free download, distribution, and reuse, provided that the author and preprint are cited in any reuse.