

Submitted:
29 July 2026
Posted:
31 July 2026
You are already at the latest version
Abstract
The article studies the problem of modeling the nonlinear characteristics of friction using digital twins for cutting process on metal-cutting machine tools. One of the important characteristics of a mathematical model for the cutting force response to the shaping movements of a cutting tool is the friction coefficient between a cutting tool’s flank wear land and the machined workpiece surface. The dependence of the friction coefficient on the temperature-velocity parameters during cutting is widely known, whereas the mathematical dependences within the general mathematical model for elastic-thermodynamic interaction during cutting, have not been determined yet. Therefore, the aim of the study is to create a mathematical model that would reveal the dependence of the friction coefficient between the cutting tool’s flank and the machined workpiece on the temperature of this interaction. To create a model, the authors relied on both the analysis of theoretical studies and the results of a full-scale experiment conducted to determine the actual value of the friction coefficient. By achieving the aim of the study, the authors have refined the general mathematical model for elastic-thermodynamic interaction occurring in the process of cutting on a lathe by taking into account the adhesive-diffusion nature of friction in the contact zone of the cutting tool’s flank and the machined workpiece. Furthermore, the general mathematical model has been validated based on the data obtained in a series of additional experiments using the modern STD.201.1 measuring bench.
Keywords:
digital twin
; cutting dynamics
; cutting temperature
; cutting force
; mathematical modeling
; shaping movements of the instrument
1. Introduction
The development of modern digital technologies, enables significant improvement of both the quality and productivity of metal parts’ manufacturing on the metal-cutting machine tools. This is mainly achieved by implementing the so-called “digital twin” technology [1]. Digital twin technology is based on the extensive use of both deterministic mathematical models and various algorithms based on machine learning and data analysis [2,3]. Most common algorithms used for prediction and recognition are the neural network algorithms [4]. However, the deterministic mathematical models also play a significant role here, due to the predictive capacity of digital twin technology. Today, prediction of cutting tool wearability and related residual strength of a cutting wedge is a particularly relevant objective being solved by means of digital twin technology. However, successful solution of this problem depends on the validity of cutting tool wear modeling, which implies modeling the mechanical and chemical processes ongoing in the tool-workpiece contact zone. In deterministic digital twin-based models, these mechanical and chemical processes are represented by the dependence of the friction coefficient on the temperature-velocity parameters of cutting [5,6]. Here, friction has the character of a nonlinear dependence with a clearly expressed region of a local minimum in contact temperature [7,8,9]. It is the local minimum that ensures optimal conditions for metal cutting on metal-cutting machine tools [10]. Here, optimal conditions are understood as that ensuring maximum dimensional stability of a cutting tool, or the minimum number of surface roughness indicators after cutting.
The difficulty of solving the problem of optimal cutting mode calculation is directly related to the low accuracy of the mathematical description of elastic-thermodynamic interaction in the cutting system. This interaction should be described using a systemic-synergetic approach [11,12]. The structure of a model should be based on the description of the cutting force response to the tool movements in the coordinate system of elastic displacements of a cutting tool tip relative to the shaping trajectory and the temperature-velocity characteristics of the cutting process itself. This approach allows prognostic assessment of the operations currently performed on a cutting tool, and therefore significantly increases the reliability of tool wear monitoring and accuracy of predicting the residual strength of a tool [13].
The problem of cutting tool wearability in the metalworking machines have been studied since long ago; these studies are deemed to be lasting for more than a century. They are mainly aimed at developing the systems of monitoring and predicting the residual strength of a tool [15,16,17,18] based on processing the measured acoustic, cutting force, temperature, vibration, and other signals [19,20]. After analysing and processing the signals, the informative features are determined, and then fed into a mathematical model [21,22,23,24], where the current value of cutting tool wear is calculated and its residual strength is predicted. It is possible to predict the residual strength of a cutting tool in a digital twin using the existing mathematical models based on the conventional theory of wear that includes the complicated interaction of various abrasive, diffusion, oxidative, fatigue, or other possible processes [25].
In this regard, the aim of the study is to enhance the validity of mathematical modeling the interrelated thermodynamic phenomena occurring in the process of cutting on the metal-cutting machine tools by refining the mathematical model for the friction coefficient.
2. Materials and Methods
2.1. Description of the Mathematical Model Based on the Nonlinear Characteristics of the Friction Coefficient
We shall investigate the relationship between the thermodynamic feedback generated on the flank face of a cutting tool and the friction coefficient formed there through the study of the complicated thermodynamic adhesive-diffusion nature of wear occurring during rubbing metal surfaces against each other. Figure 1 demonstrates the details of the tool-workpiece contact zone during cutting, as well as the interaction formed in there, which is described by the nonlinear characteristics of the friction coefficient.
As shown in Figure 1, in the process of cutting, a heat transfer zone dependant on the flank wear land is formed. This is where friction, describing the cutting force response to the tool’s shaping movements, is generated.
We shall describe the mathematical model of the cutting process thermodynamics by a simplified second-order linear equation. To build up this equation, we shall use an approach based on the theory of heat sinks and sources [19].
Where — temperature in the contact zone of the flank face of the cutting tool and the machined workpiece, — time constants of the thermodynamic subsystem [c], — coefficient showing the transformation of cutting power (-[N*mm/s]) into cutting temperature [Q*s/N*mm], — a rotation period of the machined workpiece fixed in the spindle [s].
Taking into account the proposed expression of the dependences among the response forces, and based on the V.L. Zakovorotny’s scientific school approach to modeling dynamics of tool deformation movements [11,12,13], we shall assume that the model for tool tip’s deformations will be as follows:
where elastic deformation vector of a cutting tool, — vector-function of forces affecting a cutting tool (cutting force response to the shaping movements of a cutting tool), [N*s2/mm]; [N*s/mm]; [N/mm] — symmetric and positively definite matrices of inertial coefficients, dissipation coefficients and stiffness coefficients, respectively.
The formation of a tool’s flank wear land significantly influences the overall force response of the cutting process to the tool's shaping movements. Based on these assumptions, the overall force response of the machining process to the tool's shaping movements can be represented as follows:
where — force response of the cutting process to the shaping movements on the rake face of the cutting tool (cutting force), — some coefficient of decomposition of the general vector of response forces along the axis i of tool’s deformation, — response of a workpiece to the penetration of a cutting wedge.
The cutting force model will be based on the hypothesis of proportionality of the force to the area of the cut layer as follows:
where — coefficient describing the pressure of the chip on the rake face of the tool.
The normal component of the cutting process force response to tool penetration into a workpiece can be represented as a dependence of the force on the volume of a cutting wedge penetrating into a workpiece, that is, the product of the cutting depth and the instantaneous feed rate and the magnitude of flank wear:
where — the tensile strength of the machined metal under compression ; — the magnitude of cutting tool flank wear [mm].
To decompose the cutting process response in the normal direction on the deformation axis, the side cutting edge angle φ is used as follows:
The force response along z - axis is essentially nothing else but the friction force, which can be represented as:
where — friction coefficient.
The friction coefficient nonlinearly depends on the temperature in tool-workpiece contact zone. We shall define the friction coefficient characteristics by the following expression:
where — some constant minimum value of the friction coefficient, — the magnitude of the friction coefficient increment upon change of temperature in the contact zone, and — value drop and rise rates of the friction coefficient characteristics.
Thus, the general system of equations describing the dynamics of cutting tool tip’s deformation movements, taking into account the thermodynamic feedback generated by the cutting process, is presented below as follows:
The model presented here describes the thermodynamic relationship formed during the cutting process by a nonlinear dependence of the friction coefficient on the contact temperature.
2.2. Experimental determination of the friction coefficient dependence on the contact temperature
To conduct the experiment, a 1K625 lathe machine (Figure 2) was used in all the cases, with STD.201-1 measuring bench installed to study the cutting modes during turning.
To conduct the experiment for determining the dependences of friction coefficient during machining, the spindle was started in reverse motion. The cutting speed varied in the range from 16 to 191 meters per minute. Measurements of temperature and friction force decomposed along the tool deformation axes were carried out with a sampling frequency of 15 kHz. The results of the experiments are given below in the form of the force, temperature and friction coefficient graphs.
As shown in Figure 3, the change in the speed of tool-workpiece interaction on the flank face, not just makes the radial component of the contact force to increase, but changes the shape of the curve itself. To calculate the friction coefficient, it is also necessary to measure the force in the tangential direction, and the friction coefficient will be calculated as follows:
The components of the force measured in the tangential direction in the same experiment are shown in Figure 4.
As shown in Figure 4, the tangential component of the force impeding relative sliding of the tool's flank along the machined surface of a workpiece, also changes in amplitude and shape. The dependences of the friction coefficient calculated for radial and tangential forces are shown in Figure 5.
As shown in Figure 5, the amplitude and shape of the friction coefficient also change upon changing the speed of tool’ flank face interaction with the machined workpiece. Then, mean friction coefficient values were calculated and will be presented in the figure summing up the experimental results.
The results of temperature measurements by the natural thermoelectromotive force (thermo-EMF) method are shown in Figure 6.
As shown in Figure 6, the temperature measured by the natural thermo-EMF method tends to decrease over the contacting time. This is due to thermo-EMF having the highest value at the beginning of the experiment due to the major difference of temperatures in the friction zone and in the material of a workpiece. Then, over the dissipation of the generated temperature, thermal gradients smooth out. We have used the mean temperatures obtained in the experiment, ignoring the initial temperature perturbation.

Table 1.
Experimental calculation results.
| Parameter | Experimental point | ||||||||
|---|---|---|---|---|---|---|---|---|---|
| 1 | 2 | 3 | 4 | 5 | 6 | 7 | 8 | 9 | |
| Cutting speed, m/min |
16 | 25 | 33 | 42 | 49 | 81 | 137 | 153 | 191 |
| Temperature, ℃ |
157 | 216 | 259 | 291 | 298 | 309 | 312 | 333 | 358 |
| Friction coefficient |
0.49 | 0.47 | 0.44 | 0.42 | 0.37 | 0.36 | 0.39 | 0.40 | 0.41 |
The results of friction coefficient calculation based on experimental data and the results of friction characteristics modeling according to the expression (8) (), are given in Figure 7.
As shown in Figure 7, the greatest agreement between the proposed simulated characteristics and the experimental dependence is observed in the temperature range above 300°C; the initial region of the characteristics differs greatly, which is explained by the complexity of conducting the experiment in this temperature range. Both characteristics have a pronounced local minimum, coinciding in both characteristics, which is in the range from 300 to 320℃. . It is the presence of this local minimum that allows us claiming the existence of optimal conditions for metal cutting on metal-cutting machine tools.
The answer to the question how validly the proposed model, which is determined by the expressions (1–9), and which is taking into account the friction coefficient parameters defined here, can describe the processes occurring during cutting is of great interest.
3. Validation of the mathematical model
The previously described test facility (see Figure 1) was used to conduct measurements. During the experiment, we continuously turned a shaft-type workpiece under the same machining parameters and monitored the degree of tool wear and the change in the cutting force response resulting from the flank wear impact on the process dynamics.
The experimental process parameters were as follows: a machined workpiece material —CT30XГCA steel grade, diameter — 160 mm. A trigon insert made of T15K6 material was used as the cutter. Some of the cutting mode parameters used in the experiments are presented in Table 2.
A series of experiments was conducted. In the course of experiments, the cutting tool wear grew, the diameter of the machined shaft-type workpiece decreased. Therefore, to stabilize the cutting speed, we had been increasing the speed of workpiece rotation at each step. The results of measuring the degree of the cutting tool wear are presented in Table 3.
The results of measuring the cutting tool wear on the main flank face are illustrated in Figure 8.
As shown in the figure above, the shape of the cutting tool wear growth curve is close to the standard shape [13,19,20], but there are also differences. The greatest difference is observed in the initial region, the area of running-in of the cutting tool.
The results of modelling and the processed experimental data results are presented below in a series of figures. Figure 9 shows the results of modelling and the results of data processing at the first point of the experiment (see Figure 8).
As shown in Figure 9, the degree of agreement between the experimental and simulated characteristics is very high, indicating sufficient validity of the mathematical model for this cutting case. However, the above figures demonstrate almost no signs of the cutting tool wear, which limits the quality of model validity assessment.
The next, second measurement point results and the corresponding model characteristics are shown in Figure 10; here too, the magnitude of the cutting tool flank wear is small.
As shown in Figure 10, the degree of agreement between the characteristics presented in this figure is quite high, the same as in the previous case. In the figures below, we shall study how close are the measured and simulated temperature characteristics.
As shown in Figure 11, contact temperatures demonstrate a high degree of agreement between the simulated and experimental characteristics at the first two points of the experiment.
In the figures below, we’ll consider the last two points of the experiment, points 5 and 6, with wear characteristics as shown in Figure 8. The force decomposed along the tool deformation axes and its total magnitude are shown in Figure 12.
Compared to the previous figures, Figure 12 shows that the degree of agreement between the experimental and simulated characteristics of steel worsens and the values start to diverge in the plunge-cutting region and the initial cutting region after plunge-cutting. This is particularly evident in Figure 12 a) and b).
The results of force measurements and simulations for the 6th experimental point are shown in Figure 13.
Here, Figure 13, also shows that the quality of the cutting force modelling has become significantly worse compared to that in figures 9 and 10.
The temperature modeling results for two last cases are shown in Figure 14.
As shown in Figure 14, in the case of the fifth point, quite sufficient agreement between the simulated and experimental characteristics is observed, whereas, in the case of the sixth point the degree of agreement is extremely low.
4. Discussion
Building a mathematical model simulating the complicated adhesion-diffusion interaction between the flank face of a cutting tool and the machined surface of a metal workpiece undergoing cutting on a metal-cutting machine tool, enabled formulating a nonlinear dependence of the friction coefficient on contact temperature. The subsequent experiments using a 1K625 lathe machine, enabled determining the parameters, which made it possible to refine the proposed model and conduct a comparative analysis of friction coefficient behaviour.
The analysis of the results presented in the third section of the article shows that the mathematical model proposed in the first section quite validly describes the dynamics of cutting tool tip deformation and force response to the tool's shaping movements in case of small or zero values of cutting insert flank wear. In the regions where magnitude of cutting tool wear reaches medium and higher values, the validity of the simulated force response decreases. This is due to the additional factor that must be considered upon the flank wear increase, i.e. the factor, which shows the change in the force response not only in the tangential but also in the radial direction. Refinement of the model in this aspect can significantly improve the validity of modeling.
Despite the listed shortcomings, the model presented in this article possesses both scientific value and considerable practical significance. Its scientific value is underpinned by the new approach to modeling the friction coefficient between the cutting tool's flank and the machined surface of a workpiece being cut. For the first time, friction coefficient modeling with a pronounced local minimum in the medium-temperature region has been proposed. The proposed model is well-substantiated by the works of other authors who had conducted experimental studies in this area, as well as justified by experiments conducted by the authors. The practical value of the proposed model stems from the high predictive capacity of the general mathematical model. If the studies refer to the slightly worn cutting tools, the digital model can highly accurately predict both the cutting force response to the tool's shaping movements, as well as the temperature in the tool-workpiece contact zone. It's quite evident that under the above mentioned conditions, the impact of the selected modes on cutting dynamics can easily be determined in advance. Therefore, further research will include refining the mathematical model for high magnitudes of cutting tool wear, as well as subsequent modeling the cutting modes across different parameters to define the optimal ones.
5. Conclusions
The article presents a new approach to modeling the friction coefficient that plays an important role in the mathematical description of the processes occurring during metal cutting on metal-cutting machine tools. In the frame of research, we relied on the cutting process thermodynamics, when the power released in the tool-workpiece contact zone is converted into temperature, which controls friction between the flank face of a cutting tool and the machined surface of a workpiece.
As noted earlier, the proposed approach has high scientific value, as it refines the dynamic model of cutting system, as well as high practical value enabling evaluation of the cutting process dynamics based on the results of preliminary modeling
The advantage of the proposed model lies in its high validity when simulating processes for the regions of slight wear of the cutting tools. Its disadvantage is the loss of the above mentioned high validity when simulating processes for the regions of heavy wear of the tools. Therefore, further research can be targeted at refining the mathematical model, as well as subsequent modeling to find the optimal conditions of machining based on the thermodynamic effects occurring during cutting.
Author Contributions
Conceptualization, Viktor Lapshin; Methodology, Viktor Lapshin; Software, Ilya Dudinov; Validation, Ilya Dudinov; Formal analysis, Viktor Lapshin; Investigation, Viktor Lapshin; Resources, Viktor Lapshin; Data curation, Viktor Lapshin; Writing – original draft, Viktor Lapshin; Writing – review & editing, Viktor Lapshin; Visualization, Viktor Lapshin; Supervision, Viktor Lapshin; Project administration, Viktor Lapshin. All authors have read and agreed to the published version of the manuscript.
Funding
The research was carried out in the framework of the agreement No. 075-03-2025-302/8 of October 29, 2025 for the implementation of the Applied research “Development of software and hardware for monitoring and analysis of cutting parameters and performance characteristics of CNC machines” (FZNE-2025-0008).
Conflicts of Interest
The authors declare no conflict of interest.
References
- Budak, E. Machining Process Improvement through Process Twins. In Proceedings of 3rd International Conference on the Industry 4.0 Model for Advanced Manufacturing (AMP 2018) Lecture Notes in Mechanical Engineering; Ni, J., Majstorovic, V., Djurdjanovic, D., Eds.; Springer: Cham, 2018; pp. P. 164–179. [Google Scholar] [CrossRef]
- Altintas, Y.; Kersting, P.; Biermann, D.; Budak, E.; Denkena, B.; Lazoglu, I. Virtual Process Systems for Part Machining Operation. CIRP Ann. 2014, 63(2), 585–605. [Google Scholar] [CrossRef]
- Tchigirinsky, U.L.; Ingemansson, A.R. Engineering Process Aspects of Digitalization of Machine-Building Production. Sci. Intensive Technol. Mech. Eng. (In Russ.). 2023, 9(147), 39–48. [Google Scholar]
- Kabaldin, YuG; Shatagin, D.A.; Kuzmishina, A.M. Razrabotka tsifrovogo dvoinika rezhushchego instrumenta dlya mekhanoobrabatyvayushchego proizvodstva [Development of a Digital Twin of a Cutting Tool For Machining Production]. Tendentsii Razvit. Nauk. I Obraz. [Trends in the development of science and education] (In Russ.). 2018, (45-8), 50–57. [Google Scholar] [CrossRef]
- Zakovorotny, V.L.; Vinokurova, I.A. Effect of Heat Generation on Dynamics of Cutting Process. Adv. Eng. Res. (In Russ.). 2017, 17(3 (90)), 14–26. [Google Scholar] [CrossRef]
- Fominov, E.V.; Gvindjiliya, V.E.; Marchenko, A.A.; Shuchev, C.G. Effect of Periodic Fluctuations of Cutting Mode Parameters on the Temperature of the Front Face of a Turning Tool. Adv. Eng. Res. (Rostov-on-Don) (In Russ.). 2025, 25(1), 32–42. [Google Scholar] [CrossRef]
- Lapshin, V.P.; Turkin, I.A.; Khristoforova, V.V. Mathematical Modeling of the Elastic–Thermodynamic Interaction during Metal Turning on Metal-Cutting Machines. J. Manuf. Mater. Process. 2026, 10(1), 8. [Google Scholar] [CrossRef]
- Makarov, A.D.; Mukhin, V.S.; LSh, Shuster. Tool Wear, Quality and Durability of Parts Made of Aviation Materials; Ufa Aviation Institute Publ.: Ufa, 1974. [Google Scholar]
- Makarov, A.D. Optimization of Cutting Processes; Mashinostroenie Publ.: Moscow, 1976; p. 312 p. [Google Scholar]
- Postnov, V.V.; Shafikov, A.A. Development of Evolutionary Model of Tool Wear for Manufacturing Process Control. Vestn. Ufa State Aviat. Tech. Univ. (USATU) (In Russ.). 2008, 11(2), 139–145. [Google Scholar]
- Zakovorotny, V.L.; Gvindjiliya, V.E. Synergetic Approach to Improve the Efficiency of Machining Process Control on Metal-Cutting Machines. Obrab. Met. [Metal Working and Material Science] (In Russ.). 2021, 23(3), 84–99. [Google Scholar] [CrossRef]
- Lapshin, V.P.; Turkin, I.; Dudinov, I. Research on Influence of Tool Deformation in the Direction of Cutting and Feeding on the Stabilization of Vibration Activity during Metal Processing Using Metal-Cutting Machines. Sensors 2023, C. 7482. [Google Scholar] [CrossRef] [PubMed]
- Zakovorotny, V.L.; Gvindjiliya, V.E. The Dependence of Tool Wear and Quality Parameters of the Surface Being Cut on Dynamic Characteristics. Obrab. Met. [Metal Working and Material Science] (In Russ) 2019, 21(4), 31–46. [Google Scholar] [CrossRef]
- Wang, S.; Yu, Zh; Lu, Ch; Li, Ch. A Digital Twin-Enabled Hybrid Deep Learning Approach for Tool Wear Monitoring in CNC Milling Based on Multi-Sensor Fusion. J. Eng. 2026, (1), e70180. [Google Scholar] [CrossRef]
- Zhang, J.; Zeng, Y.; Starly, B. Recurrent Neural Networks with Long Term Temporal Dependencies in Machine Tool Wear Diagnosis and Prognosis. SN Appl. Sci. 2021, 3, 442. [Google Scholar] [CrossRef]
- Huda, F.; Karjuni, K.; Rusli, M. Cutting Tool Wear Analysis Using Sound Signal and Simple Microphone. IOP Conference Series: Materials Science and Engineering, 2020; Vol. 830. IOP Science, p. P. 042028. [Google Scholar] [CrossRef]
- Liu, M.K.; Tseng, Y.H.; Tran, M.Q. Tool Wear Monitoring and Prediction Based on Sound Signal. Int. J. Adv. Manuf. Technol. 2019, 103, 3361–3373. [Google Scholar] [CrossRef]
- Lubis, S.; Rosehan; Darmawan, S.; Indra, B. Tool Wear Analysis of Coated Carbide Tools on Cutting Force in Machining Process of AISI 4140 Steel. In Proceedings of the 2nd Tarumanagara International Conference on the Applications of Technology and Engineering (TICATE) IOP Conference Series: Materials Science and Engineering, Jakarta, Indonesia, November 21–22, 2019; IOP Science Publ, 2020; Volume 852, p. P. 012083. [Google Scholar] [CrossRef]
- Lapshin, V.P. Turning Tool Wear Estimation Based on the Calculated Parameter Values of the Thermodynamic Subsystem of the Cutting System. Materials 2021, 14(21), 6492. [Google Scholar] [CrossRef] [PubMed]
- Lapshin, V.; Moiseev, D.; Minakov, V. Diagnosing Cutting Tool Wear after Change of Cutting Forces During Turning. In AIP Conference Proceedings; AIP Publishing, 2019; Vol.2188, Issue 1, p. P. 030001. [Google Scholar] [CrossRef]
- Meng, X.; Zhang, J.; Xiao, G.; Chen, Zh; Yi, M.; Xu, Ch. Tool Wear Prediction in Milling Based on a GSA-BP Model with a Multisensor Fusion Method. Int. J. Adv. Manuf. Technol. 2021, 114, 3793–3802. [Google Scholar] [CrossRef]
- Zhang, C.; Zhang, H.Y. Modelling and Prediction of Tool Wear Using LS-SVM in Milling Operation. Int. J. Comput. Integr. Manuf. 2016, 29(1), 76–91. [Google Scholar] [CrossRef]
- Zhang, X.Y.; Liu, L.L.; Wan, X.; Feng, B. Tool Wear Online Monitoring Method Based on DT and SSAE-PHMM. J. Comput. Inf. Sci. Eng. 2021, 21(3), 1–18. [Google Scholar] [CrossRef]
- Wu, D.Z.; Jennings, C.; Terpenny, J.; Gao, R.X.; Kumara, S. A Comparative Study on Machine Learning Algorithms for Smart Manufacturing: Tool Wear Prediction Using Random Forests. J. Manuf. Sci. Eng. 2017, 139(7), 071018(1–9. [Google Scholar] [CrossRef]
- Zhou, Y.; et al. Tool Wear Mechanism, Monitoring and Remaining Useful Life (RUL) Technology Based on Big Data: A Review. SN Appl. Sci. 2022, (4), 232. [Google Scholar] [CrossRef]
Figure 1.
The wear area on the flank face, which forms a thermodynamic feedback a) Heat generation zone on the main flank face of the tool, b) formation of the friction coefficient there.
Figure 1.
The wear area on the flank face, which forms a thermodynamic feedback a) Heat generation zone on the main flank face of the tool, b) formation of the friction coefficient there.
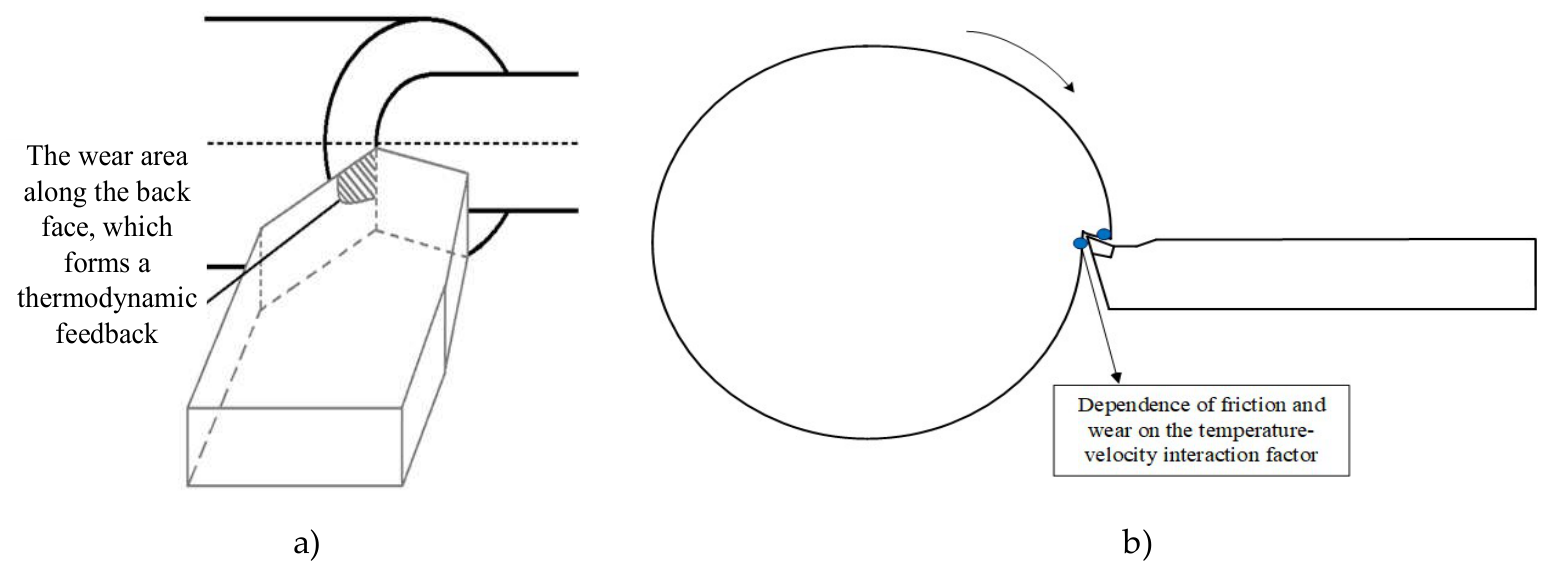
Figure 2.
Exterior of a test facility: a) 1K625 lathe machine, b) STD.201-1 measuring bench.
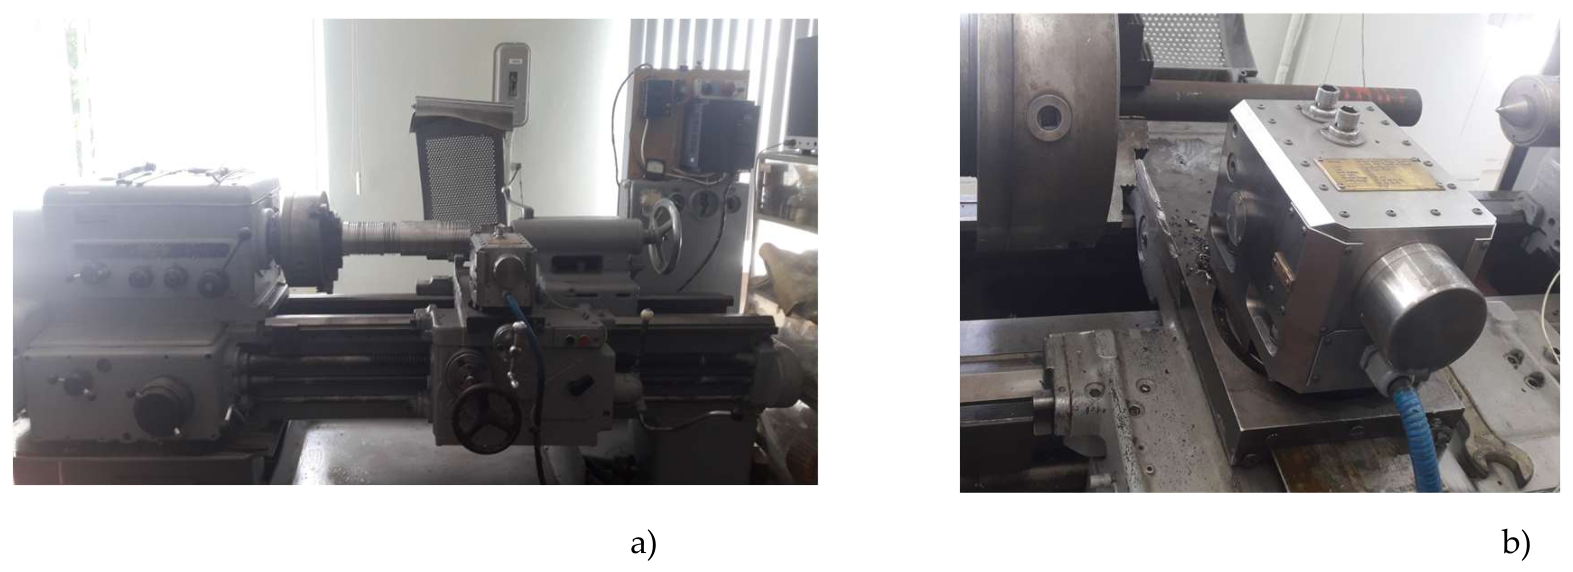
Figure 3.
Discrete values of the change in friction coefficient magnitude at different cutting speeds: a) 16 m/min; b) 25 m/min; c) 33 m/min; d) 42 m/min; e) 49 m/min; f) 81 m/min; g) 137 m/min; h) 153 m/min; i) 191 m/min.
Figure 3.
Discrete values of the change in friction coefficient magnitude at different cutting speeds: a) 16 m/min; b) 25 m/min; c) 33 m/min; d) 42 m/min; e) 49 m/min; f) 81 m/min; g) 137 m/min; h) 153 m/min; i) 191 m/min.
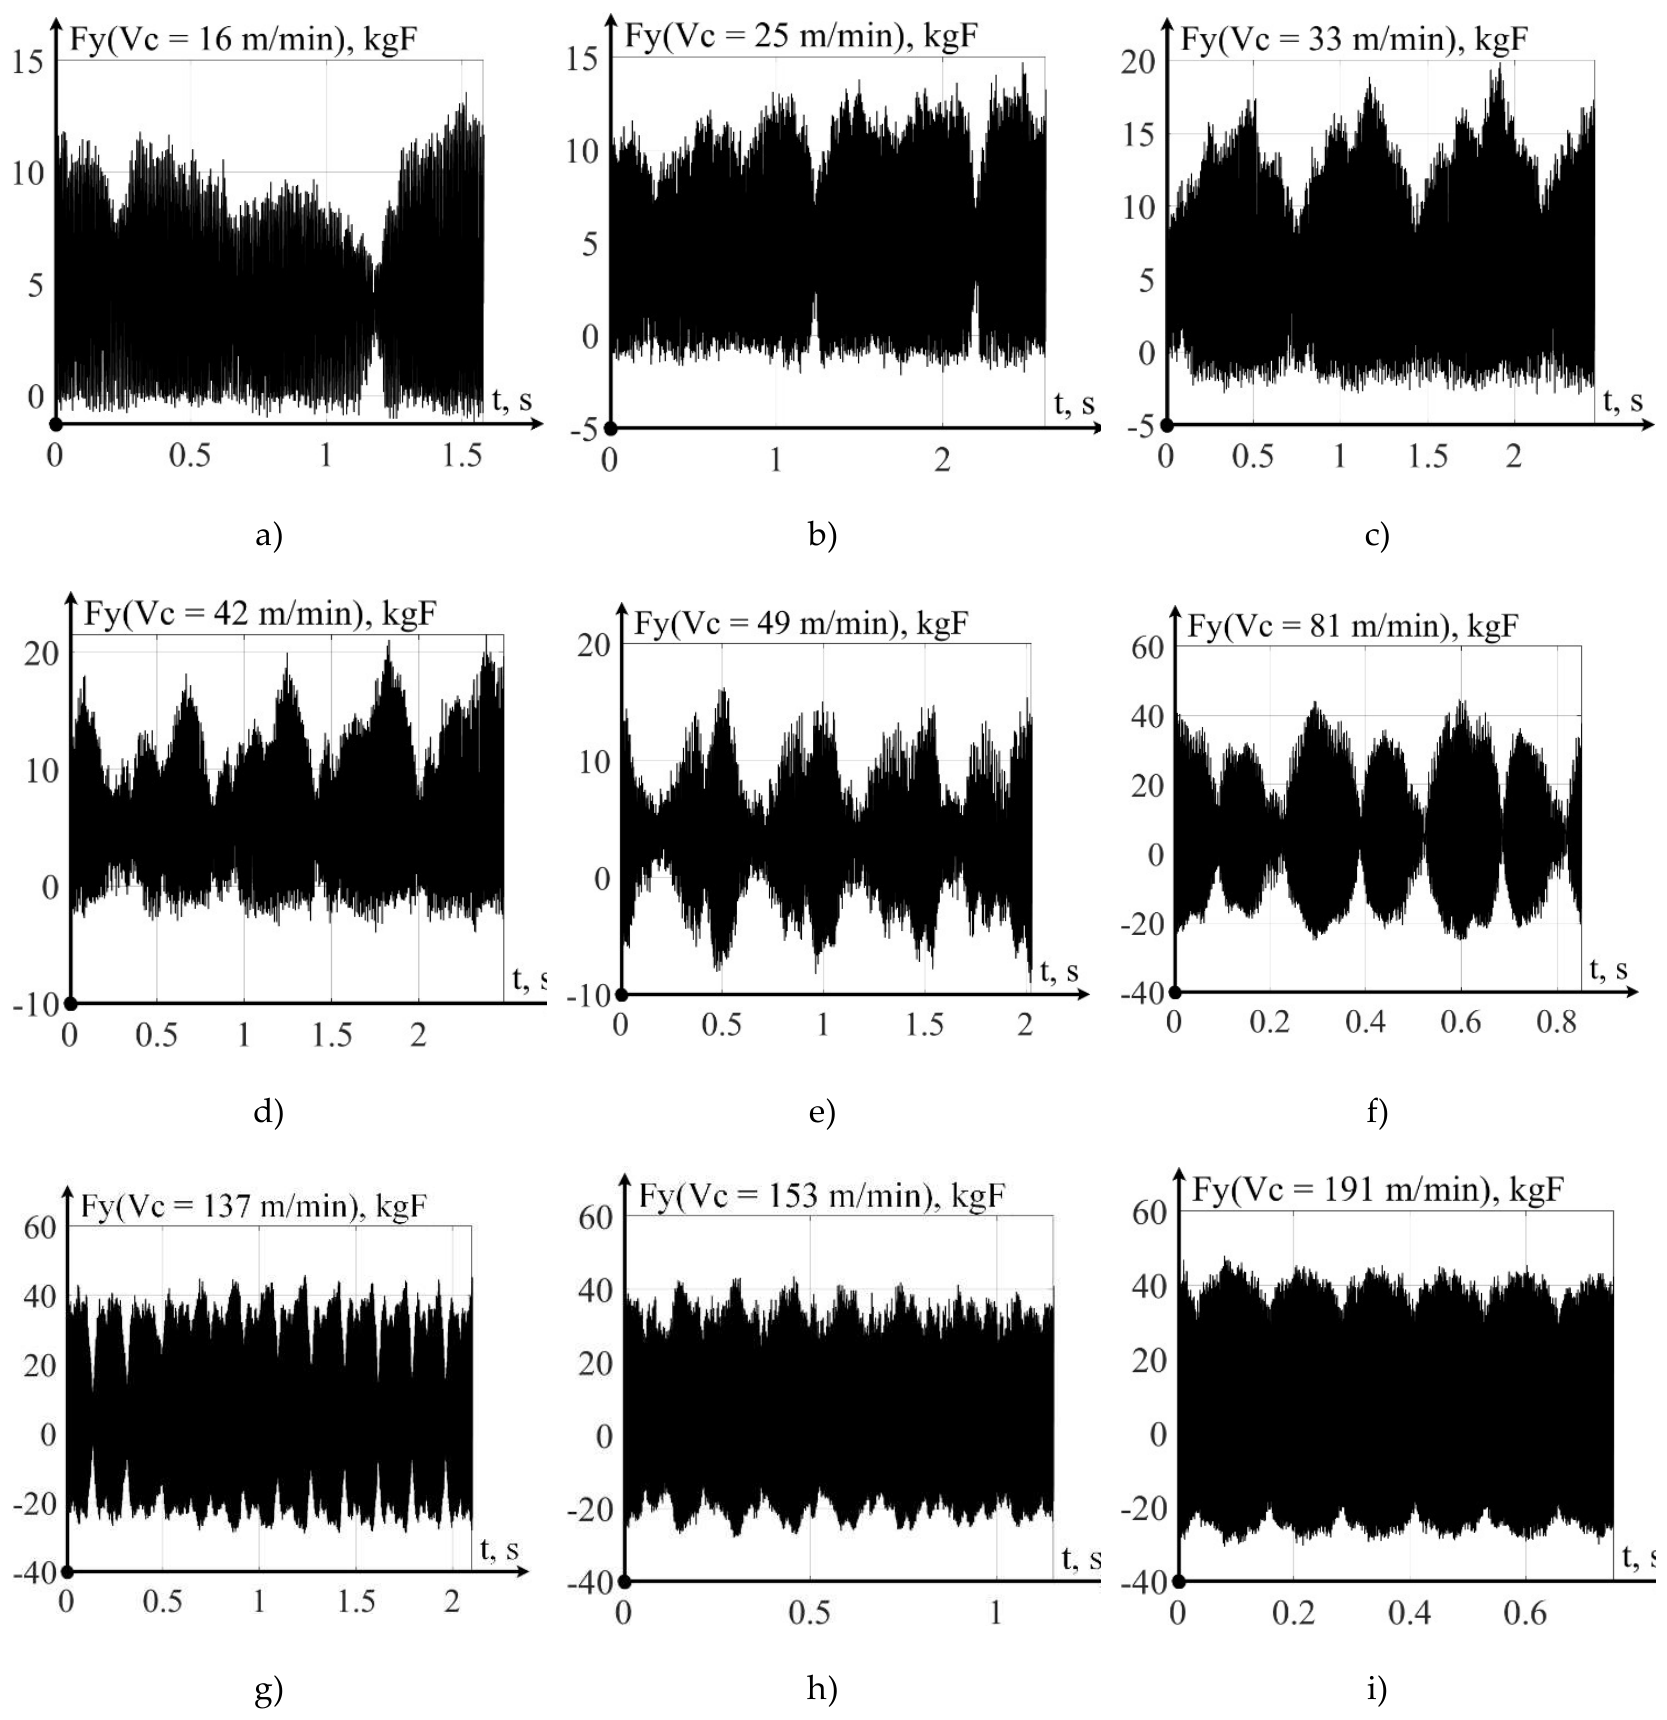
Figure 4.
Discrete values of the change in the friction coefficient magnitude at different cutting speeds: a) 16 m/min; b) 25 m/min; c) 33 m/min; d) 42 m/min; e) 49 m/min; f) 81 m/min; g) 137 m/min; h) 153 m/min; i) 191 m/min.
Figure 4.
Discrete values of the change in the friction coefficient magnitude at different cutting speeds: a) 16 m/min; b) 25 m/min; c) 33 m/min; d) 42 m/min; e) 49 m/min; f) 81 m/min; g) 137 m/min; h) 153 m/min; i) 191 m/min.
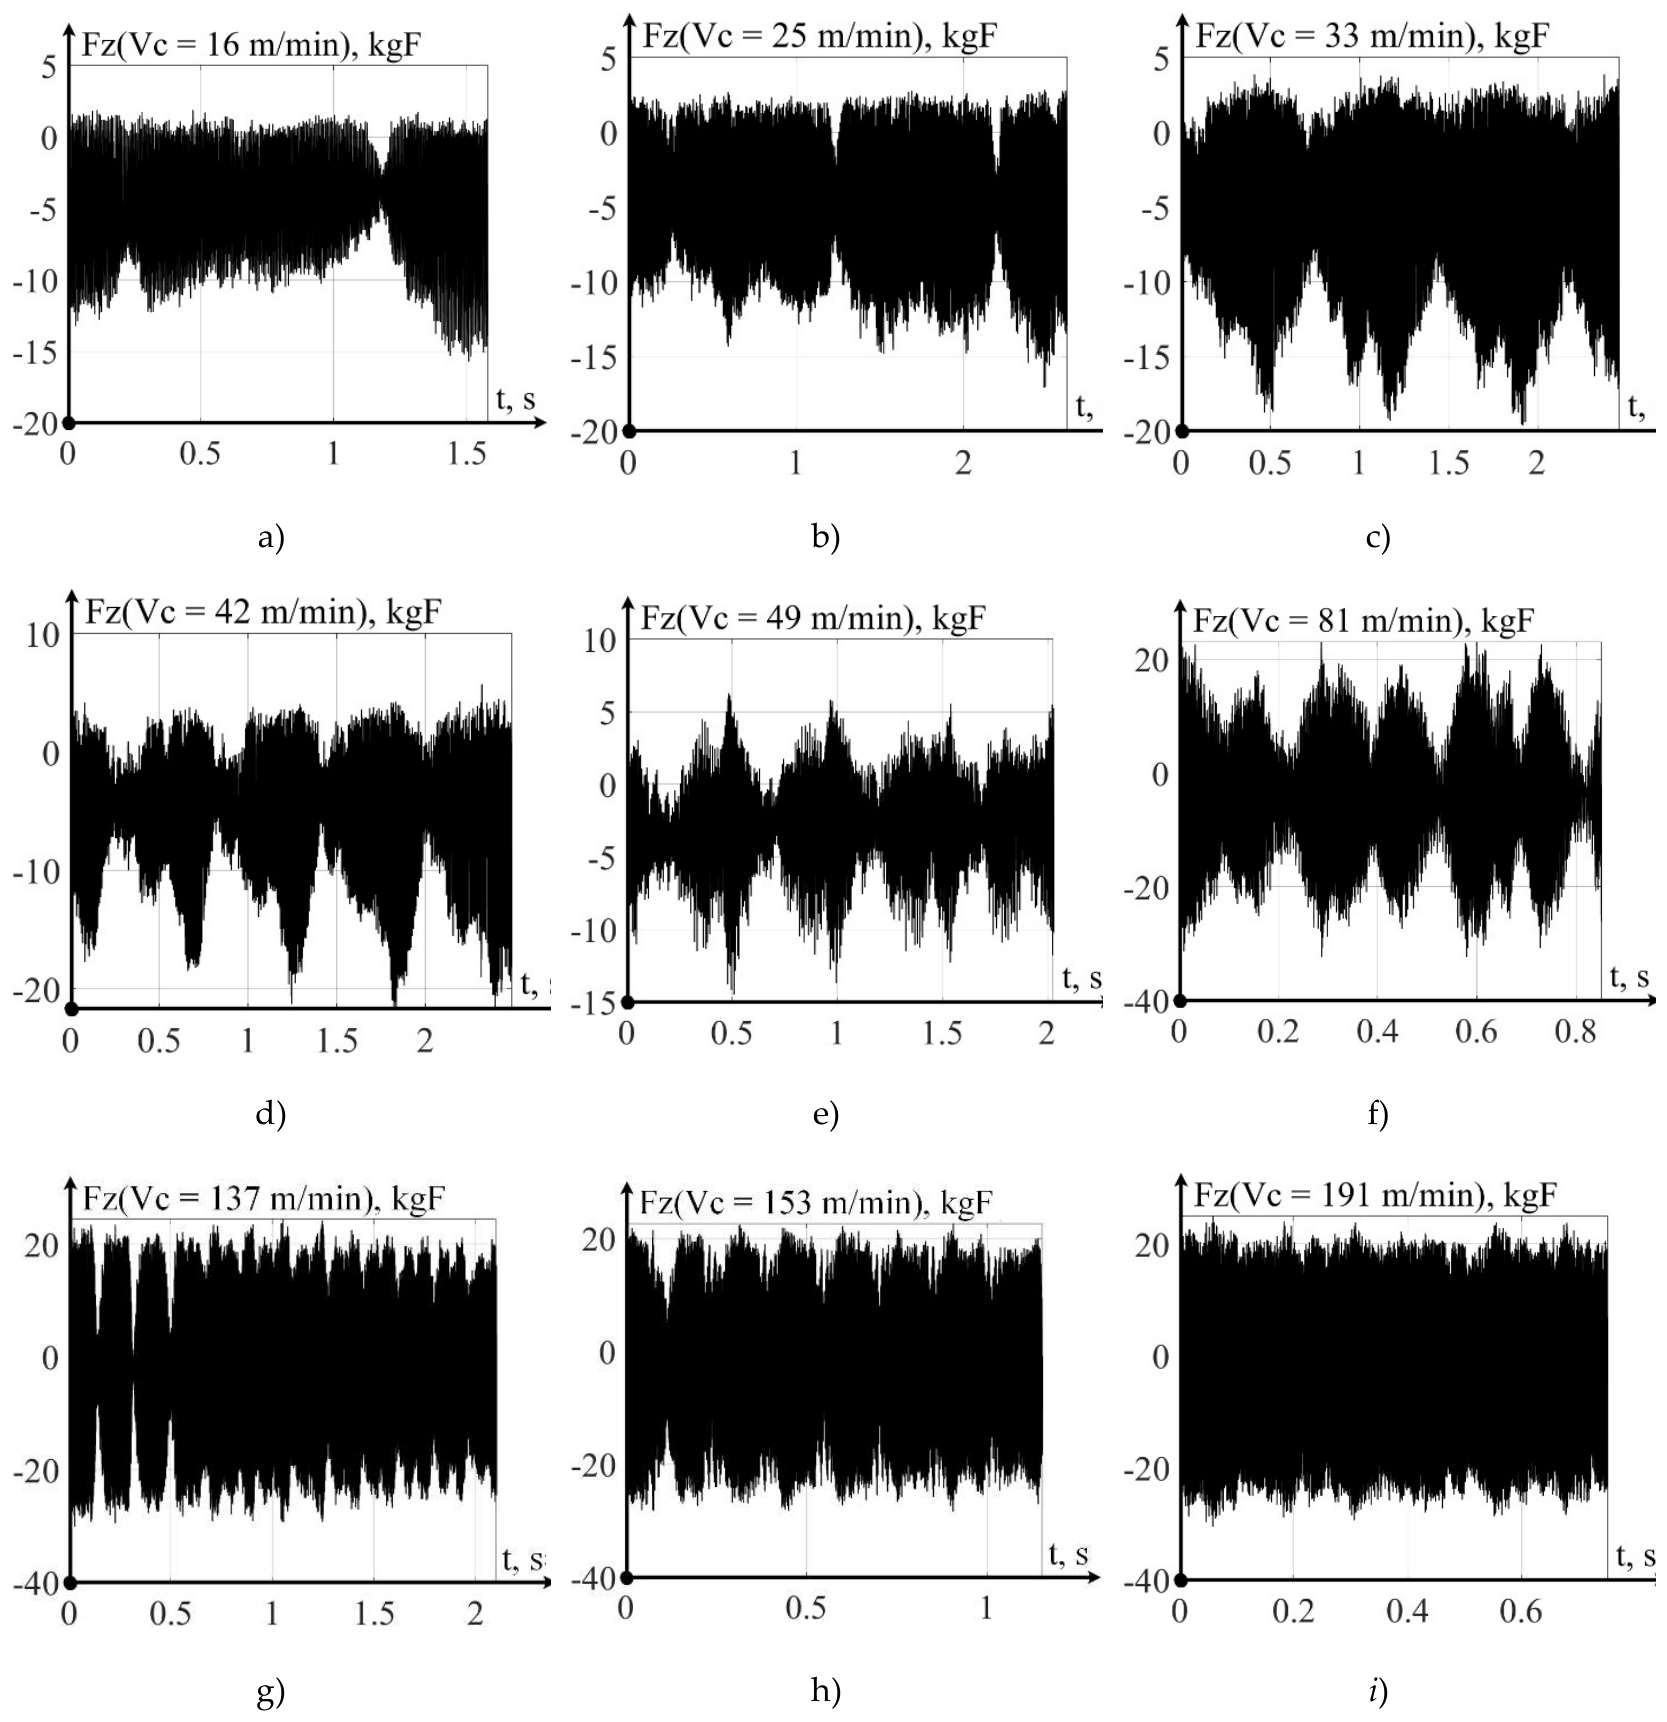
Figure 5.
Discrete values of the change in the friction coefficient magnitude at different cutting speeds: a) 16 m/min; b) 25 m/min; c) 33 m/min; d) 42 m/min; e) 49 m/min; f) 81 m/min; g) 137 m/min; h) 153 m/min; i) 191 m/min.
Figure 5.
Discrete values of the change in the friction coefficient magnitude at different cutting speeds: a) 16 m/min; b) 25 m/min; c) 33 m/min; d) 42 m/min; e) 49 m/min; f) 81 m/min; g) 137 m/min; h) 153 m/min; i) 191 m/min.
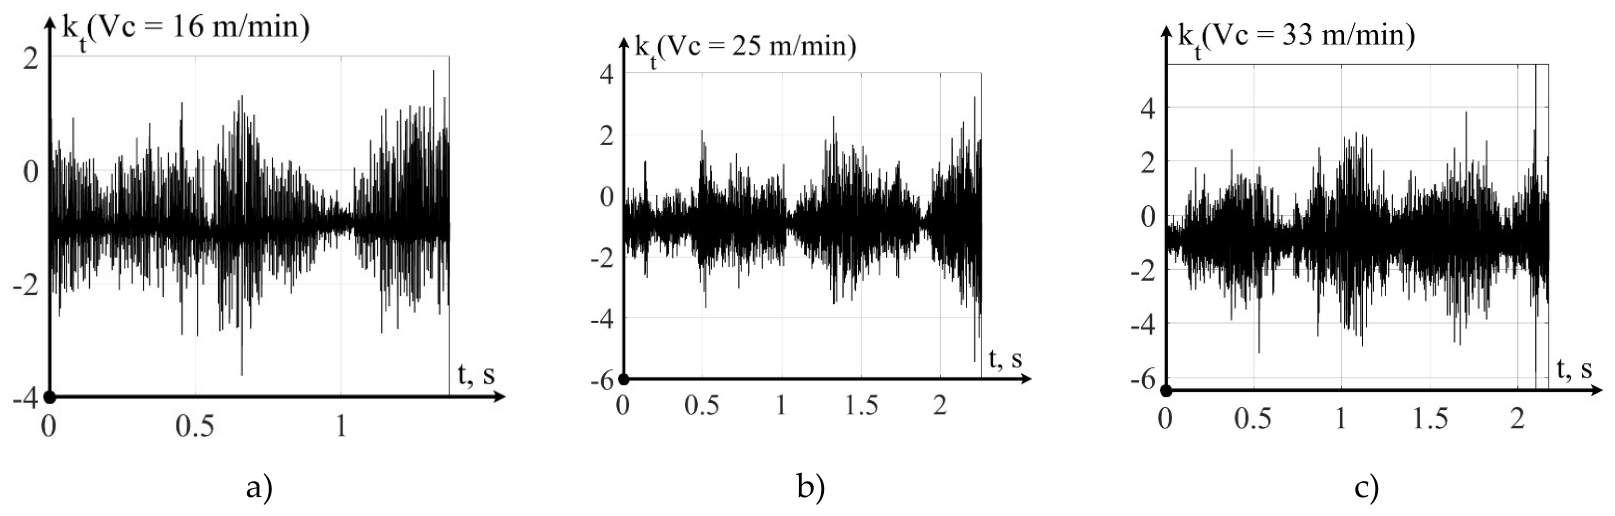
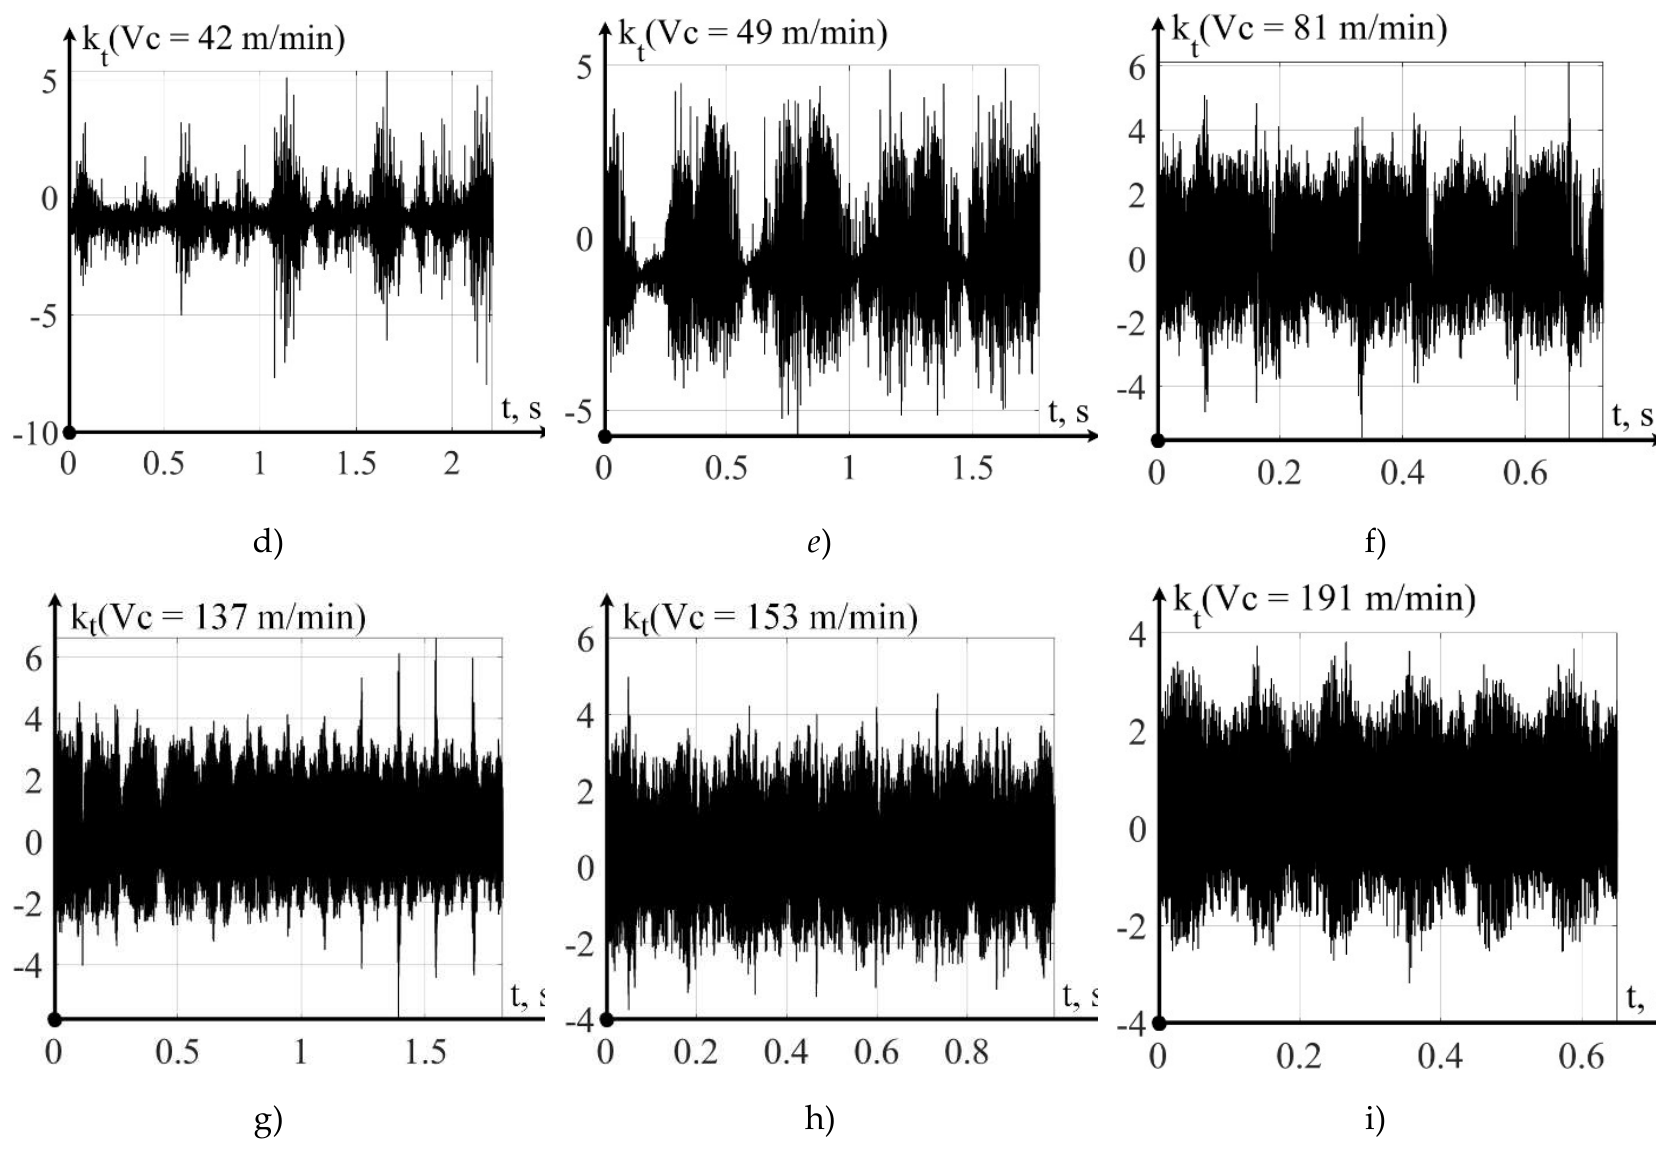
Figure 6.
Discrete values of temperature changes in the friction zone at different cutting speeds: a)16 m/min; b) 25 m/min; c) 33 m/min; d) 42 m/min; e) 49 m/min; f) 81 m/min; g) 137 m/min; h) 153 m/min; i) 191 m/min.
Figure 6.
Discrete values of temperature changes in the friction zone at different cutting speeds: a)16 m/min; b) 25 m/min; c) 33 m/min; d) 42 m/min; e) 49 m/min; f) 81 m/min; g) 137 m/min; h) 153 m/min; i) 191 m/min.
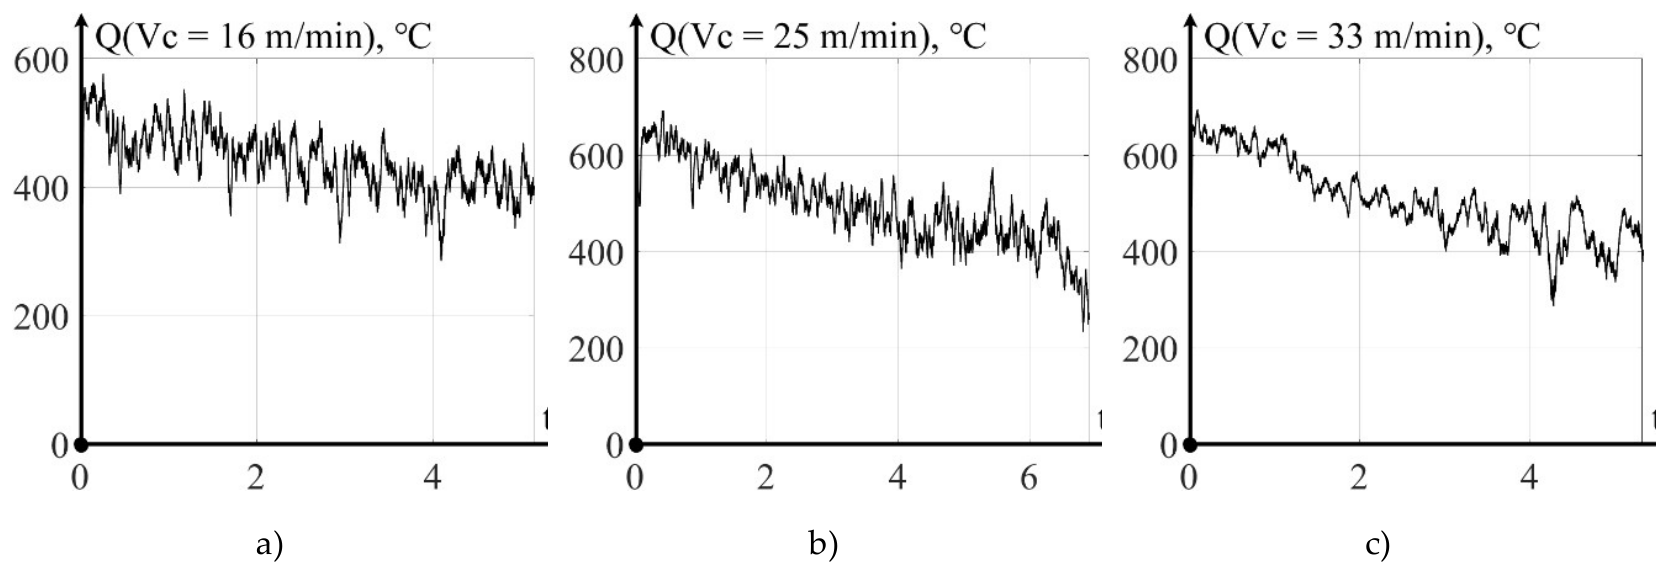
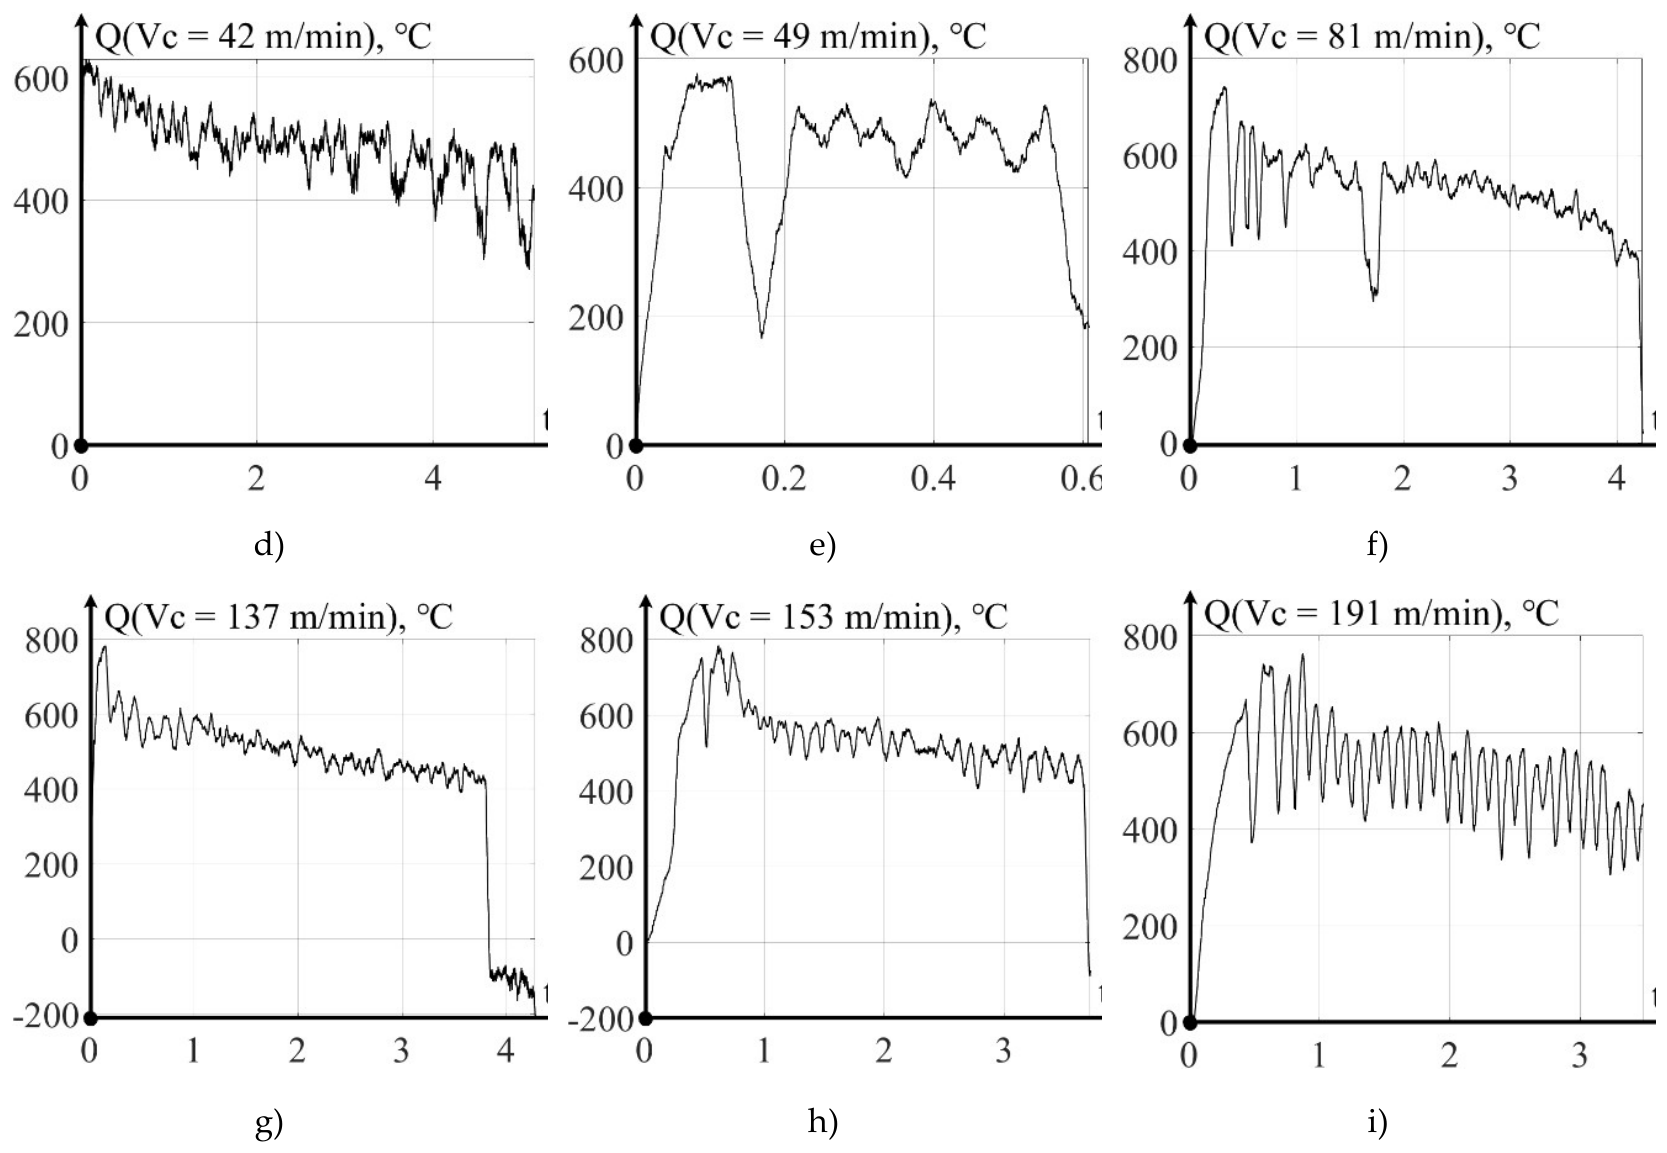
Figure 7.
Friction coefficient, computed by modeling and experimentally calculated.
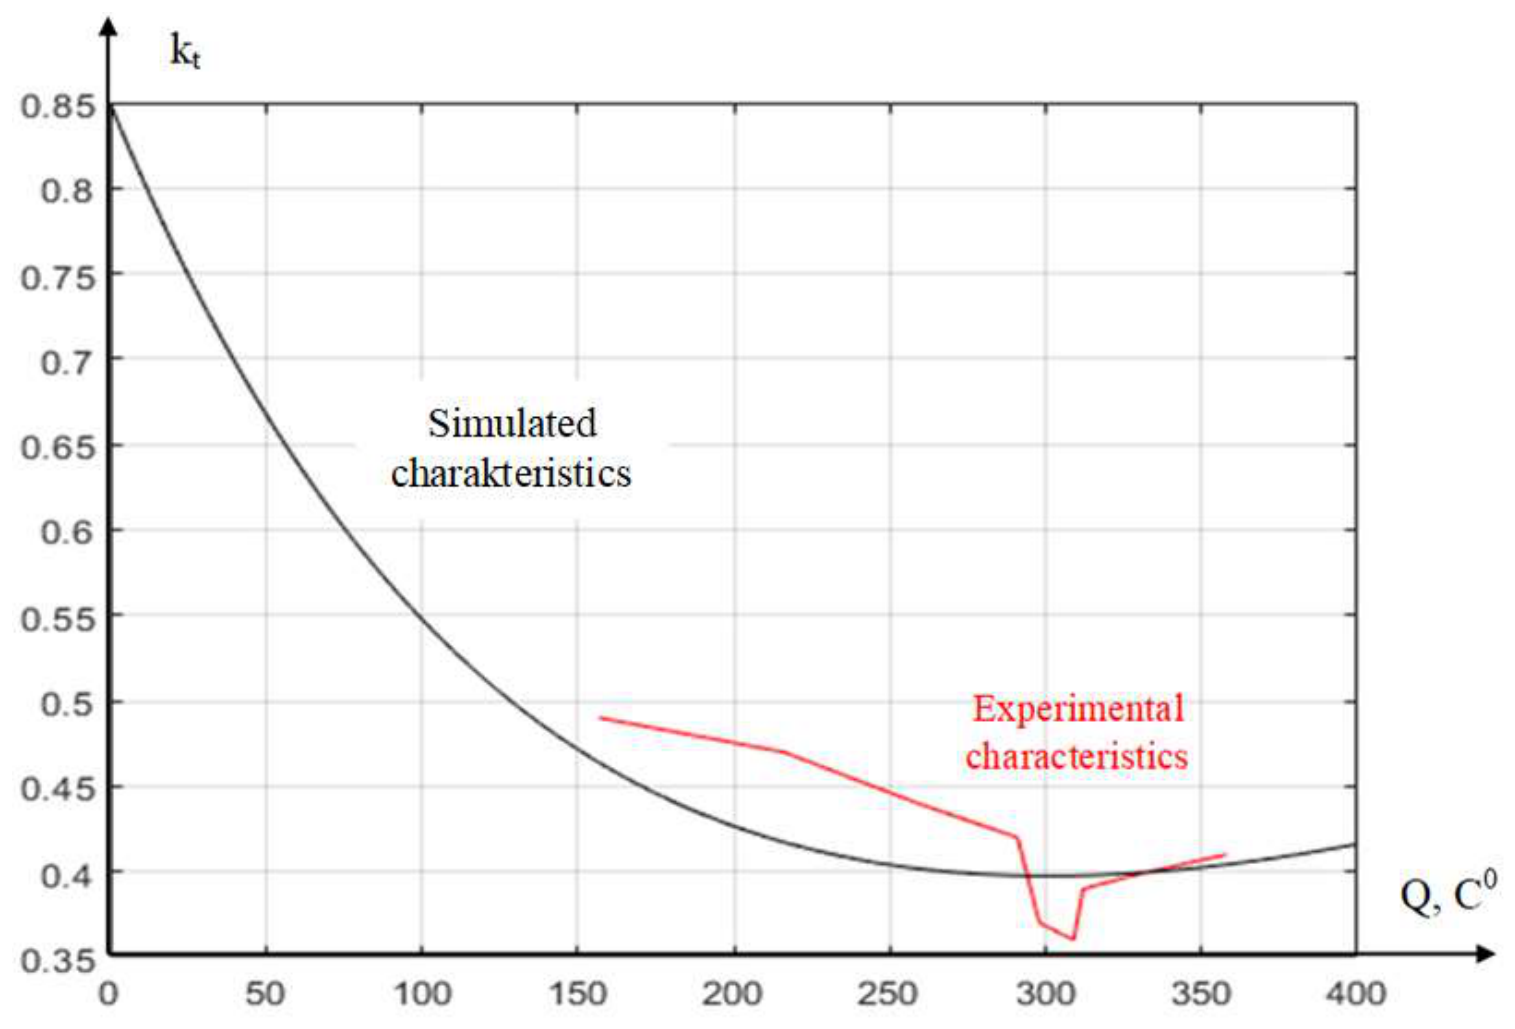
Figure 8.
Dependence of the degree of cutting insert main blade edge wear on the distance it has travelled during workpiece machining.
Figure 8.
Dependence of the degree of cutting insert main blade edge wear on the distance it has travelled during workpiece machining.
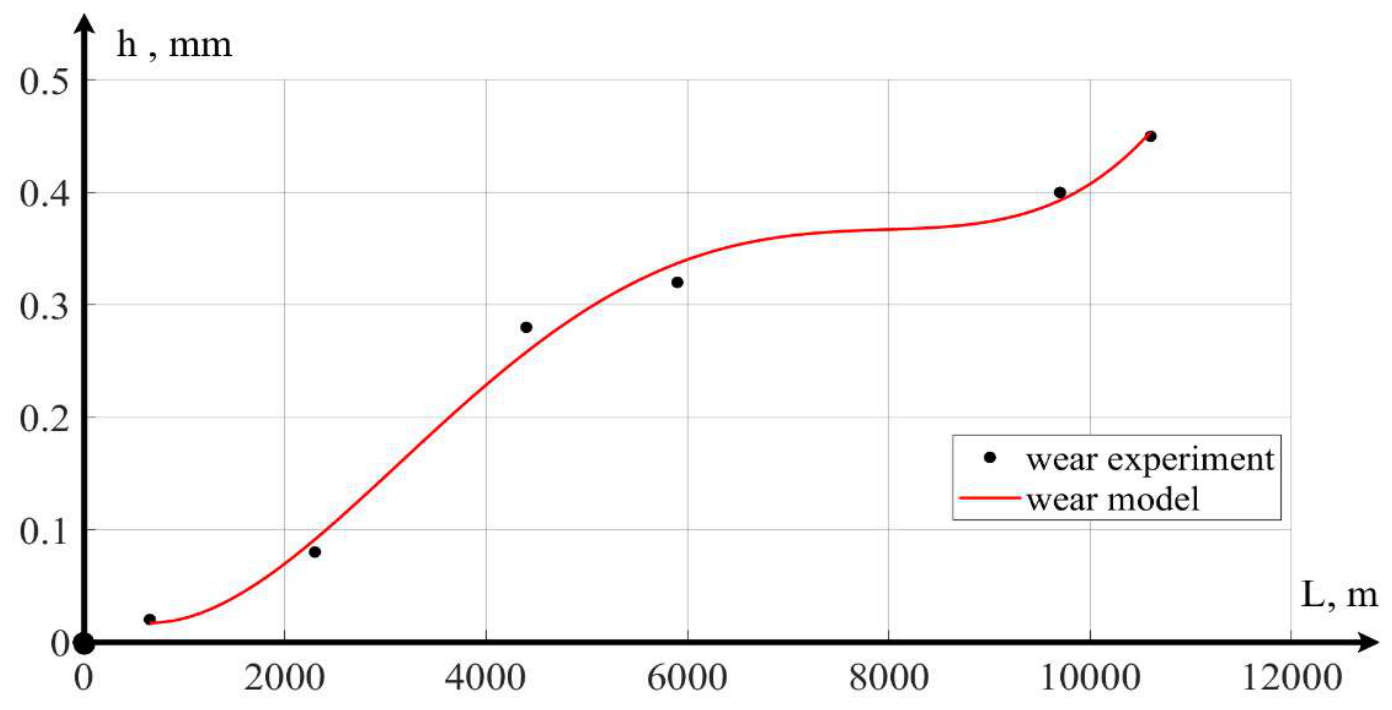
Figure 9.
Force: a) along the x-axis; b) along the y-axis; c) along the z-axis; d) resultant force vector .
Figure 9.
Force: a) along the x-axis; b) along the y-axis; c) along the z-axis; d) resultant force vector .
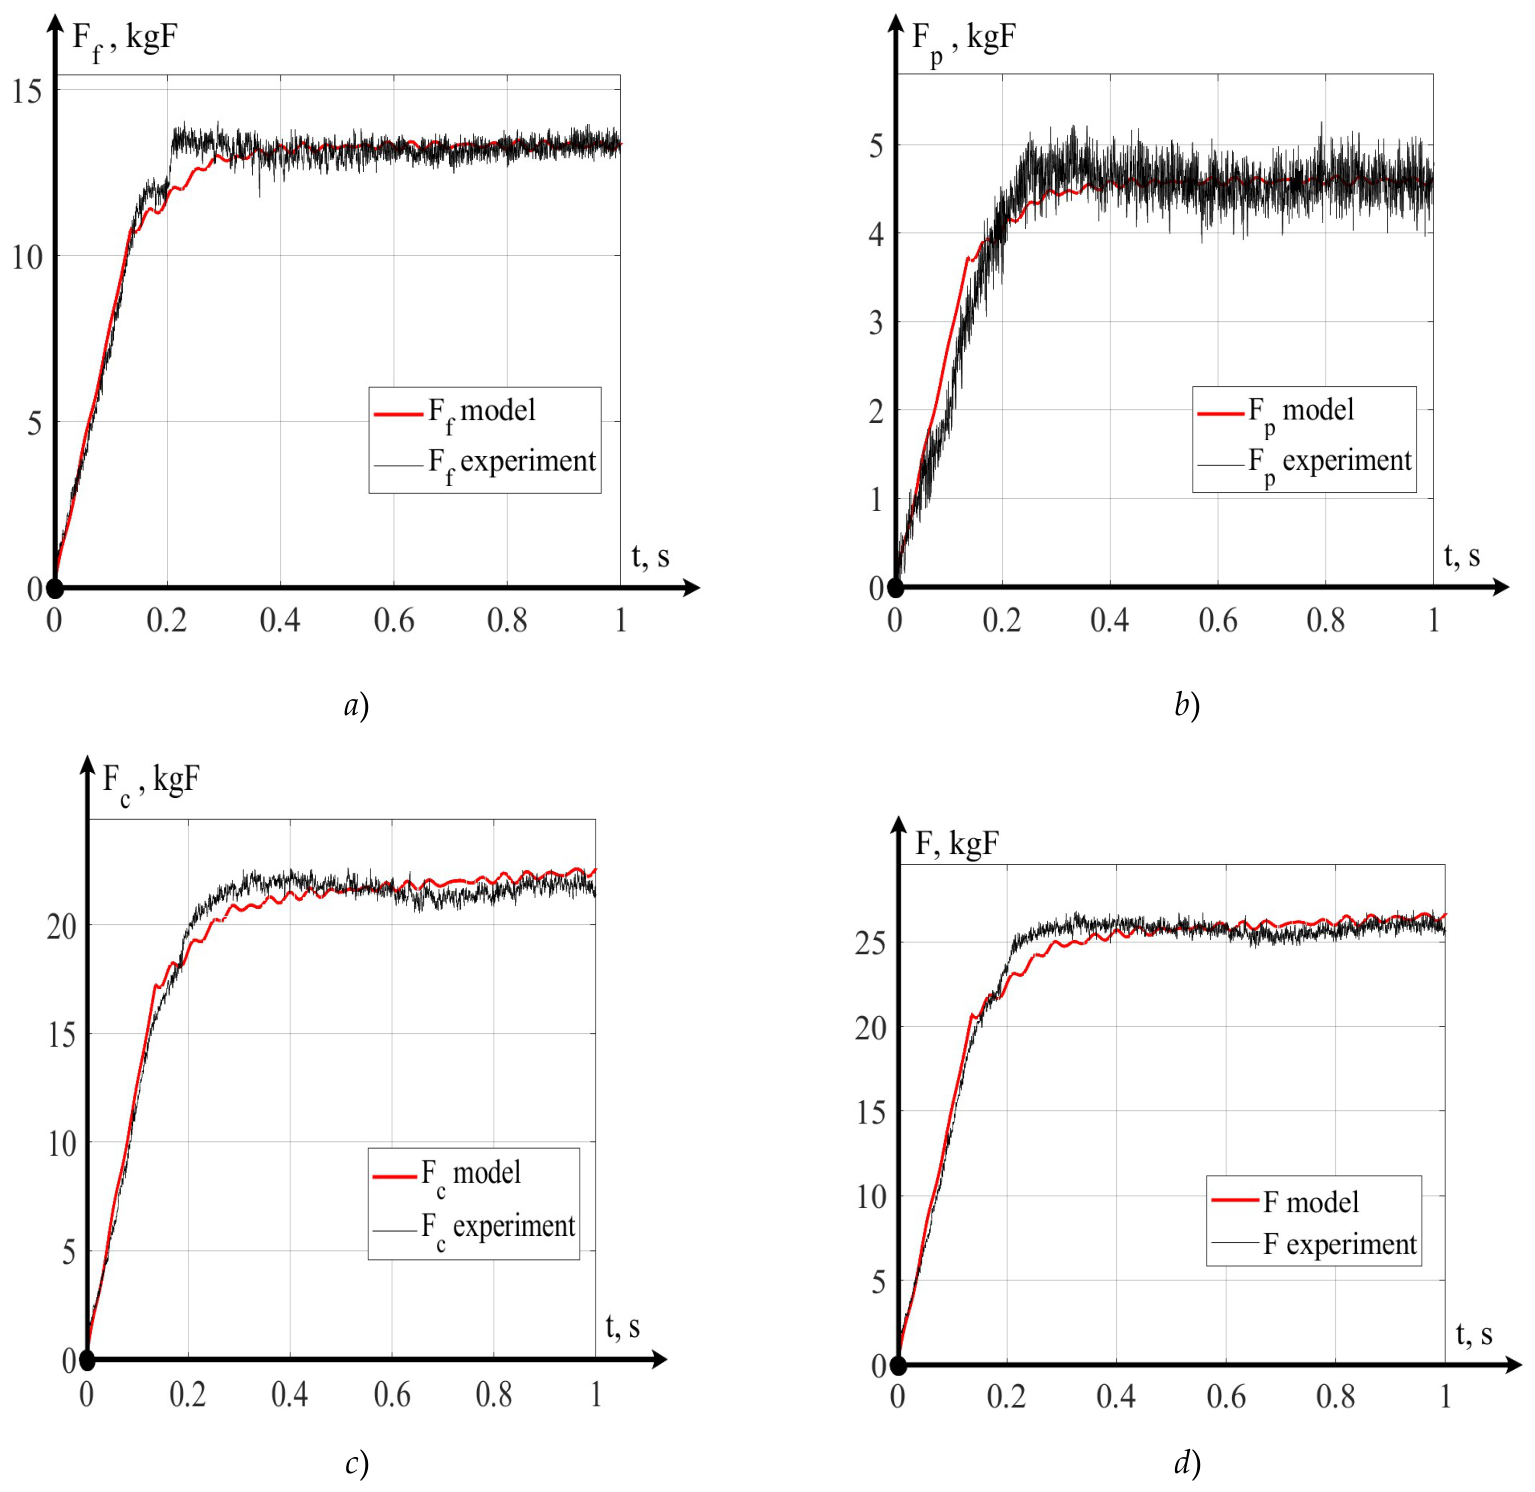
Figure 10.
Forces with hf = 0.08 mm: a) along the x-axis; b) along the y-axis; c) along the z-axis; d) resultant force vector.
Figure 10.
Forces with hf = 0.08 mm: a) along the x-axis; b) along the y-axis; c) along the z-axis; d) resultant force vector.
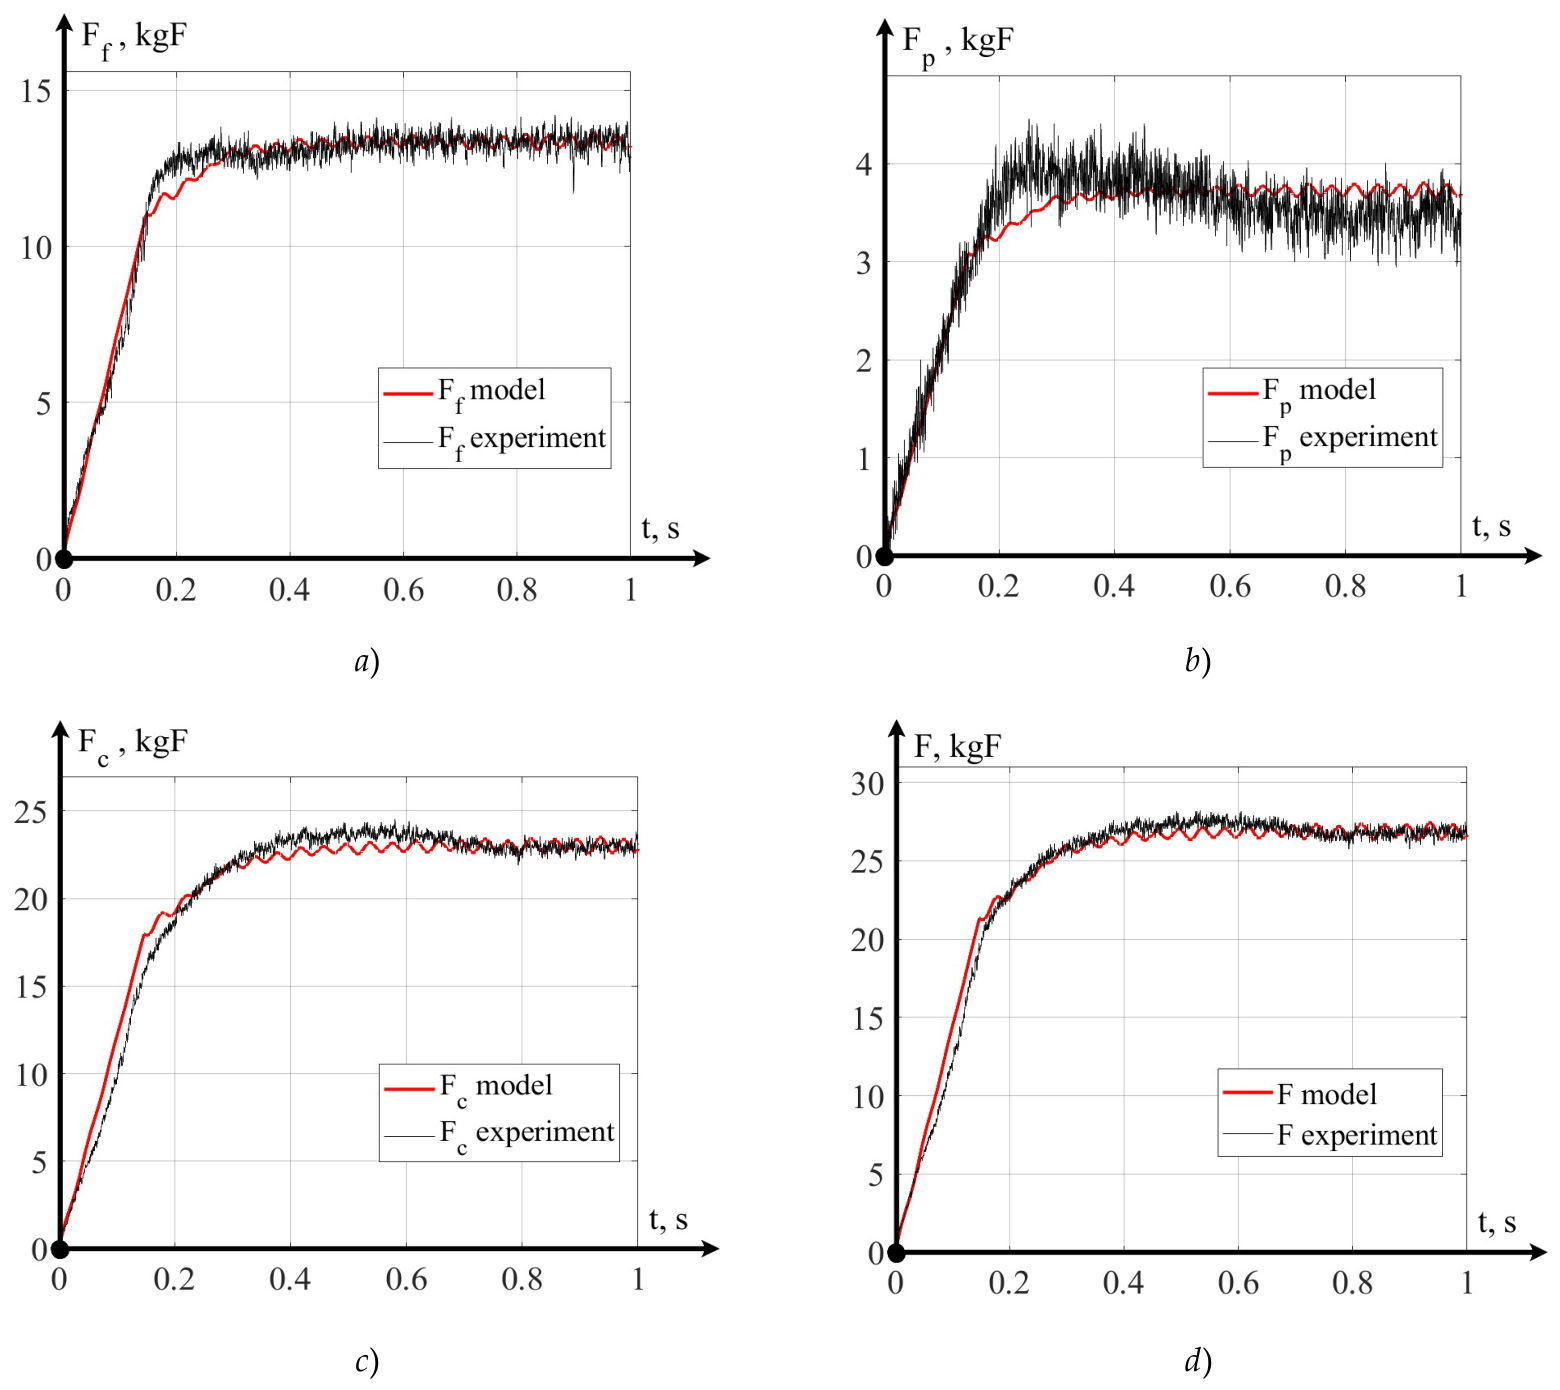
Figure 11.
Temperatures: a) first point; b) second point.
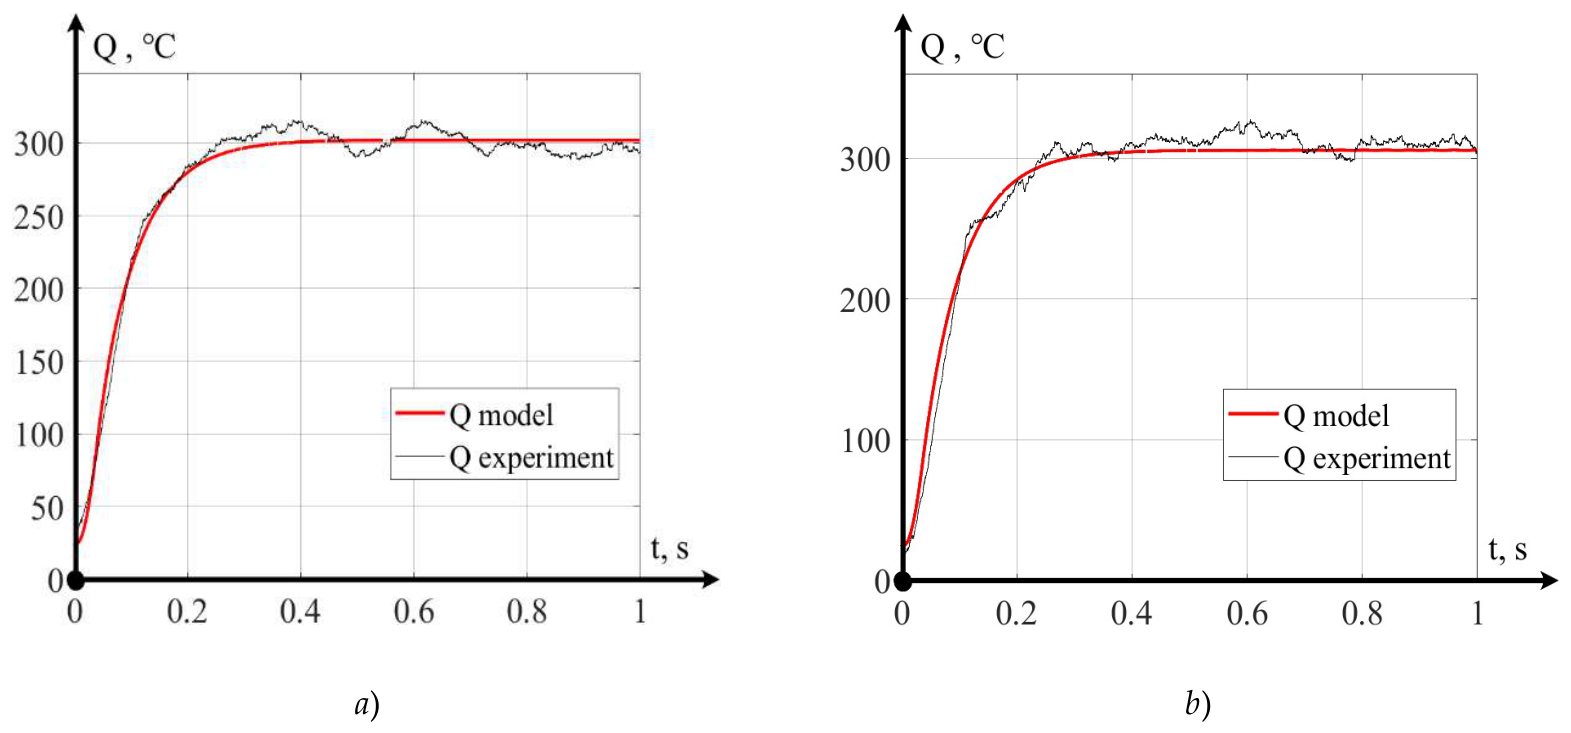
Figure 12.
Forces with hf = 0.40 mm: a) along the x-axis; b) along the y-axis; c) along the z-axis; d) resultant force vector.
Figure 12.
Forces with hf = 0.40 mm: a) along the x-axis; b) along the y-axis; c) along the z-axis; d) resultant force vector.
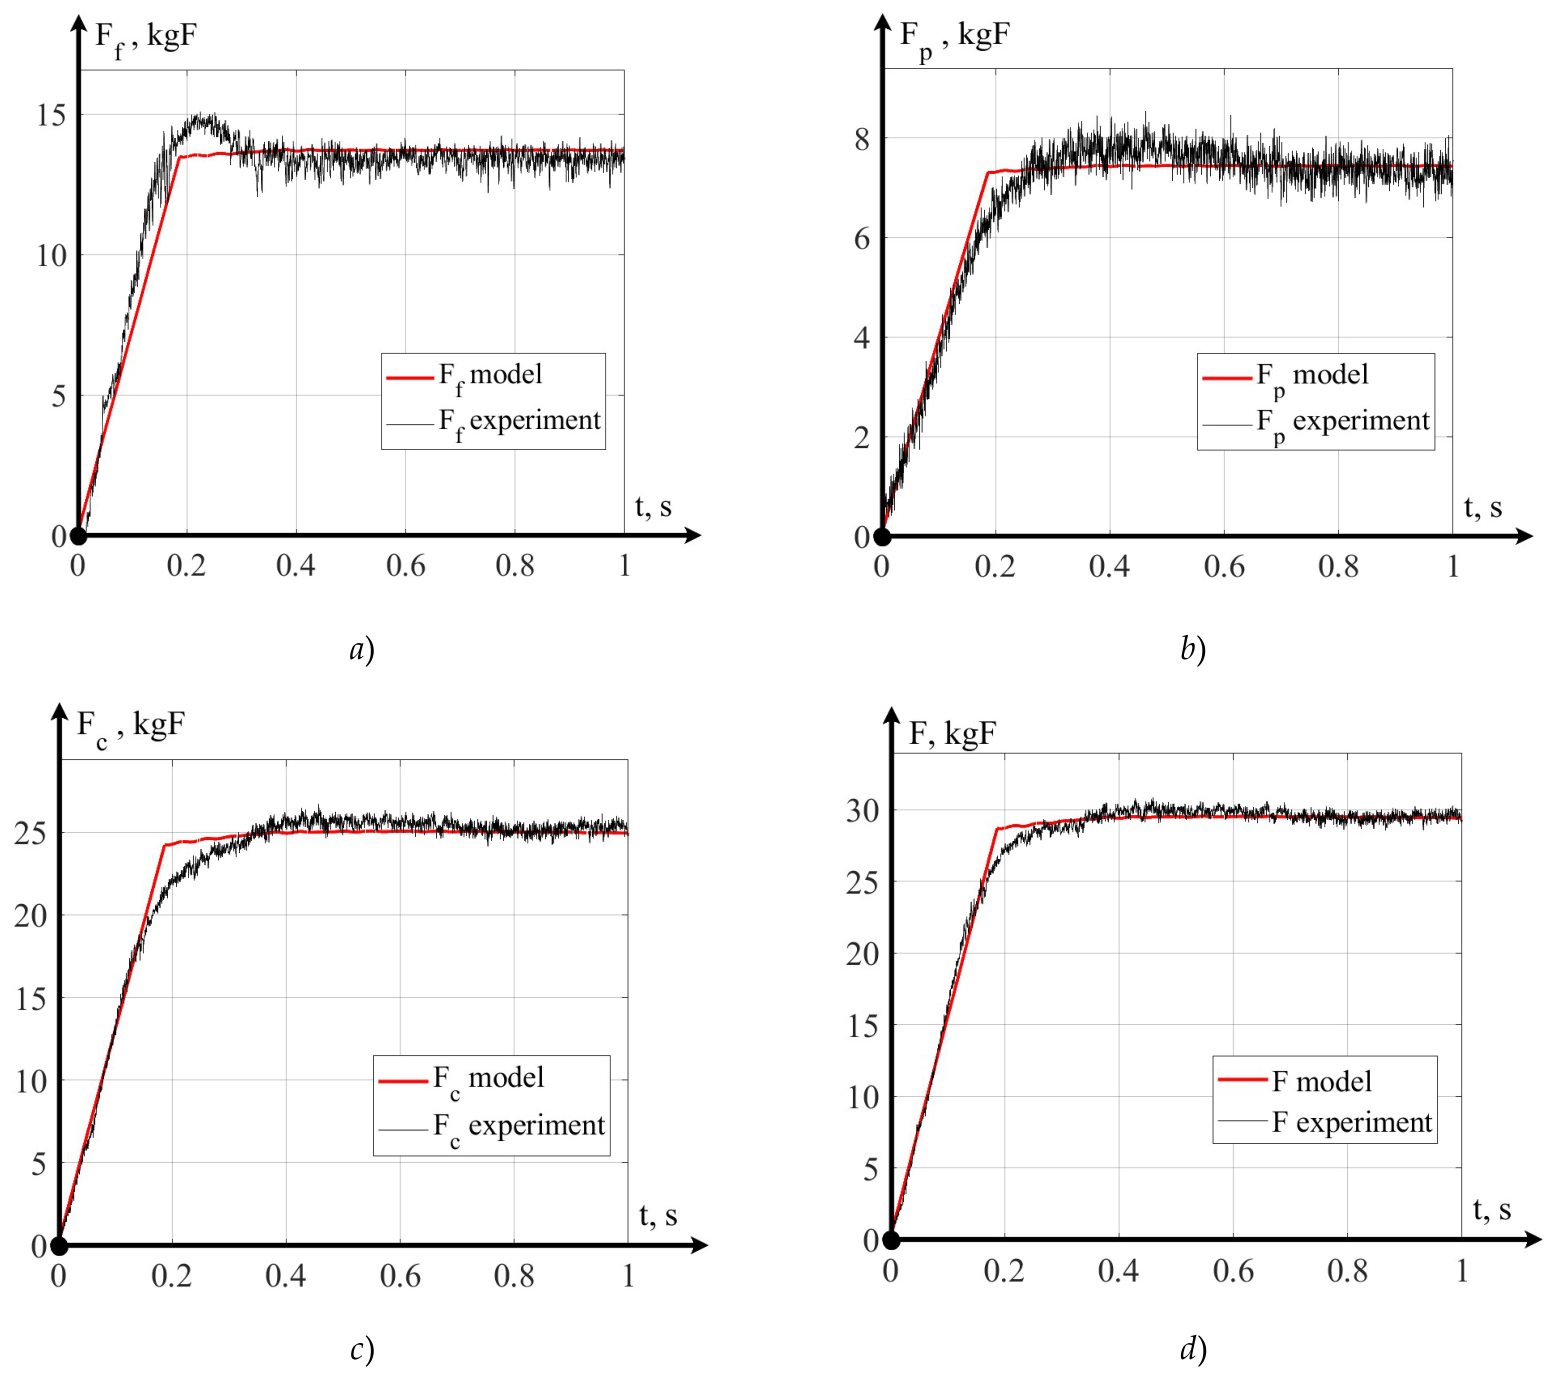
Figure 13.
Forces with hf = 0.45 mm: a) along the x-axis; b) along the y-axis; c) along the z-axis; d) resultant force vector.
Figure 13.
Forces with hf = 0.45 mm: a) along the x-axis; b) along the y-axis; c) along the z-axis; d) resultant force vector.
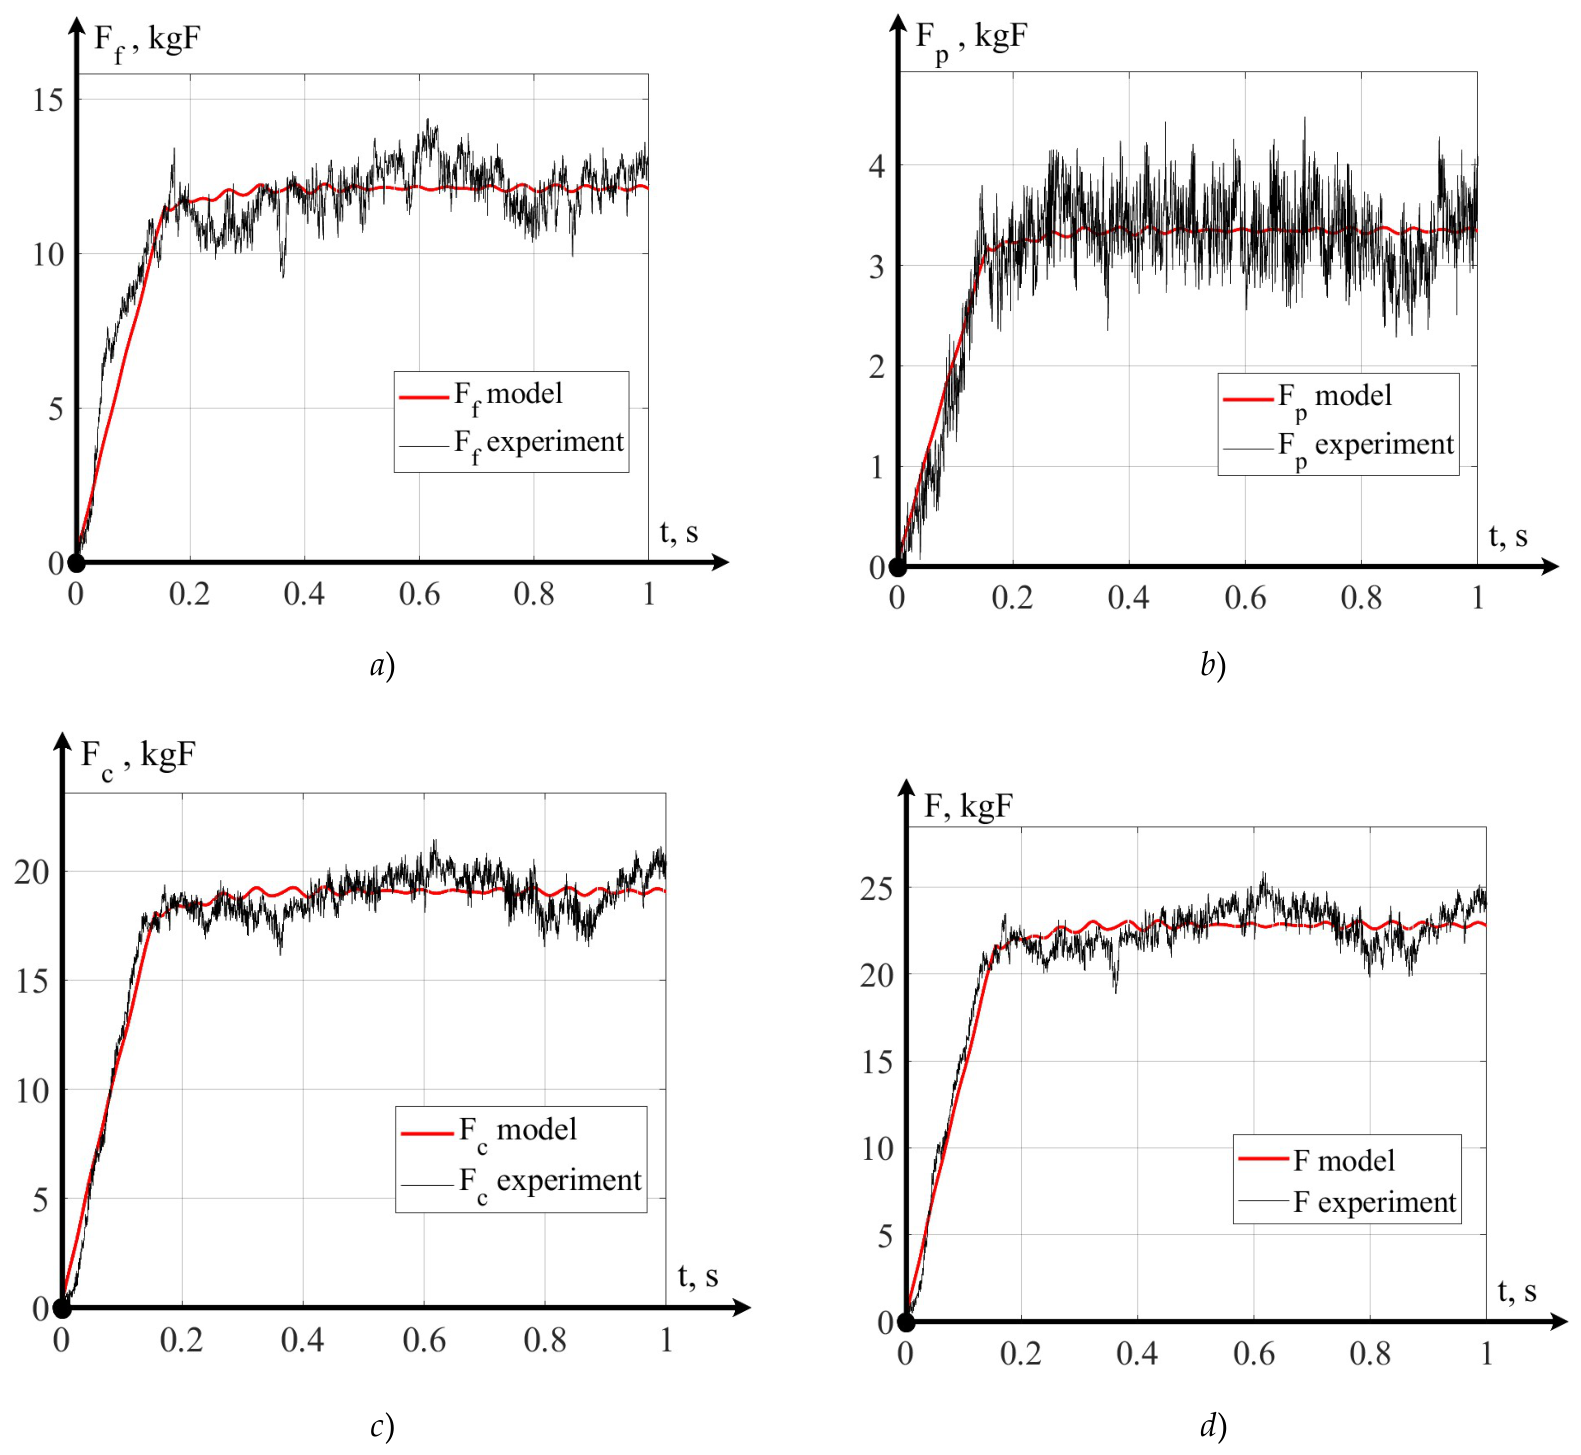
Figure 14.
Temperatures: a) fifth point; b) sixth point.
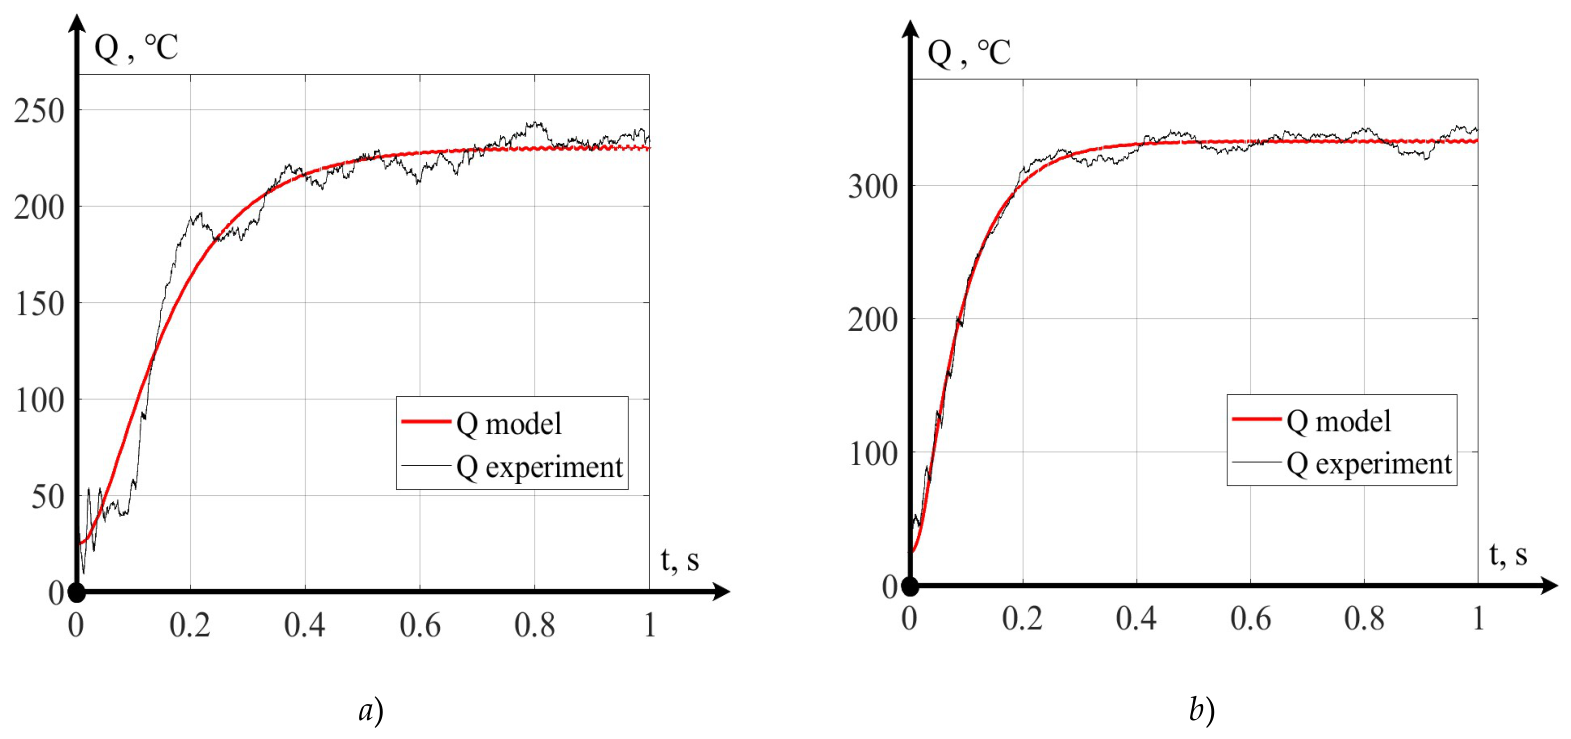
Table 2.
Some of the cutting mode parameters.
| Parameter | Experimental point | |||||
|---|---|---|---|---|---|---|
| 1 | 2 | 3 | 4 | 5 | 6 | |
| Workpiece rotation speed, n, rpm | 465 | 483 | 518 | 545 | 624 | 650 |
| Cutting speed, Vc, m/min | 200 | |||||
| Feed rate, S, mm/rev | 0.21 | |||||
| Cutting depth, tp, mm | 0.5 | |||||
Table 3.
Cutting tool flank wear.
| Parameter measured | Experimental point | |||||
|---|---|---|---|---|---|---|
| 1 | 2 | 3 | 4 | 5 | 6 | |
| Wear on the main flank face, hf, mm | 0 | 0.08 | 0.28 | 0.32 | 0.40 | 0.45 |
| Wear on the auxiliary flank face, ha, mm | 0 | 0.4 | 0.41 | 0.43 | 0.48 | 0.55 |
Disclaimer/Publisher’s Note: The statements, opinions and data contained in all publications are solely those of the individual author(s) and contributor(s) and not of MDPI and/or the editor(s). MDPI and/or the editor(s) disclaim responsibility for any injury to people or property resulting from any ideas, methods, instructions or products referred to in the content. |
© 2026 by the authors. Licensee MDPI, Basel, Switzerland. This article is an open access article distributed under the terms and conditions of the Creative Commons Attribution (CC BY) license (http://creativecommons.org/licenses/by/4.0/).
Copyright: This open access article is published under a Creative Commons CC BY 4.0 license, which permit the free download, distribution, and reuse, provided that the author and preprint are cited in any reuse.


