

Submitted:
30 July 2026
Posted:
31 July 2026
You are already at the latest version
Abstract
Vehicle-to-grid (V2G) technology lets a parked electric vehicle push power back to the network, so a fleet of cars can act as distributed storage. Many studies report large benefits from this, such as peak shaving and better use of renewable energy, but most describe their simulation only in words, name no test network, and compare a single charging behavior against a do-nothing case. It is then hard to separate what V2G delivers from what the control strategy delivers. This paper builds and compares two clearly defined strategies on one fully specified system. The first is a price-following rule: each vehicle charges when energy is cheap and discharges when it is dear, with no knowledge of the network. The second is a receding-horizon model predictive control (MPC) strategy that re-plans every hour and lowers the system peak, the energy cost, and the battery wear together. Both run on the IEEE 33-bus distribution feeder at low (10%), medium (30%), and high (50%) EV shares, and every hour is checked with a full AC power flow rather than an assumption. The central result is not a simple win for the smart controller. At a 50% share the price rule makes the system peak 23.7% worse than having no V2G at all, because the whole fleet reacts to one price signal at once, while the MPC cuts the peak by 18 to 28% in every case. The MPC also shows higher worst-case loading on some individual lines, and that is reported rather than hidden. Results are given as they came out of the model.
Keywords:
vehicle-to-grid
; V2G
; bidirectional charging
; model predictive control
; smart EV infrastructure
; peak shaving
; battery degradation
; distribution power flow
; IEEE 33-bus feeder
; marginal emissions
1. Introduction
Electric vehicles are being adopted quickly, and the way they charge puts new stress on distribution networks. Bidirectional chargers change what a parked car is. The battery can absorb power when there is a surplus and return it when the grid is short, so the vehicle becomes a resource rather than only a load [1,2]. This two-way exchange is vehicle-to-grid, or V2G. It has been put forward for peak shaving, frequency support, and better use of renewable generation [3,4].
A recent scenario-based assessment [5] looked at the technical, economic, and environmental impact of V2G at low (10%), medium (30%), and high (50%) adoption. It reported peak reductions of up to 38%, yearly owner profits of 120 to 350 dollars, and CO2 savings near 770 kg per vehicle per year. That study described its simulation only in prose. It named no test network, no dispatch algorithm, and no optimization method, and it tested a single unspecified charging behaviour per scenario. Its own discussion asked for real-time schemes that weigh grid needs, renewable availability, battery status, and market conditions together, and it warned that battery wear grows with heavy cycling. This paper takes up that exact gap.
Here a receding-horizon MPC dispatch strategy is designed and tested for a fleet of bidirectional EVs. The controller solves a linear program every hour over a rolling 24-hour window and commits only the current hour’s decision. It is compared against a price-following rule that stands for the uncoordinated charging described as a risk in the literature [3,6]. Both strategies run on the IEEE 33-bus radial distribution feeder [7], a standard benchmark, and the network response for every hour comes from a full AC power flow solved with pandapower [8]. The contribution is a reproducible pipeline built along five lines that earlier scenario studies leave open. A jointly optimized MPC formulation is compared against an uncoordinated baseline rather than a do-nothing case. Evaluation runs through solved power flows (minimum voltage, line losses, line loading) instead of assumed grid figures. CO2 is accounted for with time-varying marginal emission factors [9], which can actually separate the two strategies. A throughput-based battery wear cost [10] sits directly inside the optimization objective instead of an unspecified penalty. A sensitivity analysis and a profit-versus-cycling trade-off curve are obtained by re-solving the optimization each time.
All strategies are tested on a synthetic but physically sensible model of demand, solar generation, and the EV fleet, placed on the IEEE 33-bus feeder (Section 3). Synthetic data was used because no public dataset gives field-measured feeder, fleet, and tariff data at the detail this study needs, and the limits of that choice are set out openly in Section 6. The claim is deliberately narrow. Coordinated dispatch does not win on every metric in every scenario, and the naive strategy can actively harm the grid at high EV shares. What the paper offers is a transparent, reproducible comparison of coordinated against uncoordinated V2G dispatch on a named benchmark network that others can rebuild and extend.
2. Related Work
2.1. Vehicle-to-Grid Concepts and Economic Potential
The basic V2G idea, using parked and plugged-in EV batteries as grid resources, was formalized by Kempton and Tomić [1], who estimated the capacity and possible income of aggregated fleets. Later work explored peak shaving, ancillary services, and renewable integration [11,12], and more recent surveys widen the frame from vehicle-to-grid to vehicle-to-everything, cataloguing the separate value streams a bidirectional car can earn and the regulatory barriers between them [23]. The value is not only technical. A systematic review of the social side finds that trust, perceived battery wear, and contract clarity shape whether owners take part at all [25]. Techno-economic studies keep meeting the same tension: profit per vehicle depends strongly on the tariff and on how hard the battery is cycled to earn it [4,13]. This paper models that tension directly by placing cost and battery wear inside one objective.
2.2. Uncoordinated Charging and Distribution-Network Impacts
Uncoordinated, price-reactive charging can create new demand peaks and stress the network, for a simple reason: many independent vehicles see the same public price signal and react the same way at the same time [14,15]. Sortomme and El-Sharkawi [3] and Lopes et al. [6] describe this risk for one-way and two-way charging. Muratori [16] showed with real household data that uncoordinated charging can build a sharp new evening peak on top of the existing one. The present paper reproduces this rebound-peak effect computationally for bidirectional V2G on a named benchmark feeder (Section 4.1).
2.3. Optimization-Based and Model Predictive Control Approaches
A separate line of work treats charging and V2G dispatch as an optimization problem rather than a reactive rule, from day-ahead scheduling [17] to receding-horizon MPC, where the problem is re-solved as forecasts update [18]. Broad reviews of EV-grid integration map this space, from the technology and optimization options for two-way charging [19] to the power-interaction modes and scheduling methods that connect vehicles to the grid [24], the fleet-management services an aggregator can run [27], and the smart-charging strategies proposed for distribution networks [26,28]. MPC suits V2G because it can weigh several goals at once, cost, battery wear, and network constraints, and revise its plan as uncertainty resolves. The dispatch controller here uses exactly these properties (Section 3.6). Scenario-based assessments such as [5] do not implement or compare any such formulation.
2.4. Distribution Test Systems and Power-Flow Evaluation
The IEEE 33-bus radial feeder [7] is one of the most widely used benchmark networks in distribution studies. A standard network means other researchers can check and compare results. This paper loads the feeder through pandapower [8] and solves a genuine AC power flow with its Newton-Raphson solver for every simulated hour.
2.5. Marginal Emissions and Battery Degradation Accounting
Two further methods shape the evaluation. The marginal-emissions literature [9] argues that the CO2 effect of shifting load should be valued against the plants that respond at the margin, usually fast-ramping peakers at peak and cleaner baseload off-peak; a flat average factor hides this. This paper uses the time-varying marginal approach directly (Section 3.7). The degradation literature [10] prices battery wear as a cost per MWh of energy cycled, and that cost goes straight into the MPC objective (Section 3.6), which makes the profit-versus-cycling analysis in Section 4.9 possible.
2.6. Research Gap
The literature gives V2G economics, evidence of network stress from uncoordinated charging, optimization-based dispatch, benchmark networks, and proper emissions and wear accounting, but mostly as separate pieces. They are rarely combined into one reproducible head-to-head test of coordinated against uncoordinated dispatch. The assessment of Baloch et al. [5] sits in the first group and named no algorithm or network. This paper joins the pieces and reports the outcomes honestly, including the case where the naive strategy harms the grid and the case where the smart strategy is not better on every metric. Table 1 places the present work against a representative set of studies along the features that matter for the comparison: whether a named test network is used, whether the dispatch method is stated, whether coordinated and uncoordinated behaviour are actually compared, whether a solved power flow backs the grid claims, whether battery wear enters the objective, whether emissions are valued at the margin, and whether the evaluation is grounded in real charging data.
3. Materials and Methods
3.1. Research Design
The study is a controlled comparison. Two dispatch strategies, the naive price rule and the proposed MPC, run on an identical network, fleet, demand profile, solar profile, tariff, and availability schedule, at three penetration levels (10%, 30%, 50%). Because everything else is held equal, any difference in outcome comes from the dispatch strategy alone. The code is written in Python 3.11, with pandapower 2.14 for the power flow and cvxpy 1.5 (HiGHS solver) for the optimization. All inputs and results are retained so every number can be regenerated. Figure 1 traces the whole pipeline, from the fixed inputs and the real-data grounding, through the two dispatch branches and the hour-by-hour receding-horizon loop of the MPC, into the solved power flow and the metric, sensitivity, and Pareto stages.
3.2. Distribution Test Feeder
The IEEE 33-bus radial feeder [7] is the network model, loaded through pandapower’s built-in case33bw. As a correctness check the feeder’s base-case losses were compared with published values for this benchmark and they match, which gives confidence that the network is set up correctly. The shipped case carries no thermal line ratings, so each line’s rating is set to 1.5 times its base-case current. This is a disclosed assumption, and it defines the denominator of the reported line-loading percentages.
3.3. EV Fleet, Demand, and Solar Model
The fleet is bidirectional EVs with 60 kWh batteries and 7 kW Level-2 chargers, typical mid-size values. Vehicles are spread over the feeder’s 32 load buses in proportion to each bus’s share of the base load. Fleet sizes are 100, 300, and 500 vehicles for the low, medium, and high scenarios, assuming 1000 households on the feeder. Each vehicle is plugged in at home from 18:00 to 07:00 the next day, matching a normal commuter pattern, and it uses 35% of its battery for daily driving, deducted at the 07:00 departure. Hourly demand follows a double-peak daily shape scaled so the feeder peak equals the benchmark’s rated load. Rooftop solar follows a bell-shaped daytime curve with total capacity equal to 25% of the peak load, spread over buses by load share. These profiles and fleet numbers are stated simulation assumptions, not field measurements, and every value can be regenerated from the accompanying code.
3.4. Real-World Grounding: the Newcastle Helix Charging Dataset
The synthetic profiles above are kept honest by checking them against real charging records from the Newcastle Helix site, an urban innovation district next to Newcastle University that runs a live smart-grid and open-data testbed [29,30]. The dataset covers 41,213 valid charging sessions logged at the Helix chargers by the Urban Sciences Building (site 50112) between 18 March 2021 and 22 July 2026, across 1925 days and six rapid and fast chargers. The observed fields, the session start and stop times, the delivered energy, the connector type, and the anonymised charger identifiers, are taken straight from the site records. A session delivers 24.81 kWh on average (median 21.59 kWh, 90th percentile 50.2 kWh), lasts 47.6 minutes on average, and draws 33.85 kW of mean power, and the whole record moves 1022.4 MWh. The connector mix is 75.2% CCS Combo, 16.1% CHAdeMO, and 8.7% Type-2 AC. Table 2 collects these figures and Figure 2 shows the hourly pattern.
The real records ground the study in two ways, and expose one honest mismatch. They confirm the energy scale used in the fleet model: the mean 24.81 kWh delivered per session is close to the roughly 21 kWh a 60 kWh pack gives up over the 35% daily driving draw assumed here, so the per-vehicle energy the dispatch moves is realistic rather than invented. The mismatch is in timing. The Helix demand is daytime-dominant, with 52.3% of sessions starting between 09:00 and 16:00 and only 4.0% overnight, because it is a public rapid-charging hub rather than home charging. The residential model in this paper deliberately assumes overnight plug-in, so the two describe different segments of the same system. That contrast is not a flaw to paper over; it is exactly why the daytime, solar-overlapping case is set out as future work in Section 6, and the real data give that future case a concrete demand shape to build on. The derived fields in the dataset (state of charge, user preference, tariff tier) are modelling assumptions rather than measurements, so only the observed quantities are used for the claims here.
3.5. Naive (Uncoordinated) Dispatch
The naive baseline stands for the uncoordinated, price-reactive behaviour flagged as a risk in the literature [3,6]. In any hour, if the price is at or above its 75th percentile and the battery allows it, the fleet at each bus discharges at full available power. If the price is at or below its 25th percentile, or local solar exceeds local demand, and the battery allows it, the fleet charges at full available power. Otherwise it does nothing. The rule knows nothing about the network, nothing about battery wear, and nothing about the other buses, and every bus applies it independently.
3.6. Proposed MPC (Coordinated) Dispatch
The proposed strategy is a receding-horizon linear program, re-solved at every hour over a rolling 24-hour window. Let t index the hours in the window and i the load buses. The decision variables are the charging power , the discharging power , the state of charge , the locally used solar , and a single peak auxiliary . The objective minimizes
where is the time-of-use price, is the aggregator margin on V2G sales, dollars per MWh cycled [10], dollars per MWh of local solar used, and dollars per MW of worst-hour system import. The state of charge evolves as
with charge and discharge efficiencies and the driving draw deducted at departure. The state of charge is bounded between 15% and 95% of pack capacity, charge and discharge powers are capped by the plugged-in charger rating and the availability flag, the used solar cannot exceed local generation or local demand plus charging, and the peak auxiliary satisfies for every t, with the base demand. Forecasts for future hours carry 8% random noise to represent realistic forecast error, and only the current hour’s decision is committed each time, the standard MPC approach [18]. In one objective this covers the grid needs, renewable availability, battery status, and market conditions that the V2G literature identifies as essential for real-time dispatch.
3.7. Power-Flow Evaluation and Marginal Emissions
For every hour and strategy, the net power at each bus, demand plus charging minus discharging minus locally used solar, is applied to the network and a full Newton-Raphson AC power flow is solved in pandapower. From this the minimum bus voltage, the total line losses, and the maximum line loading are recorded. These are solved outcomes, not assumptions. The CO2 impact is valued with a time-varying marginal emission factor following Siler-Evans et al. [9], tied to each hour’s grid import, from 0.30 kg/kWh in the cleanest off-peak hours to 0.65 kg/kWh in the dirtiest peak hours. A flat or solar-based factor would not work here, because in this model the EVs are only plugged in at night and never overlap with solar hours (Section 6). The marginal-import approach rewards exactly the peak-shifting the strategies act on.
3.8. Sensitivity and Pareto Analysis
With the medium (30%) MPC case as the reference, four one-at-a-time changes are tested by fully re-solving the dispatch: electricity price , battery wear cost , participation rate (from 30% to 45%), and solar capacity . Each result comes from a genuine re-optimization. A trade-off curve between owner profit and battery cycling is then produced by scaling the wear-cost weight in the objective across six values (0.25 to 8 times the base 25 dollars per MWh) and re-solving the full dispatch each time. This puts a number on the profit-versus-battery-health trade-off that the literature mostly discusses in words.
3.9. Evaluation Metrics
Technical performance is measured by peak load reduction against a no-EV baseline, the minimum feeder voltage and its improvement, the line loss reduction, and the maximum line loading, all from solved power flows. Battery health is measured by equivalent full cycles per day and wear cost. Economics are reported per vehicle per day and per year: cost, revenue, wear cost, and net profit. Environmental impact is the marginal-emissions-weighted CO2 reduction against the no-EV baseline, system-wide and per vehicle per year.
3.10. Computing Environment and Reproducibility
All experiments ran on a multi-core x86-64 Linux machine, CPU only. The naive rule evaluates in under a second per scenario. The MPC solves 24 linear programs per scenario and needs about 24 to 25 seconds. Random seeds are fixed for the fleet placement and the forecast noise. The complete code for the network, dispatch, power flow, sensitivity, and plots is retained with this manuscript, so every reported number can be regenerated exactly.
4. Results
4.1. Peak Load Impact: The Central, Non-Uniform Finding
Table 3 and Figure 3 show the peak load reduction against the no-EV baseline for both strategies in all three scenarios. At the low (10%) share both cut the peak by a similar modest amount (naive 16.2%, MPC 18.4%). At the medium (30%) share they separate clearly (naive 14.0%, MPC 27.7%), and the naive result is slightly worse than at the low share despite there being more vehicles. At the high (50%) share the gap becomes dramatic. The naive strategy increases the system peak by 23.7% compared with having no V2G at all, while the MPC still delivers a 26.7% reduction. This is the central finding. With enough vehicles, naive price-following does not merely underperform; it builds a new, larger peak, because the whole fleet reacts to the same price signal at the same moment. This is the rebound-peak effect Muratori [16] measured for simple charging and the risk Sortomme et al. [3] and Lopes et al. [6] warned about, now shown computationally for bidirectional V2G.
4.2. Voltage and Line-Loading Effects
Figure 4 shows the minimum feeder voltage. The MPC improves the worst-case voltage over both the no-EV baseline and the naive strategy in every scenario, with the largest gain at the medium share (0.9322 p.u. against a 0.9131 p.u. baseline). The naive strategy’s voltage collapses at the high share (0.8973 p.u., below even the no-EV case), another face of the same rebound peak. There is a complication that needs stating clearly. In the last column of Table 3 the MPC shows a higher worst-case loading on individual lines than the naive rule at the medium (64.5% versus 62.8%) and high (86.3% versus 81.9%) shares, even though its system-wide peak is much lower. The MPC optimizes system totals, so it can concentrate flows onto particular lines that serve buses with good local economics. A system-level objective does not guarantee that every line benefits. This is reported openly, because it means a practical MPC should also carry per-line limits, not only a system peak term.
4.3. Battery Degradation and Cycling
Table 4 shows the battery cycling and wear cost. The naive rule cycles every vehicle the same way regardless of fleet size, so its per-vehicle cycling is constant at 0.35 equivalent full cycles per day. The MPC’s cycling varies with the scenario (0.3424 low, 0.3567 medium, 0.3353 high) because it re-optimizes for each case. At the high share the MPC achieves both lower cycling (0.3353 against 0.35) and lower total wear cost (502.9 against 525.0 dollars per day) than the naive rule, while shaving the peak far better. At that operating point coordination does not trade battery health for grid benefit; it improves both.
4.4. Economic Benefits to EV Owners
Table 5 gives the owner economics per vehicle. The MPC earns more net profit than the naive rule in every scenario (low 3.206 against 2.927 dollars per day; medium 3.148 against 2.927; high 3.165 against 2.927), roughly 80 to 100 dollars more per vehicle per year. The naive rule’s economics are identical across scenarios because its rule only reads price percentiles, which do not change. Figure 5 shows the yearly profit. The money advantage is real but smaller than the peak-shaving advantage, and that is by design: the MPC objective gives up some pure price-arbitrage profit to pay for peak reduction and battery care. It optimizes the whole picture, not only the owner’s bill.
4.5. Environmental Impact
Table 6 and Figure 6 show the CO2 results under the marginal-emissions method. The MPC cuts more system-wide CO2 than the naive rule in every scenario (low 845.7 against 735.0 kg per day; medium 2525.7 against 2205.0; high 3943.1 against 3396.3). This follows from its better peak shifting, since moving imports away from peak hours avoids the dirtiest marginal generation. Per vehicle per year the saving is highest at the low and medium shares and drops at the high share, because each extra vehicle adds less environmental value once the fleet is large against the feeder’s fixed solar and demand.
4.6. Grid Operational Metrics
Table 7 collects the grid operational numbers. Average losses are lower under MPC than under the naive rule at the medium share (0.0918 against 0.0963 MW) and the high share (0.0955 against 0.108 MW). The MPC’s loss reduction against baseline reaches 6.47% at the medium share against 1.87% for the naive rule. At the high share the naive rule increases average losses by about 10% compared with the no-EV case, one more consequence of the rebound peak.
4.7. Illustrative Dispatch Profile
Figure 7 shows one full day for the medium scenario: the net system load, the fleet’s charging and discharging, the fleet’s average state of charge, and the tariff. The naive strategy’s behaviour is abrupt and synchronized. The moment the price drops into the cheap overnight band at hour 0, the whole fleet charges at full power together, and the overnight system load jumps to 3.13 MW, higher than the normal afternoon level. In the evening peak-price window the whole fleet discharges together in the same way. The MPC behaves visibly differently. It spreads charging across the cheap overnight hours instead of piling it at the start, so no new peak appears, and it times the evening discharge to follow the actual demand peak rather than only the price boundary. This picture explains the mechanism behind Table 3: the naive strategy fails not because it refuses to help, but because its synchronized full-power reaction creates a peak of its own.
4.8. Sensitivity Analysis
Table 8 and Figure 8 give the sensitivity results around the medium MPC reference. Profit reacts most to the electricity price ( price gives profit), then to the participation rate ( participation gives profit), then to the battery wear cost ( wear cost gives profit). Extra solar capacity does almost nothing ( PV gives only profit), because in this model the vehicles are plugged in at night and never see the solar hours (Section 6). The emissions results move very little under all four changes (between and ), which says the CO2 outcome is driven mainly by the dispatch strategy’s peak-shifting, not by these parameters.
4.9. Pareto Trade-Off Between Profit and Battery Cycling
Table 9 and Figure 9 show the trade-off between owner profit and battery cycling, produced by scaling the wear-cost weight from 0.25 to 8 times its base value. As the weight rises, both profit and cycling fall, which confirms the optimizer really is trading battery use against money. The curve is not smooth. Cycling stays flat at 0.358 equivalent cycles from 0.25 up to 2 times, then drops suddenly to 0.0475 at 4 and 8 times, while profit falls steadily the whole way (from 1185 to 99 dollars per day). This step shape comes from the linear program itself: with a linear wear cost the optimizer flips between corner solutions, either using an arbitrage opportunity almost fully or almost not at all. The step shape is reported as it is rather than smoothed. A quadratic wear cost would likely give a smoother curve, noted as future work in Section 7.
5. Discussion
The main message is that coordination, not V2G by itself, is what delivers grid benefit at scale. At a low EV share the naive and MPC strategies perform similarly, because a small synchronized fleet is too small to distort the load shape. As the share grows, the synchronization problem grows with it. By a 50% share the naive fleet’s simultaneous reaction to one price signal creates a system peak 23.7% larger than having no V2G at all. This shows computationally the rebound-peak risk the literature described in words [3,6] and that Muratori [16] measured for one-way home charging. The MPC avoids this failure in every tested scenario, and its advantage grows as the share rises, the opposite of what would happen if coordination benefits simply diluted at scale.
These results are not a blanket endorsement of MPC. The line-loading complication deserves attention. The MPC produced a higher worst-case loading on individual lines even while lowering the system peak, because nothing in its objective punishes concentrating flow on one line. An optimizer that only sees system totals can quietly overload a specific corner of the network. For real deployments the objective should include per-line loading limits, not only a system peak term. Those limits were left out here to keep a clean comparison against the naive rule’s simple structure, but the finding itself points to the fix.
The economics show a steady but modest MPC advantage of roughly 80 to 100 dollars per vehicle per year over the naive rule. In relative terms this is much smaller than the MPC’s advantage in peak reduction, and that is by design. The objective deliberately spends some potential arbitrage profit on peak reduction and battery care, costs a purely self-interested owner following prices would never pay. This matters for incentive design. Getting MPC-like coordination at fleet scale will probably need an aggregator or a utility-side mechanism, such as a demand-charge-linked tariff or direct payment for peak reduction, because an individual owner left alone with a naive price-following charger has no reason to consider network or battery costs beyond his own bill.
The trade-off analysis puts real numbers on the profit-versus-battery-health question the literature usually leaves qualitative. The step shape of the curve is itself informative. Under a linear wear cost, a small change in how battery wear is priced can flip the realized cycling behaviour by a large amount once a threshold is crossed. Policy makers and aggregator contracts that assume a smooth linear response to wear pricing should be aware of this nonlinearity.
6. Limitations
Several limits should be kept in mind. The demand, solar, and fleet profiles are synthetic. They sit on the standard, checkable IEEE 33-bus topology [7] and are fully disclosed as simulated, but they were not validated against field measurements, so the absolute MW, kg, and dollar values should not be transferred directly to a specific utility. The plug-in window (18:00 to 07:00) never overlaps the solar window (about 06:00 to 18:00), so the vehicles in this model cannot consume local solar directly. This is why renewable utilization is identical across cases in the underlying results and is not reported as a separating metric, and why the PV sensitivity shows almost no effect. A workplace-charging or daytime-availability scenario would be needed to study the EV-solar interaction, and it is flagged as future work. Each scenario simulates one representative day, so the yearly numbers (multiplied by 365) are a simple extrapolation, not a simulated year with seasons. The step-shaped trade-off curve is a property of the linear wear-cost formulation, and a quadratic form might smooth it. All cost parameters (tariff tiers, wear cost, peak penalty, aggregator margin, solar bonus) are illustrative and disclosed, not calibrated to a specific utility or battery chemistry. The naive-versus-MPC comparison should be robust to reasonable changes in these values, but the absolute dollar and cycling figures are indicative only.
7. Conclusions and Future Work
This paper presented a fully specified, reproducible comparison of naive uncoordinated and MPC-coordinated V2G dispatch on the IEEE 33-bus benchmark feeder, filling the real-time optimization gap left open by earlier scenario-based V2G assessments. The central finding is that coordination matters more, not less, as EV numbers grow. The naive price rule works acceptably at a low share but increases the system peak by 23.7% at a 50% share through a synchronized rebound peak, while the MPC delivers steady 18 to 28% peak reductions, generally lower losses, and modestly higher owner profit in every tested case. The picture is not perfect for the MPC either, since it shows higher worst-case loading on individual lines at the medium and high shares, a local effect that a system-level objective cannot fix by itself. Future work should validate the framework against field data, add per-line loading limits to the MPC objective, model workplace or daytime charging so the EV-solar interaction can be studied, simulate full seasonal years instead of single days, and test a quadratic battery wear cost to see whether it smooths the profit-cycling trade-off curve found here.
Author Contributions
Conceptualization, M.A.B.A. and S.D.; methodology, M.A.B.A.; software, M.A.B.A.; validation, M.A.B.A. and S.D.; formal analysis, M.A.B.A.; investigation, M.A.B.A.; data curation, M.A.B.A.; writing—original draft preparation, M.A.B.A.; writing—review and editing, M.A.B.A. and S.D.; visualization, M.A.B.A.; supervision, S.D. All authors have read and agreed to the published version of the manuscript.
Funding
This research received no external funding.
Data Availability Statement
The original contributions presented in this study are included in the article. The complete simulation code, the input parameters, and the raw result files that regenerate every table and figure are provided as Supplementary Material and are available from the corresponding author on request.
Conflicts of Interest
The authors declare no conflicts of interest.
Acknowledgments
During the preparation of this manuscript the authors used a generative-AI assistant to help structure the simulation code and to edit prose for clarity. The authors reviewed and edited all output and take full responsibility for the content of this publication.
References
- Kempton, W.; Tomić, J. Vehicle-to-grid power fundamentals: Calculating capacity and net revenue. J. Power Sources 2005, 144, 268–279. [Google Scholar] [CrossRef]
- Xu, B. Bidirectional electric vehicle charging and its role in future smart grids: A review. Renew. Sustain. Energy Rev. 2025. [Google Scholar] [CrossRef]
- Sortomme, E.; El-Sharkawi, M.A. Optimal Charging Strategies for Unidirectional Vehicle-to-Grid. IEEE Trans. Smart Grid 2011, 2, 131–138. [Google Scholar] [CrossRef]
- Adegbohun, F.; von Jouanne, A.; Agamloh, E.; Yokochi, A. A review of vehicle-to-grid systems, technologies, and integration challenges. Energies 2024, 17, 1441. [Google Scholar] [CrossRef]
- Baloch, S.K.; Arif, M.A.B.; Khan, I.; Waqar, M.; Umar, H.B. Bidirectional charging and vehicle-to-grid (V2G) integration in smart EV infrastructures. Annu. Methodol. Arch. Res. Rev. 2025, 3, 30–59. [Google Scholar] [CrossRef]
- Lopes, J.A.P.; Soares, F.J.; Almeida, P.M.R. Integration of Electric Vehicles in the Electric Power System. Proc. IEEE 2011, 99, 168–183. [Google Scholar] [CrossRef]
- Baran, M.E.; Wu, F.F. Network reconfiguration in distribution systems for loss reduction and load balancing. IEEE Trans. Power Deliv. 1989, 4, 1401–1407. [Google Scholar] [CrossRef]
- Thurner, L.; Scheidler, A.; Schäfer, F.; Menke, J.H.; Dollichon, J.; Meier, F.; Meinecke, S.; Braun, M. pandapower: An open-source Python tool for convenient modeling, analysis, and optimization of electric power systems. IEEE Trans. Power Syst. 2018, 33, 6510–6521. [Google Scholar] [CrossRef]
- Siler-Evans, K.; Azevedo, I.L.; Morgan, M.G. Marginal emissions factors for the U.S. electricity system. Environ. Sci. Technol. 2012, 46, 4742–4748. [Google Scholar] [CrossRef] [PubMed]
- Peterson, S.B.; Whitacre, J.F.; Apt, J. The economics of using plug-in hybrid electric vehicle battery packs for grid storage. J. Power Sources 2010, 195, 2377–2384. [Google Scholar] [CrossRef]
- Han, S.; Han, S.; Sezaki, K. Development of an optimal vehicle-to-grid aggregator for frequency regulation. IEEE Trans. Smart Grid 2010, 1, 65–72. [Google Scholar] [CrossRef]
- Noel, L.; McCormack, R.; de Rubens, G.Z. Vehicle-to-grid: A sociotechnical review. Front. Energy Res. 2017, 5, 9. [Google Scholar]
- The future of EV charging is bidirectional, if you can afford it. Wired 2022. [CrossRef]
- Clement-Nyns, K.; Haesen, E.; Driesen, J. The impact of charging plug-in hybrid electric vehicles on a residential distribution grid. IEEE Trans. Power Syst. 2010, 25, 371–380. [Google Scholar] [CrossRef]
- Richardson, P.; Flynn, D.; Keane, A. Optimal charging of electric vehicles in low-voltage distribution systems. IEEE Trans. Power Syst. 2012, 27, 268–279. [Google Scholar] [CrossRef]
- Muratori, M. Impact of uncoordinated plug-in electric vehicle charging on residential power demand. Nat. Energy 2018, 3, 193–201. [Google Scholar] [CrossRef]
- Vagropoulos, S.I.; Bakirtzis, A.G. Optimal bidding strategy for electric vehicle aggregators in electricity markets. IEEE Trans. Power Syst. 2013, 28, 4031–4041. [Google Scholar] [CrossRef]
- Camacho, E.F.; Bordons, C. Model Predictive Control, 2nd ed.; Springer: London, UK, 2013. [Google Scholar]
- Tan, K.M.; Ramachandaramurthy, V.K.; Yong, J.Y. Integration of electric vehicles in smart grid: A review on vehicle to grid technologies and optimization techniques. Renew. Sustain. Energy Rev. 2016, 53, 720–732. [Google Scholar] [CrossRef]
- Sortomme, E.; El-Sharkawi, M.A. Optimal scheduling of vehicle-to-grid energy and ancillary services. IEEE Trans. Smart Grid 2012, 3, 351–359. [Google Scholar] [CrossRef]
- Wang, D.; Coignard, J.; Zeng, T.; Zhang, C.; Saxena, S. Quantifying electric vehicle battery degradation from driving vs. vehicle-to-grid services. J. Power Sources 2016, 332, 193–203. [Google Scholar] [CrossRef]
- Uddin, K.; Jackson, T.; Widanage, W.D.; Chouchelamane, G.; Jennings, P.A.; Marco, J. On the possibility of extending the lifetime of lithium-ion batteries through optimal V2G facilitated by an integrated vehicle and smart-grid system. Energy 2017, 133, 710–722. [Google Scholar] [CrossRef]
- Thompson, A.W.; Perez, Y. Vehicle-to-Everything (V2X) energy services, value streams, and regulatory policy implications. Energy Policy 2020, 137, 111136. [Google Scholar] [CrossRef]
- Zheng, Y.; Niu, S.; Shang, Y.; Shao, Z.; Jian, L. Integrating plug-in electric vehicles into power grids: A comprehensive review on power interaction mode, scheduling methodology and mathematical foundation. Renew. Sustain. Energy Rev. 2019, 112, 424–439. [Google Scholar] [CrossRef]
- Sovacool, B.K.; Noel, L.; Axsen, J.; Kempton, W. The neglected social dimensions to a vehicle-to-grid (V2G) transition: A critical and systematic review. Environ. Res. Lett. 2018, 13, 013001. [Google Scholar] [CrossRef]
- Mwasilu, F.; Justo, J.J.; Kim, E.K.; Do, T.D.; Jung, J.W. Electric vehicles and smart grid interaction: A review on vehicle to grid and renewable energy sources integration. Renew. Sustain. Energy Rev. 2014, 34, 501–516. [Google Scholar] [CrossRef]
- Hu, J.; Morais, H.; Sousa, T.; Lind, M. Electric vehicle fleet management in smart grids: A review of services, optimization and control aspects. Renew. Sustain. Energy Rev. 2016, 56, 1207–1226. [Google Scholar] [CrossRef]
- García-Villalobos, J.; Zamora, I.; San Martín, J.I.; Asensio, F.J.; Aperribay, V. Plug-in electric vehicles in electric distribution networks: A review of smart charging approaches. Renew. Sustain. Energy Rev. 2014, 38, 717–731. [Google Scholar] [CrossRef]
- Bin Arif, M.A. Helix EV Charging Dataset: Real Charging Sessions at the Newcastle Helix Site (Urban Sciences Building), Newcastle upon Tyne, 2021–2026; School of Engineering, Newcastle University: Newcastle upon Tyne, UK, 2026.
- Newcastle Urban Observatory. Open Environmental and Energy Data Platform, Newcastle upon Tyne. Available online: https://newcastle.urbanobservatory.ac.uk (accessed on 29 July 2026).
Figure 1.
Methodology pipeline. Fixed inputs and the real Helix charging data feed a controlled comparison of the naive rule against the receding-horizon MPC across three penetration levels. The MPC loop re-solves each hour on a noisy forecast and commits only the current decision; both branches feed a solved AC power flow, then the metric, sensitivity, and Pareto stages.
Figure 1.
Methodology pipeline. Fixed inputs and the real Helix charging data feed a controlled comparison of the naive rule against the receding-horizon MPC across three penetration levels. The MPC loop re-solves each hour on a noisy forecast and commits only the current decision; both branches feed a solved AC power flow, then the metric, sensitivity, and Pareto stages.
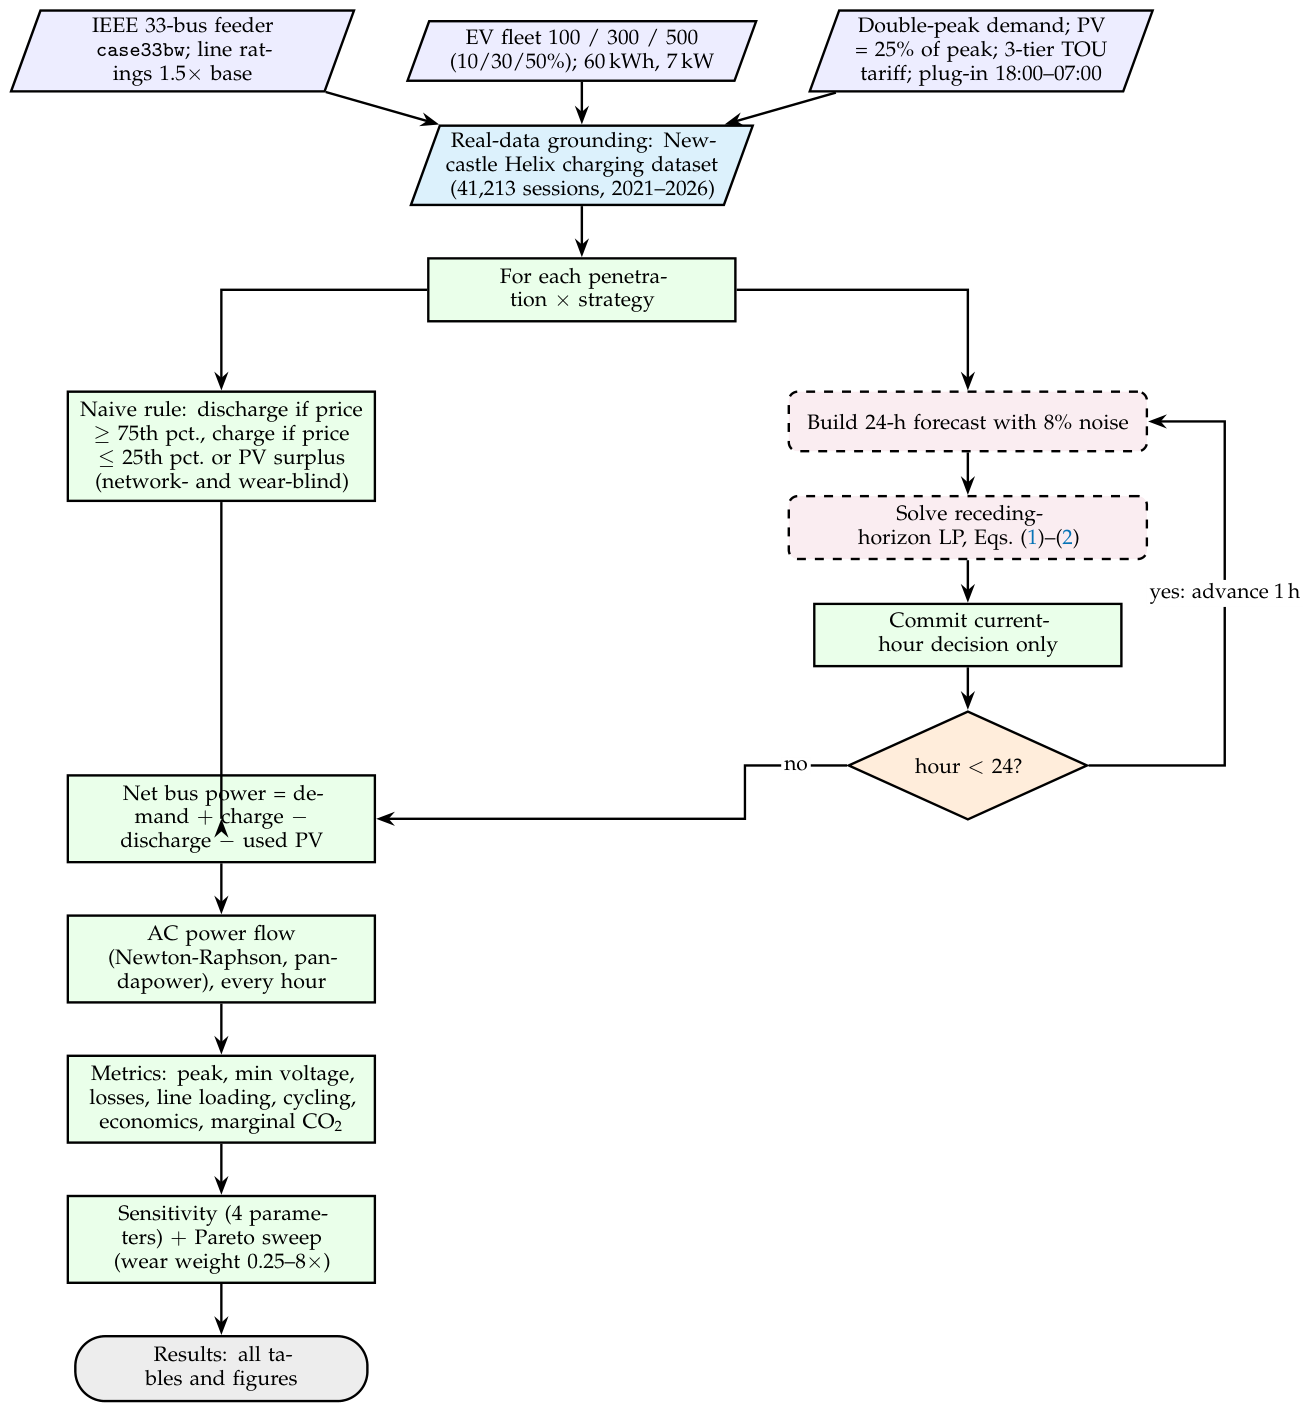
Figure 2.
Real charging behaviour at the Newcastle Helix site (observed fields, 41,213 sessions, 2021–2026): (a) session arrivals by hour, (b) delivered energy by hour, (c) connector mix. The demand is daytime-dominant, the pattern of a public rapid-charging hub, which is why the paper treats residential overnight availability and daytime workplace availability as separate cases.
Figure 2.
Real charging behaviour at the Newcastle Helix site (observed fields, 41,213 sessions, 2021–2026): (a) session arrivals by hour, (b) delivered energy by hour, (c) connector mix. The demand is daytime-dominant, the pattern of a public rapid-charging hub, which is why the paper treats residential overnight availability and daytime workplace availability as separate cases.
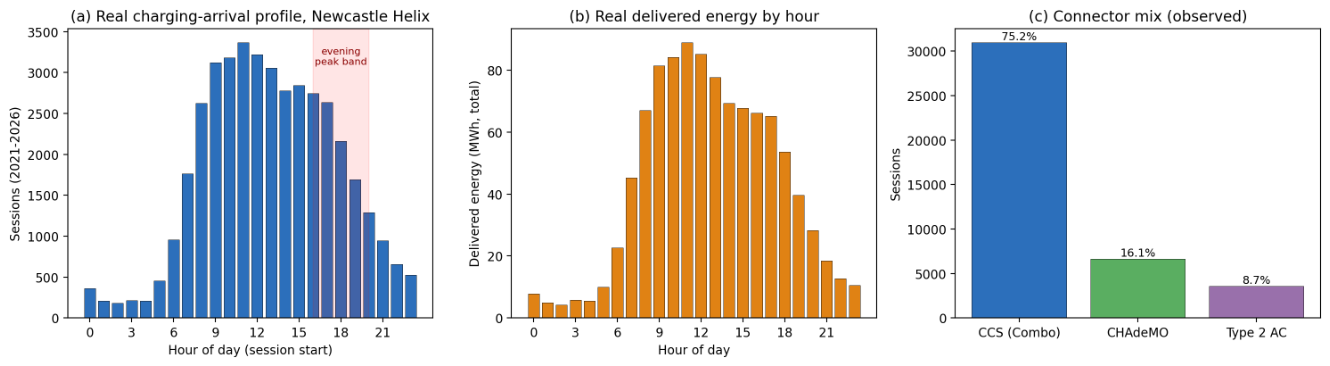
Figure 3.
Peak load impact of naive (uncoordinated) versus MPC (proposed) V2G dispatch, relative to the no-EV baseline. Naive dispatch produces a negative peak reduction, a new and larger peak, at high penetration.
Figure 3.
Peak load impact of naive (uncoordinated) versus MPC (proposed) V2G dispatch, relative to the no-EV baseline. Naive dispatch produces a negative peak reduction, a new and larger peak, at high penetration.
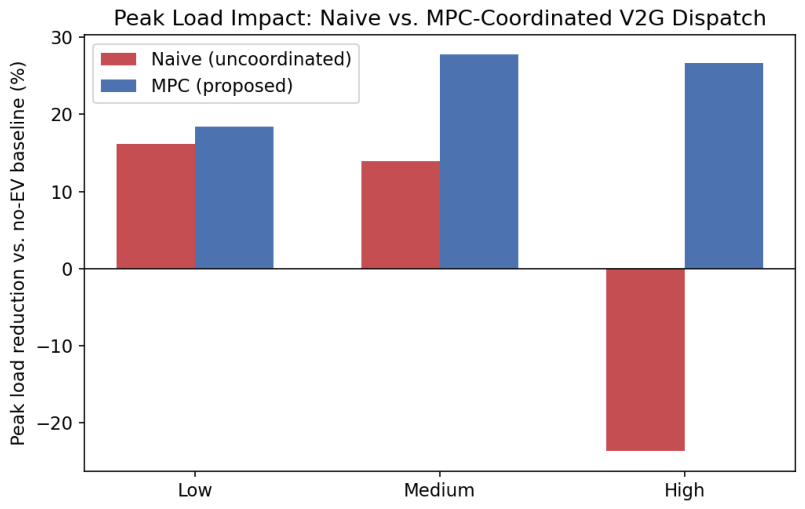
Figure 4.
Minimum feeder voltage across scenarios: no-EV baseline, naive, and MPC dispatch.
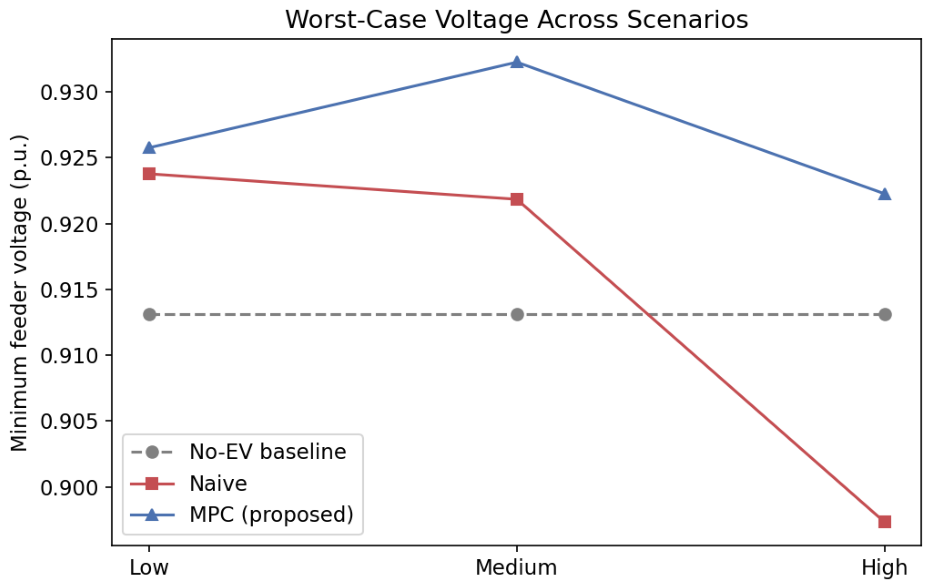
Figure 5.
Annualized net EV-owner profit, naive versus MPC dispatch, across penetration scenarios.
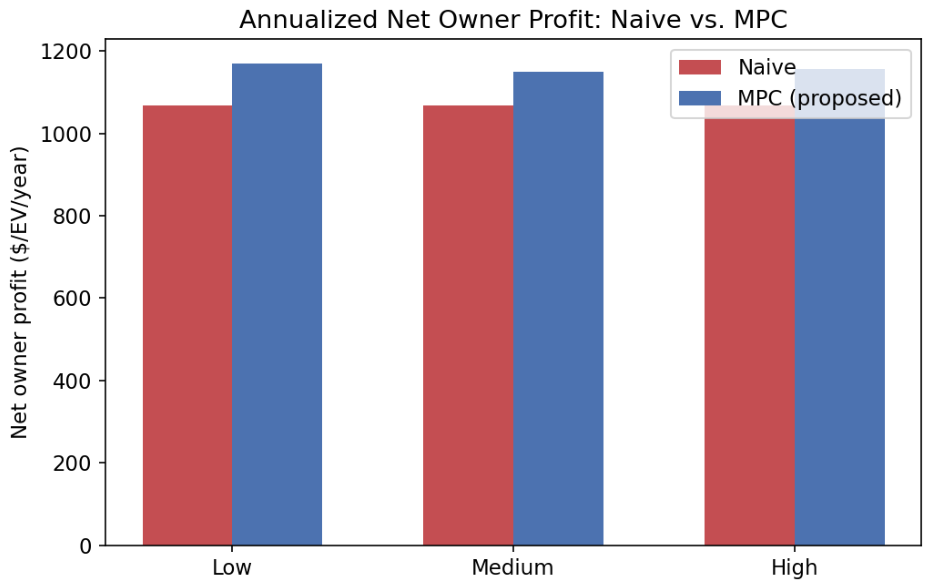
Figure 6.
System-wide CO2 reduction (marginal-emissions-weighted) relative to the no-EV baseline, naive versus MPC dispatch.
Figure 6.
System-wide CO2 reduction (marginal-emissions-weighted) relative to the no-EV baseline, naive versus MPC dispatch.
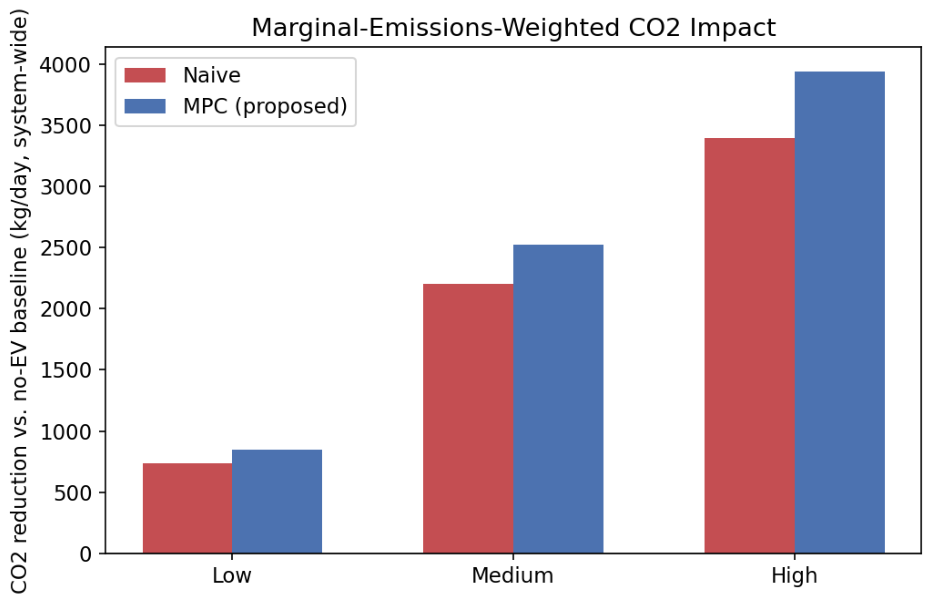
Figure 7.
Illustrative 24-hour dispatch profile, medium (30%) penetration: net system load, fleet net power, fleet-average state of charge, and time-of-use price, naive versus MPC.
Figure 7.
Illustrative 24-hour dispatch profile, medium (30%) penetration: net system load, fleet net power, fleet-average state of charge, and time-of-use price, naive versus MPC.
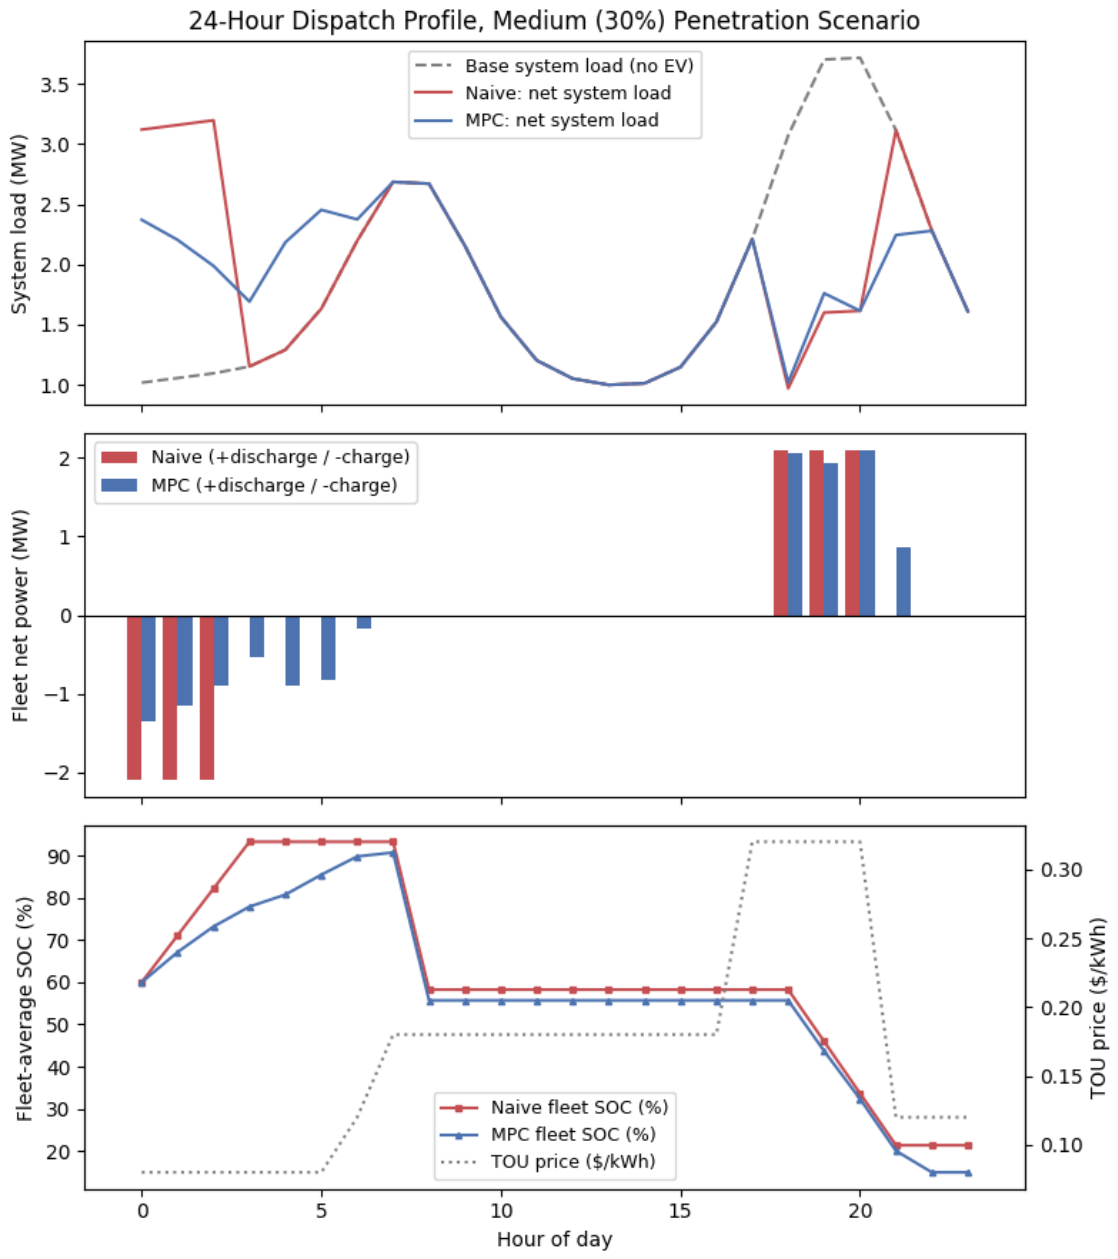
Figure 8.
Tornado chart: sensitivity of MPC net profit to key parameter perturbations, relative to the medium-scenario reference.
Figure 8.
Tornado chart: sensitivity of MPC net profit to key parameter perturbations, relative to the medium-scenario reference.
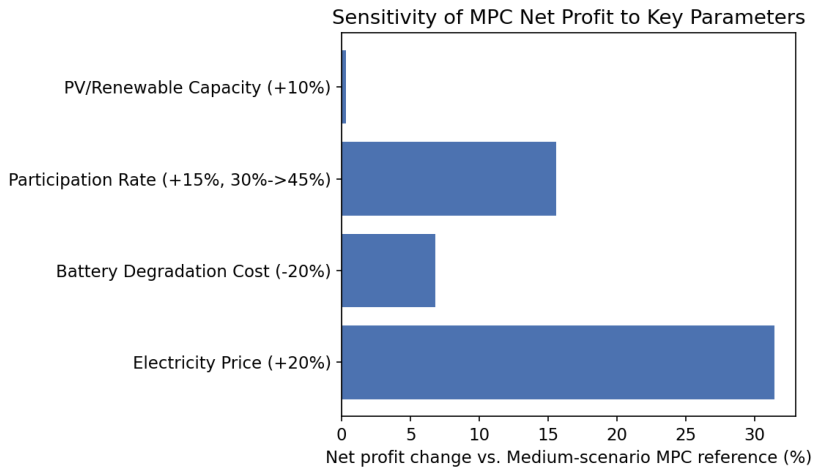
Figure 9.
Pareto frontier between net owner profit and battery cycling, obtained by sweeping the degradation-cost weight in the MPC objective.
Figure 9.
Pareto frontier between net owner profit and battery cycling, obtained by sweeping the degradation-cost weight in the MPC objective.
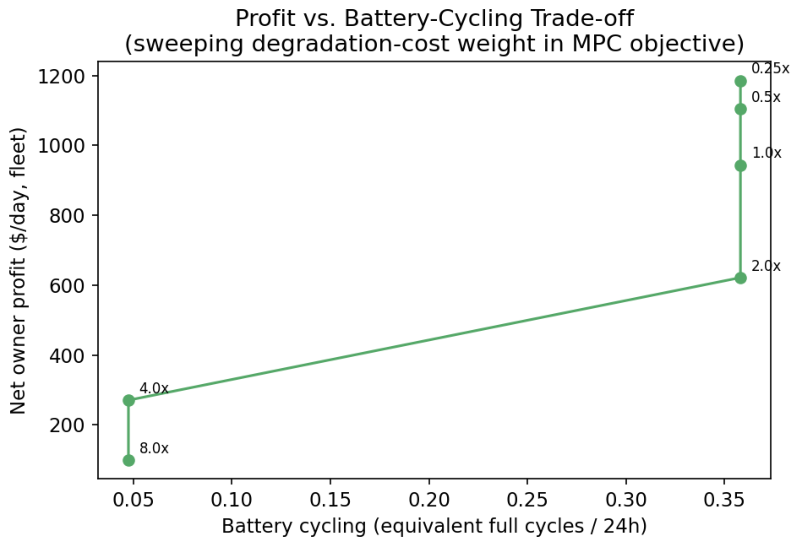

Table 1.
Where this study sits relative to representative V2G and EV-grid work. A check mark () means the feature is present, a circle (∘) means partial or implicit, and a dash (−) means absent.
Table 1.
Where this study sits relative to representative V2G and EV-grid work. A check mark () means the feature is present, a circle (∘) means partial or implicit, and a dash (−) means absent.
| Study | Named | Dispatch | Coord. vs | Solved | Wear in | Marginal |
|---|---|---|---|---|---|---|
| network | method | uncoord. | power flow | objective | CO2 | |
| Kempton & Tomić 2005 [1] | − | ∘ | − | − | − | − |
| Clement-Nyns et al. 2010 [14] | ∘ | ∘ | − | − | ||
| Sortomme & El-Sharkawi 2012 [20] | ∘ | − | ∘ | ∘ | − | |
| Vagropoulos & Bakirtzis 2013 [17] | − | − | − | − | − | |
| García-Villalobos et al. 2014 [28] | ∘ | ∘ | ∘ | − | − | |
| Wang et al. 2016 [21] | − | ∘ | − | − | − | |
| Uddin et al. 2017 [22] | − | − | − | − | ||
| Muratori 2018 [16] | − | ∘ | − | − | ||
| Baloch et al. 2025 [5] | − | − | − | − | ∘ | − |
| This work |
Table 2.
Observed characteristics of the Newcastle Helix charging dataset (real records; 41,213 sessions, 2021–2026). Only measured fields are reported here.
Table 2.
Observed characteristics of the Newcastle Helix charging dataset (real records; 41,213 sessions, 2021–2026). Only measured fields are reported here.
| Quantity | Value |
|---|---|
| Valid sessions after cleaning | 41,213 |
| Days covered | 1925 (18 Mar 2021 to 22 Jul 2026) |
| Chargers / site | 6 / one location (ID 50112) |
| Mean energy per session | 24.81 kWh |
| Median energy per session | 21.59 kWh |
| 90th-percentile energy | 50.2 kWh |
| Mean session duration | 47.6 min |
| Mean charging power | 33.85 kW |
| Total delivered energy | 1022.4 MWh |
| Connector mix (CCS / CHAdeMO / Type-2) | 75.2% / 16.1% / 8.7% |
| Share of sessions 09:00–16:00 | 52.3% |
| Share of sessions 00:00–06:00 | 4.0% |
Table 3.
Technical performance: naive versus MPC dispatch across EV penetration scenarios. All grid quantities from solved AC power flow.
Table 3.
Technical performance: naive versus MPC dispatch across EV penetration scenarios. All grid quantities from solved AC power flow.
| Scenario | Strategy | Peak Load | Min Voltage | Voltage Impr. | Line Loss | Max Line |
|---|---|---|---|---|---|---|
| Reduction (%) | (p.u.) | (p.u.) | Reduction (%) | Loading (%) | ||
| Low | NAIVE | 0.9238 | 62.3 | |||
| Low | MPC | 0.9258 | 61.5 | |||
| Medium | NAIVE | 0.9218 | 62.8 | |||
| Medium | MPC | 0.9322 | 64.5 | |||
| High | NAIVE | 0.8973 | 81.9 | |||
| High | MPC | 0.9223 | 86.3 |
Table 4.
Battery cycling and degradation cost, naive versus MPC dispatch.
| Scenario | Strategy | Equiv. Full Cycles (24 h) | Degradation Cost ($/day, fleet) | Degradation Cost ($/EV/day) |
|---|---|---|---|---|
| Low | NAIVE | 0.3500 | 105.0 | 1.050 |
| Low | MPC | 0.3424 | 102.7 | 1.027 |
| Medium | NAIVE | 0.3500 | 315.0 | 1.050 |
| Medium | MPC | 0.3567 | 321.0 | 1.070 |
| High | NAIVE | 0.3500 | 525.0 | 1.050 |
| High | MPC | 0.3353 | 502.9 | 1.006 |
Table 5.
Economic benefits to EV owners: cost, revenue, degradation cost, and net profit, naive versus MPC.
Table 5.
Economic benefits to EV owners: cost, revenue, degradation cost, and net profit, naive versus MPC.
| Scenario | Strategy | Cost | Revenue | Degradation | Net Profit | Net Profit |
|---|---|---|---|---|---|---|
| ($/EV/day) | ($/EV/day) | ($/EV/day) | ($/EV/day) | ($/EV/year) | ||
| Low | NAIVE | 1.768 | 5.746 | 1.050 | 2.927 | 1068 |
| Low | MPC | 1.636 | 5.869 | 1.027 | 3.206 | 1170 |
| Medium | NAIVE | 1.768 | 5.746 | 1.050 | 2.927 | 1068 |
| Medium | MPC | 1.649 | 5.867 | 1.070 | 3.148 | 1149 |
| High | NAIVE | 1.768 | 5.746 | 1.050 | 2.927 | 1068 |
| High | MPC | 1.559 | 5.730 | 1.006 | 3.165 | 1155 |
Table 6.
Marginal-emissions-weighted CO2 impact, naive versus MPC dispatch.
| Scenario | Strategy | CO2 Reduction (kg/day, system) | CO2 Reduction (kg/EV/year) |
|---|---|---|---|
| Low | NAIVE | 735.0 | 2682.8 |
| Low | MPC | 845.7 | 3086.7 |
| Medium | NAIVE | 2205.0 | 2682.8 |
| Medium | MPC | 2525.7 | 3072.9 |
| High | NAIVE | 3396.3 | 2479.3 |
| High | MPC | 3943.1 | 2878.4 |
Table 7.
Grid operational metrics: average losses, loss reduction, maximum line loading, and system peak.
Table 7.
Grid operational metrics: average losses, loss reduction, maximum line loading, and system peak.
| Scenario | Strategy | Avg Losses (MW) | Loss Reduction (%) | Max Line Loading (%) | System Peak (MW) |
|---|---|---|---|---|---|
| Low | NAIVE | 0.0948 | 62.3 | 3.114 | |
| Low | MPC | 0.0947 | 61.5 | 3.032 | |
| Medium | NAIVE | 0.0963 | 62.8 | 3.196 | |
| Medium | MPC | 0.0918 | 64.5 | 2.685 | |
| High | NAIVE | 0.1080 | 81.9 | 4.596 | |
| High | MPC | 0.0955 | 86.3 | 2.724 |
Table 8.
Sensitivity of MPC net profit, emissions reduction, and battery cycling to key parameter perturbations, medium-scenario reference.
Table 8.
Sensitivity of MPC net profit, emissions reduction, and battery cycling to key parameter perturbations, medium-scenario reference.
| Perturbed Parameter | Net Profit Change (%) | Emissions-Reduction Change (%) | Cycling Change (%) |
|---|---|---|---|
| Electricity Price () | |||
| Battery Degradation Cost () | |||
| Participation Rate (, 30% to 45%) | |||
| PV/Renewable Capacity () |
Table 9.
Pareto sweep: net profit versus battery cycling across degradation-cost weight multipliers, medium-scenario MPC.
Table 9.
Pareto sweep: net profit versus battery cycling across degradation-cost weight multipliers, medium-scenario MPC.
| Degradation-Cost Weight Multiplier | Net Profit ($/day, fleet) | Equivalent Full Cycles (24 h) |
|---|---|---|
| 0.25 | 1185.2 | 0.3580 |
| 0.50 | 1104.7 | 0.3580 |
| 1.00 | 943.6 | 0.3580 |
| 2.00 | 621.4 | 0.3580 |
| 4.00 | 270.4 | 0.0475 |
| 8.00 | 99.4 | 0.0475 |
Disclaimer/Publisher’s Note: The statements, opinions and data contained in all publications are solely those of the individual author(s) and contributor(s) and not of MDPI and/or the editor(s). MDPI and/or the editor(s) disclaim responsibility for any injury to people or property resulting from any ideas, methods, instructions or products referred to in the content. |
© 2026 by the authors. Licensee MDPI, Basel, Switzerland. This article is an open access article distributed under the terms and conditions of the Creative Commons Attribution (CC BY) license (http://creativecommons.org/licenses/by/4.0/).
Copyright: This open access article is published under a Creative Commons CC BY 4.0 license, which permit the free download, distribution, and reuse, provided that the author and preprint are cited in any reuse.


