

Submitted:
30 July 2026
Posted:
31 July 2026
You are already at the latest version
Abstract
A In this study, the combustion behavior of Çayırhan coal under an oxygen atmosphere was investigated, and its combustion kinetics and thermodynamic parameters were determined. Thermal analyses (TGA, DTG, and DSC) revealed that the combustion process occurs in two consecutive steps. The first step, where 85% of the total weight loss takes place, requires a relatively low activation energy. Conversely, the second step, corresponding to the remaining 15% of the combustion, demands a significantly higher activation energy. Both combustion stages were analyzed using model-free isoconver-sional methods. The average activation energies were calculated as 139.65 ± 9.66 kJ/mol for the first stage and 402.27 ± 65.53 kJ/mol for the second stage. Subsequent kinetic modeling studies demonstrated that both combustion reactions are highly compatible with the diffusion mechanism. Following the determination of the most suitable reaction model, the Arrhenius pre-exponential factor (A) and other thermodynamic parameters of the activated complex (ΔS‡, ΔH‡ and ΔG‡) were successfully evaluated.
Keywords:
coal combustion
; Çayırhan coal
; isoconversional methods
; modeling methods
; thermal analysis
; thermodynamic parameters
1. Introduction
Energy, a fundamental input for social and economic development, is an indispensable component of modern life. Despite recent advancements in renewable energy technologies, fossil fuels maintain a dominant share within the global energy mix. Among these, coal, oil, and natural gas are hydrocarbon-based fossil fuels characterized by high carbon content. Due to limited domestic oil and natural gas reserves in Turkiye, along with the technical difficulties associated with large-scale natural gas storage, coal holds paramount importance for the country's energy strategy. For instance, as of late October 2024, coal-fired power plants constituted 19.1% of Turkiye's total installed power capacity [1]. Consequently, integrating domestic coal resources into the national economy is critical for ensuring energy security. However, the majority of Turkish coal reserves exhibit low carbon, high moisture, and high ash content [2,3]. To maximize the energy potential of these domestic resources, it is crucial to implement physical and chemical pre-treatments, determine their precise combustion behaviors, mitigate spontaneous combustion risks, and comprehensively evaluate the parameters influencing combustion efficiency.
Thermal analysis techniques, such as Thermogravimetric Analysis (TGA), Differential Thermogravimetry (DTG), and Differential Scanning Calorimetry (DSC), are indispensable tools for investigating the combustion and pyrolysis reactions of coals [4,5,6]. TGA measures mass changes as a function of temperature, whereas DTG monitors the rate of mass loss. In the DTG method, these mass changes are resolved as distinct peaks, which significantly enhances the accuracy of determining reaction initiation and termination temperatures. On the other hand, DSC evaluates the amount of heat absorbed or released during a reaction, with the resulting peak areas being directly proportional to the enthalpy change. These integrated techniques are widely utilized to study the kinetics and thermodynamics of coal combustion and pyrolysis. For instance, Zhang et al. investigated the thermal properties of three coal types with varying degrees of coalification, determining their ignition points and spontaneous combustion temperatures, and subsequently calculating combustion activation energies using the FWO and KAS methods [5]. Similarly, Dwivedi et al. examined the pyrolysis of low-rank and bituminous coals in a nitrogen atmosphere using TGA-DTG, employing the Friedman differential method for kinetic analysis. They reported that the pyrolysis activation energy varied over a wide range (34.66-396.52 kJ/mol), for the bituminous coal, whereas it remained within a narrow range (57.80-64.28 kJ/mol) for the low-rank coal [7]. Additionally, Wang et al. investigated the pyrolysis of Chinese bituminous coal using TGA data obtained at multiple heating rates. Applying the Doyle integral method, they established that the pyrolysis process conforms to a first-order reaction model and successfully calculated the corresponding thermodynamic parameters [4]. Furthermore, the pyrolysis of four low-to-medium rank coals under a helium atmosphere was studied by Yan et al., who utilized the FWO, KAS, Starink, and Friedman isoconversional methods to evaluate kinetic and thermodynamic profiles, plotting the variation of activation energy and thermodynamic quantities against the conversion fraction [8]. Finally, Fan et al. analyzed the combustion kinetics of pre-oxidized coals under various oxygen concentrations using the FWO and KAS methods [9].
This study focuses on coals from the Çayırhan region of Turkiye to systematically examine their combustion behavior. Although some research exists on this specific reserve, detailed thermal analysis and combustion kinetics studies remain highly limited in the literature. For instance, Kök et al. investigated the combustion behavior of Çayırhan coal using the Friedman differential method [10]. However, instead of calculating the activation energies at progressive conversion fractions (a) throughout the combustion process, they evaluated the reaction stage as a whole, reporting only a single, overall activation energy. In addition, their work lacked any thermodynamic evaluation of the process. To the best of our knowledge, beyond this highly limited literature, no detailed study has been conducted on the comprehensive thermal, kinetic, and thermodynamic behavior of Çayırhan coal. This study aims to address this significant gap by presenting a comprehensive evaluation. Initially, proximate, elemental, and calorimetric analyses were performed to characterize the physical and chemical properties of the coals. Subsequently, thermal analyses of the samples were carried out under a dynamic oxygen atmosphere (100 mL/min. flowing rate) utilizing simultaneous TGA-DTG-DSC techniques. Based on these experimental data, combustion kinetic parameters and thermodynamic quantities were rigorously calculated. In the kinetic evaluations, the model-free isoconversional methods of KAS and FWO were applied. For the thermodynamic assessments, Composite Method 1 (CM I) and Composite Method 2 (CM-II) were employed, allowing the determination of crucial thermodynamic parameters of the activated complex after identifying the most appropriate reaction model.
2. Materials and Methods
2.1. Experimental Section
Coal samples were collected from the Çayırhan region of Türkiye. These samples were first crushed using a jaw crusher and subsequently homogenized. To remove moisture, a 100 g portion of the coal sample was dried in an oven at 105°C for approximately 4 h until a constant weight was achieved. The moisture-free coal samples were pulverized to a fine powder below 250 µm using a ring grinder to prepare them for subsequent analyses. This prepared stock coal was subsequently utilized for all further measurements. Proximate analysis was conducted using a LECO TGA801 thermogravimetric analyzer, while ultimate analysis was performed using a LECO CHN-628 elemental analyzer, in accordance with ASTM D-5373 standards. Each analysis was performed in triplicate, and the average results are presented along with their corresponding standard deviations in Table 1. The obtained values indicate that the Çayırhan coal is characterized by a high volatile matter content and low fixed carbon. On one hand, volatile matter facilitates earlier ignition by lowering the coal's ignition temperature; on the other hand, it reduces the overall calorific value. Consequently, a high volatile matter content is undesirable as it acts as a key parameter that impairs combustion efficiency.
Additionally, the gross calorific value of the coal was determined using a LECO AC600 bomb calorimeter. The combustion process in this device was carried out using oxygen gas with a purity of 99.5%. The oxygen was supplied to the bomb at an average pressure of 31 bar, facilitated by an integrated oxygen filling and discharge station. Pure water with a pH of 6–8 was maintained at a constant temperature (around 15 °C) and utilized for heat transfer between the inner and outer jackets. A sample of approximately 1 g was weighed and placed into the combustion crucible. Following the analysis, which lasted an average of 6 minutes, the gross calorific value (GCV) was obtained. The net calorific value (NCV) is subsequently calculated from this gross calorific value by accounting for the latent heat of vaporization of all water content; reporting the net calorific value is considered more appropriate for practical applications. The calculated net calorific value for our coal sample was determined as 9899.34 ± 120.25 J/g.
TGA, DTG and DSC analyses were realized with TA Instruments SDT 650 apparatus. Prior to the thermal measurements, both temperature and mass calibrations of the simultaneous analyzer were meticulously performed. For the temperature calibration, high-purity indium (In) and tin (Sn) reference materials, provided by the manufacturer, were utilized. The temperature calibration was verified by measuring the melting points of these standards, yielding 156.6 ± 0.3°C for In and 231.9 ± 0.4°C for Sn, both of which are in excellent agreement with the certified values. For the mass calibration, certified standard weights supplied by the manufacturer were employed. The weight of a certified 20.05 mg standard was re-measured by the instrument, resulting in an average value of 20.04 ± 0.01 mg. Each calibration measurement was performed in triplicate, and the actual experimental runs were initiated only after ensuring the high precision and accuracy of these calibration steps.
Following the successful completion and verification of all calibration procedures, the experimental analysis of the coal samples was conducted under carefully optimized conditions. Mass transfer limitations are among the most common issues encountered in thermal measurements. To mitigate these effects, a small sample amount (approximately 10 mg) was utilized and spread evenly as a single, thin layer at the bottom of an alumina crucible. The thermal runs were performed from room temperature to 850°C. To satisfy the requirements of the kinetic evaluations, the heating rates were varied at 5, 10, and 15 °C/min. An oxygen atmosphere was selected to facilitate the combustion reactions, with a constant dynamic flow rate maintained at 100 mL/min.
2.2. Calculation Section
At the beginning of the study, combustion activation energy values were calculated using the KAS and FWO methods, which are integral-isoconversional methods widely used in academic literature. These methods are also known as model-free methods because they do not propose any model equation for the reaction mechanism. It is assumed that the model remains constant throughout the reaction. That is, the model does not change with reaction-combustion fraction (α), temperature and heating rate (β); it is the same during the reaction-combustion. The final equations of these methods are stated below [11,12,13,14].


α is known as reaction (combustion) ratio and calculates with this formula: α=(wi-wt)/(wi-wf) where wi, wt, and wf are the initial weight of the sample, the weight of the sample at the examined time t, and the final weight of the sample at the end of the process, respectively. A stands for the pre-exponential factor. Eα is the activation energy corresponding to the combustion ratio, g(α) is an unknown function of the combustion, T indicates temperature in Kelvin unit, and R is the gas constant (8.314 J.mol-1.K-1).
In these methods, the plots of lnβ/T2 versus 1/T (for KAS equation) and lnβ versus 1/T for FWO equation) graphs are prepared for each α constant, and activation energy values are calculated by using these slopes data.
To determine the reaction model, the KAS and FWO method equations are modified. Following this modification, the equations known in academic literature as Composite Method I (CM I) and Composite Method II (CM II), given below, are obtained [15,16,17].


In these methods, the process is performed for all combustion ratios in which the reaction occurs in a single β heating rate. That is, the reaction is examined as a whole, not in parts. The advantage of these methods is that there is no need to work with different heating rates, and at the same time, the dominant pattern in the reaction is determined. For the relevant heating rate, the temperature T values are determined from the thermogram for all α combustion ratios, and the g(α) function values are calculated. g(α) functions describe reaction model. Thirteen different g(α) functions are known in academic literature [18,19]. These functions depend on nucleation, reaction order controlled, phase boundary reaction controlled, and diffusion-controlled mechanisms. For each α value at a single heating rate (β); the values of ln[g(α)/T2] (for CM I method) or ln[g(α)] (for CM II method) were calculated and plotted versus 1000/T values. Similar calculations were repeated thirteen different g(α) functions and similar graphs were drawn. The most suitable kinetic model was selected, which showed the lowest standard deviation, and the activation energies obtained from the CM I and CM II methods that are compatible with those obtained from isoconversional procedure KAS and FWO methods with the best regression analysis (r2) value.
Activated complex (transition state) theory is used for calculation of ΔS‡, ΔH‡ and ΔG‡. Related equations are given as below.
A=(k.Tavg./h).eΔS‡/R
ΔH≠=Ea-RTavg.
ΔG‡= ΔH‡ - Tavg.ΔS‡
where, k is the Boltzmann constant (1.381x 10⁻²³ J.K-1), h denotes the Planck’s constant (6.626x10⁻³⁴ J.s), Tavg corresponds to the average reaction temperature and Ea stands the activation energy which was calculated from the slope of Composite Methods graphs for the selected model.
3. Results and Discussions
3.1. Thermal Analysis of Çayırhan Coal
In the literature, the thermal degradation of coals is widely reported to proceed through three primary stages: dehydration, combustion or pyrolysis, and mineral matter decomposition. The initial dehydration stage is typically completed at temperatures up to approximately 150°C. The subsequent stage, referred to as either pyrolysis or combustion, depends strictly on the carrier atmosphere employed; it is classified as pyrolysis under an inert atmosphere and as combustion when an oxygen or air atmosphere is utilized. During the final mineral decomposition stage, gas evolution occurs due to the breakdown of inorganic mineral matters natively present within the coal structure, such as clays, calcium carbonate, and magnesium carbonate [2,4,20]. Consistent with these literature trends, the TGA, DTG, and DSC curves of our sample, presented in Figure 1, clearly exhibit a similar three-stage degradation profile. However, distinct from most typical coals, the combustion stage of Çayırhan coal takes place in two consecutive steps. The first stage represents a rapid combustion phase where approximately 85% of the total combustion is completed. The second stage, by contrast, is a relatively slower process wherein the remaining 15% of the combustion phase is fulfilled.
The dehydration reaction started at room temperature for all heating rates. The final temperature varied depending on the heating rate, but averaged 108°C. The mass loss in this process averaged 6.18%. The DSC diagram shows that the process was endothermic (Figure 1c).
Following the completion of the dehydration step, the coal retains its thermal stability up to approximately 225°C without suffering any noticeable mass loss. The overall combustion process initiates at around 225°C and terminates at an average temperature of 604 °C, resulting in a total mass loss of 46.27%. The average enthalpy of combustion calculated from the DSC peak areas for the overall combustion process is 8251.56 ± 117.96 J/g. This value is slightly lower than the enthalpy value determined via the bomb calorimeter (9899.34 ± 120.25 J/g). This minor discrepancy is attributed to the inherent differences in the operating principles and experimental methodologies of the two techniques. Specifically, while the bomb calorimeter involves near-instantaneous combustion accompanied by rapid heating and cooling under sealed, oxygen-rich conditions, the DSC method subjects the sample to a relatively slower, highly controlled thermal regime governed by pre-programmed heating rates. A detailed examination of the TGA curve reveals that thiscombustion occurs with two distinct slopes (Figure 1a), where the first corresponds to major mass loss, whereas the second reflects a minor mass loss. This two-stage behavior is further supported by the DTG curve, which exhibits two consecutive peaks: a primary peak with a larger peak area associated with the major weight loss, and a secondary peak with a smaller area representing a lower percentage of mass consumption (Figure 1b). Furthermore, the DSC profile shows two main exothermic regions. The first exothermic region spans a broader temperature range and features a minor shoulder at its onset, while the second exothermic region covers a narrower interval and is characterized by a sharp peak (Figure 1c). Collectively, these thermal findings demonstrate that combustion does not proceed in a single step, but rather evolves through two consecutive stages defined as “Combustion 1” and “Combustion 2”, which were subsequently evaluated through individual kinetic and thermodynamic analyses.
Spanning an average temperature range of 225–496 °C across all heating rates, Combustion 1 accounts for a mass loss of approximately 39%, representing roughly 85% of the overall combustion process. At the onset of this stage, a subtle mass increase is detectable on the TG curve (Figure 1a), accompanied by a corresponding minor exothermic shoulder in the DSC profile (Figure 1c). This transient phenomenon stems from the adsorption of the supplied oxygen onto the coal surface, which occurs simultaneously with the onset of combustion. Because this oxygen adsorption is very limited in scope and quickly dominated by the primary combustion process, it manifests only as a brief, minor mass gain and a subtle thermal shoulder immediately before the main combustion regime. A similar phenomenon was reported by Nakdiyok during the study of the oxidation behavior of Tavşanlı coals at low temperatures. The authors noted partial mass increases in the 150–250 °C temperature interval, resulting from the adsorption of oxygen gas by the coal [6].
Depending on the heating rate, Combustion 2 occurs in the average temperature range of 496–604 °C, causing a mass loss of 7.11%. This corresponds to approximately 15% of the overall mass loss during the entire combustion process.
The thermal data obtained at all heating rates for both combustion stages are summarized in Table 2.
It is not surprising that the onset, end, and peak temperatures shift to higher values as the heating rate increases in both endothermic reactions. This is because a higher heating rate leads to a slight thermal lag in the sample, causing these temperature points to appear at higher values [21].
For Çayırhan Coal, the mineral decomposition reaction begins immediately after combustion. The reaction temperature range is approximately 630-745°C. The mass loss at the three heating rates for this endothermic reaction averages 6.66%.
3.2. Kinetic and Thermodynamic Analysis for Combustion Reactions of Çayırhan Coal
In this section, the combustion region, which was identified in the thermal analysis section, is examined in detail. This combustion process occurs through a two-step mechanism, where the first stage is faster and involves a major mass loss (Combustion 1), whereas the second stage is slower, exhibiting a minor mass loss and lower peak intensity (Combustion 2). To validate this behavior, the entire combustion region was initially evaluated as a single reaction step without any deconvolution or separation. The objective here was to monitor the distribution of activation energy and to confirm the validity of splitting the combustion region based on any sharp increase or decrease observed in the Ea values. This approach—evaluating the overall region kinetics to identify sharp fluctuations in activation energy and thereby justify the separation of overlapping reaction steps—was successfully implemented in our previous study on the thermal decomposition kinetics of uranium salts [22,23,24]. For this combined region, Ea values for different combustion ratios (α) were calculated using the FWO and KAS methods. The graph showing the variation of Ea with α is presented in Figure 2a. An examination of Figure 2a. confirms that dividing the combustion region into two distinct stages yields greater consistency. Specifically, up to a conversion fraction of α = 0.80, the activation energy values remain fairly close to one another, ranging between an average of 110 kJ/mol and 130 kJ/mol. However, beyond a = 0.80, a substantial increase in activation energy values is observed. This reveals that treating the entire combustion step as a single reaction would be inappropriate from kinetic and thermodynamic perspectives, and that dividing the process into two stages aligns well with the thermal analysis data
Using the initial and final temperature values given in Table 2, the combustion process was divided into two stages, and kinetic analysis was performed again for each stage. As seen in Figure 2.b, in Combustion 1, Ea values increase gradually up to a combustion ratio of α = 0.60. Then, a decrease in Ea values is observed up to α = 0.80. After α = 0.80, Ea values begin to increase again. This increase in this region may be considered as preparation for Combustion 2. The Ea values calculated using the KAS and FWO methods are consistent with each other. Avarage Ea values are 137.92 ± 9.75 and 141.38 ± 9.52 kJ/mol, respectively. The high reliability of the calculation is further supported by the regression analysis results, which yielded values of 0.997 ± 0.004 and 0.998 ± 0.003, respectively.
An examination of Figure 2c reveals that the Ea values for Combustion 2 are considerably higher and fluctuate over a broad range, varying between 340 and 540 kJ/mol. In this region, the activation energy exhibits a notable increase at both low (α = 0.20) and high conversion fractions (α = 0.85 and 0.90). One possible explanation for this increase is that mass and heat transfer limitations could potentially occur, affecting the diffusion of evolved gases or oxygen transport during these specific combustion ratios. The average Ea values calculated using the KAS and FWO methods are 405.82 ± 67.96 and 398.72 ± 64.67 kJ/mol, respectively.
Table 3 presents the Ea values, which were calculated using the KAS and FWO methods for different decomposition ratios of Combustion 1 and Combustion 2, along with the regression analysis values. High regression analysis values indicate high accuracy in the calculations. The initial stage of combustion requires low activation energy, making it a clearly efficient process in light of the net energy produced. Conversely, the second combustion stage—representing 15% of the total reaction—demands a remarkably high activation energy to start, which demonstrates reduced efficiency relative to the energy generated upon completion.
Subsequent to model-free kinetic analysis, efforts were concentrated on identifying the appropriate combustion kinetic model by testing 13 different model equations. When determining the most proper model equation, the following factors are considered together: i) The closeness of the activation energy value determined by each model to the average activation energy value calculated using model-free methods (using the KAS equation for CM I and the FWO equation for CM II) is evaluated. ii) High regression analysis values of the resulting graphs are evaluated. iii) If different heating rates have been examined, it is checked whether the activation energy values in the selected model are close to each other (low standard deviation) for each of these heating rates.
For Combustion 1, the graphs plotted using the CM I and CM II methods at each heating rate revealed that the most suitable model is the D3 model, which is a diffusion-based model. In this model, the gaseous products formed as a result of the reaction have difficulty leaving the system, or when working with the reactive gas, there are difficulties in the gas reaching the sample material. The relevant graphs are given in Figure 3.a and 3.b. The other thermodynamic parameters were calculated from best fits model equations and were tabulated in Table 4.
Modeling studies were also conducted for Combustion 2, where a diffusion-controlled mechanism was similarly found to be dominant. Specifically, the D2 model (two-dimensional diffusion, corresponding to a model index of 2) provided the best description of the process. The fact that the Ea -a curves differ significantly for both combustion stages in model-free evaluation is consistent with a varying diffusion index, pointing toward a shift in the diffusion mechanism. The kinetic curves obtained using this model are shown in Figure 3c and Figure 3d, while the calculated thermodynamic parameters of the activated complex are summarized in Table 5.
In diffusion-controlled reactions, as the reaction progresses, more diffusion problems occur, so the activation energy of the reaction gradually increases. Diffusion control, which is effective in the combustion 1 reaction, becomes more effective as it progresses towards the combustion 2 reaction, and the activation energy gradually increases. This situation is also explained in the academic literature. Çılgı and Ak formed a copolymer by reacting the N-(4-(3-Thienyl methylene)-oxycarbonylphenyl) maleimide monomer they synthesized with styrene and investigated the thermal decomposition kinetics of the resulting molecule. In the study, the activation energy showed a continuous upward trend. In the modeling study conducted for thermodynamic investigation purposes, it was found that the reaction was consistent with the D1 diffusion model [25]. Furthermore, Li and colleagues stated that the three-dimensional diffusion model (D3) is effective in the combustion kinetics of coal from the Chinese region [26].
ΔS‡ is a thermodynamic quantity that expresses the disorder of the system. Negative ΔS‡ values indicate that the activated complex has lower rotational and vibrational freedoms. Furthermore, positive ΔG‡ values indicate that combustion did not occur spontaneously and that heat input is a precursor to the reaction. The results are consistent with the academic literature [9,27].
4. Conclusions
The combustion of Çayırhan coal proceeds sequentially through two distinct thermal stages rather than a single-step process. This multi-step degradation behavior is substantiated by thermal analysis (TGA, DTA, and DSC) alongside kinetic and thermodynamic evaluations. As summarized in Table 6, a comprehensive comparison is presented between the average activation energies obtained via model-independent methods (KAS and FWO), model-fitting approaches (CM I and CM II), and various modeling methods for both combustion stages, demonstrating strong agreement across the applied kinetic models.
Primary combustion occurs predominantly during Stage I, accounting for approximately 85% of the total thermal degradation. Crucially, Stage I operates at a noticeably lower activation energy compared to Stage II, which imposes a higher energy barrier. Further kinetic analysis reveals that both stages are diffusion-controlled; as the reaction progresses, the contact of oxygen with the internal pore surfaces of the coal becomes increasingly restricted. Although both stages share a diffusion-based mechanism, they follow distinct kinetic pathways, with Stage I following a 2D diffusion model (D2) and Stage II transitioning to a 3D diffusion model (D3).
Consequently, from an energy optimization standpoint, it may be suggested that keeping controlled combustion systems primarily within Stage I could enhance overall thermal efficiency while reducing operational energy inputs. Overall, these findings offer functional insights for coal-based energy recovery processes and serve as a practical reference for researchers focusing on solid-state reaction kinetics and thermal degradation thermodynamics.
Author Contributions
Gülbanu Koyundereli Çılgı: Investigation, Conceptualization, Methodology, Writing – review & editing, Project administration. Elif Çavdar: Investigation, Formal analysis, Validation. All: authors have read and agreed to the published version of the manuscript.
Funding
The authors would like to thank Manisa Celal Bayar University Scientific Research Projects Unit (BAP 2024-129).
Data Availability Statement
All data generated or analyzed during this study are included in this published article. Furthermore, any additional raw data or specific datasets can be made available from the corresponding author upon reasonable request.
Conflicts of Interest
The author declares that they have no known competing financial interests or personal relationships that could have appeared to influence the work reported in this paper.
Acknowledgments
During the preparation of this manuscript, the authors used Gemini Flash (Google) for the purposes of English language editing, proofreading, and improving overall clarity. The authors have reviewed and edited the output and take full responsibility for the content of this publication.
Abbreviations
The following abbreviations are used in this manuscript:
| TGA | Thermogravimetric Analysis |
| DTG | Differential Thermogravimetry |
| DSC | Differential Scanning Calorimetry |
| FWO | Flynn Wall Ozawa |
| KAS | Kissinger Akahira Sunose |
| CM I | Composite Method I |
| CM II | Composite Method II |
| GCV | Gross Calorific Value |
| NCV | Net calorific value |
References
- Köse, E.; Kutlu Kaynar, S. Energy Demand Forecasting and Policy Development in Turkey. Energies 2025, 18, 3301. [Google Scholar] [CrossRef]
- Naktiyok, J.; Özer, A.K. Investigation of Combustion Process of Different Coal by TGA Analysis. KSU J. Eng. Sci. 2022, 25(4), 691–701. [Google Scholar]
- Magalhães, D.; Kazanç, F.; Riaza, J.; Erensoy, S.; Kabaklı, Ö.; Chalmers, H. Combustion of Turkish lignites and olive residue: Experiments and kinetic modelling. Fuel 2017, 203, 868–876. [Google Scholar] [CrossRef]
- Wang, H.; Du, W.; Xi, Y.; Zhang, Y.; Wang, B.; Sun, Y. Non-Isothermal Thermogravimetric Analysis Study on the Pyrolysis Reaction Kinetics of Bituminous Coal. Chem. Eng. Technol. 2022, 45(6), 1048–1057. [Google Scholar] [CrossRef]
- Zhang, Y.; Zhang, Y.; Li, Y.; Shi, X.; Che, B. Determination of ignition temperature and kinetics and thermodynamics analysis of high-volatile coal based on differential derivative thermogravimetry. Energy 2022, 240, 122493. [Google Scholar] [CrossRef]
- Naktiyok, J. Investigation of the oxidation behavior of a Turkey coal at low temperature by TGA, FTIR and BET analysis. Energy Sources Part A 2020, 42(19), 2370–2380. [Google Scholar] [CrossRef]
- Dwivedi, K.K.; Shrivastav, P.; Karmakar, M.K.; Pramanick, A.K.; Chatterjee, P.K. A comparative study on pyrolysis characteristics of bituminous coal and low-rank coal using thermogravimetric analysis (TGA). Int. J. Coal Prep. Util. 2022, 42(1), 1–11. [Google Scholar]
- Yan, J.; Yang, Q.; Zhang, L.; Lei, Z.; Li, Z.; Wang, Z.; Ren, S.; Kang, S.; Shu, H. Investigation of kinetic and thermodynamic parameters of coal pyrolysis with model-free fitting methods. Carbon Resour. Convers. 2020, 3, 173–181. [Google Scholar] [CrossRef]
- Fan, H.; Wang, K.; Zhai, X.; Hu, L. Combustion Kinetics and Mechanism of Pre-Oxidized Coal with Different Oxygen Concentrations. ACS Omega 2021, 6(29), 19170–19182. [Google Scholar] [CrossRef] [PubMed]
- Kök, M. V.; Özbas, E.; Hicyılmaz, C.; Karacan, Ö. Effect of particle size on the thermal and combustion properties of coal. Thermochim. Acta 1997, 302, 125–130. [Google Scholar] [CrossRef]
- Conesa, J.A. Numerical Integration of Weight Loss Curves for Kinetic Analysis. Thermo 2021, 1, 32–44. [Google Scholar] [CrossRef]
- Ak, M.; Koyundereli Çılgı, G.; Kuru, F.D.; Cetişli, H. Thermal decomposition kinetics of polypyrrole and its star shaped copolymer. J. Therm. Anal. Calorim. 2013, 111, 1627–1632. [Google Scholar] [CrossRef]
- Söyleyici, S.; Koyundereli Çılgı, G. Thermal and kinetic analyses of 2,5-bis(2-hydroxyphenyl)thiazolo[5,4-d]thiazole. J. Therm. Anal. Calorim. 2014, 118, 705–709. [Google Scholar] [CrossRef]
- Jayaraman, K.; Kök, M.V.; Gökalp, İ. Combustion mechanism and model free kinetics of different origin coal samples: Thermal analysis approach. Energy 2020, 204, 117905. [Google Scholar] [CrossRef]
- Budrugeac, P.; Segal, E. On the use of Diefallah’s composite integral method for the non-isothermal kinetic analysis of heterogeneous solid-gas reactions. J. Therm. Anal. Calorim. 2005, 82, 677–680. [Google Scholar] [CrossRef]
- Koyundereli Çılgı, G. Effect of atmospheric condition on the thermal decomposition kinetics and thermodynamics of lead acetate trihydrate. Indian J. Chem. Technol. 2023, 30, 560. [Google Scholar] [CrossRef]
- Gabal, M.A. Non-Isothermal studies for the decomposition course of CdC2O4–ZnC2O4 mixture in air. Thermochim. Acta 2004, 412, 55–62. [Google Scholar] [CrossRef]
- Wendlant Wesley, W.M. Thermal Analysis, 3rd ed.; John Wiley: New York, 1986. [Google Scholar]
- Yanga, Y.; Lia, J. Investigation of macro-kinetics of coal-oxygen reactions under varying oxygen concentrations: Towards the understanding of combustion characteristics in underground coal fires. Process Saf. Environ. Prot. 2022, 160, 232–241. [Google Scholar] [CrossRef]
- Jankovića, B.; Manićb, N.; Radovićc, I.; Jankovićd, M.; Rajačić, M. Model-free and model-basedkineticsofthecombustionprocessoflowrank. Thermochim. Acta 2019, 178337. [Google Scholar] [CrossRef]
- Aboni Akodzi, M.C.; Girods, P.; Andzi-Barhé, T.; Rogaume, Y. Study of the Pyrolysis of Ayous and Kambala Co-Products: Kinetic Modeling of the Two Species. Thermo 2024, 4, 490–507. [Google Scholar] [CrossRef]
- Cetişli, H.; Koyundereli Çılgı, G.; Donat, R. Thermal and kinetic analysis of uranium salts Part 1. Uranium (VI) oxalate hydrates. J. Therm. Anal. Calorim. 2012, 108, 1213–1222. [Google Scholar] [CrossRef]
- Koyundereli Çılgı, G.; Cetişli, H.; Donat, R. Thermal and kinetic analysis of uranium salts Part 2. Uranium (VI) acetate hydrates. J. Therm. Anal. Calorim. 2012, 110, 127–135. [Google Scholar] [CrossRef]
- Koyundereli Çılgı, G.; Cetişli, H.; Donat, R. Thermal and kinetic analysis of uranium salts: Part III. Uranium(IV) oxalate hydrates. J. Therm. Anal. Calorim. 2014, 115, 2007–2020. [Google Scholar] [CrossRef]
- Koyundereli Çılgı, G.; Ak, M. Thermal degradation kinetics and thermodynamics of maleimide-sytrene based alternating copolymer: A comparative investigation of monomer and polymer structures. J. Mol. Struct. 2020, 221, 128879. [Google Scholar] [CrossRef]
- Lia, Q.; Xiao, Y.; Wang, C.; Deng, J.; Shu, C. Thermokinetic characteristics of coal spontaneous combustion based on thermogravimetric analysis. Fuel 2019, 250, 235–244. [Google Scholar] [CrossRef]
- Gao, M.; Cheng, C.; Miao, Z.; Wan, K.; He, Q. Physicochemical properties, combustion kinetics and thermodynamics of oxidized lignite. Energy 2023, 268, 12665. [Google Scholar] [CrossRef]
Figure 1.
TG (a), DTG (b) and DSC (c) graphs of Çayırhan Coal taken with a heating rate of 10oC.min-1.
Figure 1.
TG (a), DTG (b) and DSC (c) graphs of Çayırhan Coal taken with a heating rate of 10oC.min-1.
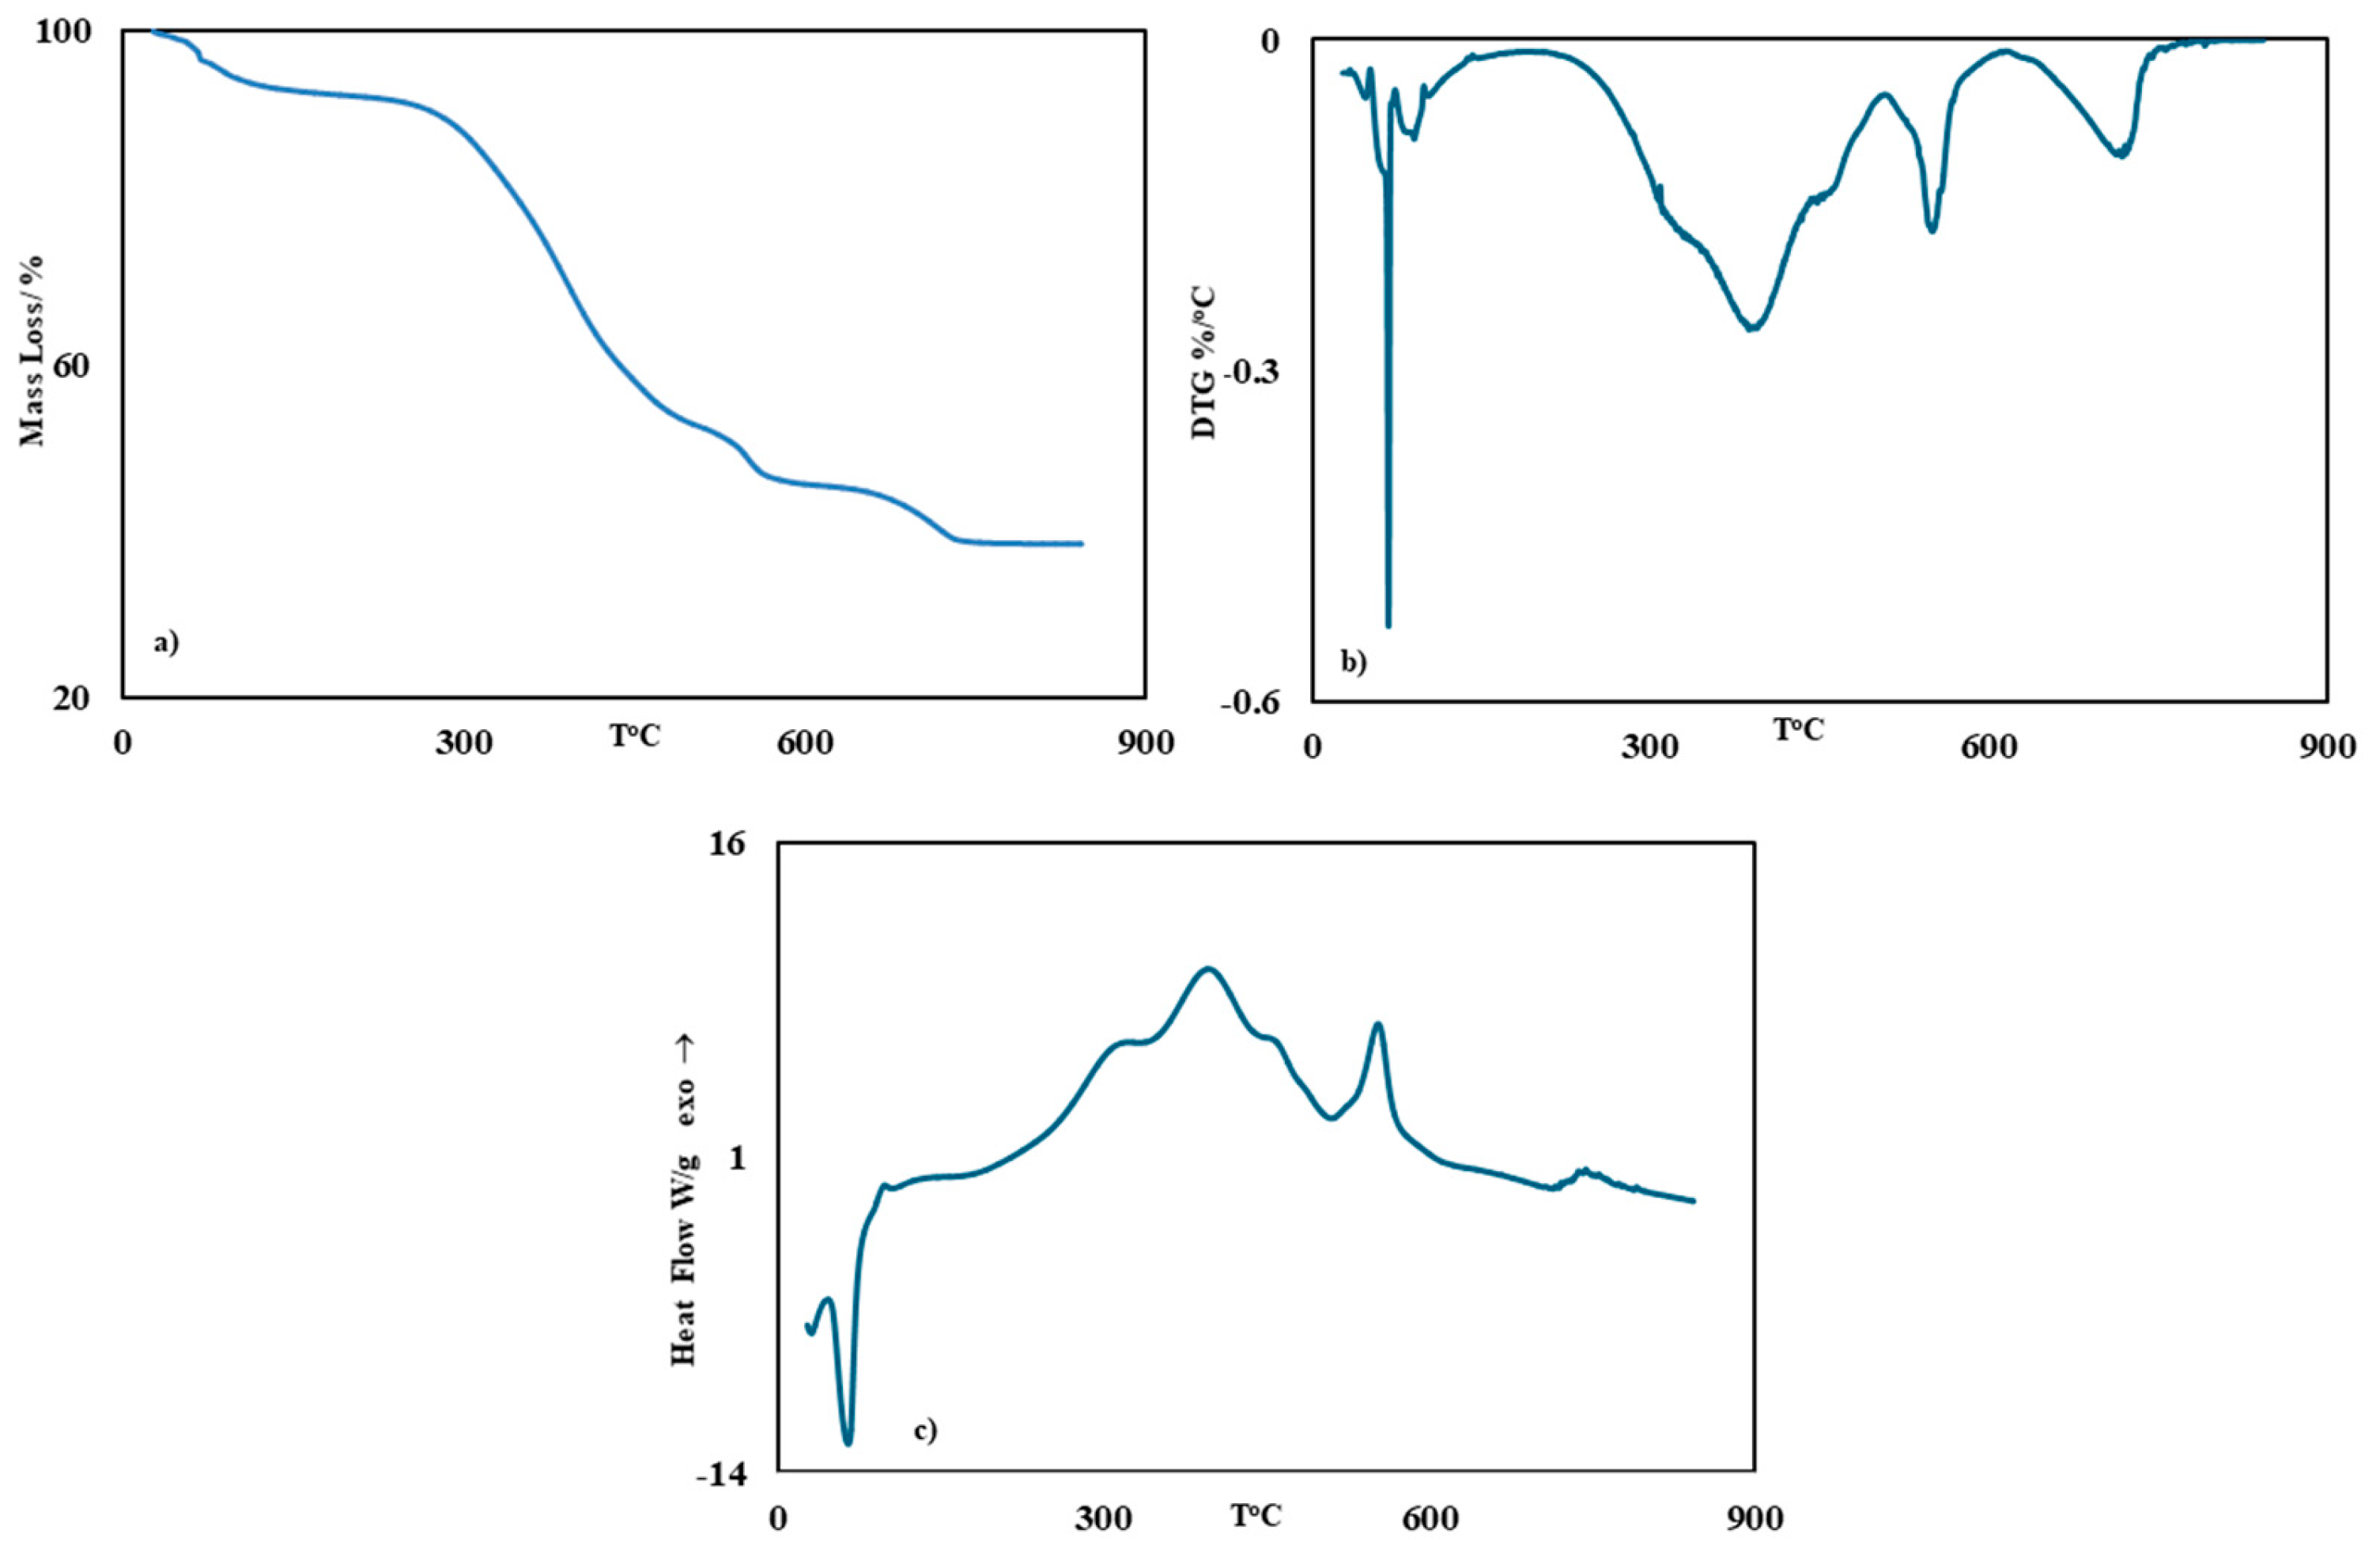
Figure 2.
The variation of activation energy with respect to the combustion ratio−α combined combustion (a), Combustion 1 (b) and Combustion 2 (c).
Figure 2.
The variation of activation energy with respect to the combustion ratio−α combined combustion (a), Combustion 1 (b) and Combustion 2 (c).
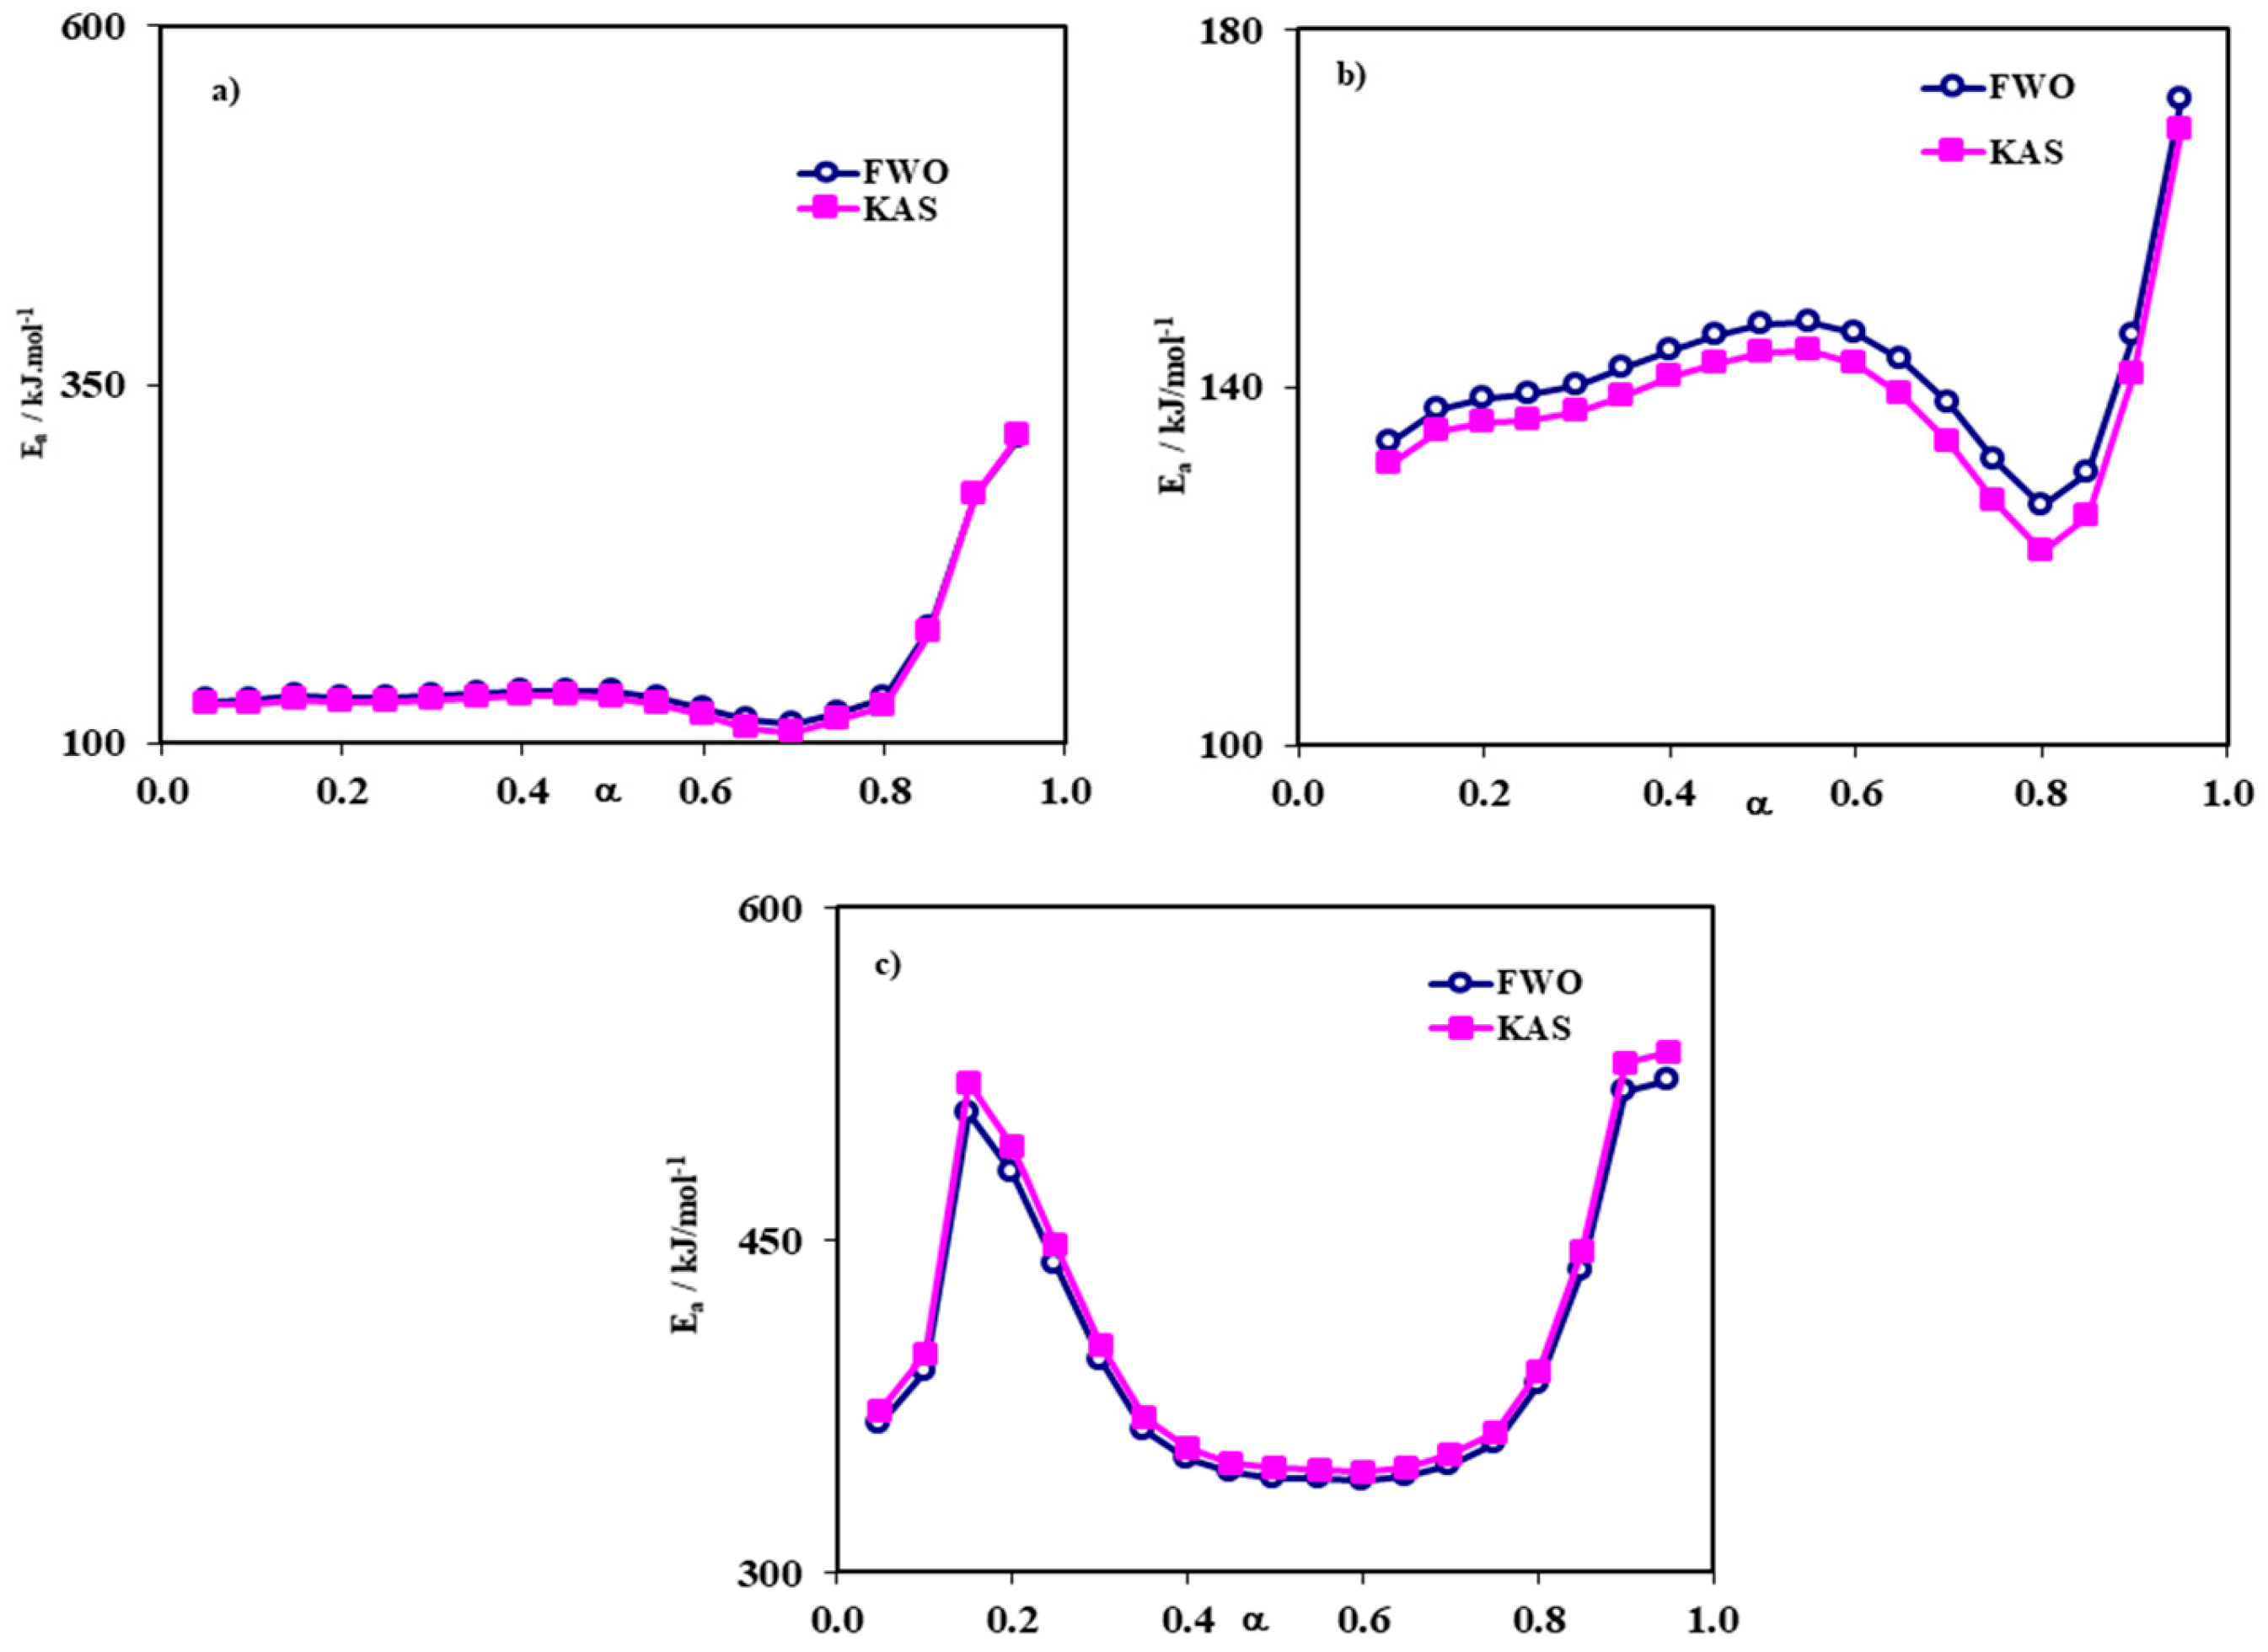
Figure 3.
Modeling graphs of Combustion 1 with using CM I method (a), Combustion 1 with using CM II method (b), Combustion 2 with using CM I method (c) and Combustion 2 with using CM II method (d). .
Figure 3.
Modeling graphs of Combustion 1 with using CM I method (a), Combustion 1 with using CM II method (b), Combustion 2 with using CM I method (c) and Combustion 2 with using CM II method (d). .
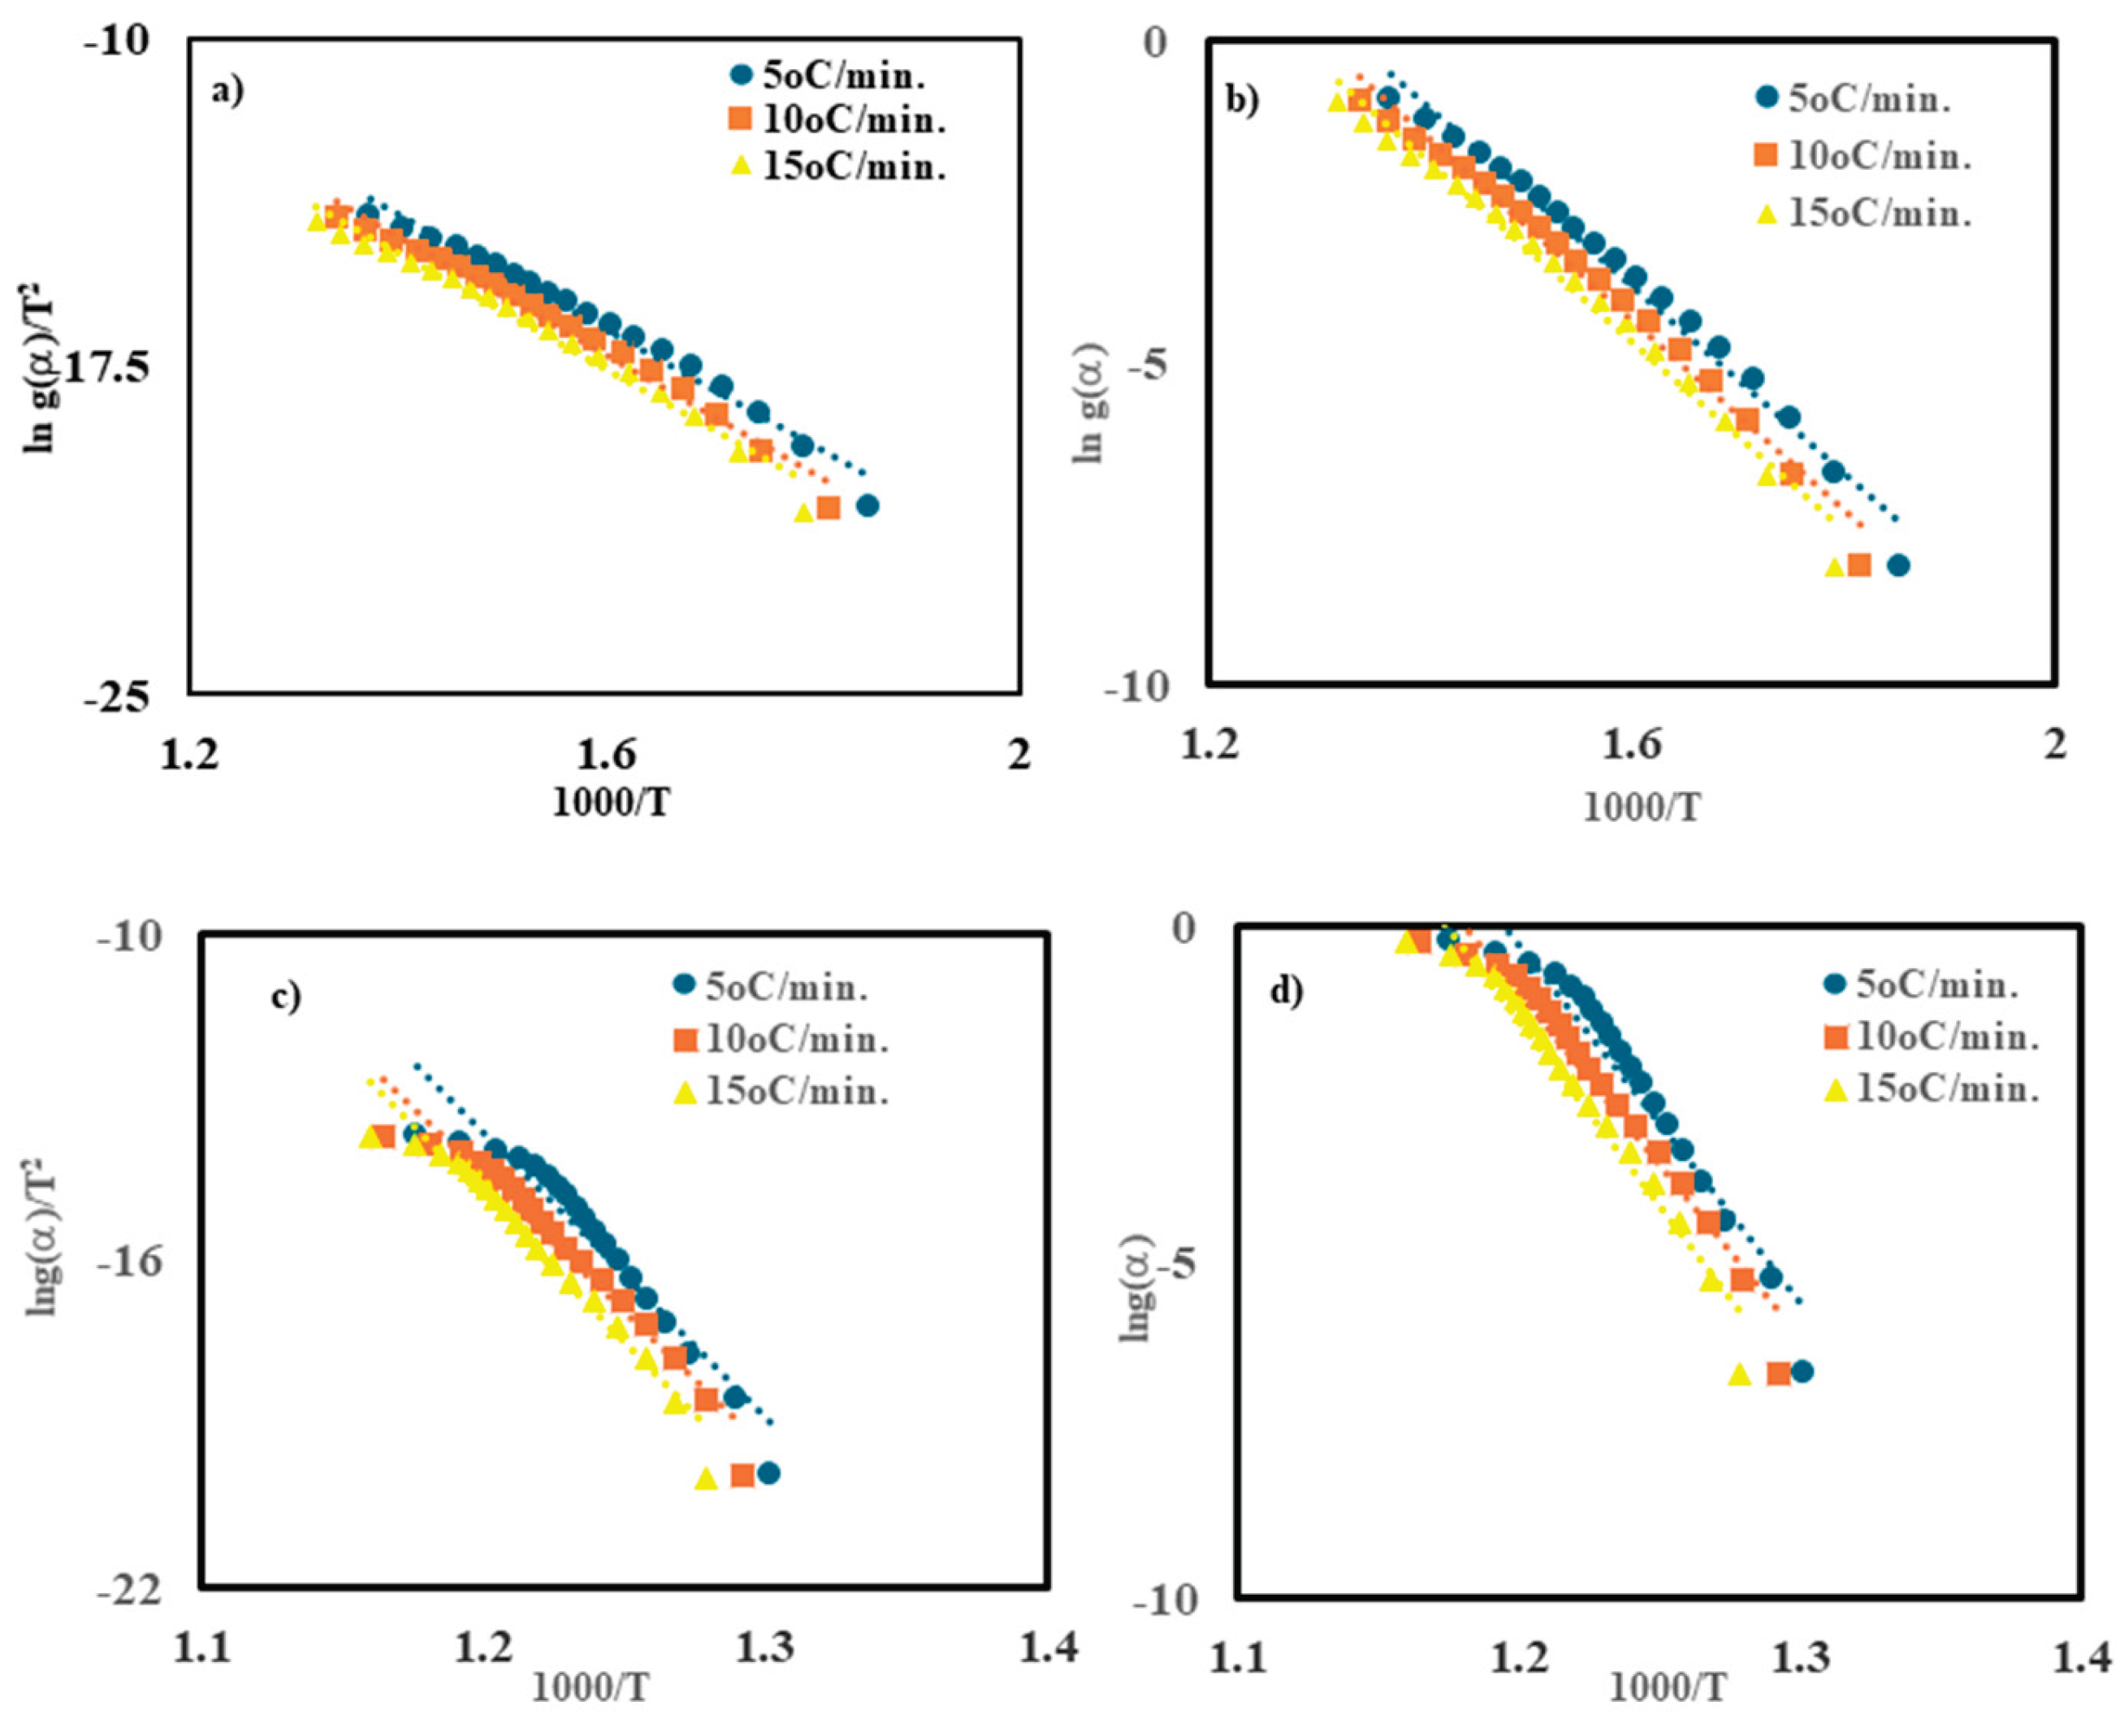

Table 1.
Proximate and Ultimate Analysis of Çayırhan Coal.
| Proximate Analysis, air dry basis % | |||
| Moisture | Ash | Volatile Matter | Fixed C |
| 0.81±0.05 | 41.90±0.10 | 40.70±0.26 | 17.40±0.18 |
| Ultimate Analysis, air dry basis % | |||
| C | H | N | S |
| 34.99±0.06 | 3.27±0.01 | 1.52±0.08 | 1.45±0.07 |
Table 2.
Thermal analysis quantities of combustion 1 and combustion 2 reactions for Çayırhan Coal.
| Thermal Property | Combustion 1 | Combustion 2 | ||||||
| 5 | 10 | 15 | Avg. | 5 | 10 | 15 | Avg. | |
| Tinital/oC | 221.61 | 224.23 | 227.85 | 224.56 | 489.30 | 494.17 | 503.18 | 495.55 |
| Tfinal/oC | 489.30 | 494.17 | 503.18 | 495.55 | 596.85 | 605.9 | 608.63 | 603.79 |
| Tpeak/oC | 383.32 | 394.63 | 399.05 | 392.33 | 539.95 | 549.77 | 559.59 | 549.77 |
| Δm % | 38.85 | 38.64 | 40.00 | 39.16 | 6.27 | 6.92 | 8.14 | 7.11 |
Table 3.
The calculated activation energy and regression analysis values of both combustion reactions by using KAS and FWO methods at each combustion ratio (α).
Table 3.
The calculated activation energy and regression analysis values of both combustion reactions by using KAS and FWO methods at each combustion ratio (α).
| Reac. | Combustion 1 | Combustion 2 | ||||||
| Method | KAS | FWO | KAS | FWO | ||||
| α | Ea | r2 | Ea | r2 | Ea | r2 | Ea | r2 |
| 0.05 | 134.14 | 0.999 | 136.21 | 0.999 | 373.00 | 0.944 | 366.89 | 0.948 |
| 0.10 | 131.27 | 1.000 | 133.78 | 1.000 | 398.28 | 0.972 | 391.03 | 0.974 |
| 0.15 | 135.04 | 0.999 | 137.58 | 0.999 | 520.66 | 0.913 | 507.52 | 0.917 |
| 0.20 | 136.07 | 1.000 | 138.74 | 1.000 | 491.91 | 0.947 | 480.27 | 0.950 |
| 0.25 | 136.31 | 1.000 | 139.15 | 1.000 | 448.12 | 0.972 | 438.72 | 0.974 |
| 0.30 | 137.21 | 1.000 | 140.17 | 1.000 | 402.86 | 0.985 | 395.75 | 0.986 |
| 0.35 | 139.07 | 1.000 | 142.10 | 1.000 | 369.43 | 0.993 | 364.03 | 0.994 |
| 0.40 | 141.04 | 0.999 | 144.12 | 1.000 | 355.97 | 0.998 | 351.28 | 0.999 |
| 0.45 | 142.65 | 0.999 | 145.78 | 0.999 | 349.09 | 1.000 | 344.78 | 1.000 |
| 0.50 | 143.78 | 0.998 | 146.99 | 0.998 | 346.71 | 1.000 | 342.55 | 1.000 |
| 0.55 | 144.01 | 0.997 | 147.33 | 0.998 | 346.11 | 1.000 | 342.02 | 1.000 |
| 0.60 | 142.59 | 0.996 | 146.10 | 0.996 | 345.23 | 1.000 | 341.21 | 1.000 |
| 0.65 | 139.25 | 0.994 | 143.05 | 0.995 | 347.42 | 1.000 | 343.33 | 1.000 |
| 0.70 | 133.94 | 0.991 | 138.13 | 0.993 | 352.76 | 1.000 | 348.44 | 1.000 |
| 0.75 | 127.12 | 0.989 | 131.79 | 0.991 | 362.72 | 0.998 | 357.95 | 0.998 |
| 0.80 | 121.64 | 0.990 | 126.75 | 0.992 | 390.85 | 0.999 | 384.75 | 0.999 |
| 0.85 | 125.41 | 0.995 | 130.51 | 0.996 | 444.65 | 1.000 | 435.98 | 1.000 |
| 0.90 | 141.38 | 0.999 | 145.89 | 0.999 | 529.85 | 0.998 | 517.11 | 0.998 |
| 0.95 | 168.65 | 0.999 | 172.07 | 0.999 | 534.88 | 0.994 | 522.08 | 0.994 |
| Avg. | 137.92 | 0.997 | 141.38 | 0.997 | 405.82 | 0.985 | 398.72 | 0.986 |
Table 4.
Thermodynamic parameters of Combustion 1 reaction.Table 5. Thermodynamic parameters of Combustion 2 reaction.
Table 4.
Thermodynamic parameters of Combustion 1 reaction.Table 5. Thermodynamic parameters of Combustion 2 reaction.

| Method | CM I | CM II | |||||||
| β oC/min. | 5 | 10 | 15 | avg. | 5 | 10 | 15 | avg. | |
| r2 | 0.92 | 0.95 | 0.95 | 0.94 | 0.93 | 0.95 | 0.96 | 0.94 | |
| Ea kJ/mol | 431.74 | 416.92 | 442.22 | 430.29 | 423.23 | 409.25 | 433.40 | 421.96 | |
| ln A | 61.13 | 58.91 | 62.60 | 60.88 | 60.12 | 57.99 | 61.57 | 59.89 | |
| ΔH‡ kJ/mol | 425.02 | 410.13 | 435.38 | 423.51 | 416.51 | 402.46 | 426.56 | 415.18 | |
| ΔS‡ J/mol.K | 267.10 | 236.51 | 255.03 | 252.88 | 246.64 | 228.80 | 258.56 | 244.67 | |
| ΔG‡ kJ/mol | 209.05 | 216.91 | 225.46 | 217.14 | 217.10 | 215.53 | 213.74 | 215.45 | |
Table 6.
Average Ea values which were calculated using different methods for Combustion 1 and Combustion 2 reactions.
Table 6.
Average Ea values which were calculated using different methods for Combustion 1 and Combustion 2 reactions.
| Method | KAS | FWO | CM I | CM II | Avg. |
| Combustion 1 | 137.92 | 141.38 | 110.56 | 113.45 | 125.83 |
| Combustion 2 | 405.82 | 398.72 | 430.29 | 421.96 | 414.20 |
Disclaimer/Publisher’s Note: The statements, opinions and data contained in all publications are solely those of the individual author(s) and contributor(s) and not of MDPI and/or the editor(s). MDPI and/or the editor(s) disclaim responsibility for any injury to people or property resulting from any ideas, methods, instructions or products referred to in the content. |
© 2026 by the authors. Licensee MDPI, Basel, Switzerland. This article is an open access article distributed under the terms and conditions of the Creative Commons Attribution (CC BY) license (http://creativecommons.org/licenses/by/4.0/).
Copyright: This open access article is published under a Creative Commons CC BY 4.0 license, which permit the free download, distribution, and reuse, provided that the author and preprint are cited in any reuse.