

Submitted:
29 July 2026
Posted:
31 July 2026
You are already at the latest version
Abstract
In type 2 diabetes, adding a glucagon-like peptide-1 receptor agonist (GLP-1RA) to basal insulin can improve glycemic control and reduce insulin requirements while counteracting insulin-associated weight gain. However, the extent to which incretin therapies enable patients to stop or meaningfully reduce insulin, and whether they differ in this respect from other oral antidiabetic agents, remains uncertain. Here we analyzed de-identified electronic health records from a federated U.S. clinical network, comparing patients with type 2 diabetes receiving basal insulin who initiated semaglutide, tirzepatide, or an SGLT2-inhibitor (SGLT2-i). Three comparisons were evaluated using 1:1 propensity-score matching: two incretin-versus-SGLT2-i comparisons, semaglutide versus SGLT2-i (n=1,029) and tirzepatide versus SGLT2-i (n=254), and a head-to-head incretin comparison of tirzepatide versus semaglutide (n=272). Cumulative incidence of basal insulin discontinuation and of ≥20% basal-dose reduction was estimated over 24 months. At 24 months, patients who initiated semaglutide discontinued basal insulin at a significantly higher rate than those who initiated SGLT2-i (27.8% vs 22.2%; subdistribution hazard ratio [sHR] 1.26, 95% CI 1.05–1.52; Gray P=0.013), whereas tirzepatide initiators discontinued more often than SGLT2-i initiators without reaching significance (38.4% vs 31.5%; sHR 1.22, 95% CI 0.86–1.71; P=0.263). In the head-to-head incretin comparison, tirzepatide initiators discontinued basal insulin more often than semaglutide initiators, though this difference did not reach significance (38.0% vs 28.5%; sHR 1.35, 95% CI 0.97–1.89; P=0.080). Reduction of basal insulin dose by ≥20% was significantly higher with each incretin than with SGLT2-i (semaglutide sHR 1.15, P=0.045; tirzepatide sHR 1.40, P=0.015), and, in the head-to-head incretin comparison, significantly higher with tirzepatide than semaglutide (sHR 1.29, P=0.045). These reductions in insulin use were accompanied by improved glycemic control. At 6 months HbA1c dropped 1.16 versus 0.92 percentage points for semaglutide versus SGLT2-i (P=0.013), and tirzepatide lowered HbA1c more than SGLT2-i (1.79 vs 1.44 percentage points), though not significantly (P=0.18); in the head-to-head incretin comparison, tirzepatide lowered HbA1c more than semaglutide (1.85 vs 1.30 percentage points; P=0.008). In summary, in a real-world type 2 diabetes population receiving basal insulin, incretin therapies were associated with higher rates of basal-insulin dose reduction than SGLT2-i—and semaglutide with higher rates of discontinuation—while tirzepatide produced greater dose reduction and glycemic improvement than semaglutide, motivating prospective evaluation of incretin-based insulin de-escalation strategies.
Keywords:
type 2 diabetes
; GLP1 RA
; insulin
; tirzepatide
; semaglutide
Introduction
Insulin remains a cornerstone of therapy for many people with type 2 diabetes who do not reach glycemic targets on oral agents, yet chronic insulin therapy carries a substantial burden of hypoglycemia, weight gain, regimen complexity, and treatment fatigue [1]. Because escalating insulin doses can improve glycemia while reinforcing weight gain and cardiometabolic risk, therapies that allow insulin requirements to be safely reduced, or insulin to be stopped altogether, without loss of glycemic control address a genuine unmet need. Deintensification of hypoglycemia-prone regimens is increasingly emphasized in guideline care, particularly for older adults and those at high risk of hypoglycemia [2,3], but real-world deintensification remains uncommon and poorly characterized [4].
Glucagon-like peptide-1 receptor agonists (GLP-1RAs) and the dual glucose-dependent insulinotropic polypeptide and GLP-1 dual receptor agonist tirzepatide have reshaped the treatment of type 2 diabetes and obesity through their effects on appetite, gastric emptying, glycemia, weight, and cardiometabolic risk [5,6,7]. When added to basal insulin, these agents improve glycemic control while simultaneously reducing insulin requirements—a combination demonstrated for once-weekly semaglutide in the SUSTAIN-5 trial [8]. These pharmacologic effects raise the clinical question of whether adding an incretin therapy can move patients beyond dose reduction toward discontinuation, and whether incretins differ in this respect from other add-on classes such as sodium–glucose cotransporter-2 inhibitors (SGLT2-i), which also lower glucose and weight through an insulin-independent mechanism [9].
A recent target trial emulation directly addressed insulin discontinuation among patients with type 2 diabetes receiving basal insulin who initiated a GLP-1RA, an SGLT2-i, or a dipeptidyl peptidase-4 inhibitor [10]. In that study, conducted in a Veterans Health Administration population, GLP-1RA initiation did not increase the likelihood of stopping insulin relative to SGLT2-i or DPP-4i, and no subgroup showed a comparative advantage of GLP-1RAs. That analysis provides an important and rigorously designed benchmark, but leaves several questions open. First, its population was 93% male and drawn from a single integrated system, limiting generalizability to the broader population. Second, its GLP-1RA arm was dominated by semaglutide and older agents and did not separately evaluate tirzepatide, whose greater weight and glycemic effects might plausibly translate into greater insulin sparing [11]. Third, it focused on complete discontinuation, a stringent and relatively infrequent endpoint, without capturing the graded dose reduction that constitutes deintensification in routine practice.
Here we revisit the comparison in a demographically broader population using de-identified longitudinal electronic health record data from a federated U.S. clinical network. We make three additions intended to sharpen and extend the prior work: we evaluate semaglutide and tirzepatide as distinct exposures rather than a single GLP-1RA class; we complement full insulin discontinuation with a graded deintensification endpoint defined by sustained reductions in basal insulin dose; and we place these outcomes in glycemic and pharmacologic context by describing concurrent HbA1c target attainment and real-world incretin titration. We estimate cumulative incidence of each outcome over 24 months within three incretin-anchored, propensity-score matched comparisons, allowing a direct assessment of whether incretin therapies are associated with greater insulin de-escalation than SGLT2-i in real-world care.
Results
Cohort characteristics and balance
We identified patients with type 2 diabetes receiving basal insulin at baseline who initiated semaglutide, tirzepatide, or an SGLT2-i between January 1, 2022 and December 31, 2025, and constructed three incretin-anchored 1:1 propensity-score matched comparisons (Figure 1). Before matching, incretin initiators were younger and more obese than SGLT2-i initiators; standardized mean differences (SMDs) exceeded 0.10 for age (0.37), BMI (0.45), and female sex (0.21) in the semaglutide-versus-SGLT2-i comparison, and SGLT2-i initiators carried a higher burden of heart failure, ischemic heart disease, and nephropathy (Table 1). Matching produced 1,029, 254, and 272 matched pairs for the semaglutide-versus-SGLT2-i, tirzepatide-versus-SGLT2-i, and tirzepatide-versus-semaglutide comparisons, respectively (Table 2). Balance was adequate in the largest comparison, where all absolute SMDs fell below 0.11. Residual imbalance persisted in the two smaller comparisons, most notably for basal insulin subtype (SMD 0.19) and female sex (0.15) in the tirzepatide-versus-SGLT2-i comparison and for prior-year encounters (0.16) in the head-to-head incretin comparison (Figure S1).
Incretin therapies are associated with greater basal-insulin deintensification, and semaglutide with greater discontinuation, than SGLT2 inhibitors
To evaluate the effect of incretin therapy on insulin sparing, we estimated the cumulative incidence of basal-insulin discontinuation and of ≥20% basal-dose deintensification over 24 months for each of the three matched comparisons (Figure 2, Table 3). Discontinuation was consistently higher in the incretin arm and highest under tirzepatide. The difference reached statistical significance for semaglutide versus SGLT2-i (27.8% vs 22.2%; subdistribution hazard ratio [sHR] 1.26, 95% CI 1.05–1.52; Gray P=0.013), whereas tirzepatide, despite a higher cumulative incidence than both semaglutide (38.0% vs 28.5%; sHR 1.35, 95% CI 0.97–1.89; P=0.080) and SGLT2-i (38.4% vs 31.5%; sHR 1.22, 95% CI 0.86–1.71; P=0.263), did not reach significance in either of the smaller matched cohorts. Deintensification separated the arms more consistently: the 24-month cumulative incidence of a ≥20% dose reduction was significantly higher in every incretin arm than in its comparator (semaglutide vs SGLT2-i 52.1% vs 47.8%, sHR 1.15, 95% CI 1.00–1.31, P=0.045; tirzepatide vs SGLT2-i 60.6% vs 51.1%, sHR 1.40, 95% CI 1.07–1.83, P=0.015; tirzepatide vs semaglutide 63.2% vs 55.0%, sHR 1.29, 95% CI 1.01–1.66, P=0.045), and a stricter ≥30% threshold reproduced the same ordering (Figure S2).
As a descriptive complement to these analyses, we examined the distribution of basal-insulin dose among patients who remained on insulin at 6-month intervals (Figure S3). The distribution shifted toward lower doses under incretin therapy, most markedly with tirzepatide, whereas the proportion of patients on the highest doses was largely unchanged across follow-up. Because insulin discontinuation and dose changes were ascertained from clinical notes, we also confirmed that documentation intensity did not favor the incretin arms (Figure S4). Notes per patient-month were not higher under incretin therapy relative to SGLT2-i (semaglutide 0.77 vs 0.93, P=0.012; tirzepatide 1.03 vs 1.26, P=0.36) and were similar for tirzepatide versus semaglutide (1.10 vs 0.99; P=0.57).
The insulin-sparing association is concentrated in patients with obesity and lower baseline HbA1c
To determine whether the insulin-sparing association for incretin therapies was concentrated within specific patient groups, we repeated the cumulative-incidence analysis within prespecified subgroups defined by sex, age, BMI, baseline HbA1c, and baseline insulin dose, applying Benjamini-Hochberg correction across subgroups within each comparison and endpoint (Figure 3). Among patients with a BMI ≥30 kg/m², semaglutide showed higher rates than SGLT2-i of both insulin discontinuation (sHR 1.37, 95% CI 1.10–1.71; adjusted P=0.026) and ≥20% dose reduction (sHR 1.24, 95% CI 1.06–1.45; adjusted P=0.038), and among patients with a baseline HbA1c <8%, semaglutide again showed higher rates than SGLT2-i of both discontinuation (sHR 1.61, 95% CI 1.20–2.17; adjusted P=0.015) and ≥20% dose reduction (sHR 1.50, 95% CI 1.21–1.86; adjusted P=0.003). For tirzepatide versus SGLT2-i, among patients on a lower baseline insulin dose (<50 units/day), tirzepatide showed a higher rate of ≥20% dose reduction than SGLT2-i (sHR 1.55, 95% CI 1.16–2.06; adjusted P=0.029). No subgroup in the head-to-head tirzepatide-versus-semaglutide comparison was statistically significant after adjustment, and across all comparisons, no subgroup favored SGLT2-i over an incretin.
Incretin therapies are associated with improved glycemic control
To determine whether the insulin-sparing association with incretin therapies was supported by improved glycemic control, we compared the change in HbA1c from baseline between arms at 6-month intervals during follow-up, and within each arm between patients who did and did not discontinue insulin (Figure 4, Table 4). At 6 months, HbA1c fell by 1.16 versus 0.92 percentage points for semaglutide versus SGLT2-i (P=0.013) and by 1.85 versus 1.30 percentage points for tirzepatide versus semaglutide (P=0.008), a separation that was sustained at 24 months (P=0.022); tirzepatide also produced a larger reduction than SGLT2-i (1.79 vs 1.44 percentage points), although this difference did not reach statistical significance (P=0.18). Within every cohort, patients who discontinued insulin achieved HbA1c reductions at least as large as those who continued it. In the tirzepatide-versus-semaglutide comparison, for example, HbA1c fell at 12 months by 2.06 versus 1.17 percentage points among tirzepatide-treated patients who did versus did not discontinue (P<0.05) and by 1.75 versus 0.70 percentage points among the matched semaglutide-treated patients (P<0.05).
The insulin-sparing association is observed under conservative real-world incretin titration
To assess whether these associations required maximal drug exposure, we examined the distribution of incretin dose across the approved titration ladder at 6-month intervals during follow-up (Figure 5). This analysis was restricted to injectable semaglutide (Ozempic), which follows the 0.25–2 mg ladder, and included both tirzepatide products (Mounjaro and Zepbound), which share the 2.5–15 mg ladder. Titration advanced gradually and remained submaximal for most patients. Among Ozempic-treated patients, the proportion at the 2 mg maximum rose from 18% at 6 months to 27% at 12 months and 39% at 24 months, while a majority remained below the maximum throughout (34% at 1 mg at 24 months). Among tirzepatide-treated patients, only 5% were at the 15 mg maximum at 6 months, rising to 11% at 12 months and 12% at 24 months, with approximately 61% still at or below 7.5 mg at 24 months.
Discussion
In this study, initiation of an incretin therapy was associated with greater de-intensification of basal insulin than initiation of an SGLT2 inhibitor (SGLT2-i) in patients with type 2 diabetes, across two endpoints: discontinuation of basal insulin and a sustained reduction of at least 20% in dose. The association favored the incretin arm in all three matched comparisons and both endpoints. For dose reduction, semaglutide over SGLT2-i, tirzepatide over SGLT2-i, and tirzepatide over semaglutide were each statistically significant. For discontinuation, the association again favored the incretin arm throughout but reached significance only for semaglutide versus SGLT2-i. Tirzepatide showed the largest association for both endpoints but in smaller cohorts, and its discontinuation estimates were not significant. The incretin advantage is therefore modest and detected more reliably as dose reduction than as complete cessation, consistent with dose reduction being the more frequent event in this population.
The reductions in insulin use were accompanied by improved glycemic control rather than by a loss of it. In each comparison, the arm associated with greater de-intensification was also the arm associated with the greater reduction in HbA1c, and within each cohort patients who discontinued insulin improved at least as much as those who continued it [12,13]. An insulin-sparing association would be of limited clinical value if it reflected undertreatment, and these results indicate that it does not. Most patients remained below the maximal approved dose of semaglutide or tirzepatide throughout follow-up, so these associations were observed without full pharmacologic titration and may understate findings under structured dose escalation.
Mechanistically, incretin therapies reduce insulin requirement through weight loss and the associated improvement in insulin sensitivity, and through glucose-dependent insulinotropic and glucagonostatic effects that lower glycemia without a corresponding increase in exogenous insulin need.5–7 The greater weight and glycemic effects reported for tirzepatide relative to semaglutide are consistent with the ordering we observed, in which tirzepatide showed the largest association and SGLT2-i the smallest [11]. Also consistent with a weight-mediated mechanism, the association was concentrated in patients with obesity and in patients closer to glycemic target at baseline, and for tirzepatide in patients on lower baseline insulin doses. No subgroup in any comparison favored SGLT2-i over an incretin. Over follow-up, the proportion of patients on the lowest basal insulin doses increased while the proportion on the highest doses was largely unchanged, which suggests that the association operated through a responsive subset of patients rather than as a uniform class effect.
These results extend and partially contrast with a recent target trial emulation, which found no advantage of glucagon-like peptide-1 receptor agonists (GLP-1RAs) over oral agents for insulin discontinuation among veterans with type 2 diabetes [10]. Several design differences may contribute to this divergence. That study was conducted in a population that was predominantly male and drawn from a single integrated care system, whereas the present cohort was assembled from a demographically broader, non-Veteran population, and differences in obesity, baseline insulin requirement, and care patterns could modify the degree of insulin sparing achievable. That study also evaluated GLP-1RAs as a single class dominated by semaglutide and older agents and did not separately evaluate tirzepatide, so aggregating the dual agonist with less potent agents, or omitting it, would attenuate any advantage concentrated in the newer agent. Finally, that study evaluated complete discontinuation alone, whereas the graded endpoint used here was the more sensitive readout and was the endpoint on which the incretin advantage was most apparent. Our findings therefore do not contradict this earlier work so much as indicate that the incretin advantage is real but modest, concentrated in the dual agonist, and more readily detected with graded endpoints in a broader population.
Although we evaluated three therapies in this study, we cannot directly compare the estimates across the three comparisons, because the underlying matched populations differ in clinical characteristics and in their distribution over calendar time. Tirzepatide was approved later than semaglutide and the SGLT2 inhibitors, so tirzepatide initiators were necessarily drawn from a later calendar period and a smaller pool of eligible patients. As a result, we performed three separate pairwise matches rather than a single simultaneously matched three-arm cohort, and the analyses are not mutually adjusted. Insulin discontinuation may also have become more common over calendar time independently of drug choice, as clinical familiarity with de-escalation increased and additional glucose-lowering therapies became available. We required exact matching on the calendar year of the index prescription in order to align follow-up windows within each comparison, but residual confounding by calendar period cannot be excluded and should be weighed when interpreting the tirzepatide-anchored comparisons relative to the semaglutide-versus-SGLT2-i comparison, whose arms were contemporaneous.
There are several limitations of this study. First, this is a retrospective analysis of real-world electronic health record data and is subject to confounding by indication, misclassification of exposure and outcome, and incomplete capture of medication adherence [14,15]. Propensity-score matching balanced measured covariates within each comparison, but unmeasured confounders including prescriber intent to de-intensify, patient motivation, and socioeconomic factors cannot be excluded. Second, insulin status and dose were ascertained from clinical notes, so the results depend on clinical documentation. We found that documentation intensity was not higher in the incretin arms, and because more frequent documentation would if anything increase the capture of discontinuation in the SGLT2-i arm, differential note availability is an unlikely explanation for the observed associations. Third, the de-intensification endpoint is defined on basal insulin. This is conservative with respect to total insulin, because prandial insulin is typically additive, but it does not capture every dimension of a complex regimen. Fourth, the smaller size of the tirzepatide-anchored cohorts limited the statistical power to detect differences in discontinuation, and follow-up studies in larger tirzepatide populations are warranted. Finally, follow-up was limited to 24 months, and longer horizons may show convergence as more patients in all arms reduce or stop insulin. Studies with extended follow-up will be needed to determine whether the differences observed here are durable.
Overall, this study provides evidence that incretin therapies are associated with greater de-intensification of basal insulin than SGLT2 inhibitors in patients with type 2 diabetes, with the strongest association observed for tirzepatide and the clearest evidence of complete discontinuation observed for semaglutide. These reductions occurred alongside improved glycemic control rather than at its expense. The data support prospective evaluation of incretin-based insulin de-escalation strategies, particularly in patients with obesity and near-target glycemia, in whom the association was most pronounced
Methods
Study design and population
This study was a retrospective, new-user, active-comparator target trial emulation conducted in a federated U.S. clinical network of de-identified longitudinal electronic health record data. The study population comprised patients with type 2 diabetes who were receiving basal insulin and who initiated semaglutide, tirzepatide, or an SGLT2 inhibitor between January 1, 2022 and December 31, 2025. Qualifying semaglutide products were injectable semaglutide (Ozempic), oral semaglutide (Rybelsus), and semaglutide for weight management (Wegovy); qualifying tirzepatide products were Mounjaro and Zepbound. Of 1,632 semaglutide initiators before matching, 1,481 (90.7%) received injectable Ozempic, 104 (6.4%) Rybelsus, and 47 (2.9%) Wegovy; of the 458 tirzepatide initiators, fewer than 11 received Zepbound and the remainder Mounjaro. Because oral and weight-management semaglutide follow different titration schedules, the incretin dose-ladder analysis (Figure 5) was restricted to injectable Ozempic; Mounjaro and Zepbound share an identical titration schedule and were analyzed together. The SGLT2-i class was defined by canagliflozin, dapagliflozin, empagliflozin, ertugliflozin, and bexagliflozin, and sotagliflozin, and was dominated by empagliflozin, which accounted for 1,526 of 1,779 SGLT2-i initiators (85.8%) before matching.
Cohort definition
The index date was defined as the earliest qualifying order of an index therapy within the study window, and each patient was assigned to the treatment arm corresponding to the drug ordered on that date; patients who initiated more than one index class on the index date were excluded for ambiguous assignment. Insulin exposure was classified by active ingredient. Patients were required to have a basal insulin order within the 6 months before index and to be free of any prandial, premixed, inhaled, or fixed-ratio combination therapies (e.g., Soliqua, Xultophy) over the same window, so that the analytic population was receiving basal insulin only. Type 2 diabetes was required and type 1 diabetes excluded within the 2 years before index; patients with a contraindication to the study therapies in that window—pancreatitis, gastroparesis, thyroid cancer, multiple endocrine neoplasia type 2, or diabetic ketoacidosis—were excluded, as were patients with gestational diabetes or documented pregnancy for pregnancy-related reasons. To restrict the cohort to new users, patients with any order for semaglutide, tirzepatide, or an SGLT2-i in the 2 years before index were excluded. Eligible patients were required to have complete baseline HbA1c, eGFR, and BMI (closest value within 6 months for HbA1c and eGFR and within 2 years for BMI), with eGFR estimated from serum creatinine using the 2021 race-free CKD-EPI equation [16]. Finally, the analytic cohort was restricted to patients with a documented basal-insulin dose in the 90 days before index. Index and washout drug classes, diagnosis code sets, insulin categories, concomitant-medication classes, and lookback windows are detailed in Table S1.
Exposure comparisons and propensity-score matching
Three incretin-anchored pairwise comparisons were constructed: semaglutide versus SGLT2-i (anchored on semaglutide), tirzepatide versus SGLT2-i (anchored on tirzepatide), and tirzepatide versus semaglutide (anchored on tirzepatide). For each comparison, a propensity score for receipt of the anchor therapy was estimated by logistic regression on the full baseline covariate set: age at index, baseline HbA1c, eGFR, BMI, baseline basal-insulin dose, Charlson comorbidity index, and number of healthcare encounters in the prior year (continuous, standardized); sex, race, ethnicity, basal insulin subtype, and smoking status (categorical); and concomitant metformin, sulfonylurea, thiazolidinedione, and DPP-4 inhibitor use, microvascular complications (neuropathy, retinopathy, nephropathy), severe hypoglycemia, congestive heart failure, cerebrovascular disease, dementia, and ischemic heart disease (binary). The baseline basal-insulin dose was taken as the most recent value within 90 days before index. Anchor patients were matched 1:1 to comparator patients by nearest neighbor on the logit of the propensity score, within a caliper of 0.2 times the standard deviation of the logit and with exact matching required on five prespecified cells: age ≥65 years, BMI ≥30 kg/m², HbA1c ≥8%, baseline basal-insulin dose ≥50 units/day, and calendar year of index. Matching was performed without replacement. Covariate balance was assessed by standardized mean differences (SMDs) before and after matching, with |SMD| < 0.10 considered as adequate balance [17].
Outcome definitions
Insulin discontinuation was ascertained from documented cessation of insulin therapy. Insulin deintensification was defined as the composite of insulin discontinuation and a sustained reduction in basal insulin dose of at least 20% (≥20% deintensification) or at least 30% (≥30% deintensification) relative to the baseline dose, where a reduction was required to be sustained over a 90-day window to distinguish durable deintensification from transient dose fluctuation.
Cumulative-incidence and subgroup analyses
Cumulative incidence of each time-to-event outcome was estimated with the Aalen-Johansen estimator over 24 months, treating death as a competing risk. Follow-up began at the index date and was censored at the earliest of the outcome of interest, the last recorded clinical encounter, and 24 months, with death handled as a competing event. Pointwise confidence intervals were computed analytically from the Aalen variance estimator. Between-group differences were assessed with Gray’s test for the equality of cumulative incidence functions under the competing risk of death, and effects were summarized as Fine-Gray subdistribution hazard ratios (sHR) with 95% confidence intervals; because the subdistribution hazard ratio and Gray’s test derive from the same model, a confidence interval excluding 1 corresponds to P<0.05. Prespecified subgroups were defined by sex (male vs female), age (<65 vs ≥65 years), BMI (<30 vs ≥30 kg/m²), baseline HbA1c (<8% vs ≥8%), and baseline insulin dose (<50 vs ≥50 units/day). For subgroup analyses, Gray’s-test P values were adjusted for multiple comparisons using the Benjamini-Hochberg false-discovery-rate procedure applied within each comparison family.
HbA1c trajectory analysis
Longitudinal HbA1c were summarized at baseline and 6-month landmarks thereafter (0, 6, 12, 18, and 24 months). For each landmark, the observation nearest the landmark within a ±3-month window was used among those with available data. HbA1c was expressed both as the absolute change from baseline (in percentage points) and as the raw value, and is reported at each landmark as the mean ± standard error within each cohort. To assess whether reduced insulin use was accompanied by a change in glycemic control, HbA1c trajectories were compared between arms within each matched comparison and, within each arm, between patients who did and did not discontinue insulin, with between-group differences at each landmark evaluated by a two-sample test. For this stratification, patients were classified as having discontinued insulin if discontinuation occurred at any point during follow-up, without regard to its timing relative to the landmark.
Statistical analysis
Continuous variables are reported as mean (standard deviation) or median [interquartile range], and categorical variables as counts and percentages. Standardized mean differences were used to assess covariate balance. Cumulative incidence was estimated with the Aalen-Johansen estimator with death as a competing risk and analytic confidence intervals; between-group differences were assessed with Gray’s test and summarized as Fine-Gray subdistribution hazard ratios with 95% confidence intervals. Multiple-testing correction across subgroups used the Benjamini-Hochberg procedure within each comparison family. All tests were two-sided with significance defined at α=0.05. Analyses used complete cases at each landmark without imputation for missing values. All analyses were performed in Python, with propensity scores estimated using a logistic regression model fit in scikit-learn, and cumulative incidence estimated using lifelines, with Gray’s test and Fine-Gray subdistribution hazard ratios computed using scikit-survival. The study was planned and is reported in accordance with recognized frameworks for real-world evidence and pharmacoepidemiology, including the STaRT-RWE template, the RECORD-PE reporting statement, and joint ISPE/ISPOR guidance for reproducible healthcare-database studies [18,19,20].
Basal insulin dose, status, and drug dose extraction
Basal insulin dose and status and semaglutide and tirzepatide doses were extracted from clinical notes using AI-augmented curation with a large language model (LLM). Clinical notes were screened for insulin, basal-insulin, and discontinuation terms, and each qualifying note was processed independently together with its note date. All LLM workflows used gpt-oss-20b (maximum 1,500 generated tokens; temperature 0.5, top-p 0.9, top-k 50, seed 42) with a structured JSON output schema (see Supplementary Methods). The model was instructed to capture only the regimen documented in the current note and to return, for that date, the basal insulin status (active, discontinued, held, not mentioned, or unclear), the current basal insulin dose in units per day (summing split doses), and any semaglutide or tirzepatide dose in milligrams; historical and planned doses were ignored, except that an explicit statement of basal insulin cessation was captured as the current status. Insulin discontinuation was defined from a note-documented "discontinued" status (e.g., "stopped glargine," "insulin discontinued," "weaned off insulin"), with the first such note per patient taken as the event date. Extracted outputs were parsed and standardized to canonical units, out-of-range or implausible values were removed, incretin doses were snapped to approved strengths, duplicate mentions were deduplicated, and dates were aligned relative to the index date. Extraction accuracy was evaluated against a manually adjudicated test set of 100 extractions, each labelled correct when the extracted value, units, and supporting text were judged accurate and adequately supported by the source record; overall accuracy was 96% (96/100).
Data Source
This study analyzed de-identified EHR data from academic medical centers in the United States via the nference Clinical Analytics Platform. Prior to analysis, all data underwent expert determination de-identification satisfying HIPAA Privacy Rule requirements (45 CFR §164.514(b)(1)), employing a multi-layered transformation approach for both structured data (cryptographic hashing of identifiers, date-shifting, geographic truncation) and unstructured clinical text (ensemble deep learning and rule-based methods with >99% recall for personally identifiable information detection). nference established secure data environments within each participating center, housing these de-identified patient data governed by expert determination. These de-identified data environments were specifically designed to enable data access and analysis without requiring Institutional Review Board oversight, approval, or exemption confirmation. Accordingly, informed consent and IRB review were not required for this study.
Data Availability
This study involves the analysis of de-identified Electronic Health Record (EHR) data via the nference Federated Clinical Analytics Platform (FCAP). Data shown and reported in this manuscript were extracted from this environment using an established protocol for data extraction, aimed at preserving patient privacy. The data has been de-identified pursuant to an expert determination in accordance with the HIPAA Privacy Rule. Any data beyond what is reported in the manuscript, including but not limited to the raw EHR data, cannot be shared or released due to the parameters of the expert determination to maintain the data de-identification. The corresponding author should be contacted for additional details regarding the nference platform.
De-identification and HIPAA compliance certification
Prior to analysis, all EHR data were de-identified under an expert determination consistent with the Health Insurance Portability and Accountability Act (HIPAA) Privacy Rule (45 CFR §164.514(b)(1)). The de-identification methodology employed a multi-layered transformation approach to both structured and unstructured data fields [21]. In structured data, direct identifiers including patient names and precise geographic locations were excluded entirely, while indirect identifiers underwent specific transformations: patient identifiers, medical record numbers, and accession numbers were replaced with one-way cryptographic hashes using confidential salts to preserve linkage across patient encounters; all dates were shifted backward by patient-specific random offsets (1–31 days) to preserve temporal relationships while obscuring exact event timing; the ZIP codes were truncated to two-digit state-level resolution; and continuous variables including age, height, weight, and body mass index were thresholded to prevent identification of extreme values (for example, ages ≥89 years transformed to ‘89+’ and BMI >40 transformed to ‘40+’). In unstructured clinical text, an ensemble de-identification system that combines attention-based deep learning models with rule-based methods achieved an estimated >99% recall for personally identifiable information (PII) detection, with detected identifiers replaced by plausible fictional surrogates [21].
Data Harmonization
To address heterogeneity in EHR data, we harmonized clinical variables including medications, anthropometric measurements, and diagnoses to standardized concepts. For medications, we first constructed a standardized drug concept database combining the nference knowledge graph with RXNorm (https://www.nlm.nih.gov/research/umls/rxnorm/index.html) hierarchies to capture ingredient, brand, and dose-specific information [22]. EHR medication records were matched using a hierarchical approach prioritizing RXNorm codes when available, followed by ingredient-level matching, and finally natural language processing and pattern matching on free-text medication orders when structured codes were absent. For anthropometric measurements (height, weight, BMI), we created a unified vocabulary from SNOMED (https://www.snomed.org/, https://athena.ohdsi.org) and LOINC (https://loinc.org/) terminologies and matched EHR measurement descriptions using standardized text matching algorithms with abbreviation expansion and synonym resolution; ambiguous mappings were resolved using OpenAI GPT-4o (https://platform.openai.com/docs/models/gpt-4o) with summary statistics as context, followed by manual verification. For diagnoses, we developed a hierarchical disease concept database from the nference knowledge graph and matched EHR diagnosis descriptions and codes by identifying the most specific common child concept in the hierarchy. This approach enabled consistent identification of clinical entities while preserving granularity where available.
Code Availability
The analysis code is not publicly available. The corresponding author should be contacted for additional details.
Conflict: of Interest:
The authors are employees of nference, inc., which conducts research collaborations with various biopharmaceutical companies whose therapeutic products are included in this study. None of these companies, nor any other nference collaborator, funded, supported, or had any role in the independent study design, data acquisition, analysis, interpretation, manuscript preparation, or the decision to submit this work for publication. All analyses were conducted by the authors using de-identified electronic health record data. The authors declare no additional competing interests.
Supplementary Materials
The following supporting information can be downloaded at the website of this paper posted on Preprints.org.
Author Contributions
V.S. conceived and designed the study. Data queries and statistical analyses were conducted by R.M., C.G, A.J.V. and K.M. All authors interpreted the data, contributed to writing the manuscript and the revisions, and approved the final version for submission.
Funding
This research received no external funding.
Acknowledgments
We thank the nference engineering team for the development of the nference federated AI platform, and Patrick Lenehan for helpful clinical feedback.
References
- Rodbard, H. W.; et al. Semaglutide Added to Basal Insulin in Type 2 Diabetes (SUSTAIN 5): A Randomized, Controlled Trial. J. Clin. Endocrinol. Metab. 2018, 103, 2291–2301. [Google Scholar] [CrossRef]
- Committee, A. D. A. P. P. 13. Older Adults: Standards of Care in Diabetes—2025. Diabetes Care 2024, 48, S266–S282. [Google Scholar] [CrossRef] [PubMed]
- Lipska, K. J.; et al. Potential overtreatment of diabetes mellitus in older adults with tight glycemic control. JAMA Intern. Med. 2015, 175, 356–362. [Google Scholar] [CrossRef] [PubMed]
- Alexopoulos, A.-S.; et al. Deintensification of Treatment With Sulfonylurea and Insulin After Severe Hypoglycemia Among Older Adults With Diabetes. JAMA Netw. Open 2021, 4, e2132215. [Google Scholar] [CrossRef] [PubMed]
- Drucker, D. J. Mechanisms of action and therapeutic application of glucagon-like peptide-1. Cell Metab. 2018, 27, 740–756. [Google Scholar] [CrossRef] [PubMed]
- Wilding, J. P. H.; et al. Once-weekly semaglutide in adults with overweight or obesity. N. Engl. J. Med. 2021, 384, 989–1002. [Google Scholar] [CrossRef] [PubMed]
- Jastreboff, A. M.; et al. Tirzepatide once weekly for the treatment of obesity. N. Engl. J. Med. 2022, 387, 205–216. [Google Scholar] [CrossRef] [PubMed]
- Dahl, D.; et al. Effect of Subcutaneous Tirzepatide vs Placebo Added to Titrated Insulin Glargine on Glycemic Control in Patients With Type 2 Diabetes: The SURPASS-5 Randomized Clinical Trial. JAMA 2022, 327, 534–545. [Google Scholar] [CrossRef] [PubMed]
- Zinman, B.; et al. Empagliflozin, cardiovascular outcomes, and mortality in type 2 diabetes. N. Engl. J. Med. 2015, 373, 2117–2128. [Google Scholar] [CrossRef] [PubMed]
- Lipska, K. J.; et al. Comparative Effectiveness of Glucagon-like Peptide-1 Receptor Agonists Versus Oral Agents for Insulin Discontinuation in Type 2 Diabetes: A Target Trial Emulation. Ann. Intern. Med. 2026. [Google Scholar] [CrossRef] [PubMed]
- Frías, J. P.; et al. Tirzepatide versus semaglutide once weekly in patients with type 2 diabetes. N. Engl. J. Med. 2021, 385, 503–515. [Google Scholar] [CrossRef] [PubMed]
- Lincoff, A. M.; et al. Semaglutide and cardiovascular outcomes in obesity without diabetes. N. Engl. J. Med. 2023, 389, 2221–2232. [Google Scholar] [CrossRef] [PubMed]
- Rosenstock, J.; et al. Tirzepatide vs Insulin Lispro Added to Basal Insulin in Type 2 Diabetes: The SURPASS-6 Randomized Clinical Trial. JAMA 2023, 330, 1631–1640. [Google Scholar] [PubMed]
- Hernán, M. A.; Robins, J. M. Using Big Data to Emulate a Target Trial When a Randomized Trial Is Not Available. Am. J. Epidemiol. 2016, 183, 758–764. [Google Scholar] [CrossRef] [PubMed]
- Lund, J. L.; Richardson, D. B.; Stürmer, T. The active comparator, new user study design in pharmacoepidemiology: historical foundations and contemporary application. Curr. Epidemiol. Rep. 2015, 2, 221–228. [Google Scholar] [CrossRef] [PubMed]
- Charles, K.; Lewis, M. J.; Montgomery, E.; Reid, M. The 2021 Chronic Kidney Disease Epidemiology Collaboration Race-Free Estimated Glomerular Filtration Rate Equations in Kidney Disease: Leading the Way in Ending Disparities. Health Equity 2024, 8, 39–45. [Google Scholar] [CrossRef] [PubMed]
- Austin, P. C. Balance diagnostics for comparing the distribution of baseline covariates between treatment groups in propensity-score matched samples. Stat. Med. 2009, 28, 3083–3107. [Google Scholar] [CrossRef] [PubMed]
- Wang, S. V.; et al. STaRT-RWE: structured template for planning and reporting on the implementation of real world evidence studies. BMJ 2021, 372, m4856. [Google Scholar] [CrossRef] [PubMed]
- Langan, S. M.; et al. The reporting of studies conducted using observational routinely collected health data statement for pharmacoepidemiology (RECORD-PE). BMJ 2018, 363, k3532. [Google Scholar] [CrossRef] [PubMed]
- Wang, S. V.; et al. Reporting to Improve Reproducibility and Facilitate Validity Assessment for Healthcare Database Studies V1.0. Pharmacoepidemiol. Drug Saf. 2017, 26, 1018–1032. [Google Scholar] [CrossRef] [PubMed]
- Murugadoss, K.; et al. Building a best-in-class automated de-identification tool for electronic health records through ensemble learning. Patterns (N. Y.) 2021, 2, 100255. [Google Scholar] [CrossRef] [PubMed]
- Venkatakrishnan, A. J.; et al. Clinical nSights: A software platform to accelerate real world oncology analyses. J. Clin. Oncol. 2024. [Google Scholar] [CrossRef]
Figure 1.
Study design and cohort derivation. Schematic of the new-user active-comparator design and the construction of the three matched comparisons. Patients with type 2 diabetes receiving basal insulin who initiated semaglutide, tirzepatide, or an SGLT2-inhibitor (SGLT2-i) were identified, and 1:1 propensity-score matching was applied within each comparison: semaglutide versus SGLT2-i (n=1,029), tirzepatide versus SGLT2-i (n=254), and tirzepatide versus semaglutide (n=272).
Figure 1.
Study design and cohort derivation. Schematic of the new-user active-comparator design and the construction of the three matched comparisons. Patients with type 2 diabetes receiving basal insulin who initiated semaglutide, tirzepatide, or an SGLT2-inhibitor (SGLT2-i) were identified, and 1:1 propensity-score matching was applied within each comparison: semaglutide versus SGLT2-i (n=1,029), tirzepatide versus SGLT2-i (n=254), and tirzepatide versus semaglutide (n=272).
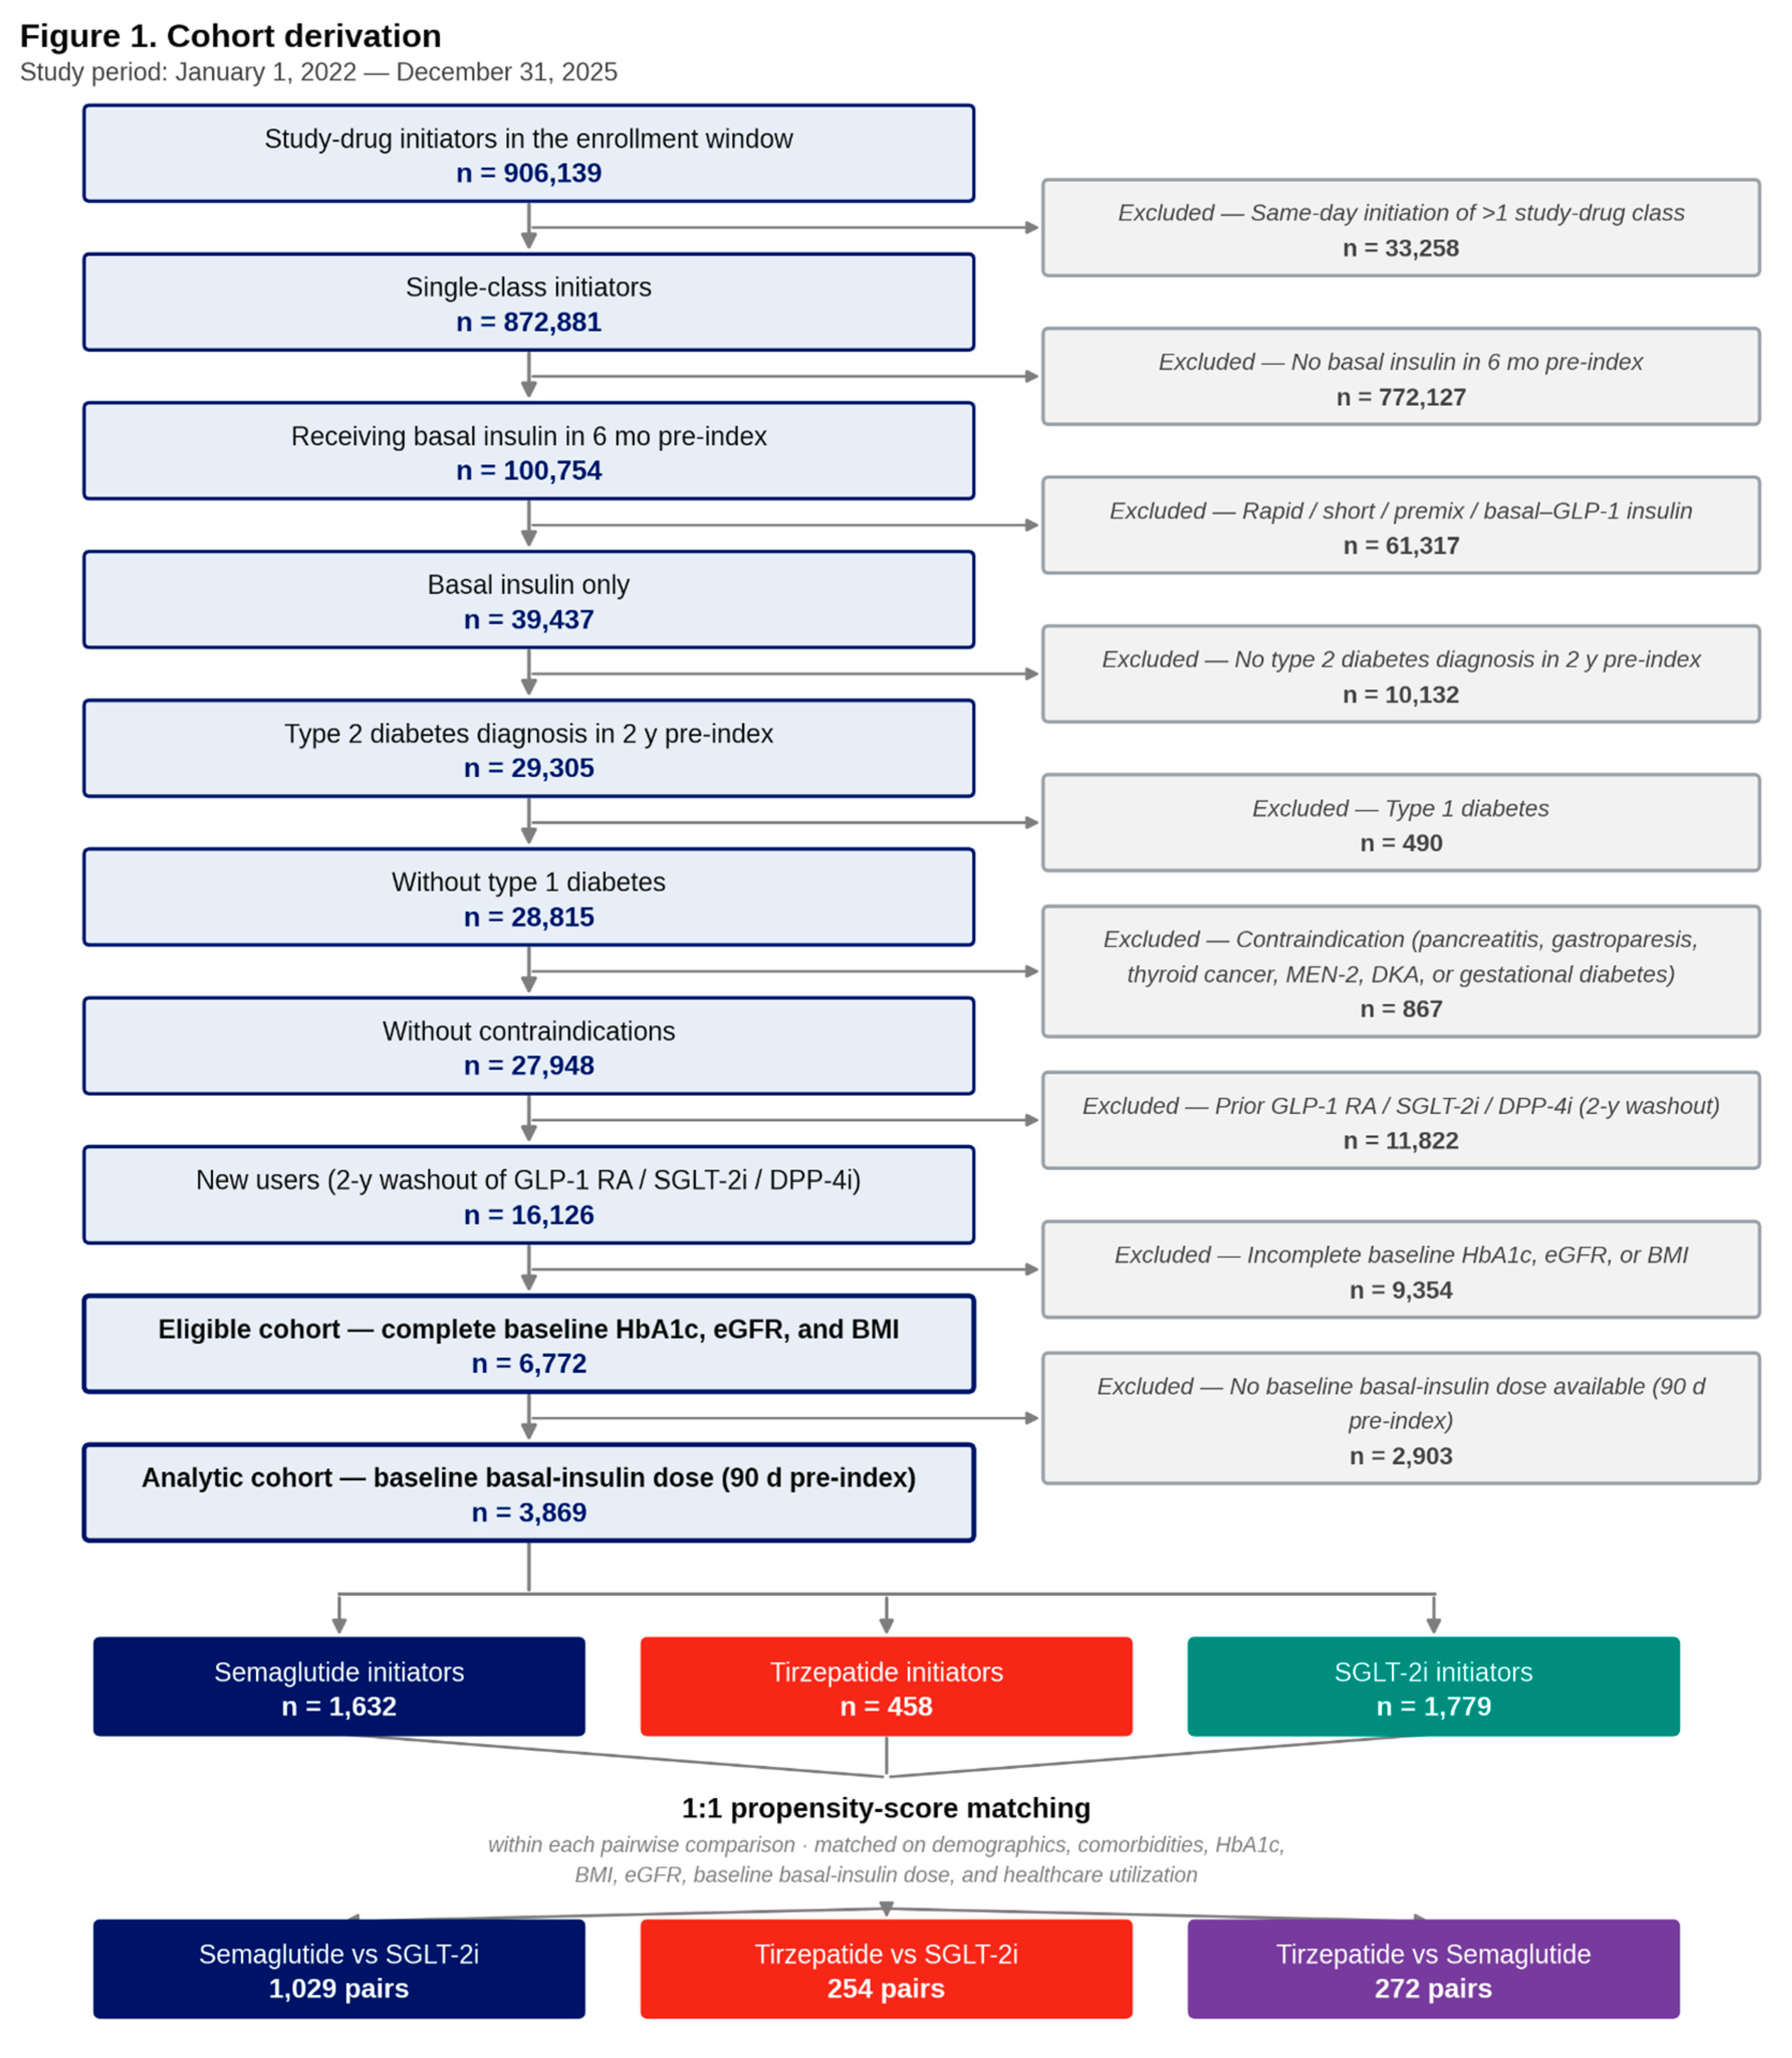
Figure 2.
Cumulative incidence of basal-insulin discontinuation and ≥20% deintensification over 24 months. Aalen-Johansen cumulative-incidence curves with death treated as a competing risk, for (A, B) semaglutide versus SGLT2-i, (C, D) tirzepatide versus SGLT2-i, and (E, F) tirzepatide versus semaglutide; left column, insulin discontinuation; right column, ≥20% basal-dose reduction. Shaded regions are 95% confidence bands. The subdistribution hazard ratio (sHR) and Gray's-test P value are annotated on each panel, with at-risk (cumulative events) counts below.
Figure 2.
Cumulative incidence of basal-insulin discontinuation and ≥20% deintensification over 24 months. Aalen-Johansen cumulative-incidence curves with death treated as a competing risk, for (A, B) semaglutide versus SGLT2-i, (C, D) tirzepatide versus SGLT2-i, and (E, F) tirzepatide versus semaglutide; left column, insulin discontinuation; right column, ≥20% basal-dose reduction. Shaded regions are 95% confidence bands. The subdistribution hazard ratio (sHR) and Gray's-test P value are annotated on each panel, with at-risk (cumulative events) counts below.
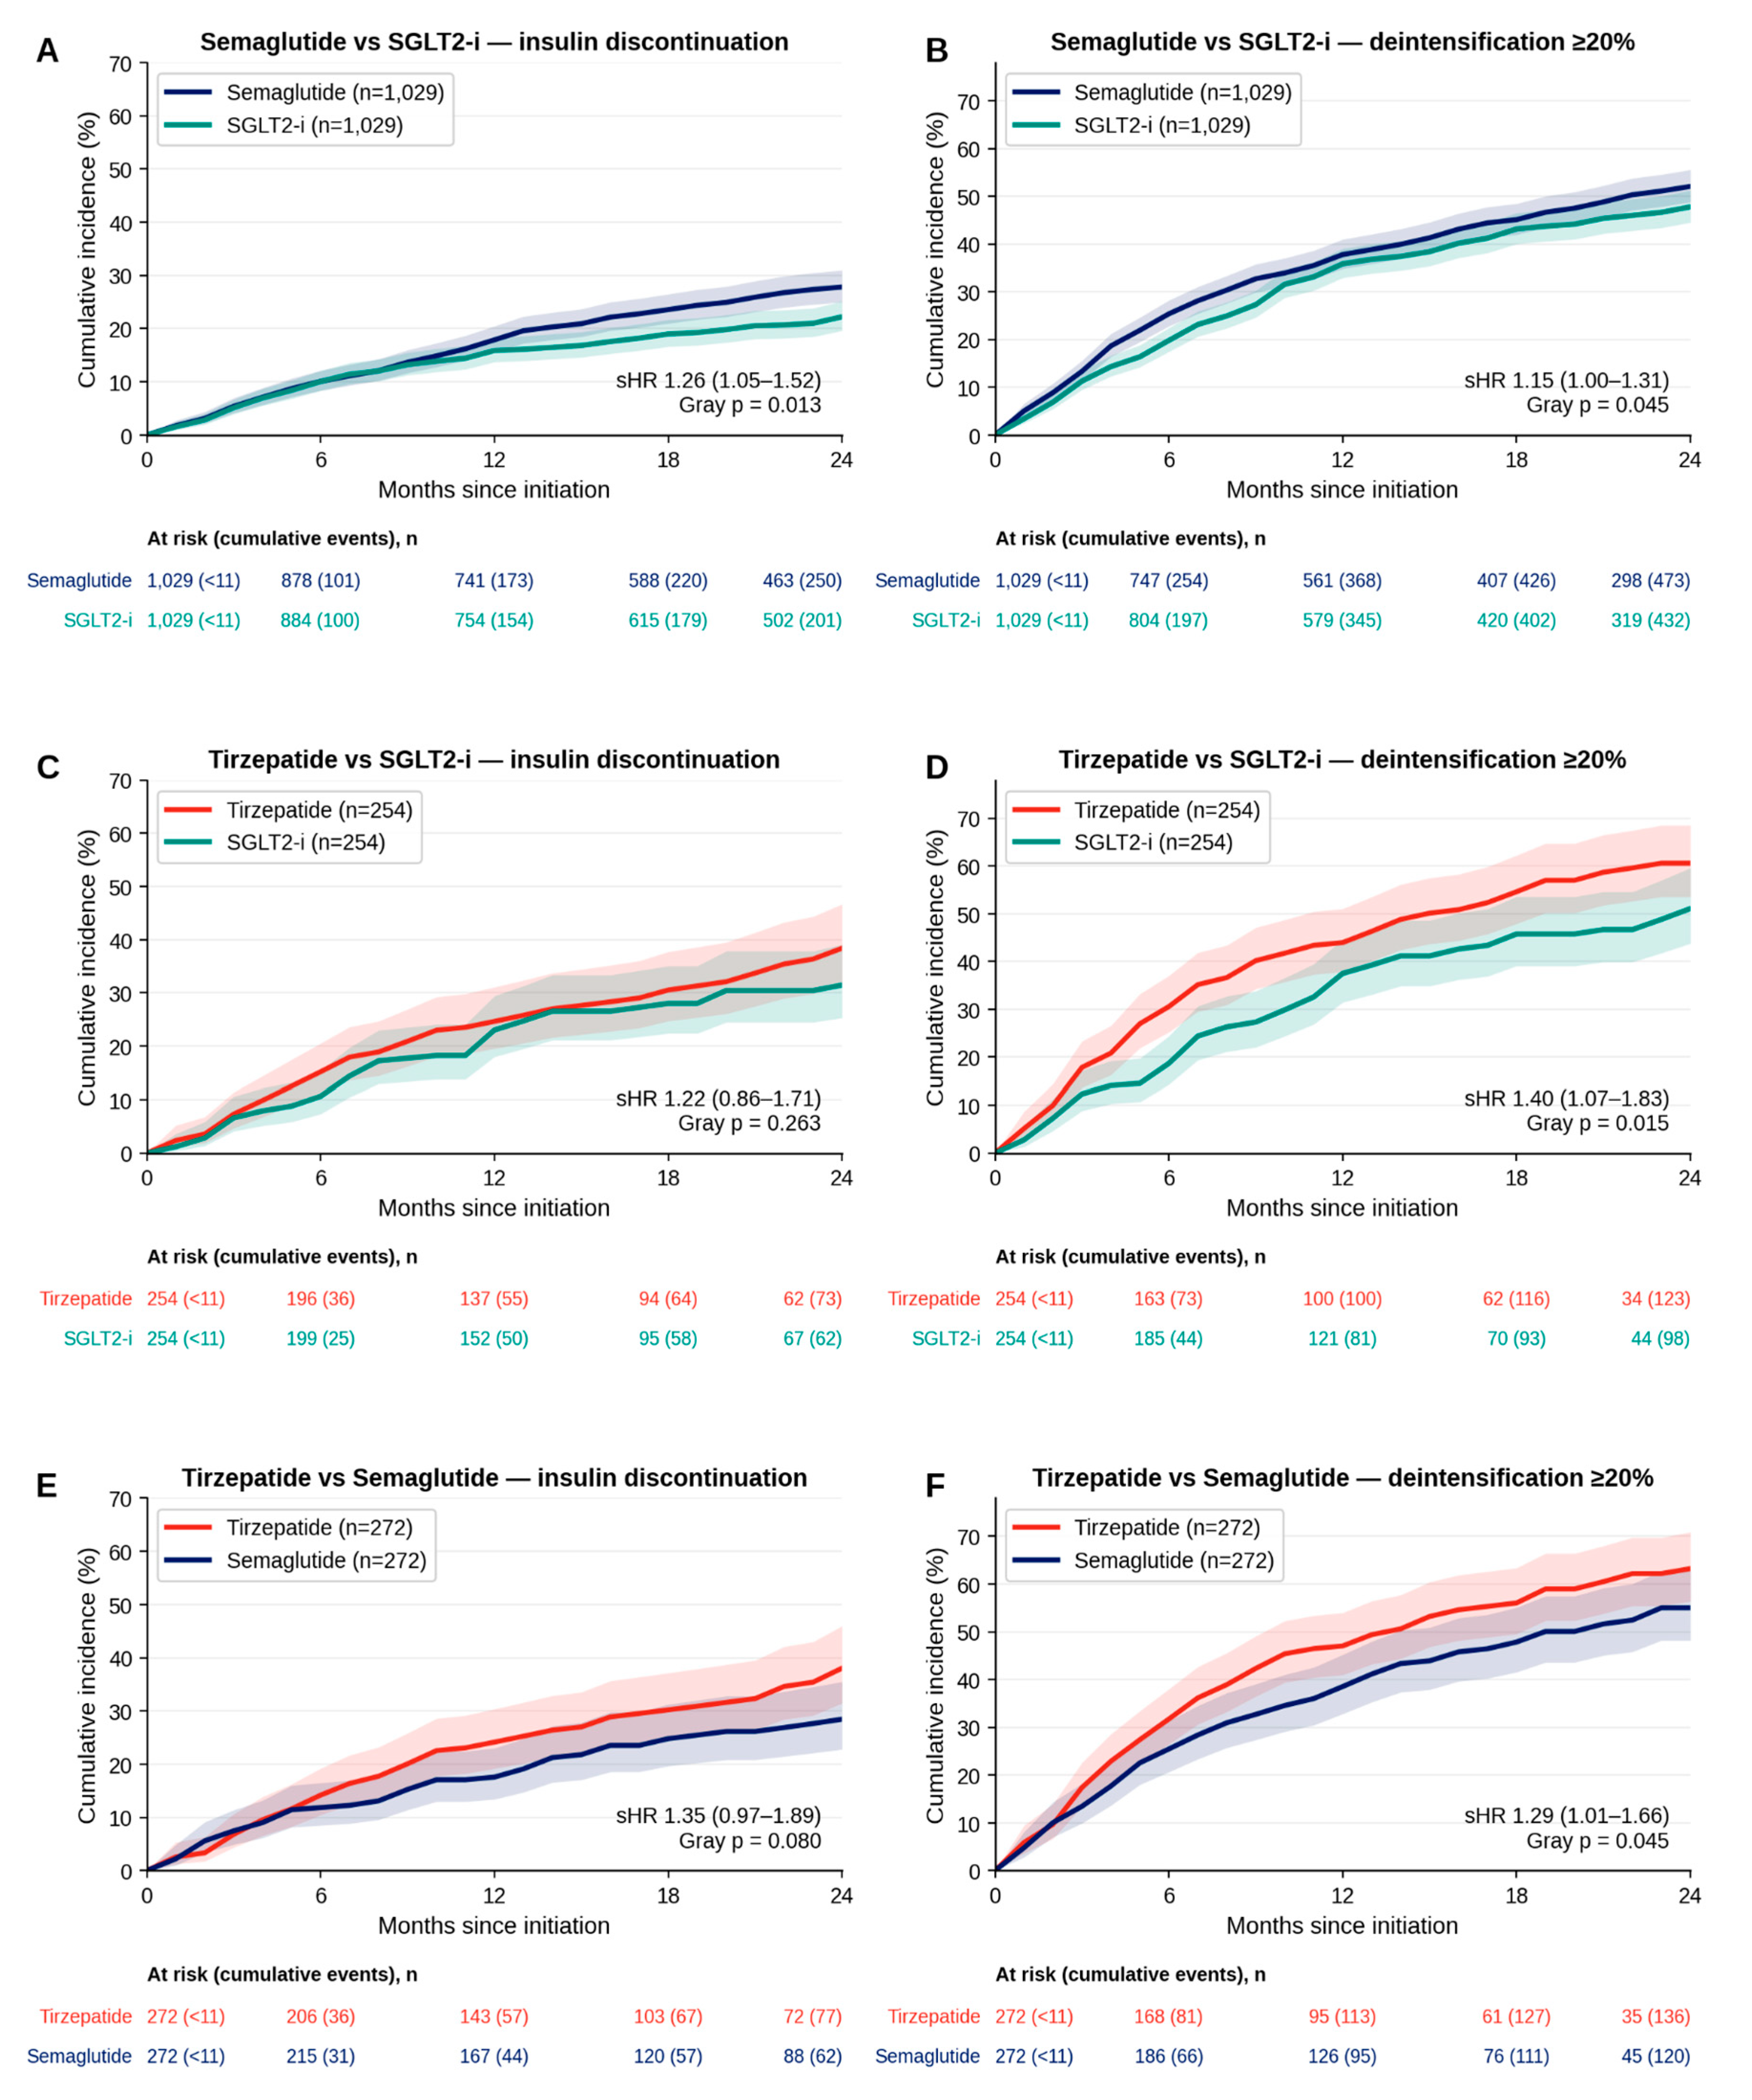
Figure 3.
Subgroup analysis of insulin discontinuation and ≥20% deintensification. Forest plot of subdistribution hazard ratios (anchor versus comparator) within prespecified subgroups defined by sex, age, BMI, baseline HbA1c, and baseline insulin dose, for each of the three matched comparisons, shown separately for (A) insulin discontinuation and (B) ≥20% deintensification. Squares denote point estimates and horizontal lines 95% confidence intervals; filled symbols indicate associations that remained significant after Benjamini-Hochberg correction across subgroups within each comparison and endpoint. The dashed vertical line marks the null (sHR = 1).
Figure 3.
Subgroup analysis of insulin discontinuation and ≥20% deintensification. Forest plot of subdistribution hazard ratios (anchor versus comparator) within prespecified subgroups defined by sex, age, BMI, baseline HbA1c, and baseline insulin dose, for each of the three matched comparisons, shown separately for (A) insulin discontinuation and (B) ≥20% deintensification. Squares denote point estimates and horizontal lines 95% confidence intervals; filled symbols indicate associations that remained significant after Benjamini-Hochberg correction across subgroups within each comparison and endpoint. The dashed vertical line marks the null (sHR = 1).
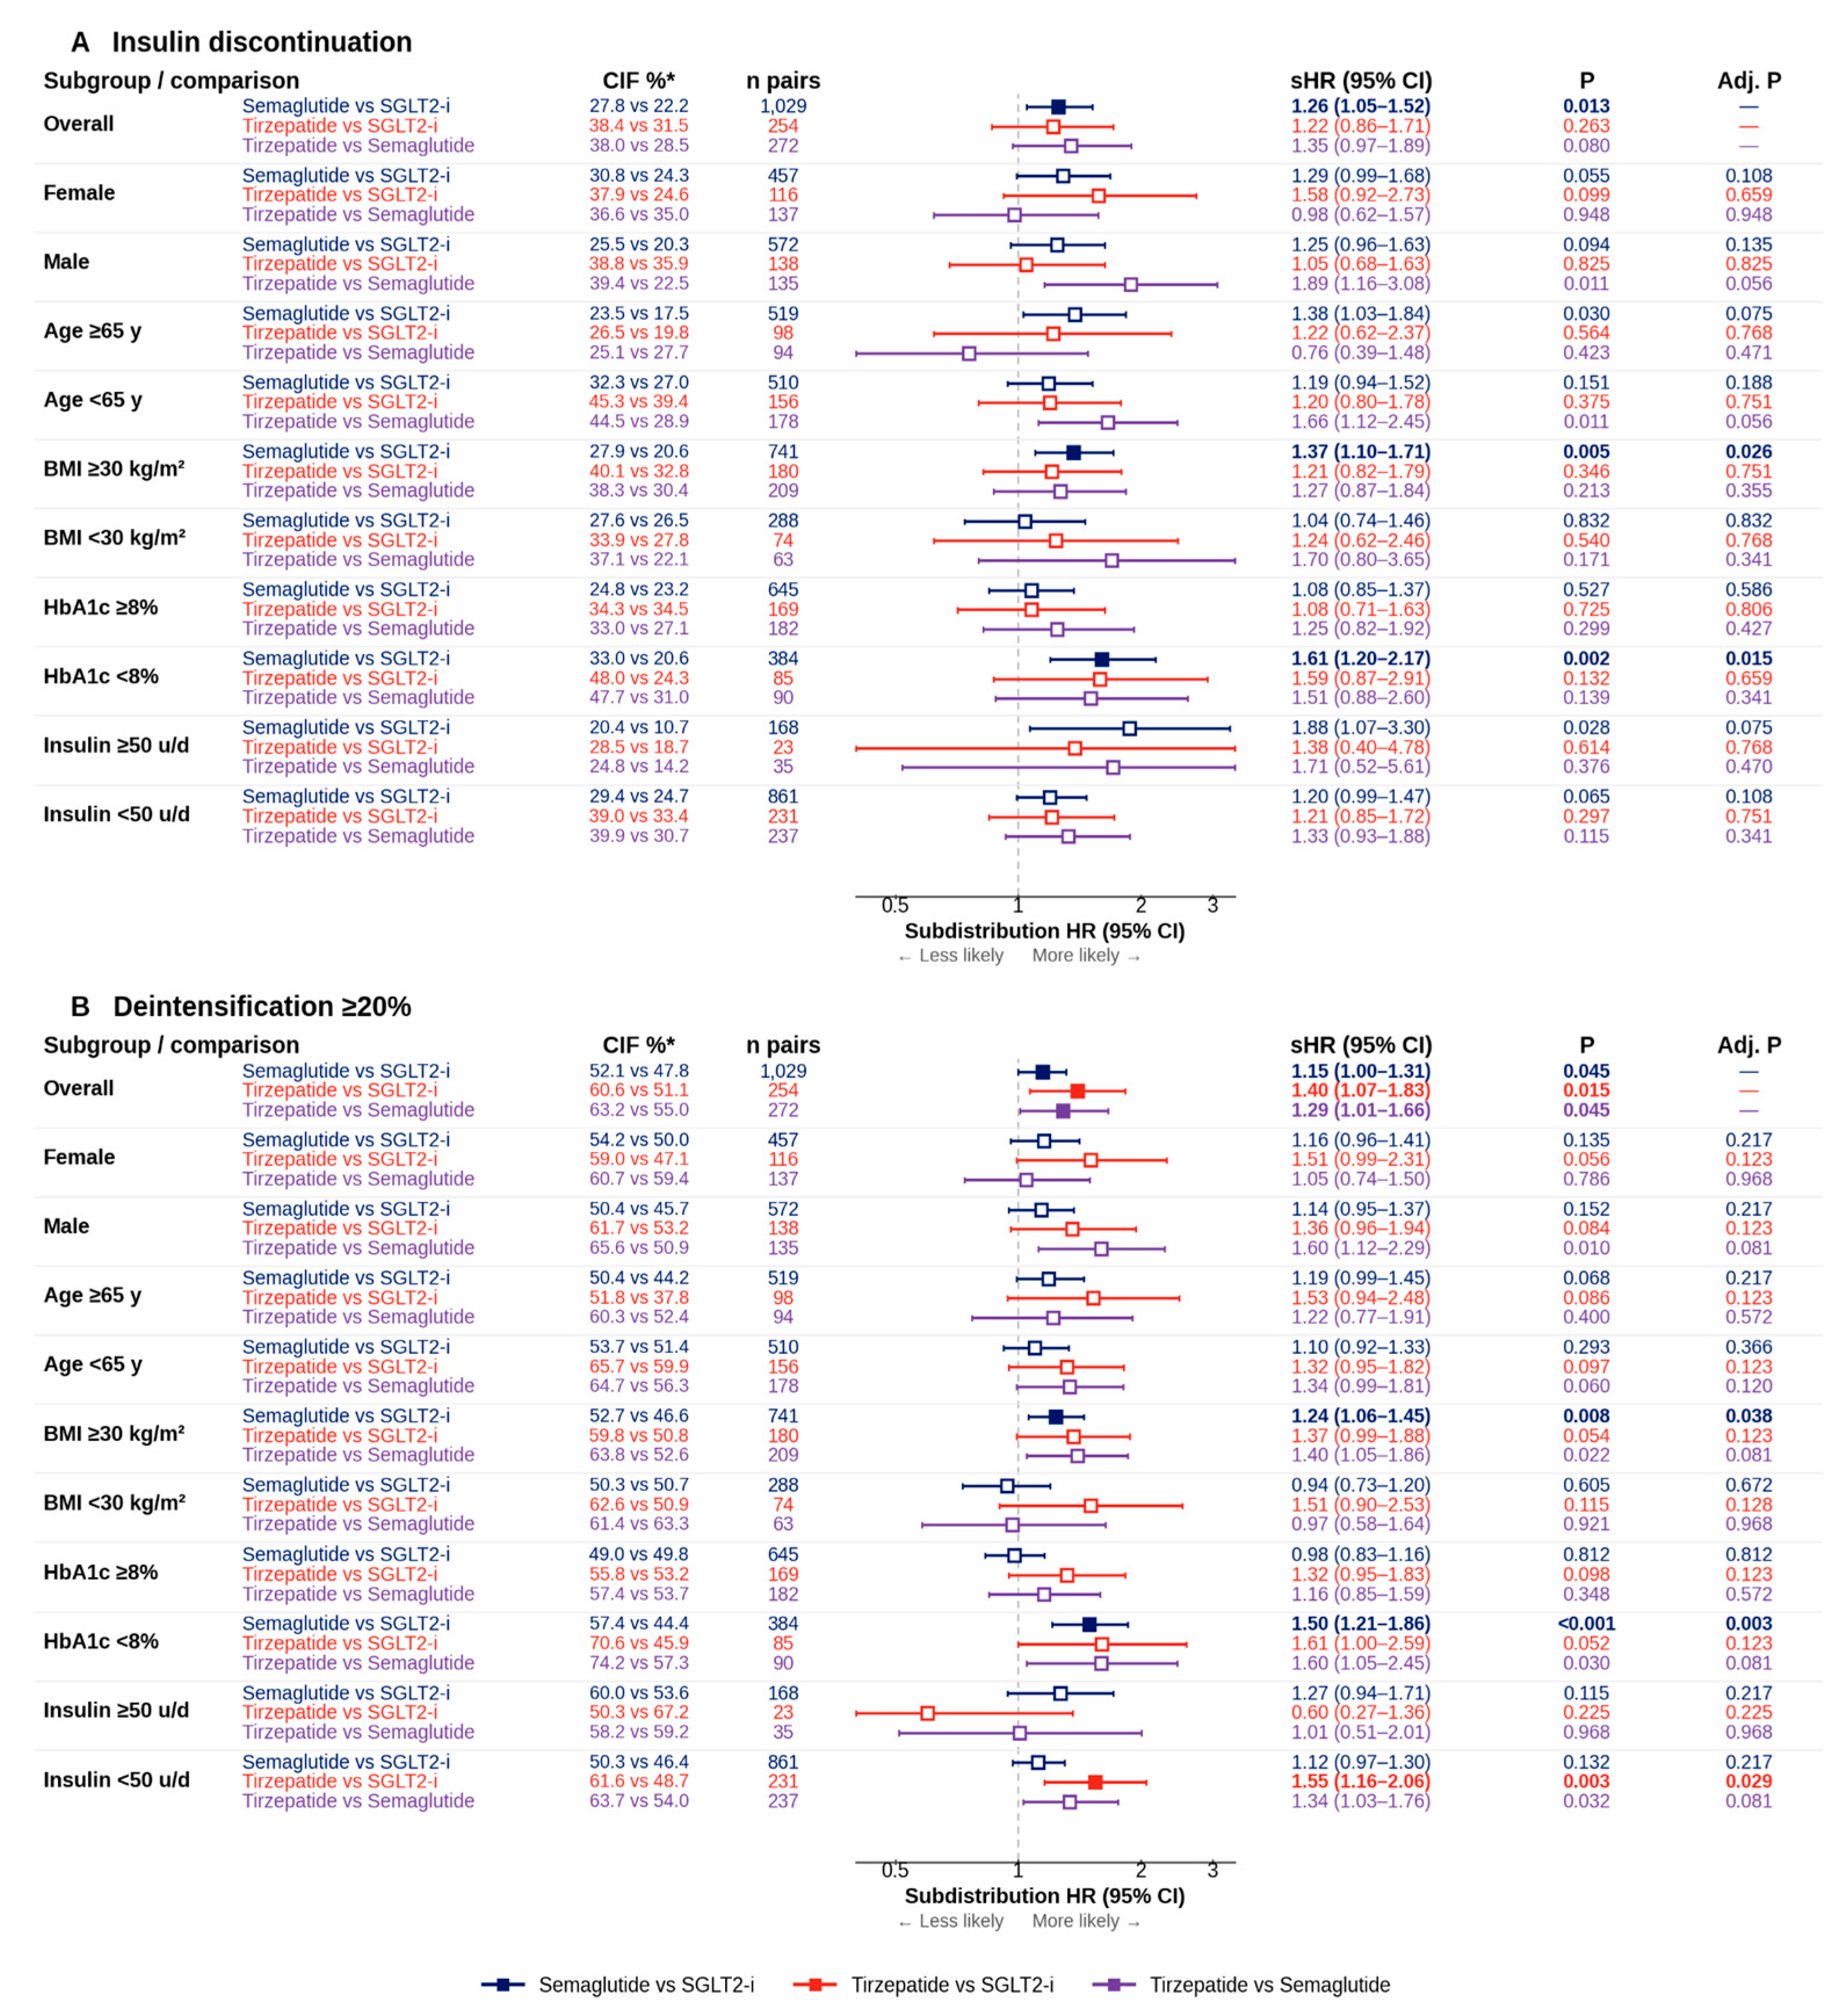
Figure 4.
HbA1c trajectory over 24 months across the three matched comparisons. Mean change in HbA1c from baseline (percentage points, ± SEM) at 6-month landmarks. Columns correspond to the comparisons—semaglutide versus SGLT2-i (A, D, G), tirzepatide versus SGLT2-i (B, E, H), and tirzepatide versus semaglutide (C, F, I). Top row (A–C), matched comparison of the anchor and comparator cohorts; middle row (D–F), the anchor cohort stratified by whether patients discontinued insulin at any point during follow-up; bottom row (G–I), the comparator cohort similarly stratified. Per-landmark two-sample P values are shown above each panel and the number of patients contributing at each landmark below. Discontinuation status reflects discontinuation at any time during follow-up, without regard to its timing relative to the landmark.
Figure 4.
HbA1c trajectory over 24 months across the three matched comparisons. Mean change in HbA1c from baseline (percentage points, ± SEM) at 6-month landmarks. Columns correspond to the comparisons—semaglutide versus SGLT2-i (A, D, G), tirzepatide versus SGLT2-i (B, E, H), and tirzepatide versus semaglutide (C, F, I). Top row (A–C), matched comparison of the anchor and comparator cohorts; middle row (D–F), the anchor cohort stratified by whether patients discontinued insulin at any point during follow-up; bottom row (G–I), the comparator cohort similarly stratified. Per-landmark two-sample P values are shown above each panel and the number of patients contributing at each landmark below. Discontinuation status reflects discontinuation at any time during follow-up, without regard to its timing relative to the landmark.
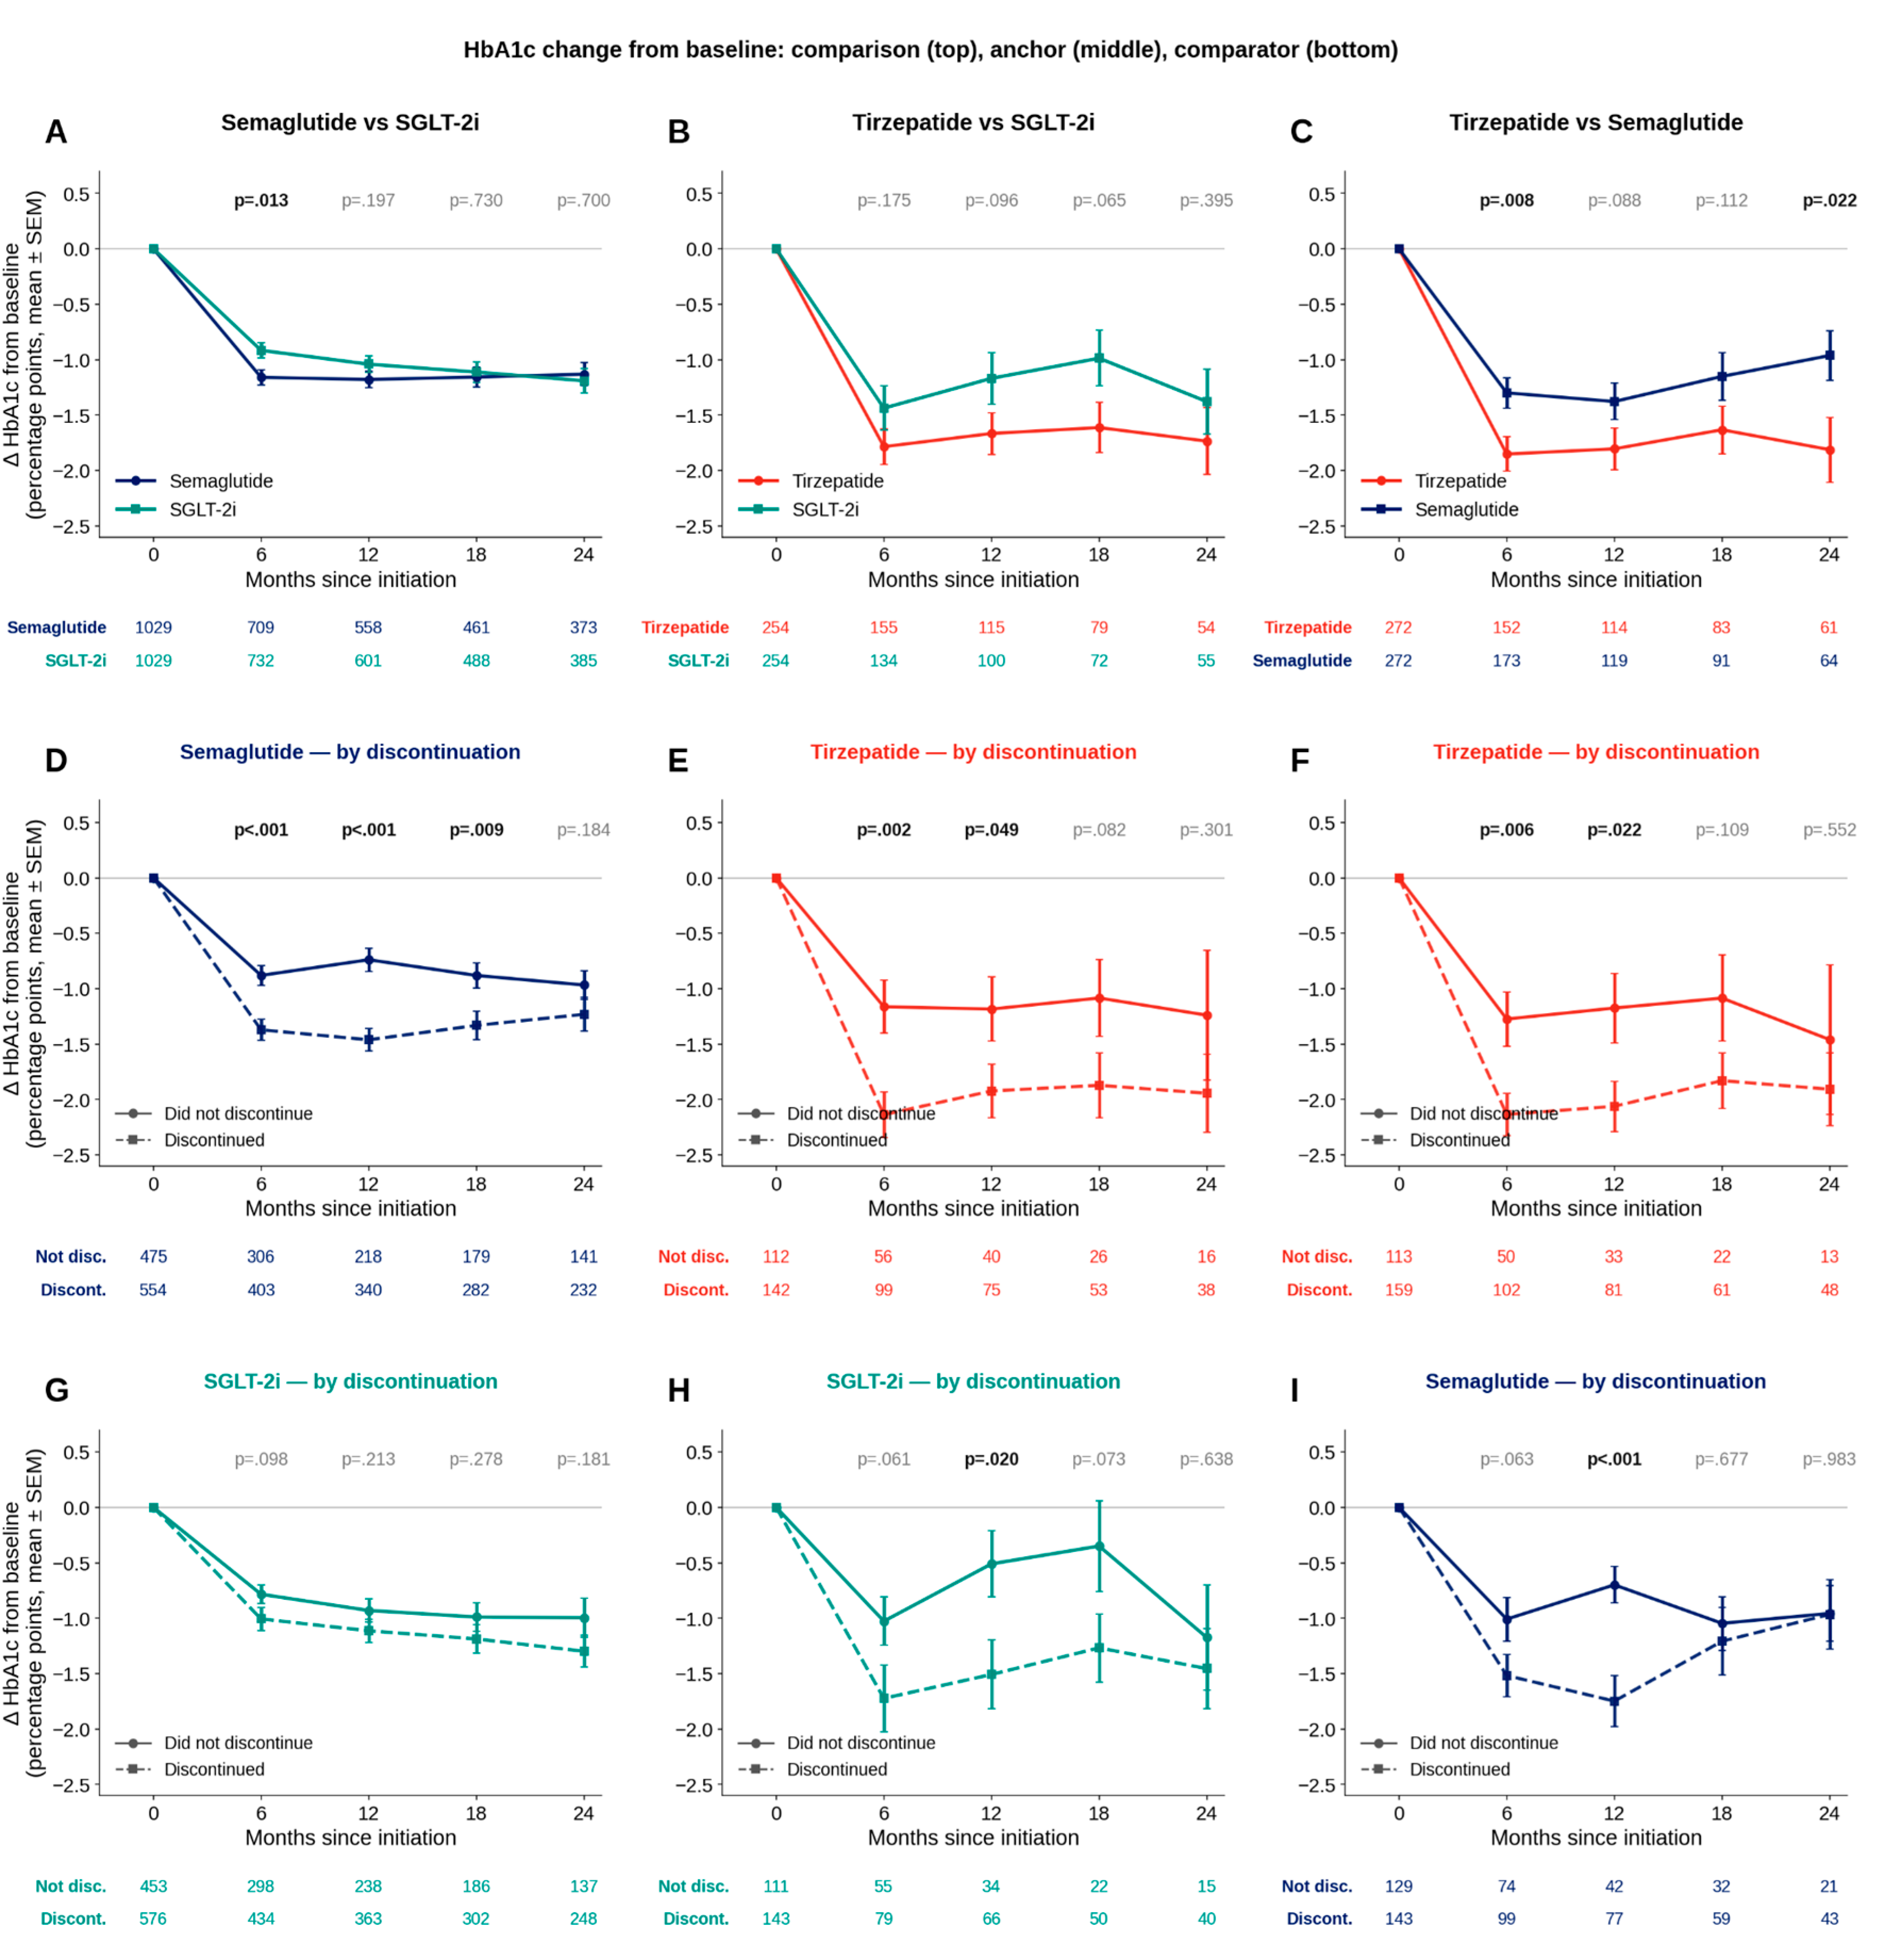
Figure 5.
Real-world incretin dose distribution over time. Stacked-bar composition of drug dose across the approved titration ladder at 6-month landmarks for (A) semaglutide (0.25, 0.5, 1, 2 mg) and (B) tirzepatide (2.5, 5, 7.5, 10, 12.5, 15 mg). All patients begin at the starter dose; bar shading darkens with increasing dose, and the number of patients contributing at each landmark is shown above the bars.
Figure 5.
Real-world incretin dose distribution over time. Stacked-bar composition of drug dose across the approved titration ladder at 6-month landmarks for (A) semaglutide (0.25, 0.5, 1, 2 mg) and (B) tirzepatide (2.5, 5, 7.5, 10, 12.5, 15 mg). All patients begin at the starter dose; bar shading darkens with increasing dose, and the number of patients contributing at each landmark is shown above the bars.
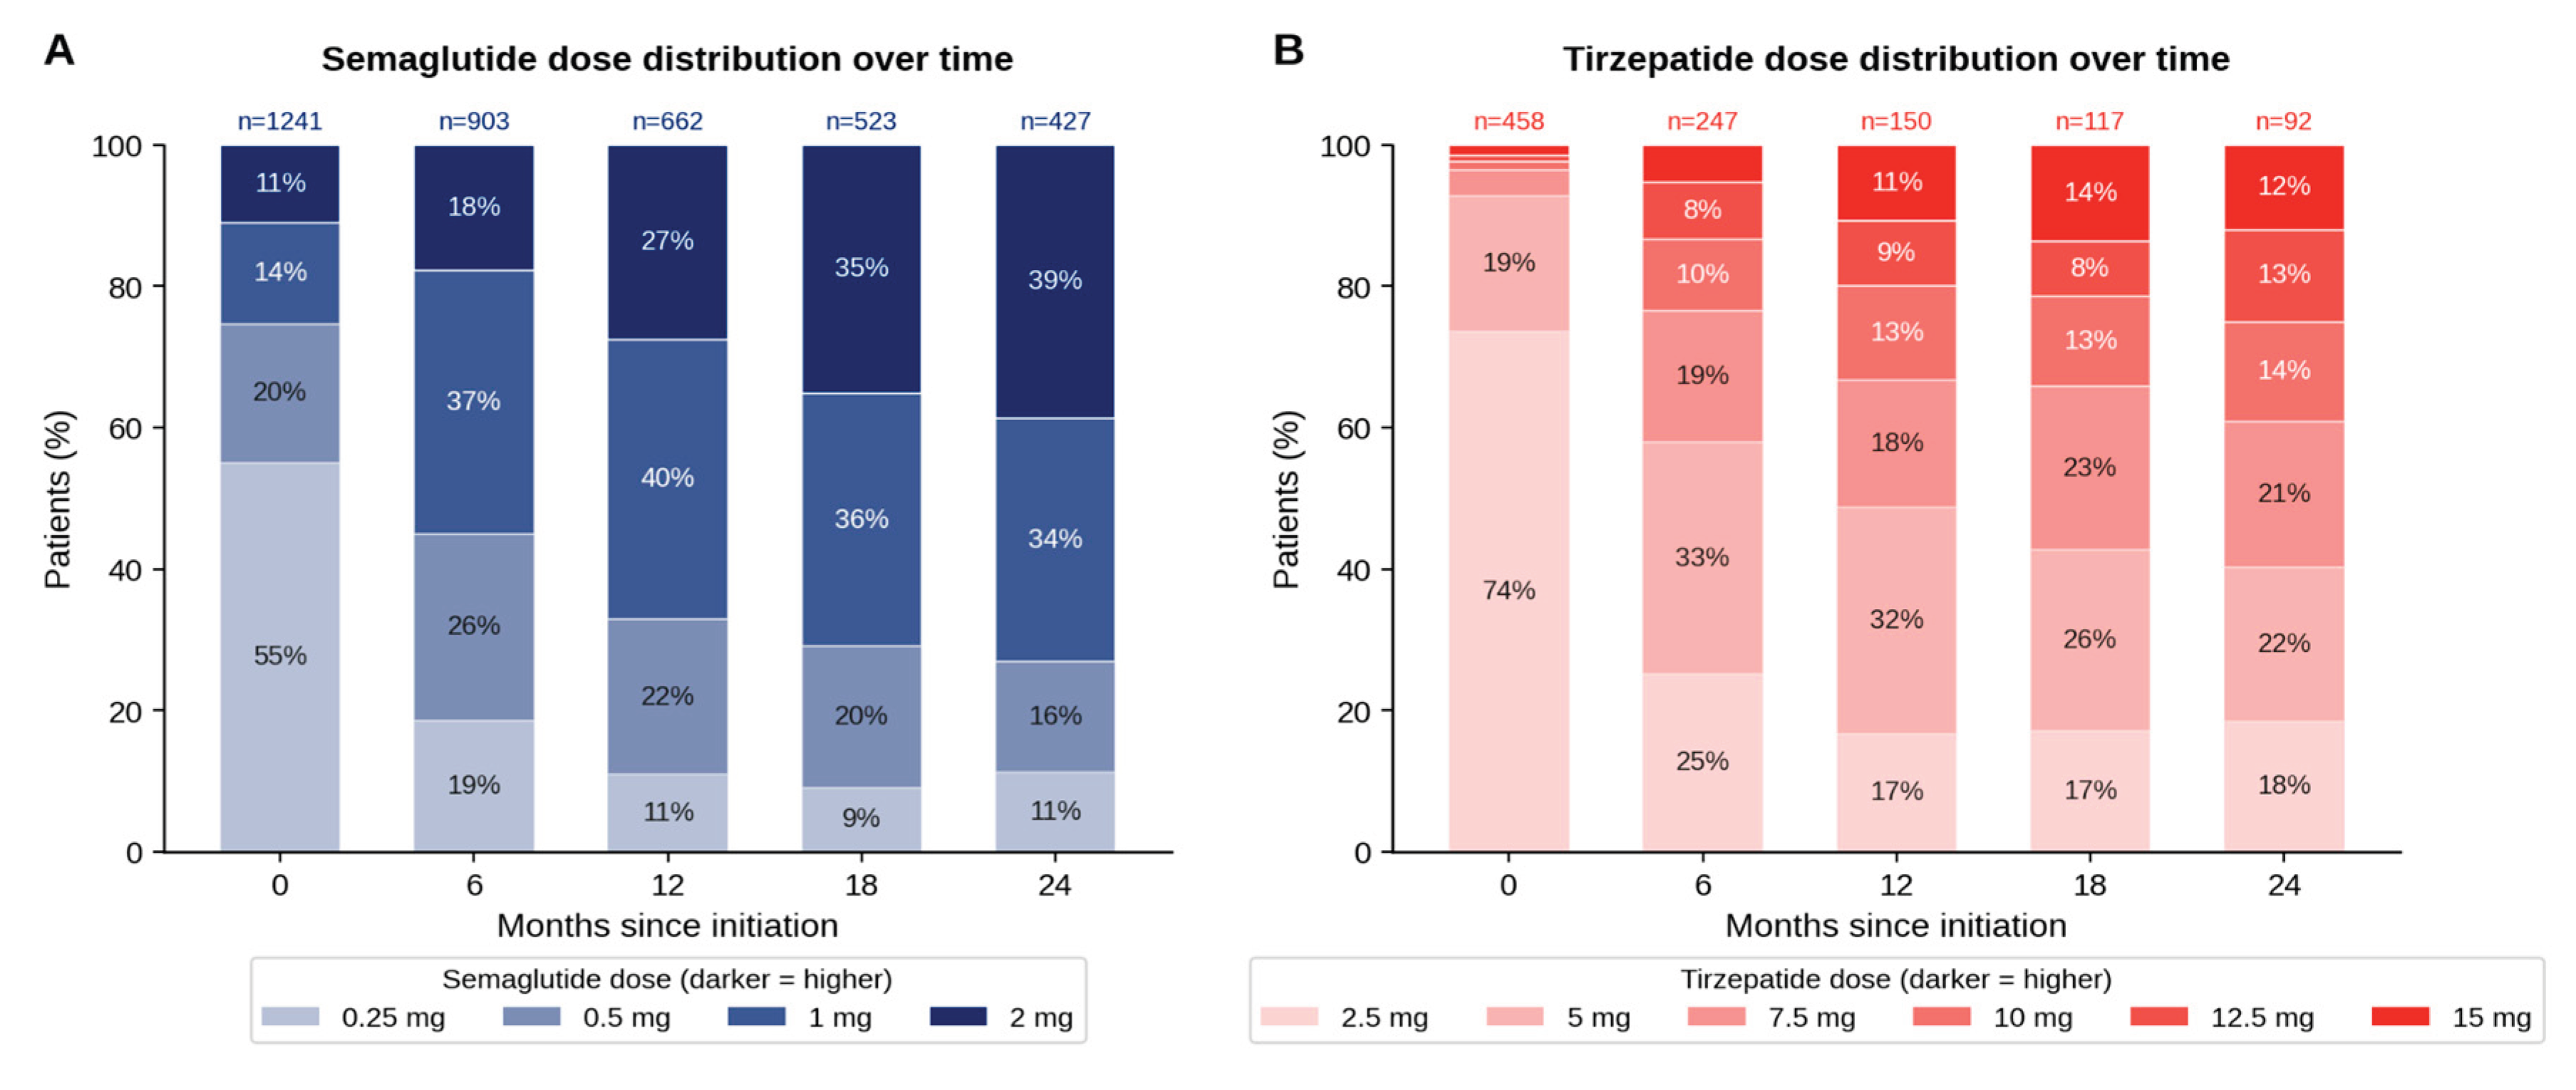

Table 1.
Baseline characteristics of the underlying cohorts before matching. Demographic and clinical characteristics of patients with type 2 diabetes receiving basal insulin who initiated semaglutide, tirzepatide, or an SGLT2-inhibitor, shown for each treatment group prior to propensity-score matching, with standardized mean differences between groups.
Table 1.
Baseline characteristics of the underlying cohorts before matching. Demographic and clinical characteristics of patients with type 2 diabetes receiving basal insulin who initiated semaglutide, tirzepatide, or an SGLT2-inhibitor, shown for each treatment group prior to propensity-score matching, with standardized mean differences between groups.
| Characteristic | Semaglutide (n=1,632) | SGLT2-i (n=1,779) | Tirzepatide (n=458) | SMD (Sema vs SGLT2-i) | SMD (Tirz vs SGLT2-i) | SMD (Tirz vs Sema) |
|---|---|---|---|---|---|---|
| Age, y, mean (SD) | 61.8 (13.3) | 66.6 (12.4) | 59.5 (12.1) | -0.374 | -0.577 | -0.178 |
| HbA1c, %, mean (SD) | 8.8 (2.1) | 8.6 (1.9) | 8.9 (2.2) | +0.117 | +0.161 | +0.047 |
| eGFR, mL/min/1.73m², mean (SD) | 76.1 (27.5) | 68.9 (25.9) | 78.5 (26.6) | +0.269 | +0.368 | +0.092 |
| BMI, kg/m², mean (SD) | 32.7 (4.6) | 30.6 (4.9) | 33.0 (4.6) | +0.449 | +0.513 | +0.067 |
| Basal insulin, units/day, median [Q1,Q3] | 28 [17,46] | 25 [16,42] | 26 [16,43] | +0.141 | +0.020 | -0.120 |
| Charlson comorbidity index, median [Q1,Q3] | 2 [1,4] | 3 [2,5] | 2 [1,4] | -0.401 | -0.583 | -0.148 |
| Encounters, prior year, median [Q1,Q3] | 20 [11,34] | 20 [11,33] | 17 [9,30] | -0.003 | -0.201 | -0.198 |
| Female sex, n (%) | 790 (48.4%) | 677 (38.1%) | 225 (49.1%) | +0.210 | +0.225 | +0.014 |
| Race, n (%) | +0.112 | +0.088 | +0.140 | |||
| White | 1,109 (68.0%) | 1,185 (66.6%) | 291 (63.5%) | |||
| Black | 367 (22.5%) | 400 (22.5%) | 108 (23.6%) | |||
| Asian | 33 (2.0%) | 62 (3.5%) | 15 (3.3%) | |||
| Other | 25 (1.5%) | 15 (0.8%) | <11 | |||
| Unknown | 83 (5.1%) | 90 (5.1%) | 35 (7.6%) | |||
| Ethnicity, n (%) | +0.036 | +0.209 | +0.181 | |||
| Hispanic or latino | 110 (6.7%) | 111 (6.2%) | 27 (5.9%) | |||
| Not hispanic or latino | 1,319 (80.8%) | 1,463 (82.2%) | 344 (75.1%) | |||
| Unknown | 203 (12.4%) | 205 (11.5%) | 87 (19.0%) | |||
| Smoking status, n (%) | +0.045 | +0.060 | +0.086 | |||
| Current | 130 (8.0%) | 139 (7.8%) | 29 (6.3%) | |||
| Former | <11 | <11 | <11 | |||
| Unknown | 1,500 (91.9%) | 1,634 (91.8%) | 427 (93.2%) | |||
| Index year, n (%) | +0.091 | +0.655 | +0.602 | |||
| 2022 | 496 (30.4%) | 611 (34.3%) | 52 (11.4%) | |||
| 2023 | 595 (36.5%) | 598 (33.6%) | 150 (32.8%) | |||
| 2024 | 351 (21.5%) | 356 (20.0%) | 126 (27.5%) | |||
| 2025 | 190 (11.6%) | 214 (12.0%) | 130 (28.4%) | |||
| Basal insulin type, n (%) | +0.062 | +0.132 | +0.135 | |||
| Degludec | 173 (10.6%) | 215 (12.1%) | 55 (12.0%) | |||
| Detemir | 168 (10.3%) | 173 (9.7%) | 31 (6.8%) | |||
| Glargine | 1,213 (74.3%) | 1,292 (72.6%) | 353 (77.1%) | |||
| Nph | 78 (4.8%) | 99 (5.6%) | 19 (4.1%) | |||
| Duration of basal insulin therapy (months), median [Q1,Q3] | 18 [3,56] | 18 [3,59] | 16 [5,62] | — | — | — |
| Number of basal insulin prescription orders, median [Q1,Q3] | 6 [3,12] | 5 [2,11] | 7 [3,13] | — | — | — |
| Metformin, n (%) | 827 (50.7%) | 870 (48.9%) | 219 (47.8%) | +0.035 | +0.022 | +0.057 |
| Sulfonylurea, n (%) | 378 (23.2%) | 425 (23.9%) | 71 (15.5%) | +0.017 | +0.212 | +0.195 |
| Thiazolidinedione, n (%) | 59 (3.6%) | 78 (4.4%) | 14 (3.1%) | +0.039 | +0.070 | +0.031 |
| DPP-4 inhibitor, n (%) | 152 (9.3%) | 230 (12.9%) | 30 (6.6%) | +0.115 | +0.216 | +0.102 |
| Neuropathy, n (%) | 417 (25.6%) | 512 (28.8%) | 98 (21.4%) | +0.073 | +0.171 | +0.098 |
| Retinopathy, n (%) | 95 (5.8%) | 155 (8.7%) | 16 (3.5%) | +0.112 | +0.219 | +0.111 |
| Nephropathy, n (%) | 416 (25.5%) | 614 (34.5%) | 86 (18.8%) | +0.198 | +0.362 | +0.162 |
| Severe hypoglycemia, n (%) | 33 (2.0%) | 34 (1.9%) | <11 | +0.008 | +0.067 | +0.075 |
| Heart failure, n (%) | 156 (9.6%) | 344 (19.3%) | 31 (6.8%) | +0.281 | +0.380 | +0.102 |
| Cerebrovascular disease, n (%) | 99 (6.1%) | 175 (9.8%) | 29 (6.3%) | +0.140 | +0.129 | +0.011 |
| Dementia, n (%) | 20 (1.2%) | 42 (2.4%) | <11 | +0.086 | +0.118 | +0.035 |
| Ischemic heart disease, n (%) | 317 (19.4%) | 541 (30.4%) | 60 (13.1%) | +0.256 | +0.429 | +0.172 |
Duration of basal insulin therapy = time (months) from the first to last basal insulin prescription order prior to index. Number of basal insulin prescription orders = unique number of prescription orders for any basal insulin type prior to index. These variables were used only as descriptive analysis and not included in propensity matching.
Table 2.
Baseline characteristics of the matched cohorts after propensity-score matching. Demographic and clinical characteristics of the anchor and comparator cohorts in each of the three matched comparisons after 1:1 propensity-score matching, with standardized mean differences demonstrating covariate balance.
Table 2.
Baseline characteristics of the matched cohorts after propensity-score matching. Demographic and clinical characteristics of the anchor and comparator cohorts in each of the three matched comparisons after 1:1 propensity-score matching, with standardized mean differences demonstrating covariate balance.
| Semaglutide vs SGLT2-i | Tirzepatide vs SGLT2-i | Tirzepatide vs Semaglutide | |||||||
|---|---|---|---|---|---|---|---|---|---|
| Characteristic | Semaglutide (n=1,029) | SGLT2-i (n=1,029) | SMD | Tirzepatide (n=254) | SGLT2-i (n=254) | SMD | Tirzepatide (n=272) | Semaglutide (n=272) | SMD |
| Age, y, mean (SD) | 63.0 (12.6) | 63.0 (13.0) | -0.000 | 60.7 (11.7) | 59.2 (14.0) | +0.120 | 59.1 (12.4) | 58.9 (13.4) | +0.018 |
| HbA1c, %, mean (SD) | 8.9 (2.1) | 8.8 (2.0) | +0.010 | 9.1 (2.1) | 9.2 (2.3) | -0.048 | 9.0 (2.0) | 9.1 (2.3) | -0.043 |
| eGFR, mL/min/1.73m², mean (SD) | 74.8 (26.5) | 74.0 (26.2) | +0.028 | 77.4 (27.5) | 78.0 (25.4) | -0.025 | 80.1 (26.4) | 79.0 (27.0) | +0.040 |
| BMI, kg/m², mean (SD) | 32.5 (4.6) | 32.6 (4.7) | -0.033 | 32.6 (4.6) | 32.7 (4.6) | -0.024 | 33.3 (4.5) | 33.1 (4.4) | +0.030 |
| Basal insulin, units/day, median [Q1, Q3] | 27 [16,41] | 26 [16,40] | +0.025 | 24 [15,36] | 23 [15,35] | +0.081 | 25 [17,37] | 26 [15,38] | -0.053 |
| Charlson comorbidity index, mean (SD) | 3.0 (2.0) | 3.0 (2.0) | +0.021 | 2.9 (2.1) | 3.0 (2.2) | -0.048 | 2.5 (1.9) | 2.6 (1.9) | -0.049 |
| Encounters, prior year, median [Q1, Q3] | 20 [11,33] | 20 [11,32] | +0.039 | 17 [9,31] | 17 [10,32] | -0.005 | 16 [9,29] | 19 [11,32] | -0.161 |
| Female sex, n (%) | 457 (44.4%) | 479 (46.6%) | +0.043 | 116 (45.7%) | 97 (38.2%) | +0.152 | 137 (50.4%) | 128 (47.1%) | +0.066 |
| Race, n (%) | +0.103 | +0.046 | +0.116 | ||||||
| White | 722 (70.2%) | 699 (67.9%) | 160 (63.0%) | 157 (61.8%) | 191 (70.2%) | 181 (66.5%) | |||
| Black | 221 (21.5%) | 239 (23.2%) | 70 (27.6%) | 72 (28.3%) | 53 (19.5%) | 58 (21.3%) | |||
| Asian | 19 (1.8%) | 28 (2.7%) | <11 | <11 | <11 | 12 (4.4%) | |||
| Other | <11 | <11 | <11 | <11 | <11 | <11 | |||
| Unknown | 43 (4.2%) | 41 (4.0%) | 16 (6.3%) | 16 (6.3%) | 16 (5.9%) | 19 (7.0%) | |||
| Ethnicity, n (%) | +0.044 | +0.105 | +0.067 | ||||||
| Hispanic or latino | 59 (5.7%) | 51 (5.0%) | 20 (7.9%) | 15 (5.9%) | 16 (5.9%) | 12 (4.4%) | |||
| Not hispanic or latino | 881 (85.6%) | 880 (85.5%) | 210 (82.7%) | 209 (82.3%) | 219 (80.5%) | 223 (82.0%) | |||
| Unknown | 89 (8.6%) | 98 (9.5%) | 24 (9.4%) | 30 (11.8%) | 37 (13.6%) | 37 (13.6%) | |||
| Smoking status, n (%) | +0.037 | +0.158 | +0.123 | ||||||
| Current | 80 (7.8%) | 78 (7.6%) | 19 (7.5%) | 26 (10.2%) | 20 (7.4%) | 19 (7.0%) | |||
| Former | <11 | <11 | <11 | <11 | <11 | <11 | |||
| Unknown | 947 (92.0%) | 947 (92.0%) | 233 (91.7%) | 228 (89.8%) | 250 (91.9%) | 253 (93.0%) | |||
| Index year, n (%) | +0.000 | +0.000 | +0.000 | ||||||
| 2022 | 337 (32.8%) | 337 (32.8%) | 30 (11.8%) | 30 (11.8%) | 34 (12.5%) | 34 (12.5%) | |||
| 2023 | 377 (36.6%) | 377 (36.6%) | 81 (31.9%) | 81 (31.9%) | 95 (34.9%) | 95 (34.9%) | |||
| 2024 | 217 (21.1%) | 217 (21.1%) | 80 (31.5%) | 80 (31.5%) | 77 (28.3%) | 77 (28.3%) | |||
| 2025 | 98 (9.5%) | 98 (9.5%) | 63 (24.8%) | 63 (24.8%) | 66 (24.3%) | 66 (24.3%) | |||
| Basal insulin type, n (%) | +0.064 | +0.186 | +0.058 | ||||||
| Degludec | 100 (9.7%) | 103 (10.0%) | 29 (11.4%) | 17 (6.7%) | 29 (10.7%) | 28 (10.3%) | |||
| Detemir | 101 (9.8%) | 119 (11.6%) | 15 (5.9%) | 12 (4.7%) | 15 (5.5%) | 12 (4.4%) | |||
| Glargine | 778 (75.6%) | 753 (73.2%) | 200 (78.7%) | 217 (85.4%) | 217 (79.8%) | 222 (81.6%) | |||
| Nph | 50 (4.9%) | 54 (5.2%) | <11 | <11 | 11 (4.0%) | <11 | |||
| Metformin, n (%) | 542 (52.7%) | 531 (51.6%) | +0.021 | 135 (53.1%) | 151 (59.4%) | +0.127 | 146 (53.7%) | 140 (51.5%) | +0.044 |
| Sulfonylurea, n (%) | 245 (23.8%) | 255 (24.8%) | +0.023 | 43 (16.9%) | 41 (16.1%) | +0.021 | 46 (16.9%) | 46 (16.9%) | +0.000 |
| Thiazolidinedione, n (%) | 39 (3.8%) | 41 (4.0%) | +0.010 | 12 (4.7%) | 14 (5.5%) | +0.036 | <11 | <11 | +0.063 |
| DPP-4 inhibitor, n (%) | 102 (9.9%) | 109 (10.6%) | +0.022 | 21 (8.3%) | 20 (7.9%) | +0.014 | 24 (8.8%) | 22 (8.1%) | +0.026 |
| Neuropathy, n (%) | 278 (27.0%) | 296 (28.8%) | +0.039 | 57 (22.4%) | 60 (23.6%) | +0.028 | 55 (20.2%) | 62 (22.8%) | +0.063 |
| Retinopathy, n (%) | 57 (5.5%) | 79 (7.7%) | +0.086 | 12 (4.7%) | 11 (4.3%) | +0.019 | 12 (4.4%) | 15 (5.5%) | +0.051 |
| Nephropathy, n (%) | 290 (28.2%) | 285 (27.7%) | +0.011 | 58 (22.8%) | 45 (17.7%) | +0.128 | 58 (21.3%) | 48 (17.6%) | +0.093 |
| Severe hypoglycemia, n (%) | <11 | 21 (2.0%) | +0.088 | <11 | <11 | +0.030 | <11 | <11 | +0.098 |
| Heart failure, n (%) | 102 (9.9%) | 86 (8.4%) | +0.054 | 23 (9.1%) | 21 (8.3%) | +0.028 | 17 (6.2%) | 18 (6.6%) | +0.015 |
| Cerebrovascular disease, n (%) | 74 (7.2%) | 69 (6.7%) | +0.019 | 17 (6.7%) | 15 (5.9%) | +0.032 | 15 (5.5%) | 21 (7.7%) | +0.089 |
| Dementia, n (%) | 18 (1.7%) | 16 (1.6%) | +0.015 | <11 | <11 | +0.000 | <11 | <11 | +0.000 |
| Ischemic heart disease, n (%) | 215 (20.9%) | 205 (19.9%) | +0.024 | 38 (15.0%) | 43 (16.9%) | +0.054 | 34 (12.5%) | 34 (12.5%) | +0.000 |
Table 3.
Time-to-event summary of insulin discontinuation and ≥20% deintensification over 24 months. Twenty-four-month cumulative incidence (CIF), subdistribution hazard ratio (sHR) with 95% CI from a Fine-Gray model, and Gray's-test P value, with death as a competing risk. Anchor and comparator refer to the first and second therapy named in each comparison. Read with Figure 2.
Table 3.
Time-to-event summary of insulin discontinuation and ≥20% deintensification over 24 months. Twenty-four-month cumulative incidence (CIF), subdistribution hazard ratio (sHR) with 95% CI from a Fine-Gray model, and Gray's-test P value, with death as a competing risk. Anchor and comparator refer to the first and second therapy named in each comparison. Read with Figure 2.
| Endpoint / Comparison | N pairs | CIF anchor (%) | CIF comp. (%) | sHR (95% CI) | Gray P |
|---|---|---|---|---|---|
| Insulin discontinuation | |||||
| Semaglutide vs SGLT2-i | 1,029 | 27.8 | 22.2 | 1.26 (1.05–1.52) | 0.013 |
| Tirzepatide vs SGLT2-i | 254 | 38.4 | 31.5 | 1.22 (0.86–1.71) | 0.263 |
| Tirzepatide vs Semaglutide | 272 | 38.0 | 28.5 | 1.35 (0.97–1.89) | 0.080 |
| Deintensification (≥20% basal-dose reduction) | |||||
| Semaglutide vs SGLT2-i | 1,029 | 52.1 | 47.8 | 1.15 (1.00–1.31) | 0.045 |
| Tirzepatide vs SGLT2-i | 254 | 60.6 | 51.1 | 1.40 (1.07–1.83) | 0.015 |
| Tirzepatide vs Semaglutide | 272 | 63.2 | 55.0 | 1.29 (1.01–1.66) | 0.045 |
Table 4.
HbA1c trajectory by matched comparison over 24 months. Mean HbA1c at each 6-month landmark, expressed as the raw value (%) and as the absolute change from baseline (percentage points), for the anchor and comparator cohort of each comparison. Read with Figure 4.
Table 4.
HbA1c trajectory by matched comparison over 24 months. Mean HbA1c at each 6-month landmark, expressed as the raw value (%) and as the absolute change from baseline (percentage points), for the anchor and comparator cohort of each comparison. Read with Figure 4.
| Cohort | Metric | 0 mo | 6 mo | 12 mo | 18 mo | 24 mo |
|---|---|---|---|---|---|---|
| Semaglutide vs SGLT2-i | ||||||
| Semaglutide | Raw HbA1c (%) | 8.86 | 7.61 | 7.50 | 7.54 | 7.63 |
| Δ from baseline (pp) | 0.00 | −1.16 | −1.18 | −1.16 | −1.13 | |
| SGLT2-i | Raw HbA1c (%) | 8.82 | 7.85 | 7.78 | 7.80 | 7.80 |
| Δ from baseline (pp) | 0.00 | −0.92 | −1.04 | −1.11 | −1.19 | |
| Tirzepatide vs SGLT2-i | ||||||
| Tirzepatide | Raw HbA1c (%) | 9.07 | 7.15 | 7.14 | 7.13 | 7.07 |
| Δ from baseline (pp) | 0.00 | −1.79 | −1.67 | −1.61 | −1.74 | |
| SGLT2-i | Raw HbA1c (%) | 9.18 | 7.60 | 7.87 | 7.79 | 7.79 |
| Δ from baseline (pp) | 0.00 | −1.44 | −1.17 | −0.99 | −1.38 | |
| Tirzepatide vs Semaglutide | ||||||
| Tirzepatide | Raw HbA1c (%) | 9.03 | 7.04 | 7.04 | 7.13 | 7.09 |
| Δ from baseline (pp) | 0.00 | −1.85 | −1.80 | −1.63 | −1.81 | |
| Semaglutide | Raw HbA1c (%) | 9.16 | 7.85 | 7.59 | 7.66 | 7.65 |
| Δ from baseline (pp) | 0.00 | −1.30 | −1.38 | −1.15 | −0.96 | |
Disclaimer/Publisher’s Note: The statements, opinions and data contained in all publications are solely those of the individual author(s) and contributor(s) and not of MDPI and/or the editor(s). MDPI and/or the editor(s) disclaim responsibility for any injury to people or property resulting from any ideas, methods, instructions or products referred to in the content. |
© 2026 by the authors. Licensee MDPI, Basel, Switzerland. This article is an open access article distributed under the terms and conditions of the Creative Commons Attribution (CC BY) license (http://creativecommons.org/licenses/by/4.0/).
Copyright: This open access article is published under a Creative Commons CC BY 4.0 license, which permit the free download, distribution, and reuse, provided that the author and preprint are cited in any reuse.